[go: up one dir, main page]

Next Issue
Volume 11, December
Previous Issue
Volume 11, October


Cancers, Volume 11, Issue 11 (November 2019) – 202 articles

Cover Story (view full-size image): 
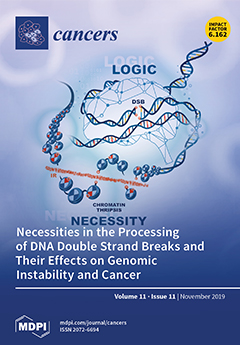
Four mechanistically distinct repair pathways process DNA double-strand breaks induced in the genome by ionizing radiation. They operate on different mechanistic principles and with widely different fidelity, allowing sequence alterations and translocation formation. It remains largely unknown what principles determine their engagement in the processing of a given break, as this is associated with widely different consequences on genome stability. We propose that cells apply logic and explore processing by the pathway with the highest fidelity among those that are available. However, cells also adapt quickly and engage lower-fidelity repair pathways to accommodate necessities generated when the form of chromatin breakage compromises higher-fidelity pathways. In this model, there is no free choice in the selection of a processing pathway. View this paper
  • Issues are regarded as officially published after their release is announced to the table of contents alert mailing list.
  • You may sign up for e-mail alerts to receive table of contents of newly released issues.
  • PDF is the official format for papers published in both, html and pdf forms. To view the papers in pdf format, click on the "PDF Full-text" link, and use the free Adobe Reader to open them.
Order results
Result details
Section
Select all
Export citation of selected articles as:
18 pages, 4933 KiB  
Review
Endometrial Cancer Stem Cells: Role, Characterization and Therapeutic Implications
by Gaia Giannone, Laura Attademo, Giulia Scotto, Sofia Genta, Eleonora Ghisoni, Valentina Tuninetti, Massimo Aglietta, Sandro Pignata and Giorgio Valabrega
Cancers 2019, 11(11), 1820; https://doi.org/10.3390/cancers11111820 - 19 Nov 2019
Cited by 63 | Viewed by 5396
Abstract
Endometrial cancer (EC) is the most frequent gynecological cancer. In patients with relapsed and advanced disease, prognosis is still dismal and development of resistance is common. In this context, endometrial Cancer Stem Cells (eCSC), stem-like cells capable to self-renewal and differentiation in mature [...] Read more.
Endometrial cancer (EC) is the most frequent gynecological cancer. In patients with relapsed and advanced disease, prognosis is still dismal and development of resistance is common. In this context, endometrial Cancer Stem Cells (eCSC), stem-like cells capable to self-renewal and differentiation in mature cancer cells, represent a potential field of expansion for drug development. The aim of this review is to characterize the role of eCSC in EC, their features and how they could be targeted. CSC are involved in progression, invasiveness and metastasis (though epithelial to mesenchimal transition, EMT), as well as chemoresistance in EC. Nevertheless, isolation of eCSC is still controversial. Indeed, CD133, Aldheyde dehydrogenase (ALDH), CD117, CD55 and CD44 are enriched in CSCs but there is no universal marker nowadays. The most frequently activated pathways in eCSC are Wingless-INT (Wnt)/β-catenin, Notch1, and Hedghog, with a high expression of self-renewal transcription factors like Octamer binding transcription factor 4 (OCT), B Lymphoma Mo-MLV Insertion Region 1 Homolog (BMI1), North American Network Operations Group Homebox protein (NANOG), and SRY-Box 2 (SOX2). These pathways have been targeted with selective drugs alone or in combination with chemotherapy and immunotherapy. Unfortunately, although preclinical results are encouraging, few clinical data are available. Full article
(This article belongs to the Special Issue Cancer Stem Cells and Personalized Medicine for Gynecologic Cancers)
Show Figures

Figure 1

Figure 1
<p>Activated pathways in Endometrial Cancer Stem Cells (CSCs) and their inhibitors.</p>
Full article ">
17 pages, 304 KiB  
Review
Reactivation of Hepatitis B Virus in Patients with Multiple Myeloma
by Yutaka Tsukune, Makoto Sasaki and Norio Komatsu
Cancers 2019, 11(11), 1819; https://doi.org/10.3390/cancers11111819 - 19 Nov 2019
Cited by 6 | Viewed by 3890
Abstract
Reactivation of hepatitis B virus (HBV) is a well-known complication in patients with hematological malignancies during or after cytotoxic chemotherapy. If the initiation of antiviral therapy is delayed in patients with HBV reactivation, these patients can develop severe hepatitis and may die of [...] Read more.
Reactivation of hepatitis B virus (HBV) is a well-known complication in patients with hematological malignancies during or after cytotoxic chemotherapy. If the initiation of antiviral therapy is delayed in patients with HBV reactivation, these patients can develop severe hepatitis and may die of fulminant hepatitis. The preventive strategy for HBV reactivation in patients with malignant lymphoma has already been established based on some prospective studies. As there was an increased number of novel agents being approved for the treatment of multiple myeloma (MM), the number of reported cases of HBV reactivation among MM patients has gradually increased. We conducted a Japanese nationwide retrospective study and revealed that HBV reactivation in MM patients is not rare and that autologous stem cell transplantation is a significant risk factor. In this study, around 20% of all patients with HBV reactivation developed HBV reactivation after 2 years from the initiation of therapy, unlike malignant lymphoma. This might be due to the fact that almost all of the patients received chemotherapy for a long duration. Therefore, a new strategy for the prevention of HBV reactivation in MM patients is required. Full article
(This article belongs to the Special Issue Latest Development in Multiple Myeloma)
19 pages, 3365 KiB  
Article
WWOX Possesses N-Terminal Cell Surface-Exposed Epitopes WWOX7-21 and WWOX7-11 for Signaling Cancer Growth Suppression and Prevention In Vivo
by Wan-Jen Wang, Pei-Chuan Ho, Ganesan Nagarajan, Yu-An Chen, Hsiang-Ling Kuo, Dudekula Subhan, Wan-Pei Su, Jean-Yun Chang, Chen-Yu Lu, Katarina T. Chang, Sing-Ru Lin, Ming-Hui Lee and Nan-Shan Chang
Cancers 2019, 11(11), 1818; https://doi.org/10.3390/cancers11111818 - 19 Nov 2019
Cited by 10 | Viewed by 3723
Abstract
Membrane hyaluronidase Hyal-2 supports cancer cell growth. Inhibition of Hyal-2 by specific antibody against Hyal-2 or pY216-Hyal-2 leads to cancer growth suppression and prevention in vivo. By immunoelectron microscopy, tumor suppressor WWOX is shown to be anchored, in part, in the cell membrane [...] Read more.
Membrane hyaluronidase Hyal-2 supports cancer cell growth. Inhibition of Hyal-2 by specific antibody against Hyal-2 or pY216-Hyal-2 leads to cancer growth suppression and prevention in vivo. By immunoelectron microscopy, tumor suppressor WWOX is shown to be anchored, in part, in the cell membrane by Hyal-2. Alternatively, WWOX undergoes self-polymerization and localizes in the cell membrane. Proapoptotic pY33-WWOX binds Hyal-2, and TGF-β induces internalization of the pY33-WWOX/Hyal-2 complex to the nucleus for causing cell death. In contrast, when pY33 is downregulated and pS14 upregulated in WWOX, pS14-WWOX supports cancer growth in vivo. Here, we investigated whether membrane WWOX receives extracellular signals via surface-exposed epitopes, especially at the S14 area, that signals for cancer growth suppression and prevention. By using a simulated 3-dimentional structure and generated specific antibodies, WWOX epitopes were determined at amino acid #7 to 21 and #286 to 299. Synthetic WWOX7-21 peptide, or truncation to 5-amino acid WWOX7-11, significantly suppressed and prevented the growth and metastasis of melanoma and skin cancer cells in mice. Time-lapse microscopy revealed that WWOX7-21 peptide potently enhanced the explosion and death of 4T1 breast cancer stem cell spheres by ceritinib. This is due to rapid upregulation of proapoptotic pY33-WWOX, downregulation of prosurvival pERK, prompt increases in Ca2+ influx, and disruption of the IkBα/WWOX/ERK prosurvival signaling. In contrast, pS14-WWOX7-21 peptide dramatically increased cancer growth in vivo and protected cancer cells from ceritinib-mediated apoptosis in vitro, due to a prolonged ERK phosphorylation. Further, specific antibody against pS14-WWOX significantly enhanced the ceritinib-induced apoptosis. Together, the N-terminal epitopes WWOX7-21 and WWOX7-11 are potent in blocking cancer growth in vivo. WWOX7-21 and WWOX7-11 peptides and pS14-WWOX antibody are of therapeutic values in suppressing and preventing cancer growth in vivo. Full article
Show Figures

Figure 1

Figure 1
<p>WWOX7-21 and WWOX7-11 peptides suppressed cancer growth in vivo. (<b>A</b>) A schematic primary structure of the first WW domain of WWOX is shown. (<b>B</b>,<b>C</b>) BALB/c mice were inoculated with B16F10 melanoma cells in the left and right flanks (red and blue lines of growth curves). A week after, mice received indicated peptides (1 mM in 100 µL PBS) via tail vein injections. WWOX7-21, WWOX7-11 and WWOX286-299 blocked B16F10 growth. pS14-WWOX7-21 was ineffective. (<b>D</b>) The end-point tumor volumes are shown (<span class="html-italic">n</span> = 6; mean ± SD).</p>
Full article ">Figure 2
<p>WWOX7-11 peptide is most potent in suppressing cancer growth in vivo (<b>A</b>) Each NOD-SCID mouse received an indicated peptide via subcutaneous injection in one side of the flanks, and B16F10 cells inoculated simultaneously in the other side. WWOX7-11 blocked B16F10 growth (<span class="html-italic">n</span> = 3; mean ± SD). (<b>B</b>,<b>C</b>) Scrambled peptides of WWOX7-11 (AGLDD) did not block melanoma growth in nude mice (<span class="html-italic">n</span> = 4; mean ± SD). The tumor growth curves and the end-point tumor sizes are shown. (<b>D</b>) BALB/c mice received tail vein injections of WWOX7-21 once per week for 3 consecutive weeks, followed by inoculating cancer cells in both flanks. The growth of B16F10 cancer cells was blocked (representative data from 2 experiments). (<b>E</b>) Zfra4-10 and WWOX7-11 peptides were resuspended in sterile Milli-Q water (400 µM), and allowed to sit for 3 h in the room temperature. Partial self-polymerization of the peptides is shown. (<b>F</b>) Under similar conditions, Zfra4-10 and Zfra1-15(S8G) were resuspended in PBS and incubated at room temperature for 3 h. Zfra4-10 underwent polymerization, and the S8G mutant failed to polymerize.</p>
Full article ">Figure 3
<p>WWOX7-21 peptide suppresses melanoma metastasis, whereas pS14-WWOX7-21 peptide induces cytotoxic T cell expansion and fails to block cancer metastasis in vivo. (<b>A</b>) BALB/c mice received subcutaneous injections of WWOX7-21 peptide and became resistant to the metastasis of melanoma B16F10 cells to the lung and liver. Other peptides were ineffective. (<b>B,C</b>) pS14-WWOX7-21 peptide significantly induced the expansion of CD4<sup>+</sup> and CD8α<sup>+</sup> T and CD19<sup>+</sup> B cells in the germinal centers, but had no effect on Foxp3<sup>+</sup> Treg cells in BALB/c mice. Scale bar = 50 µm.</p>
Full article ">Figure 4
<p>WWOX7-21 and WWOX286-299 peptides colocalize with cell membrane type II TGFβ receptor (TβRII). (<b>A</b>) WWOX-negative MDA-MB-231 cells were incubated with WWOX7-21 or WWOX286-299 peptide at 4 °C for 30 min, followed by processing immunostaining using our generated peptide antibodies. These peptides were shown to colocalize with membrane TβRII. Cells were not permeabilized with Triton X-100. In the negative controls, no primary antibodies were used. (<b>B</b>) In control experiments, cells were stained for ERK1/2 to show its nuclear localization in Triton X-100-permeabilized cells. No signal was shown in non-permeabilized cells. (<b>C</b>) Colocalization of TβRII with WWOX7-21 and WWOX286-299 is shown in MDA-MB-231 cells, as determined by confocal microscopy. (Magnification 400×). (<b>D</b>) <span class="html-italic">Wwox</span><sup>+/+</sup> wild type MEF cells were pretreated with WWOX286-299 peptide for 5 min at 37 °C, followed by treating with TGF-β1 (10 ng/mL) for indicated times. The WWOX286-299 peptide colocalized with TβRII, and TGF-β1 appeared to induce internalization of the peptide/TβRII complex.</p>
Full article ">Figure 5
<p>pS14-WWOX7-21 peptide blocked ceritinib-mediated 4T1 stem cell sphere explosion and death. (<b>A</b>,<b>B</b>) 4T1 stem cell spheres were treated with an indicated antiserum (1/100 dilution) for 30 min, and then exposed to ceritinib (30 µM) for time-lapse fluorescent microscopy at 37 °C. DAPI uptake in the nuclei (blue) by live cells indicates an increased nuclear membrane permeability, and PI uptake by nuclei (red) indicates cell death (mean ± SD; <span class="html-italic">n</span> = 3; SD in black shaded areas). The red stars show the initiation of stem cell sphere explosion and death. Representative changes in sphere morphology with time are shown. (<b>C</b>,<b>D</b>) pS14-WWOX7-21 peptide strongly blocked ceritinib-mediated cell death and sphere explosion; however, WWOX7-21 peptide drastically enhanced the cell death and sphere explosion event. (<b>E</b>) The time of initiation of 4T1 cell sphere explosion is shown (<span class="html-italic">n</span> = 3). (<b>F</b>) Summary of enhancers and inhibitors for ceritinib-mediated cell death.</p>
Full article ">Figure 6
<p>Ceritinib induces 4T1 cell apoptosis by inducing calcium influx and upregulating pY33-WWOX. (<b>A</b>–<b>C</b>) 4T1 cells were treated with an indicated concentration of ceritinib for 24 h at 37 ℃ and were subjected to MTT assay for cell viability (<span class="html-italic">n</span> = 3, * <span class="html-italic">p</span> &lt; 0.05; **** <span class="html-italic">p</span> &lt; 0.0001) (<b>A</b>), and apoptosis by DNA fragmentation analysis, where staurosporine (St) treatment is regarded as a positive control (<b>B</b>), and cell cycle analysis (<b>C</b>). Note that ceritinib induced apoptosis by increasing the percentages of SubG1 phase (<span class="html-italic">n</span> = 3, ** <span class="html-italic">p</span> &lt; 0.01; *** <span class="html-italic">p</span> &lt; 0.001). (<b>D</b>–<b>F</b>) When 4T1 cells were treated with ceritinib for indicated times at 37 °C, decreased S14 phosphorylation but increased Y33 phosphorylation in WWOX was observed. Quantification of protein expression was normalized to β-actin, and then normalized to the control. (<span class="html-italic">n</span> = 3, * <span class="html-italic">p</span> &lt; 0.05; ** <span class="html-italic">p</span> &lt; 0.01). (<b>G</b>,<b>H</b>) Ceritinib rapidly induced Ca<sup>2+</sup> influx (green fluorescent Fluo-8) and simultaneous DAPI uptake (blue fluorescence) in 4T1 cells in 20 min prior to cell death (PI uptake; red fluorescence). Exposure of 4T1 cells to EGTA for 10 min prior to treating with ceritinib resulted in retarded cell death and abolished Ca<sup>2+</sup> influx, whereas DAPI uptake was enhanced.</p>
Full article ">Figure 7
<p>WWOX peptides counteract the ceritinib-mediated apoptosis via regulating ERK phosphorylation and IkBα/WWOX/ERK signaling. (<b>A</b>,<b>B</b>) Ceritinib rapidly suppressed the phosphorylation of ERK1/2 in 4T1 cells. A time-related nuclear accumulation of ERK2 is shown. Similar results were observed for ERK1/2 using specific antibodies. (<b>C</b>) Compared to WWOX7-21 peptide, pS14-WWOX7-21 peptide sustained phosphorylation of ERK and JNK in 4T1 cells. (<b>D</b>) 4T1 cells were treated with an indicated peptide (30 μM) for 30 min, and then exposed to ceritinib (30 μM) for 60 min, prior to processing cytosolic and nuclear fractionation and Western blotting. (<b>E</b>) 4T1 cells were cotreated with ceritinib (30 μM) and an indicated chemical for time-lapse microscopy. p53 inhibitor pifithin-μ and -α (50 μM) retarded the ceritinib-mediated sphere explosion and apoptosis. p53 activator quinacrine (50 µM) accelerated ceritinib-mediated apoptosis. (<b>F</b>) Phosphatase inhibitors (10 μL) enhanced ceritinib-mediated sphere explosion and apoptosis, whereas protease inhibitor leuhistin (30 μM) marginally retarded the effect of ceritinib (<span class="html-italic">n</span> = 3, ** <span class="html-italic">p</span> &lt; 0.05; * <span class="html-italic">p</span> &lt; 0.1). (<b>G</b>,<b>H</b>) COS7 cells were transiently transfected with ECFP-IkBα, EGFP-ERK and DsRed-WWOX cDNA expression constructs. By thee protein/protein time-lapse FRET microscopy, ceritinib induced the signaling from IkBα to ERK and then to WWOX via energy transfer. In controls, no signaling is observed for ECFP, EGFP and DsRed. (<b>I</b>) A schematic graph for ceritinib signaling is shown, namely upregulation of pY33-WWOX, downregulation of p-ERK, dissociation of the IkBα/WWOX/ERK complex, and nuclear translocation of pY33-WWOX to cause apoptosis. Additionally, ceritinib induces cancer stem cell sphere explosion and death. Ceritinib-mediated apoptosis of single cells is switched to bubbling cell death at room temperature.</p>
Full article ">
17 pages, 1175 KiB  
Review
Biological Functions of the ING Proteins
by Arthur Dantas, Buthaina Al Shueili, Yang Yang, Arash Nabbi, Dieter Fink and Karl Riabowol
Cancers 2019, 11(11), 1817; https://doi.org/10.3390/cancers11111817 - 19 Nov 2019
Cited by 29 | Viewed by 4416
Abstract
The proteins belonging to the inhibitor of growth (ING) family of proteins serve as epigenetic readers of the H3K4Me3 histone mark of active gene transcription and target histone acetyltransferase (HAT) or histone deacetylase (HDAC) protein complexes, in order to alter local chromatin structure. [...] Read more.
The proteins belonging to the inhibitor of growth (ING) family of proteins serve as epigenetic readers of the H3K4Me3 histone mark of active gene transcription and target histone acetyltransferase (HAT) or histone deacetylase (HDAC) protein complexes, in order to alter local chromatin structure. These multidomain adaptor proteins interact with numerous other proteins to facilitate their localization and the regulation of numerous biochemical pathways that impinge upon biological functions. Knockout of some of the ING genes in murine models by various groups has verified their status as tumor suppressors, with ING1 knockout resulting in the formation of large clear-cell B-lymphomas and ING2 knockout increasing the frequency of ameloblastomas, among other phenotypic effects. ING4 knockout strongly affects innate immunity and angiogenesis, and INGs1, ING2, and ING4 have been reported to affect apoptosis in different cellular models. Although ING3 and ING5 knockouts have yet to be published, preliminary reports indicate that ING3 knockout results in embryonic lethality and that ING5 knockout may have postpartum effects on stem cell maintenance. In this review, we compile the known information on the domains of the INGs and the effects of altering ING protein expression, to better understand the functions of this adaptor protein family and its possible uses for targeted cancer therapy. Full article
(This article belongs to the Special Issue Inhibitor of Growth (ING) Genes)
Show Figures

Figure 1

Figure 1
<p>Domains of ING protein isoforms. ING proteins are well conserved throughout evolution. The plant homeodomain (PHD) allows these proteins to bind to the H3K4me3 histone mark and is present in all INGs. The lamin interacting domain (LID) is important so they can interact with lamin A and, at least for ING1, maintain nuclear morphology. Located within the nuclear localization sequence (NLS) that promotes translocation of the ING proteins to the nucleus by binding the karyopherin proteins are small, basic nucleolar targeting sequences (NTS). These direct ING1 to the nucleoli under conditions of stress, which promotes apoptosis. The NLS can also bind the p53 tumor suppressor. Proliferating cell nuclear antigen protein (PCNA) has been shown to bind specifically to ING1b via the PCNA-interacting protein (PIP) motif, and this interaction is also important for promoting apoptosis in response DNA-damage-induced stress. The polybasic region (PBR) is present only in ING1 and ING2. This motif can interact with both bioactive signaling phospholipids (PIs) and ubiquitin (Ub), the latter of which might serve to stabilize multi-monoubiquitination p53. The function of the partial bromodomain (PBD) has not been defined, but like the leucine zipper-like (LZL) region, may promote ING protein multimerization and/or interaction with other members of the HAT and HDAC complexes that ING proteins target to the H3K4Me3 histone mark.</p>
Full article ">Figure 2
<p>Schematic figure showing the major phenotypes involved in the knockout animals for all the Ing proteins. Even though Ing proteins are relatively similar, their knockout phenotypes varied widely according to the protein deleted. ING1 knockout mice presented with reduced body sized, enlarged spleens and multiple B cells lymphomas. ING2 defective animals had deficient spermatogenesis. ING3 is the only Ing protein that was embryonically lethal, possibly because it is the most primordial of the family. ING4 mice were hypersensitive to LPS injection and presented problems with innate immunity. Lastly, there are still no knockouts for ING5, but based on the recent studies made in vitro that implicate ING5 in different stem cells processes, we expect to encounter some type of stem cell defect in these animals, possibly presenting as early age stem cell depletion or organogenesis defects.</p>
Full article ">
22 pages, 3112 KiB  
Article
Repeated Fractions of X-Radiation to the Breast Fat Pads of Mice Augment Activation of the Autotaxin-Lysophosphatidate-Inflammatory Cycle
by Guanmin Meng, Melinda Wuest, Xiaoyun Tang, Jennifer Dufour, YuanYuan Zhao, Jonathan M. Curtis, Todd P. W. McMullen, David Murray, Frank Wuest and David N. Brindley
Cancers 2019, 11(11), 1816; https://doi.org/10.3390/cancers11111816 - 19 Nov 2019
Cited by 15 | Viewed by 3039
Abstract
Breast cancer patients are usually treated with multiple fractions of radiotherapy (RT) to the whole breast after lumpectomy. We hypothesized that repeated fractions of RT would progressively activate the autotaxin–lysophosphatidate-inflammatory cycle. To test this, a normal breast fat pad and a fat pad [...] Read more.
Breast cancer patients are usually treated with multiple fractions of radiotherapy (RT) to the whole breast after lumpectomy. We hypothesized that repeated fractions of RT would progressively activate the autotaxin–lysophosphatidate-inflammatory cycle. To test this, a normal breast fat pad and a fat pad containing a mouse 4T1 tumor were irradiated with X-rays using a small-animal “image-guided” RT platform. A single RT dose of 7.5 Gy and three daily doses of 7.5 Gy increased ATX activity and decreased plasma adiponectin concentrations. The concentrations of IL-6 and TNFα in plasma and of VEGF, G-CSF, CCL11 and CXCL10 in the irradiated fat pad were increased, but only after three fractions of RT. In 4T1 breast tumor-bearing mice, three fractions of 7.5 Gy augmented tumor-induced increases in plasma ATX activity and decreased adiponectin levels in the tumor-associated mammary fat pad. There were also increased expressions of multiple inflammatory mediators in the tumor-associated mammary fat pad and in tumors, which was accompanied by increased infiltration of CD45+ leukocytes into tumor-associated adipose tissue. This work provides novel evidence that increased ATX production is an early response to RT and that repeated fractions of RT activate the autotaxin–lysophosphatidate-inflammatory cycle. This wound healing response to RT-induced damage could decrease the efficacy of further fractions of RT. Full article
(This article belongs to the Special Issue Lysophosphatidic Acid Signalling in Cancer)
Show Figures

Figure 1

Figure 1
<p>Comparing the effects of a single dose and three fractions of radiation therapy (RT) on ATX activity and the secretions of adiponectin and leptin in normal mice. Using the SARRP system, the 2nd left mammary fat pad of Balb/c mice received one fraction of 7.5 Gy (1 × 7.5 Gy), or three consecutive daily fractions of 7.5 Gy (3 × 7.5 Gy) of X-rays, or no irradiation (0 Gy). At 48 h after the completion of RT, the ATX activity in plasma (<b>A</b>) and irradiated fat pad (<b>D</b>); the levels of secreted adiponectin in plasma (<b>B</b>) and irradiated fat pad (<b>E</b>); and plasma leptin levels (<b>C</b>) were measured. Results are from 6–10 mice that were studied in two independent experiments. Results are expressed relative to tissue or plasma from non-irradiated mice as means ± SEMs. * <span class="html-italic">p</span> &lt; 0.05 and ** <span class="html-italic">p</span> &lt; 0.01. The absolute values were similar to those in our previous publication [<a href="#B61-cancers-11-01816" class="html-bibr">61</a>].</p>
Full article ">Figure 2
<p>Three fractions of RT increased the concentrations of cytokines, chemokines and growth factors in plasma and in the irradiated breast adipose tissue of normal mice compared to a single dose of RT. The 2nd left mammary fat pad of Balb/c mice was exposed to single dose of 7.5 Gy of X rays (1 × 7.5 Gy) or three fractions of 7.5 Gy (3 × 7.5 Gy), and the plasma and irradiated fat pad were collected for multiplex cytokine analyses 48 h after the completion of RT. Results of the secretions of cytokines and chemokines in the plasma (<b>A</b>) and irradiated fat pad (<b>B</b>) are expressed relative to tissue or plasma from non-irradiated mice as means ± SEMs from 6–10 mice from two independent experiments. * <span class="html-italic">p</span> &lt; 0.05 and ** <span class="html-italic">p</span> &lt; 0.01. These values were similar to those in our previous publication [<a href="#B61-cancers-11-01816" class="html-bibr">61</a>].</p>
Full article ">Figure 3
<p>One or three fractions of RT enhanced the levels of Nrf2 and GCLC in adipose tissue of normal mice. (<b>A</b>) The 2nd left mammary fat pad of mice was exposed to a single dose of RT (1 × 7.5 Gy) or three fractions of RT (3 × 7.5 Gy). Mammary adipose tissue was collected and the levels of Nrf2 and GCLC were determined by western blot analysis 48 h after the completion of RT. Cultured 4T1 cells were treated with 10 μM tBHQ for 6 h as a positive verification for Nrf2 induction. (<b>B</b>) The protein levels of Nrf2 and GCLC were expressed relative to non-irradiated mice and normalized to glyceraldehyde phosphate dehydrogenase (GAPDH). Results are means ± SEMs from five mice. * <span class="html-italic">p</span> &lt; 0.05 and ** <span class="html-italic">p</span> &lt; 0.01. The complete western blot is shown in <a href="#app1-cancers-11-01816" class="html-app">Supplementary Figure S1</a>.</p>
Full article ">Figure 4
<p>RT-activated Nrf2 and its down-stream targets after 6 h to 24 h in human adipose tissue. (<b>A</b>) Human adipose tissue samples were treated with tBHQ (50 µM), with or without NAC (20 µM), for 3 h, or were exposed to 1 Gy of γ-radiation either with or without a 3 h pretreatment with NAC (20 µM), as indicated. Levels of Nrf2 and HO-1 were determined by western blot analysis at various time points after irradiation (6, 24 and 48 h). The results (right-hand panels) were quantified relative to the non-irradiated control. Results are given as means ± SEMs from four independent experiments. * <span class="html-italic">p</span> &lt; 0.05; ** <span class="html-italic">p</span> &lt; 0.01 versus control; # <span class="html-italic">p</span> &lt; 0.05; ## <span class="html-italic">p</span> &lt; 0.01 versus radiation without NAC. (<b>B</b>) Cultured human adipose tissue was exposed to 1 Gy of γ-radiation and mRNA expression of Nrf2 and of five known Nrf2/ARE-regulated genes were measured after 24 h. Results are expressed as means ± SEMs from five independent experiments. * <span class="html-italic">p</span> &lt; 0.05 and ** <span class="html-italic">p</span> &lt; 0.01 versus control. The complete western blot is shown in <a href="#app1-cancers-11-01816" class="html-app">Supplementary Figure S1</a>.</p>
Full article ">Figure 5
<p>Three fractions of RT reduced tumor growth and augmented the tumor-induced increases in plasma ATX activity for tumor-bearing and normal mice. Both 4T1 tumor-bearing mice and normal mice were either untreated or were irradiated daily with 7.5 Gy of X-rays for three successive days, beginning on day 12 after tumor-cell injection or lack thereof. (<b>A</b>) Mass of tumors excised 48 h after completion of RT. (<b>B</b>) Tumor volumes four days before the start of RT and at 48 h after completing the RT. At 48 h after the completion of RT, the ATX activity in both plasma (<b>C</b>) and the mammary fat pad (<b>D</b>) were measured. Results are expressed as means ± SEMs for six mice/group. * <span class="html-italic">p</span> &lt; 0.05 and ** <span class="html-italic">p</span> &lt; 0.01.</p>
Full article ">Figure 6
<p>The effect of three 7.5 Gy fractions of RT on plasma concentrations of LPA species, S1P and SA1P in tumor-bearing mice and normal mice. Mice with or without breast tumors were either untreated or were treated daily with X-rays for 3 days, and the plasma concentrations of LPA species (<b>A</b>–<b>F</b>), S1P (<b>G</b>) and SA1P (<b>H</b>) were measured 48 h after the completion of RT. Absolute amounts of C16:0-LPA, C18:0-LPA, C18:1-LPA and C20:4-LPA were determined from the calibration curves, while LPA-18:2 LPA-22:6, S1P and SA1P were calculated from the peak areas relative to the isotopically-labelled standards. Results are expressed as means ± SEMs with six mice/group. * <span class="html-italic">p</span> &lt; 0.05 and ** <span class="html-italic">p</span> &lt; 0.01.</p>
Full article ">Figure 7
<p>The effects of three 7.5 Gy fractions of RT on the levels of adiponectin, leptin and various hormones in tumor-bearing and normal mice. At 48 h after completing the RT, the secretions of adiponectin in plasma (<b>A</b>) and irradiated fat pads (<b>B</b>), and plasma leptin concentrations (<b>C</b>), were measured, and the leptin/adiponectin ratio (<b>D</b>) was calculated accordingly. (<b>E</b>) Concentrations of hormones including amylin, insulin, glucagon, ghrelin, PP and GLP-1 were analyzed by mouse metabolic multiplex arrays. Results are expressed as means ± SEMs with six mice/group. * <span class="html-italic">p</span> &lt; 0.05 and ** <span class="html-italic">p</span> &lt; 0.01.</p>
Full article ">Figure 8
<p>The effect of three 7.5 Gy fractions of RT on the concentrations of some cytokines, chemokines and growth factors in tumor-bearing and normal mice. The concentrations of cytokines, chemokines and growth factors in plasma and in adipose tissue were analyzed by mouse cytokine/chemokine multiplex arrays 48 h after the completion of RT. The levels of cytokines and chemokines in the plasma (<b>A</b>) and adipose tissue (<b>B</b>) are expressed as means ± SEMs from six mice/group. * <span class="html-italic">p</span> &lt; 0.05 and ** <span class="html-italic">p</span> &lt; 0.01. (<b>C</b>) The protein levels of Nrf2 and GCLC in mammary adipose tissue were expressed relative to the control from normal (i.e., non-tumor-bearing) mice that were not irradiated. Results are means ± SEMs from six mice/group. * <span class="html-italic">p</span> &lt; 0.05 and ** <span class="html-italic">p</span> &lt; 0.01. The complete western blot is shown in <a href="#app1-cancers-11-01816" class="html-app">Supplementary Figure S1</a>.</p>
Full article ">Figure 9
<p>Three 7.5 Gy fractions of RT elevated the secretions of cytokines and chemokines, and increased the expression of the LPA1 receptor in tumors. (<b>A</b>) The concentrations of cytokines, chemokines and growth factors in the tumor tissue were analyzed by mouse cytokine/chemokine multiplex array 48 h after the completion of RT. (<b>B</b>) The protein levels of COX-2 and LPA<sub>1</sub> receptors were determined by western blot analysis in the tumor tissue and the relative expressions were normalized to the level of GAPDH. Results are expressed as means ± SEMs with six mice/group. * <span class="html-italic">p</span> &lt; 0.05 and ** <span class="html-italic">p</span> &lt; 0.01 versus tumor alone. The complete western blot is shown in <a href="#app1-cancers-11-01816" class="html-app">Supplementary Figure S1</a>.</p>
Full article ">Figure 10
<p>Three 7.5 Gy fractions of RT enhanced the infiltration of inflammatory cells into tumor-associated adipose tissue 48 h after the completion of RT. (<b>A</b>) Representative images of leukocyte/macrophage infiltration indicated by CD45 staining (red arrows) in the mammary fat pad from normal (i.e., non-tumor-bearing) mice or in the mammary fat pad adjacent to a 4T1 breast tumor (tumor-associated). (<b>B</b>) CD45+ leukocytes within tumor tissues from irradiated or non-irradiated mice. The quantifications of CD45 staining are shown in the right-hand panels for six mice. ** <span class="html-italic">p</span> &lt; 0.01. Scale bar = 50 μm.</p>
Full article ">
17 pages, 1351 KiB  
Review
Nucleocytoplasmic Shuttling of STATs. A Target for Intervention?
by Sabrina Ernst and Gerhard Müller-Newen
Cancers 2019, 11(11), 1815; https://doi.org/10.3390/cancers11111815 - 19 Nov 2019
Cited by 10 | Viewed by 4006
Abstract
Signal transducer and activator of transcription (STAT) proteins are transcription factors that in the latent state are located predominantly in the cytoplasm. Activation of STATs through phosphorylation of a single tyrosine residue results in nuclear translocation. The requirement of tyrosine phosphorylation for nuclear [...] Read more.
Signal transducer and activator of transcription (STAT) proteins are transcription factors that in the latent state are located predominantly in the cytoplasm. Activation of STATs through phosphorylation of a single tyrosine residue results in nuclear translocation. The requirement of tyrosine phosphorylation for nuclear accumulation is shared by all STAT family members but mechanisms of nuclear translocation vary between different STATs. These differences offer opportunities for specific intervention. To achieve this, the molecular mechanisms of nucleocytoplasmic shuttling of STATs need to be understood in more detail. In this review we will give an overview on the various aspects of nucleocytoplasmic shuttling of latent and activated STATs with a special focus on STAT3 and STAT5. Potential targets for cancer treatment will be identified and discussed. Full article
(This article belongs to the Special Issue Targeting STAT3 and STAT5 in Cancer)
Show Figures

Figure 1

Figure 1
<p>Structures of STAT proteins with putative nuclear localization signals (NLS) and nuclear export signals (NES) highlighted as listed in <a href="#cancers-11-01815-t001" class="html-table">Table 1</a>. In this context, “putative” means that the corresponding sequences do not fulfill classical NLS or NES functions but are required for nuclear transport or interaction with nuclear transport receptors. (<b>a</b>) General scheme of structural domains of STAT proteins (NTD, N-terminal domain; CCD coiled-coil domain; DBD, DNA-binding domain; LD, linker domain; SD, SH2 domain; TAD, transactivation domain). Numbers refer to amino acid positions. (<b>b</b>–<b>d</b>) Structures of individual STAT proteins as ribbon representations (left) or space-filling representations (middle and right). Domains are stained according to the coloring of the scheme in (<b>a</b>), DNA is shown in pink. Putative NLS and NES are marked in red and cyan, respectively. The corresponding references are listed in <a href="#cancers-11-01815-t001" class="html-table">Table 1</a>. PDB IDs: STAT1, 1BF5; STAT3, 1BG1; STAT5A, 1Y1U. Images of structures were generated with PyMOL.</p>
Full article ">
14 pages, 2799 KiB  
Article
A Novel Calcium-Mediated EMT Pathway Controlled by Lipids: An Opportunity for Prostate Cancer Adjuvant Therapy
by Sandy Figiel, Fanny Bery, Aurélie Chantôme, Delphine Fontaine, Côme Pasqualin, Véronique Maupoil, Isabelle Domingo, Roseline Guibon, Franck Bruyère, Marie Potier-Cartereau, Christophe Vandier, Gaëlle Fromont and Karine Mahéo
Cancers 2019, 11(11), 1814; https://doi.org/10.3390/cancers11111814 - 18 Nov 2019
Cited by 26 | Viewed by 3242
Abstract
The composition of periprostatic adipose tissue (PPAT) has been shown to play a role in prostate cancer (PCa) progression. We recently reported an inverse association between PCa aggressiveness and elevated PPAT linoleic acid (LA) and eicosapentaenoic acid (EPA) content. In the present study, [...] Read more.
The composition of periprostatic adipose tissue (PPAT) has been shown to play a role in prostate cancer (PCa) progression. We recently reported an inverse association between PCa aggressiveness and elevated PPAT linoleic acid (LA) and eicosapentaenoic acid (EPA) content. In the present study, we identified a new signaling pathway with a positive feedback loop between the epithelial-to-mesenchymal transition (EMT) transcription factor Zeb1 and the Ca2+-activated K+ channel SK3, which leads to an amplification of Ca2+ entry and cellular migration. Using in vitro experiments and ex vivo cultures of human PCa slices, we demonstrated that LA and EPA exert anticancer effects, by modulating Ca2+ entry, which was involved in Zeb1 regulation and cancer cellular migration. This functional approach using human prostate tumors highlights the clinical relevance of our observations, and may allow us to consider the possibility of targeting cancer spread by altering the lipid microenvironment. Full article
(This article belongs to the Special Issue Targeting Calcium Signaling in Cancer Cells)
Show Figures

Figure 1

Figure 1
<p>LA and EPA inhibit TGFβ-induced-migration, which is dependent of Zeb1. (<b>A</b>) LA and EPA inhibit TGFβ-induced cellular migration. DU145 cells were treated for 48 h with FA (LA, EPA, AP) (20 µM) and with TGFβ (10 ng/mL) and then used for transwell and wound healing migration assays performed for 24 h (in the presence of TGFβ and/or FA) (<span class="html-italic">N</span> = 3; <span class="html-italic">n</span> = 2). Results are expressed as mean ± SEM. Statistical differences are indicated: * <span class="html-italic">p</span> &lt; 0.05; ** <span class="html-italic">p</span> &lt; 0.01; *** <span class="html-italic">p</span> &lt; 0.001 (Kruskal–Wallis; post-test: Dunn’s test). The scale of the photos is ×200 magnification. (<b>B</b>) Zeb1 is required for promigratory effect of TGFβ. siRNA-transfected cells (siCtrl, siZeb1) were treated for 48 h with TGFβ (10 ng/mL) and then used for transwell migration assay performed for 24 h (in the presence of TGFβ) (<span class="html-italic">N</span> = 3; <span class="html-italic">n</span> = 2). * <span class="html-italic">p</span> &lt; 0.05; ** <span class="html-italic">p</span> &lt; 0.01 (Kruskal–Wallis; post-test: Dunn’s test) (<b>C</b>) Effects of inhibition of Zeb1 expression on epithelial-to-mesenchymal transition (EMT) markers. siRNA-transfected DU145 cells (siCtrl, siZeb1) were treated or not for 48 h with TGFβ (10 ng/mL). qPCR results (mean ± SEM) are expressed in 2<sup>-ΔΔCt</sup>. (<span class="html-italic">N</span> = 3; <span class="html-italic">n</span> = 3). Statistical differences are indicated: ** <span class="html-italic">p</span> &lt; 0.01; *** <span class="html-italic">p</span> &lt; 0.001 (Kruskal–Wallis; post-test: Dunn’s test).</p>
Full article ">Figure 2
<p>LA and EPA inhibit the TGFβ-induced Zeb1 and its target genes expression. (<b>A</b>–<b>C</b>) Zeb1, N-cadherin, MMP9, Snail, and Slug mRNA levels in the prostate cancer (PCa) cell line. Cells were treated for 48 h by TGFβ (10 ng/mL) ± FA (LA, EPA, AP) (20 µM). qPCR results (mean ± SEM) are expressed in 2<sup>-ΔΔCt</sup>. (<span class="html-italic">N</span> = 3; <span class="html-italic">n</span> = 3). Statistical differences are indicated: * <span class="html-italic">p</span> &lt; 0.05; ** <span class="html-italic">p</span> &lt; 0.01; *** <span class="html-italic">p</span> &lt; 0.001 (Kruskal–Wallis; post-test: Dunn’s test). (<b>D</b>) Zeb1 and Ecadherin protein expression in DU145 PCa cells. Treatment with TGFβ (10 ng/mL) increased Zeb1 expression (from 30% to 100% positive cells) and decreased Ecadherin staining (from 90% to 25% positive cells). Addition of LA (60 µM) for 48 h led to decrease Zeb1 (40%) and to increase Ecadherin expression (70%), compared to TGFβ treatment alone (<span class="html-italic">N</span> = 3). Scale bars = 50 µm.</p>
Full article ">Figure 3
<p>LA and EPA inhibit SK3 expression induced by TGFβ, and SK3 is dependent on Zeb1 expression. (<b>A</b>) LA and EPA inhibit TGFβ-induced SK3 mRNA level in PCa cells. Cells were treated for 48 h by TGFβ (10 ng/mL) ± FA (LA, EPA, AP) (20 µM). (<span class="html-italic">N</span> = 3; <span class="html-italic">n</span> = 3). * <span class="html-italic">p</span> &lt; 0.05; ** <span class="html-italic">p</span> &lt; 0.01; *** <span class="html-italic">p</span> &lt; 0.001 (Kruskal–Wallis; post-test: Dunn’s test) (<b>B</b>) SK3 is required for promigratory effect of TGFβ. siRNA-transfected (siCtrl, siSK3) and cells treated with TGFβ (10 ng/mL) ± Ohmline (1 µM) for 48 h were used for transwell migration assay performed for 24 h (in the presence of TGFβ) (<span class="html-italic">N</span> = 3; <span class="html-italic">n</span> = 2). * <span class="html-italic">p</span> &lt; 0.05; ** <span class="html-italic">p</span> &lt; 0.01; *** <span class="html-italic">p</span> &lt; 0.001 (Kruskal–Wallis; post-test: Dunn’s test) (<b>C</b>) Zeb1 regulates SK3 channel expression. SK3 mRNA levels in siCtrl and siZeb1-transfected cells and treated by TGFβ (10 ng/mL) for 48 h (qPCR analysis were performed 48 h post-transfection). Results are expressed as mean ± SEM. (<span class="html-italic">N</span> = 3; <span class="html-italic">n</span> = 3). Statistical differences are indicated: * <span class="html-italic">p</span> &lt; 0.05; ** <span class="html-italic">p</span> &lt; 0.01; *** <span class="html-italic">p</span> &lt; 0.001 (Kruskal–Wallis; post-test: Dunn’s test). (<b>D</b>) Overexpression of Zeb1 enhanced <span class="html-italic">KCNN3</span> gene transcription. PC3 cells were cotransfected with pGL4.17-KCNN3, pRL-TK, and pCIneo (control condition) or pCIneoZeb1. Dual-luciferase reporter assays were performed 72 h after transfection. Results are normalized to control conditions and expressed as mean ± SEM. Statistical differences are indicated: *** <span class="html-italic">p</span> &lt; 0.001 (t-test one way ANOVA). (<span class="html-italic">N</span> = 3). (<b>E</b>) SK3 regulates Zeb1 channel expression. Zeb1 mRNA levels in siCtrl and siSK3- transfected-cells (qPCR analysis were performed 48 h post-transfection). Results are expressed as mean ± SEM. (<span class="html-italic">N</span> = 3; <span class="html-italic">n</span> = 3). Statistical differences are indicated: ** <span class="html-italic">p</span> &lt; 0.01 (Kruskal–Wallis; post-test: Dunn’s test).</p>
Full article ">Figure 4
<p>Ca<sup>2+</sup> entry is required for TGFβ-induced Zeb1 expression, and TGFβ-induced SOCE is inhibited by LA and EPA. (<b>A</b>) Zeb1 expression is inhibited by an SK3 channel inhibitor and Ca<sup>2+</sup> channel inhibitors. PCa cells were treated with TGFβ (10 ng/mL) ± GSK7975A (GSK in the figure), Synta66, or Ohmline (1 µM) for 48 h. Results are expressed as mean ± SEM. Statistical differences are indicated: * <span class="html-italic">p</span> &lt; 0.05; ** <span class="html-italic">p</span> &lt; 0.01; *** <span class="html-italic">p</span> &lt; 0.001 (Kruskal–Wallis; post-test: Dunn). (<span class="html-italic">N</span> = 3; <span class="html-italic">n</span> = 3). (<b>B</b>) TGFβ-induced SOCE is inhibited by LA, EPA, and Ohmline. Fluorescence measurements and relative fluorescence of Ca<sup>2+</sup> entry after intracellular Ca<sup>2+</sup> store depletion by thapsigargin (Tg) in PCa cells pretreated for 48 h by Ohmline (1 µM), TGFβ (10 ng/mL), FA (20 µM). Histograms showing relative fluorescence of Ca<sup>2+</sup> variations. (<span class="html-italic">N</span> = 3; <span class="html-italic">n</span> = 3). Statistical differences are indicated: ** <span class="html-italic">p</span> &lt; 0, 01; *** <span class="html-italic">p</span> &lt; 0,001 (Kruskal–Wallis; post-test: Dunn’s test). Results are expressed as mean ± SEM. (<b>C</b>) Proposed model for a positive feedback loop leading to PCa cellular migration, and inhibited by LA and EPA: (1) TGFβ increases calcium entry in PCa cells. (2) This calcium influx promotes expression of the transcription factor Zeb1 that targets the SK3 channel gene. (3) At the plasma membrane, the SK3 channel allows an increase in calcium entry by hyperpolarization of the plasma membrane. By incorporating into the membrane, LA and EPA inhibit this signaling pathway induced by TGFβ. These FA inhibit calcium entry, Zeb1, and SK3 expression and PCa cell migration.</p>
Full article ">Figure 5
<p>LA and EPA reduces Ca<sup>2+</sup> entry in human PCa slices. (<b>A</b>) Human PCa slices (<span class="html-italic">N</span> = 9) and nontumor prostate slices (<span class="html-italic">N</span> = 4) were obtained from 11 patients, and were treated or not for 48 h by FA (60 µM). Slices were incubated with Rhod-2-AM in 2 mM CaCl<sub>2</sub> PSS. After a stabilization period, CaCl<sub>2</sub> was added to the bath to reach a final concentration of 5 mM Ca<sup>2+</sup>. Analyses were performed with ImageJ 1.52a analysis software. The Ca<sup>2+</sup> fluorescence traces were expressed as F/F0 (F0: basal fluorescence signal obtained in 2mM Ca<sup>2+</sup> ). Rate of real-time fluorescence images represented is 0.2 Hz. Scale bars = 2 mm. Diagrams represent the variations of Ca<sup>2+</sup> signal expressed by ΔF/F0 (ΔF: maximal (5 mM Ca<sup>2+</sup>) − basal fluorescence (2 mM Ca<sup>2+</sup>)). Statistical differences are indicated: * <span class="html-italic">p</span> &lt; 0.05 (Wilcoxon test). Results are expressed as mean ± SEM. (<b>B</b>) Organotypic cultures of human PCa slices with initial Zeb1 expression were obtained from 3 patients, and were treated with PA, LA and EPA (60 µM) for 48 h. When compared to control (almost 100% positive cells), Zeb1 expression remained identical after PA treatment, whereas both LA and EPA treatment led to decrease Zeb1 staining, with, respectively, no and 10% positive cells.</p>
Full article ">
12 pages, 1721 KiB  
Article
Evaluation of the Accuracy of Liquid-Based Oral Brush Cytology in Screening for Oral Squamous Cell Carcinoma
by Lena Deuerling, Kristin Gaida, Heinrich Neumann and Torsten W. Remmerbach
Cancers 2019, 11(11), 1813; https://doi.org/10.3390/cancers11111813 - 18 Nov 2019
Cited by 19 | Viewed by 6002
Abstract
This study evaluates the accuracy of the results of liquid-based oral brush cytology and compares it to the histology and/or the clinical follow-ups of the respective patients. A total of 1352 exfoliated specimens were collected with an Orcellex brush from an identical number [...] Read more.
This study evaluates the accuracy of the results of liquid-based oral brush cytology and compares it to the histology and/or the clinical follow-ups of the respective patients. A total of 1352 exfoliated specimens were collected with an Orcellex brush from an identical number of oral lesions, then cytological diagnoses were made using liquid-based cytology. The final diagnoses in the study were 105 histologically proven squamous cell carcinomas (SCCs), 744 potentially malignant lesions and 503 cases of traumatic, inflammatory or benign hyperplastic oral lesions. The sensitivity and specificity of the liquid-based brush biopsy were 95.6% (95% CI 94.5–96.7%) and 84.9% (95% CI 83.0–86.8%), respectively. This led to the conclusion that brush biopsy is potentially a highly sensitive and reliable method to make cytological diagnoses of oral neoplasia. The main advantage of a brush biopsy over a scalpel biopsy is that it is less invasive and is more tolerated by the patients. Therefore, more lesions can be screened and more cancers can be detected at an early stage. Full article
(This article belongs to the Special Issue Cytologic Features of Tumor)
Show Figures

Figure 1

Figure 1
<p>Cell collector Orcellex brush in front of a leukoplakia on the buccal mucosa.</p>
Full article ">Figure 2
<p>Negative for tumour cells—SurePath, staining Papanicolaou, lens 40×. Clinically most probably oral lichen planus (OLP). The background is completely clear. Bacterial flora can still be appreciated clinging to the cell surfaces. A group of five mature squamous cells with reactive changes: cytoplasmic hypereosinophilia and amphophilia, and megalocytosis of the central cell with corresponding mild nuclear enlargement. Small perinuclear halos of the two cells in the left field. All nuclei are round to ovoid with smooth contours and finely granular, evenly dispersed chromatin.</p>
Full article ">Figure 3
<p>(<b>a</b>) Doubtful for tumour cells—SurePath, staining Papanicolaou, lens 20×. Clinically erosive OLP. The background is mostly clear. In the lower left field is a stromal tissue fragment with mechanically altered nuclei; this correlates with an erosive process. There are several mature squamous cells lying singly and three larger groups of cells. In the upper right field, the basophilic cells are more immature, a sign of regeneration. The group of mature cells in the upper central field shows cytoplasmic hypereosinophilia and amphophilia. There seems to be some degree of anisonucleosis. (<b>b</b>) Doubtful for tumour cells—detail, lens 40×. On high power and in this plane of focus marked variation in nuclear size can be appreciated (factor 2–3). The larger nuclei are rather darker, i.e., more hyperchromatic, and the chromatin is slightly coarse. Nuclear contours are still fairly smooth. These findings are commonly reactive. A mild squamous intraepithelial neoplasia (SIN1) cannot be excluded. We perform DNA-karyometry on these cases. DNA-aneuploidy should prompt invasive biopsy for histology. With DNA-euploidy we would recommend clinical follow-up and repeat brush cytology after 12 months.</p>
Full article ">Figure 4
<p>(<b>a</b>) Suspicious for tumour cells—SurePath, staining Papanicolaou, lens 10×. Clinically, an ulcerative lesion of the lateral border of the tongue. The background shows some amorphous deposits of partly eosinophilic, partly basophilic material, most obvious in the top central field. The big cell groups form partly sheets, partly three-dimensional crowds. Immaturity, a high nuclear/cytoplasmic (N/C) ratio and anisonucleosis can be suspected in this magnification. (<b>b</b>) Suspicious for tumour cells—detail, lens 40×. On high power there is marked anisonucleosis. The nuclei are haphazardly orientated, the axes of different nuclei are not parallel. Many nuclei show prominent nucleoli and/or irregularities of their borders. Chromatin is frequently irregularly deposited with early condensation along the nuclear membrane. These changes may represent so-called atypical tissue repair. The differential is high grade SIL or invasive SCC. The background may represent the ulcer or tumour diathesis. We would try to confirm the suspicion with DNA-karyometry. A scalpel biopsy must be performed for confirmation.</p>
Full article ">Figure 5
<p>(<b>a</b>) Positive for tumour cells—SurePath, staining Papanicolaou, lens 20×. Clinically, there is suspicion for a carcinoma. On low power, there is a highly irregular aspect of the slide. In the background there are deposits of amorphous material, sometimes with nuclear fragments. In addition to many mature cells with normal nuclei, there are immature, small epithelial cells, both singly and in small and large groups. Nuclear enlargement and prominent nucleoli can be seen in this magnification. Some bizarre orangeophilic cells represent atypical keratinization. Those cells may have opaque, nearly black nuclei with smudged chromatin. (<b>b</b>) Positive for tumour cells—detail, lens 40×. A loosely cohesive sheet of highly atypical, immature squamous cells. The N/C ratio is markedly increased. Nuclei are highly hyperchromatic and chromatin is coarse. Some cells show an irregular nuclear contour and/or small nucleoli. These findings constitute the cytological diagnosis of a moderately well differentiated, keratinizing squamous cell carcinoma (SCC). Almost all these cases show aneuploidy on DNA-karyometry.</p>
Full article ">
21 pages, 3671 KiB  
Article
Synergistic Autophagy Effect of miR-212-3p in Zoledronic Acid-Treated In Vitro and Orthotopic In Vivo Models and in Patient-Derived Osteosarcoma Cells
by Ju Yeon Oh, Eun Ho Kim, Yeon-Joo Lee, Sei Sai, Sun Ha Lim, Jang Woo Park, Hye Kyung Chung, Joon Kim, Guillaume Vares, Akihisa Takahashi, Youn Kyoung Jeong, Mi-Sook Kim and Chang-Bae Kong
Cancers 2019, 11(11), 1812; https://doi.org/10.3390/cancers11111812 - 18 Nov 2019
Cited by 11 | Viewed by 3452 | Correction
Abstract
Osteosarcoma (OS) originates from osteoid bone tissues and is prone to metastasis, resulting in a high mortality rate. Although several treatments are available for OS, an effective cure does not exist for most patients with advanced OS. Zoledronic acid (ZOL) is a third-generation [...] Read more.
Osteosarcoma (OS) originates from osteoid bone tissues and is prone to metastasis, resulting in a high mortality rate. Although several treatments are available for OS, an effective cure does not exist for most patients with advanced OS. Zoledronic acid (ZOL) is a third-generation bisphosphonate that inhibits osteoclast-mediated bone resorption and has shown efficacy in treating bone metastases in patients with various types of solid tumors. Here, we sought to clarify the mechanisms through which ZOL inhibits OS cell proliferation. ZOL treatment inhibited OS cell proliferation, viability, and colony formation. Autophagy inhibition by RNA interference against Beclin-1 or ATG5 inhibited ZOL-induced OS cell death. ZOL induced autophagy by repressing the protein kinase B/mammalian target of rapamycin/p70S6 kinase pathway and extracellular signal-regulated kinase signaling-dependent autophagy in OS cell lines and patient-derived OS cells. Microarrays of miRNA showed that ZOL increased the levels of miR-212-3p, which is known to play an important role in autophagy, in OS in vitro and in vivo systems. Collectively, our data provided mechanistic insight into how increased miR-212-3p through ZOL treatment induces autophagy synergistically in OS cells, providing a preclinical rationale for conducting a broad-scale clinical evaluation of ZOL + miR-212-3p in treating OS. Full article
Show Figures

Figure 1

Figure 1
<p>Zoledronic acid (ZOL) inhibited osteosarcoma (OS) cell proliferation. (<b>a</b>) Cell viability was evaluated by MTT assay in KHOS/NP cells, U2OS cells of OS cell lines and cells from a patient with OS after 48 h treatment with the indicated concentration of ZOL; * <span class="html-italic">p</span> &lt; 0.05, ** <span class="html-italic">p</span> &lt; 0.01, *** <span class="html-italic">p</span> &lt; 0.001. (<b>b</b>) Colony-formation assays were performed using KHOS/NP and U2OS cells treated with the indicated concentration of ZOL for seven days; ** <span class="html-italic">p</span> &lt; 0.01, *** <span class="html-italic">p</span> &lt; 0.001. (<b>c</b>) Cells were treated with ZOL (40 μM) for 72 h, and the proliferation rate was detected by 5-bromo-2′-deoxyuridine (BrdU) labeling; * <span class="html-italic">p</span> &lt; 0.05, ** <span class="html-italic">p</span> &lt; 0.01. (<b>d</b>) The apoptosis rate was assessed by fluorescence-activated cell sorting (FACS) analysis for 72 h treatment; * <span class="html-italic">p</span> &lt; 0.05. (<b>e</b>) Ki67 expression in the orthotopic model was examined by immunohistochemistry; *** <span class="html-italic">p</span> &lt; 0.001. (<b>f</b>) Two weeks after tumor cell inoculation, mice were randomly assigned into four groups of three animals each: Control group (untreated), ZOL alone group. ZOL was administered intraperitoneally twice weekly at a dose of 0.1 mg/kg in 100 μL PBS two weeks after inoculation. TUNEL assays were performed using orthotopic cells [<a href="#B23-cancers-11-01812" class="html-bibr">23</a>]; ** <span class="html-italic">p</span> &lt; 0.01. (<b>g</b>) Immunoblotted cell lysates (30 μg) are shown with the cleaved caspase3 and β-actin antibodies for 48 h treatment.</p>
Full article ">Figure 2
<p>Zoledronic acid (ZOL) induced accumulation of acidic vacuoles (AVOs). (<b>a</b>) Cells were stained with Giemsa (10% in PBS), washed, and imaged under a Nikon Eclipse Ts2R-FL microscope (magnification, 40×). Black arrows point to vacuoles. A representative image from two independent experiments is shown. (<b>b</b>) Cells were treated with ZOL for 48 h and then stained with acridine orange. Green and red fluorescence in acridine orange (AO)-stained cells was detected by flow cytometry; * <span class="html-italic">p</span> &lt; 0.05, ** <span class="html-italic">p</span> &lt; 0.01, *** <span class="html-italic">p</span> &lt; 0.001. (<b>c</b>) Autophagy measured by TEM in ZOL-treated OS cells (left). The quantification was added in (<b>b</b>) (right); * <span class="html-italic">p</span> &lt; 0.05, ** <span class="html-italic">p</span> &lt; 0.01. (<b>d</b>,<b>e</b>) Cells were treated with rapamycin (4 μM) for 18 h and ZOL (80 μM) for 48 h to detect the CYTO-ID<sup>®</sup> dye signal; * <span class="html-italic">p</span> &lt; 0.05.</p>
Full article ">Figure 3
<p>Zoledronic acid (ZOL) induced autophagy in osteosarcoma (OS) cells and patient-derived OS cells. (<b>a</b>) Induction of autophagy in ZOL-treated KHOS/NP and U2OS cells with stable expression of Green Fluorescent Protein (GFP)-tagged LC3 (left). The quantification was added in (<b>a</b>) (right); *<span class="html-italic">p</span> &lt; 0.05, **<span class="html-italic">p</span> &lt; 0.01. (<b>b</b>,<b>c</b>) Immunoblotting of LC3, Beclin-1, ATG5, and p62 and qRT-PCR analysis of Beclin1 mRNA level in KHOS/NP and U2OS cells treated with ZOL for 48 h; * <span class="html-italic">p</span> &lt; 0.05, ** <span class="html-italic">p</span> &lt; 0.01. (<b>d</b>,<b>e</b>) Immunoblotting of LC3, Atg5, and Beclin-1 and qRT-PCR analysis of Beclin1 mRNA level in patient-derived OS cells that were treated with ZOL.; * <span class="html-italic">p</span> &lt; 0.05, ** <span class="html-italic">p</span> &lt; 0.01. (<b>f</b>) LC3 expression in an orthotopic model was examined by immunohistochemistry. Representative images are provided, as indicated; ** <span class="html-italic">p</span> &lt; 0.01.</p>
Full article ">Figure 4
<p>Inhibition of autophagy repressed the anti-proliferative effect of zoledronic acid (ZOL) in osteosarcoma (OS) cells. (<b>a</b>) Cells were transfected with si-ATG5 or Beclin-1 or a control siRNA (40 nM) for 24 h, after which the cells were treated with ZOL for another 48 h. The proliferation rate was detected using trypan blue cell-counting assays and immunoblotting was conducted to check the efficiency of transfection; **<span class="html-italic">p</span> &lt; 0.01. (<b>b</b>,<b>c</b>) Cells were treated with 3MA and LY294002 in the presence or absence of ZOL for 48 h, and the proliferation rate was measured by MTT and trypan blue cell-counting assays; * <span class="html-italic">p</span> &lt; 0.05, ** <span class="html-italic">p</span> &lt; 0.01. (<b>d</b>) Cells were grown in six-well tissue culture plates under standard cell culture conditions, pre-treated (24 h) with 3-MA (2 mM) and LY294002 (20 μM), and then treated with ZOL for 48 h. Cells were stained with Giemsa (10% in PBS), washed, and photographed under a Nikon Eclipse Ts2R-FL microscope (magnification 40×). Black arrows show vacuoles. A representative image from two independent experiments is shown.</p>
Full article ">Figure 5
<p>Zoledronic acid (ZOL) induced autophagy by repressing the Akt/mTOR pathway in osteosarcoma (OS) cells and in an orthotopic in vivo model. (<b>a</b>) Immunoblotted cell lysates (30 μg) are shown with the corresponding antibodies. (<b>b</b>) ELISA was performed to quantify the level of phosphor-p70S6K at Thr389, phosphor-4EBP1 at Thr37/46, and p70S6K-4EBP1 in KHOS/NP, U2OS, and cells from a patient with OS after ZOL treatment. Each concentration was tested in quadruplicate, and each experiment was repeated two times. The data shown represent the combined mean ± SD from two independent experiments; * <span class="html-italic">p</span> &lt; 0.05, ** <span class="html-italic">p</span> &lt; 0.01, ns &gt; 0.05. (<b>c</b>) <span class="html-italic">p</span>-Akt expression in the orthotopic model was examined by immunohistochemistry. Representative images are provided as indicated; * <span class="html-italic">p</span> &lt; 0.05.</p>
Full article ">Figure 6
<p>miR-212-3p directly targets autophagy in zoledronic acid (ZOL)-treated osteosarcoma (OS) cells. (<b>a</b>) Expression analysis of miRNAs upregulated after ZOL treatment. (<b>b</b>) miR-212-3p levels were analyzed by qRT-PCR in OS cells treated with ZOL. * <span class="html-italic">p</span> &lt; 0.05 (<b>c</b>) Kaplan–Meier survival curves for sarcoma patients based on miR-212-3p expression. The survival rate is shown; <span class="html-italic">p</span> &lt; 0.05. (<b>d</b>) The relative expression of miR-212-3p in matched primary OS tissues and non-tumor tissues. (<b>e</b>) Cells were treated with ZOL or miR-212-3p for 48 h, and the proliferation rate was measured by cell counting; * <span class="html-italic">p</span> &lt; 0.05, ** <span class="html-italic">p</span> &lt; 0.01, *** <span class="html-italic">p</span> &lt; 0.001. (<b>f</b>) The proliferation rate was detected by MTT assay at the same time point. * <span class="html-italic">p</span> &lt; 0.05. (<b>g</b>) Two OS cell lines and patient-derived cells were treated with ZOL (80 μM) and miR-212-3p or a combination for 48 h. ZOL + miR-212-3p treatment resulted in an increase in the CYTO-ID<sup>®</sup> dye signal compared to that following either single treatment; * <span class="html-italic">p</span> &lt; 0.05, ** <span class="html-italic">p</span> &lt; 0.01, *** <span class="html-italic">p</span> &lt; 0.001. (<b>h</b>) Immunoblotting of LC3 in lysates from KHOS/NP and U2OS cells. (<b>i</b>) ZOL + miR-212-3p treatment resulted in an increase in the CYTO-ID<sup>®</sup> dye signal in KHOS/NP cells after 48 h. (<b>j</b>) Cells were treated with ZOL or miR-212-3p for 48 h, stained with Giemsa (10% in PBS), washed, and photographed under an Eclipse Ts2R-FL microscope (magnification 40×). The black arrows point to vacuoles. A representative image from two independent experiments is shown.</p>
Full article ">Figure 7
<p>The autophagic target relationship between miR-212-3p and zoledronic acid (ZOL) in an in vivo model. (<b>a</b>) Image of isolated tumors derived from osteosarcoma (OS) xenografts intratumorally treated with ZOL or miR- 212-3p mimics or inhibitor. (<b>b</b>) Representative PET/CT images of KHOS tumor-bearing mice after injection of [<sup>18</sup>F]-[Fluorine-18(18F)]-fluorodeoxyglucose (FDG). The radioactivity of [<sup>18</sup>F]-FDG in tumors is presented as the maximal value of SUV (mean ± S.D); ** <span class="html-italic">p</span> &lt; 0.01. (<b>c</b>) miR-212-3p levels were analyzed by qRT-PCR in in vivo tissues treated with ZOL only; miR212-3p mimics only; ZOL + miR212-3p mimics; or ZOL + miR212-3p inhibitor. Values represent the means of three experiments ± SD; * <span class="html-italic">p</span> &lt; 0.05, *** <span class="html-italic">p</span> &lt; 0.001. (<b>d</b>) Tumors were excised and weighed at the end of the experiment (six weeks after tumor cell inoculation); * <span class="html-italic">p</span> &lt; 0.05. (<b>e</b>) Mouse body weights were assessed at 14 days. (<b>f</b>) Beclin1 mRNA expression levels in mice receiving each treatment; * <span class="html-italic">p</span> &lt; 0.05, ** <span class="html-italic">p</span> &lt; 0.01, *** <span class="html-italic">p</span> &lt; 0.001. (<b>g</b>) Hematoxylin and eosin (H&amp;E) staining and LC3, Beclin1, and <span class="html-italic">p</span>-mTOR expression in tumor xenografts were examined by immunohistochemistry. * <span class="html-italic">p</span> &lt; 0.05, ** <span class="html-italic">p</span> &lt; 0.01, ns &gt; 0.05.</p>
Full article ">
20 pages, 1457 KiB  
Article
Mitigating Effect of 1-Palmitoyl-2-Linoleoyl-3-Acetyl-Rac-Glycerol (PLAG) on a Murine Model of 5-Fluorouracil-Induced Hematological Toxicity
by Jinseon Jeong, Yong-Jae Kim, Do Young Lee, Ki-Young Sohn, Sun Young Yoon and Jae Wha Kim
Cancers 2019, 11(11), 1811; https://doi.org/10.3390/cancers11111811 - 18 Nov 2019
Cited by 7 | Viewed by 3099
Abstract
5-Fluorouracil (5-FU) is an antimetabolite chemotherapy widely used for the treatment of various cancers. However, many cancer patients experience hematological side effects following 5-FU treatment. Here, we investigated the protective effects of 1-palmitoyl-2-linoleoyl-3-acetyl-rac-glycerol (PLAG) as a mitigator against 5-FU-induced hematologic toxicity, including neutropenia, [...] Read more.
5-Fluorouracil (5-FU) is an antimetabolite chemotherapy widely used for the treatment of various cancers. However, many cancer patients experience hematological side effects following 5-FU treatment. Here, we investigated the protective effects of 1-palmitoyl-2-linoleoyl-3-acetyl-rac-glycerol (PLAG) as a mitigator against 5-FU-induced hematologic toxicity, including neutropenia, monocytopenia, thrombocytopenia, and thrombocytosis, in Balb/c mice injected with 5-FU (100 mg/kg, i.p.). Administration of PLAG significantly and dose-dependently reduced the duration of neutropenia and improved the nadirs of absolute neutrophil counts (ANCs). Moreover, while the ANCs of all mice in the control fell to the severely neutropenic range, none of the mice in the PLAG 200 and 400 mg/kg-treated groups experienced severe neutropenia. Administration of PLAG significantly delayed the mean first day of monocytopenia and reduced the duration of monocytopenia. PLAG also effectively reduced extreme changes in platelet counts induced by 5-FU treatment, thus preventing 5-FU-induced thrombocytopenia and thrombocytosis. PLAG significantly decreased plasma levels of the chemokine (C–X–C motif) ligand 1 (CXCL1), CXCL2, interleukin (IL)-6, and C-reactive protein (CRP), which were elevated consistently with the occurrence time of neutropenia, monocytopenia, and thrombocytopenia. When compared with olive oil and palmitic linoleic hydroxyl glycerol (PLH), only PLAG effectively mitigated 5-FU-induced hematological toxicity, indicating that it has a distinctive mechanism of action. In conclusion, PLAG may have therapeutic potential as a mitigator for 5-FU-induced neutropenia and other hematological disorders. Full article
Show Figures

Figure 1

Figure 1
<p>1-palmitoyl-2-linoleoyl-3-acetyl-rac-glycerol (PLAG) mitigates 5-Fluorouracil (5-FU)-induced neutropenia. Mice (<span class="html-italic">n</span> = 8 males per group) were intraperitoneally injected to 100 mg/kg of 5-FU immediately followed by oral administration of 50, 100, 200, and 400mg/kg of PLAG and continuing daily to day 15. (<b>A</b>) Effect of PLAG administration on the kinetics of the absolute neutrophil counts (ANCs) after 5-FU injection for 15 days. (<b>B</b>) Individual ANC data are presented as dots on days 5, 6, and 7. * indicates negative control vs. 5-FU and # indicates 5-FU vs. 5-FU + PLAG-treated groups. */# <span class="html-italic">p</span> &lt; 0.05, **/## <span class="html-italic">p</span> &lt; 0.01, ***/### <span class="html-italic">p</span> &lt; 0.001. The complete blood counts (CBCs) data are representative of five independent experiments with eight mice per group.</p>
Full article ">Figure 2
<p>PLAG mitigates 5-FU-induced monocytopenia. Mice (<span class="html-italic">n</span> = 8 males per group) were intraperitoneally injected to 100 mg/kg of 5-FU immediately followed by oral administration of 50, 100, 200, and 400 mg/kg of PLAG, continuing daily until day 15. (<b>A</b>) Effect of PLAG administration on the kinetics of peripheral monocytes after 5-FU injection for 15 days. (<b>B</b>) The peripheral monocyte counts are presented as dots on days 5, 6, and 7. The complete blood counts (CBCs) data are representative of five independent experiments with eight mice per group. * indicates negative control vs. 5-FU, and # indicates 5-FU vs. 5-FU + PLAG-treated groups. */# <span class="html-italic">p</span> &lt; 0.05, **/## <span class="html-italic">p</span> &lt; 0.01, ***/### <span class="html-italic">p</span> &lt; 0.001. ns., not significant.</p>
Full article ">Figure 3
<p>PLAG prevents 5-FU-induced thrombocytopenia and thrombocytosis. Mice (<span class="html-italic">n</span> = 8 males per group) were intraperitoneally injected to 100 mg/kg of 5-FU immediately followed by oral administration of 50, 100, 200, and 400 mg/kg of PLAG, continuing daily until day 15. (<b>A</b>) Effect of PLAG administration on the kinetics of peripheral platelets after 5-FU injection for 15 days. The peripheral platelet counts are presented as dots (<b>B</b>) on days 5, 6, and 7 and (<b>C</b>) on days 10, 12, and 15. The complete blood counts (CBCs) data are representative of five independent experiments with eight mice per group. * indicates negative control vs. 5-FU and # indicates 5-FU vs. 5-FU + PLAG-treated groups. */# <span class="html-italic">p</span> &lt; 0.05, **/## <span class="html-italic">p</span> &lt; 0.01, ***/### <span class="html-italic">p</span> &lt; 0.001. ns., not significant.</p>
Full article ">Figure 4
<p>Correlation between hematology and pro-inflammatory cytokine/chemokines in 5-FU-treated mice. The blood samples were harvested from mice (<span class="html-italic">n</span> = 40 males per day) on days 5, 6, and 7 after 5-FU (100 mg/kg) treatment. Correlation plot between (<b>A</b>) ANCs, (<b>B</b>) monocytes, or (<b>C</b>) platelets and pro-inflammatory cytokine/chemokines the chemokine (C–X–C motif) ligand 1 (CXCL1), CXCL2, and interleukin (IL)-6 (Pearson’s correlations).</p>
Full article ">Figure 5
<p>PLAG attenuates blood levels of 5-FU-induced pro-inflammatory cytokine/chemokines and C-reactive protein (CRP). Mice (<span class="html-italic">n</span> = 8 males per group) were intraperitoneally injected to 100 mg/kg of 5-FU immediately followed by oral administration of 50, 100, 200, and 400 mg/kg of PLAG, continuing daily until day 15. Effect of PLAG administration on the kinetics of (<b>A</b>) the chemokine (C–X–C motif) ligand 1 (CXCL1), (<b>B</b>) CXCL2, (<b>C</b>) interleukin-6 (IL-6), and (<b>D</b>) CRP in blood after 5-FU injection. Individual data of CXCL1, CXCL2, IL-6, and CRP on 0.5 day (<b>E</b>,<b>G</b>,<b>I</b>,<b>K</b>) and six days (<b>F</b>,<b>H</b>,<b>J</b>,<b>L</b>) after 5-FU injection are presented as dots. The luminex and ELISA data are representative of five independent experiments with eight mice per group. * indicates negative control vs. 5-FU and # indicates 5-FU vs. 5-FU + PLAG-treated groups. */# <span class="html-italic">p</span> &lt; 0.05, **/## <span class="html-italic">p</span> &lt; 0.01, ***/### <span class="html-italic">p</span> &lt; 0.001. ns., not significant.</p>
Full article ">Figure 6
<p>Effect of PLAG, olive oil, and PLH in 5-FU-induced hematological toxicity. Mice (<span class="html-italic">n</span> = 5 males per group) were intraperitoneally injected to 100 mg/kg of 5-FU, immediately followed by oral administration of 200 mg/kg of PLAG, olive oil, or PLH, continuing daily until day 15. (<b>A</b>) The chemical structure of PLAG and PLH. The effect of PLAG, olive oil, or PLH administration on the kinetics of (<b>B</b>) ANC, (<b>C</b>) monocytes, and (<b>D</b>) platelets after 5-FU injection. The CBC data are representative of three independent experiments with five mice per group. * indicates negative control vs. 5-FU and # indicates 5-FU vs. 5-FU + PLAG-treated groups. */# <span class="html-italic">p</span> &lt; 0.05, **/## <span class="html-italic">p</span> &lt; 0.01, ***/### <span class="html-italic">p</span> &lt; 0.001. ns, not significant.</p>
Full article ">
19 pages, 5878 KiB  
Article
The Gasdermin E Gene Has Potential as a Pan-Cancer Biomarker, While Discriminating between Different Tumor Types
by Joe Ibrahim, Ken Op de Beeck, Erik Fransen, Marc Peeters and Guy Van Camp
Cancers 2019, 11(11), 1810; https://doi.org/10.3390/cancers11111810 - 18 Nov 2019
Cited by 26 | Viewed by 4115
Abstract
Due to the elevated rates of incidence and mortality of cancer, early and accurate detection is crucial for achieving optimal treatment. Molecular biomarkers remain important screening and detection tools, especially in light of novel blood-based assays. DNA methylation in cancer has been linked [...] Read more.
Due to the elevated rates of incidence and mortality of cancer, early and accurate detection is crucial for achieving optimal treatment. Molecular biomarkers remain important screening and detection tools, especially in light of novel blood-based assays. DNA methylation in cancer has been linked to tumorigenesis, but its value as a biomarker has not been fully explored. In this study, we have investigated the methylation patterns of the Gasdermin E gene across 14 different tumor types using The Cancer Genome Atlas (TCGA) methylation data (N = 6502). We were able to identify six CpG sites that could effectively distinguish tumors from normal samples in a pan-cancer setting (AUC = 0.86). This combination of pan-cancer biomarkers was validated in six independent datasets (AUC = 0.84–0.97). Moreover, we tested 74,613 different combinations of six CpG probes, where we identified tumor-specific signatures that could differentiate one tumor type versus all the others (AUC = 0.79–0.98). In all, methylation patterns exhibited great variation between cancer and normal tissues, but were also tumor specific. Our analyses highlight that a Gasdermin E methylation biomarker assay, not only has the potential for being a methylation-specific pan-cancer detection marker, but it also possesses the capacity to discriminate between different types of tumors. Full article
(This article belongs to the Special Issue New Biomarkers in Cancers)
Show Figures

Figure 1

Figure 1
<p>Countplot showing the number of differentially methylated <span class="html-italic">Gasdermin E</span> (<span class="html-italic">GSDME</span>) probes across the datasets. The right panel corresponds to hypermethylated (DNA methylation beta values of tumor samples are significantly higher than that of normal samples) CpGs, while the left panel corresponds to hypomethylated (DNA methylation beta values of tumor are significantly lower than that of normal) CpGs. Please refer to <a href="#cancers-11-01810-t001" class="html-table">Table 1</a> for tumor dataset abbreviations.</p>
Full article ">Figure 2
<p>Map of the 22 <span class="html-italic">GSDME</span> GpGs showing the average probe methylation and chromosomal location across the different datasets. The size of the dots indicates the average methylation, while the colour indicates tissue type (NT = normal tissue, TP = tumor tissue). Please refer to <a href="#cancers-11-01810-t001" class="html-table">Table 1</a> for tumor dataset abbreviations.</p>
Full article ">Figure 3
<p>Cleveland plot of the calculated average area under the curves (AUCs for 39 probe combinations that satisfy both filters (minimum average AUC = 0.84 and minimum AUC threshold = 0.80) across the datasets.</p>
Full article ">Figure 4
<p>Countplot of the number of tumor types per combination that satisfy the AUC filters.</p>
Full article ">Figure 5
<p>Countplot of the number probe combinations that satisfy the filters for each of the datasets. Please refer to <a href="#cancers-11-01810-t001" class="html-table">Table 1</a> for tumor dataset abbreviations.</p>
Full article ">Figure 6
<p>Receiver operating characteristic (ROC) curves for the final <span class="html-italic">GSDME</span> pan-cancer model along with the validation datasets. The black solid curve represents the training dataset, the red solid line represents the combined validation dataset, while the dotted lines represent the individual validation sets. The final model included six CpG probes; one in the gene body (Probe 3), four in the promoter region (Probes 12, 14, 18 and 20) and one in the upstream region (Probe 21) and accounted for age and tumor stage. Sensitivity and specificity at various cut-off values for the datasets are plotted. The final model yielded an AUC of 0.86 (95% CI: 0.852–0.87). At a set cut-off of 0.55, sensitivity and specificity were at 98.8%, and 93.2%, respectively, while overall model accuracy was 89.7%. The right panel shows ROC curves for the subsequent validation of the model by three external datasets. The diagonal line represents the line of no discrimination between tumor and normal tissues.</p>
Full article ">Figure 7
<p>Violin plot of the distribution of partial least squares-discriminant analysis (PLSDA) cross-validated AUCs of different probe combinations (74,613) classifying each of the 14 tumor types against all others. Please refer to <a href="#cancers-11-01810-t001" class="html-table">Table 1</a> for tumor dataset abbreviations.</p>
Full article ">Figure 8
<p>Flower plot of the maximum calculated cross-validated AUC for classifying each of the 14 tumors against all others, along with the corresponding probe combination that yielded the displayed AUC. Please refer to <a href="#cancers-11-01810-t001" class="html-table">Table 1</a> for tumor dataset abbreviations.</p>
Full article ">
21 pages, 583 KiB  
Review
Bulk and Single-Cell Next-Generation Sequencing: Individualizing Treatment for Colorectal Cancer
by Ioannis D. Kyrochristos, Demosthenes E. Ziogas, Anna Goussia, Georgios K. Glantzounis and Dimitrios H. Roukos
Cancers 2019, 11(11), 1809; https://doi.org/10.3390/cancers11111809 - 18 Nov 2019
Cited by 18 | Viewed by 5321
Abstract
The increasing incidence combined with constant rates of early diagnosis and mortality of colorectal cancer (CRC) over the past decade worldwide, as well as minor overall survival improvements in the industrialized world, suggest the need to shift from conventional research and clinical practice [...] Read more.
The increasing incidence combined with constant rates of early diagnosis and mortality of colorectal cancer (CRC) over the past decade worldwide, as well as minor overall survival improvements in the industrialized world, suggest the need to shift from conventional research and clinical practice to the innovative development of screening, predictive and therapeutic tools. Explosive integration of next-generation sequencing (NGS) systems into basic, translational and, more recently, basket trials is transforming biomedical and cancer research, aiming for substantial clinical implementation as well. Shifting from inter-patient tumor variability to the precise characterization of intra-tumor genetic, genomic and transcriptional heterogeneity (ITH) via multi-regional bulk tissue NGS and emerging single-cell transcriptomics, coupled with NGS of circulating cell-free DNA (cfDNA), unravels novel strategies for therapeutic response prediction and drug development. Remarkably, underway and future genomic/transcriptomic studies and trials exploring spatiotemporal clonal evolution represent most rational expectations to discover novel prognostic, predictive and therapeutic tools. This review describes latest advancements and future perspectives of integrated sequencing systems for genome and transcriptome exploration to overcome unmet research and clinical challenges towards Precision Oncology. Full article
(This article belongs to the Special Issue Application of Next-Generation Sequencing in Cancers)
Show Figures

Figure 1

Figure 1
<p>Putative clinical implications emerging from the breakthrough exploration of intra-patient intratumor and circulating heterogeneity. (a) Step-wise delineation of translational and clinical implications via genome and transcriptome sequencing. (b) Medium-term clinical expectations: Progress from genomic and transcriptomic studies to sequencing of bulk multi-regional primary and metastatic tumor tissue and matched serial cfDNA within appropriately designed clinical trials promises to realize the initial phase of Precision Oncology. Innovative future translational research: Emerging advances in single-cell exploration of genomic and transcriptional heterogeneity could enable the precise selection of drug combinations.</p>
Full article ">
10 pages, 1880 KiB  
Article
hENT1 Testing in Pancreatic Ductal Adenocarcinoma: Are We Ready? A Multimodal Evaluation of hENT1 Status
by Jerome Raffenne, Remy Nicolle, Francesco Puleo, Delphine Le Corre, Camille Boyez, Raphael Marechal, Jean François Emile, Peter Demetter, Armelle Bardier, Pierre Laurent-Puig, Louis de Mestier, Valerie Paradis, Anne Couvelard, Jean Luc VanLathem, John R. MacKey, Jean-Baptiste Bachet, Magali Svrcek and Jerome Cros
Cancers 2019, 11(11), 1808; https://doi.org/10.3390/cancers11111808 - 18 Nov 2019
Cited by 22 | Viewed by 2869
Abstract
Gemcitabine is still one of the standard chemotherapy regimens for pancreatic ductal adenocarcinoma (PDAC). Gemcitabine uptake into tumor cells is mainly through the human equilibrative nucleoside transport 1 (hENT1). It was therefore proposed as a potential predictive biomarker of gemcitabine efficacy but reports [...] Read more.
Gemcitabine is still one of the standard chemotherapy regimens for pancreatic ductal adenocarcinoma (PDAC). Gemcitabine uptake into tumor cells is mainly through the human equilibrative nucleoside transport 1 (hENT1). It was therefore proposed as a potential predictive biomarker of gemcitabine efficacy but reports are conflicting, with an important heterogeneity in methods to assess hENT1 expression. A multicenter cohort of 471 patients with a resected PDAC was used to assess simultaneously the predictive value of the 2 best described hENT1 antibodies (10D7G2 and SP120). Three additional antibodies and the predictive value of hENT1 mRNA were also tested on 251 and 302 patients, respectively. hENT1 expression was assessed in 54 patients with matched primary tumors and metastases samples. The 10D7G2 clone was the only hENT1 antibody whose high expression was associated with a prolonged progression free survival and overall survival in patients who received adjuvant gemcitabine. hENT1 mRNA level was also predictive of gemcitabine benefit. hENT1 status was concordant in 83% of the cases with the best concordance in synchronous metastases. The 10D7G2 clone has the best predictive value of gemcitabine benefit in PDAC patients. Since it is not commercially available, hENT1 mRNA level could represent an alternative to assess hENT1 status. Full article
Show Figures

Figure 1

Figure 1
<p>Comparison of the 10D7G2 and SP120 hENT1 clones. (<b>a</b>) Representative immunohistochemistry of 2 discordant cases between the 2 clones (black bar = 100 µm), (<b>b</b>) correlation between the 2 clones on the whole series, (<b>c</b>) disease free (left panels) and overall (right panels) survival in gemcitabine-treated patients. hENT1 high and low cases were defined with the 10D7G2 and the SP120 clones, (<b>d</b>) disease free and overall survival in patients not treated by gemcitabine. hENT1 high and low cases were defined with the 10D7G2 clone, (<b>e</b>) disease free (left panels) and overall (right panels) survival in adjuvant-free (only surgery) patients.</p>
Full article ">Figure 2
<p>Comparison of all hENT1 clones. (<b>a</b>) Representative immunohistochemistry of the 2 cases showed in <a href="#cancers-11-01808-f003" class="html-fig">Figure 3</a> with the 3 additional hENT1 clones (black bar = 100 µm), (<b>b</b>) correlation between the 5 hENT1 clones. Each vertical line represents one tumor with its hENT1 status across all five antibodies (high = brown color, low = green color, grey = indeterminate). The top panel summarizes each tumor with the number of positive and negative antibodies, (<b>c</b>) disease free survival in gemcitabine-treated patients. hENT1 high and low cases were defined with the 10D7G2 and the 3 additional clones, (<b>d</b>) Western blot with the 5 clones on tumor protein extracts (T) and on purified hENT1 protein (P). See complete membranes in <a href="#app1-cancers-11-01808" class="html-app">Figure S2</a>.</p>
Full article ">Figure 3
<p>Predictive value of hENT1 mRNA level and correlation with immunohistochemistry. (<b>a</b>) Disease free survival in gemcitabine-treated patients according to the hENT1 status defined by the hENT1 (<span class="html-italic">SLC29A1</span>) mRNA level top 25% vs. bottom 25% (top panel), top 10% vs. bottom 10% (middle panel), top 10% vs. the rest of the cohort (bottom panel), (<b>b</b>) level of <span class="html-italic">SLC29A1</span> mRNA level in hENT1 high and low cases defined by immunohistochemistry with the different clones. * <span class="html-italic">p</span> &lt; 0.05, *** <span class="html-italic">p</span> &lt; 0.0001.</p>
Full article ">
13 pages, 6099 KiB  
Article
Sensitive and Specific Detection of Ewing Sarcoma Minimal Residual Disease in Ovarian and Testicular Tissues in an In Vitro Model
by Laure Chaput, Victoria Grèze, Pascale Halle, Nina Radosevic-Robin, Bruno Pereira, Lauren Véronèse, Hervé Lejeune, Philippe Durand, Guillaume Martin, Sandra Sanfilippo, Michel Canis, Justyna Kanold, Andrei Tchirkov and Florence Brugnon
Cancers 2019, 11(11), 1807; https://doi.org/10.3390/cancers11111807 - 17 Nov 2019
Cited by 4 | Viewed by 2727
Abstract
Ewing sarcoma (EWS) is a common pediatric solid tumor with high metastatic potential. Due to toxic effects of treatments on reproductive functions, the cryopreservation of ovarian tissue (OT) or testicular tissue (TT) is recommended to preserve fertility. However, the risk of reintroducing residual [...] Read more.
Ewing sarcoma (EWS) is a common pediatric solid tumor with high metastatic potential. Due to toxic effects of treatments on reproductive functions, the cryopreservation of ovarian tissue (OT) or testicular tissue (TT) is recommended to preserve fertility. However, the risk of reintroducing residual metastatic tumor cells should be evaluated before fertility restoration. Our goal was to validate a sensitive and specific approach for EWS minimal residual disease (MRD) detection in frozen germinal tissues. Thawed OT (n = 12) and TT (n = 14) were contaminated with tumor RD-ES cells (10, 100, and 1000 cells) and EWS-FLI1 tumor-specific transcript was quantified with RT-qPCR. All contaminated samples were found to be positive, with a strong correlation between RD-ES cell numbers and EWS-FLI1 levels in OT (r = 0.93) and TT (r = 0.96) (p < 0.001). No transcript was detected in uncontaminated control samples. The invasive potential of Ewing cells was evaluated using co-culture techniques. After co-culturing, tumor cells were detected in OT/TT with histology, FISH, and RT-qPCR. In addition, four OT and four TT samples from children with metastatic EWS were tested, and no MRD was found using RT-qPCR and histology. We demonstrated the high sensitivity and specificity of RT-qPCR to detect EWS MRD in OT/TT samples. Clinical trial: NCT 02400970. Full article
(This article belongs to the Special Issue Ewing Sarcoma)
Show Figures

Figure 1

Figure 1
<p>Ewing sarcoma (EWS)-FLI1 transcripts detection in ovarian tissue (<span class="html-italic">n</span> = 12). Relative quantification of <span class="html-italic">EWS-FLI1</span> transcripts (B2M reference gene) for the contamination with 0, 10, 100 and 1000 cells. Each symbol represents one ovarian fragment (the average of the duplicates for 1000 cells or triplicates for 10 and 100 cells). The symbol ** means there was a significant difference and <span class="html-italic">p</span> &lt; 0.001.</p>
Full article ">Figure 2
<p>EWS-FLI1 transcripts detection in testicular tissue (<span class="html-italic">n</span> = 14). Relative quantification of <span class="html-italic">EWS-FLI1</span> transcripts (B2M reference gene) for the contamination with 0, 10, 100, and 1000 cells. Each symbol represents one testicular fragment (the average of the duplicates for 1000 cells or triplicates for 10 and 100 cells). The symbol ** means there was a significant difference and <span class="html-italic">p</span> &lt; 0.001.</p>
Full article ">Figure 3
<p>Sensitivity (SE) and specificity (SP) of detection to distinguish 10 and 100 Ewing cells, and 100 and 1000 Ewing cells in ovarian tissue: (<b>a</b>) The AUC (area under the curve, ROC curve) was 0.94 CI 95% [0.86–1.00] to distinguish 10 and 100 Ewing cells. The optimal decision threshold, determined using Liu and Youden indexes, to distinguish between 10 and 100 EWS cells was 354 EWS-FLI1 transcripts with a sensitivity (SE) of 95% and a specificity (SP) of 86% (in red). For maximal SE (100%) and SP (100%), the cut-offs were 319 and 1150 EWS-FLI1 transcripts, respectively. (<b>b</b>) The area under the curve (AUC) was 0.97 CI 95% [0.92–1.00] between 100 and 1000 Ewing cells. To distinguish between 100 and 1000 EWS cells, the optimal decision threshold determined using Liu and Youden indexes was 3998 EWS-FLI1 transcripts with a SE of 100% and SP of 86% (in red). For a maximal SP (100%), the cut-off was 5528 EWS-FLI1 transcripts.</p>
Full article ">Figure 4
<p>Sensitivity and specificity of detection to distinguish 10 and 100 EWS cells, and 100 and 1000 EWS cells in testicular tissue: (<b>a</b>) The AUC was 0.98 CI 95% [0.94–1.00] to characterize 10 and 100 EWS cells. The thresholds to distinguish between 10 and 100 EWS cells were 642 EWS-FLI1 transcripts (Liu and Youden indexes, SE = 92% and SP = 95%) (in red), 521 EWS-FLI1 transcripts for SE = 100% and 749 EWS-FLI1 transcripts for SP = 100%. (<b>b</b>) The AUC was 0.99 CI 95% [0.98–1.00] between 100 and 1000 EWS cells. The cut-offs to distinguish between 100 and 1000 EWS were 3172 EWS-FLI1 transcripts (Liu and Youden indexes, SE = 93% and SP = 100%) (in red) and 2170 EWS-FLI1 transcripts for SE = 100%.</p>
Full article ">Figure 5
<p>Illustrations of histology: ovarian tissue (OT) after co-culture with RD-ES cells (at day 7); (<b>a</b>) RD-ES cells (arrow) localized in OT after co-culture stained with hematoxylin and eosin (×10); (<b>b</b>) Area with RD-ES cells disseminated in OT (×20); (<b>c</b>) Area with ovarian follicle (×20).</p>
Full article ">Figure 5 Cont.
<p>Illustrations of histology: ovarian tissue (OT) after co-culture with RD-ES cells (at day 7); (<b>a</b>) RD-ES cells (arrow) localized in OT after co-culture stained with hematoxylin and eosin (×10); (<b>b</b>) Area with RD-ES cells disseminated in OT (×20); (<b>c</b>) Area with ovarian follicle (×20).</p>
Full article ">Figure 6
<p>Illustrations of histology and immunohistochemistry: RD-ES cells (black arrow) localized in testicular tissue (TT) after co-culture (at day 14) on insert; (<b>a</b>) TT in insert stained with hematoxylin and eosin (×20); (<b>b</b>) ERG-positive staining of RD-ES cells (×20).</p>
Full article ">Figure 7
<p>Fluorescence in situ hybridization (FISH) analysis of ovarian tissue using EWSR1 (22q12) dual color break apart rearrangement probe (Vysis) showing RD-ES cells invasion (white arrows) after co-culture (at day 14) (×80). RD-ES cells displayed one fusion (yellow signal), and the simultaneous split pattern of one orange and one green signal (arrows), indicative of a rearrangement of one copy of the EWSR1 gene. The fusion gene is detected by a yellow signal, corresponding to co-localization of the red and green probes.</p>
Full article ">
12 pages, 1688 KiB  
Article
Complex Formation with Monomeric α-Tubulin and Importin 13 Fosters c-Jun Protein Stability and Is Required for c-Jun’s Nuclear Translocation and Activity
by Melanie Kappelmann-Fenzl, Silke Kuphal, Rosemarie Krupar, Dirk Schadendorf, Viktor Umansky, Lily Vardimon, Claus Hellerbrand and Anja-Katrin Bosserhoff
Cancers 2019, 11(11), 1806; https://doi.org/10.3390/cancers11111806 - 17 Nov 2019
Cited by 6 | Viewed by 3893
Abstract
Microtubules are highly dynamic structures, which consist of α- and β-tubulin heterodimers. They are essential for a number of cellular processes, including intracellular trafficking and mitosis. Tubulin-binding chemotherapeutics are used to treat different types of tumors, including malignant melanoma. The transcription factor c-Jun [...] Read more.
Microtubules are highly dynamic structures, which consist of α- and β-tubulin heterodimers. They are essential for a number of cellular processes, including intracellular trafficking and mitosis. Tubulin-binding chemotherapeutics are used to treat different types of tumors, including malignant melanoma. The transcription factor c-Jun is a central driver of melanoma development and progression. Here, we identify the microtubule network as a main regulator of c-Jun activity. Monomeric α-tubulin fosters c-Jun protein stability by protein–protein interaction. In addition, this complex formation is necessary for c-Jun’s nuclear localization sequence binding to importin 13, and consequent nuclear import and activity of c-Jun. A reduction in monomeric α-tubulin levels by treatment with the chemotherapeutic paclitaxel resulted in a decline in the nuclear accumulation of c-Jun in melanoma cells in an experimental murine model and in patients’ tissues. These findings add important knowledge to the mechanism of the action of microtubule-targeting drugs and indicate the newly discovered regulation of c-Jun by the microtubule cytoskeleton as a novel therapeutic target for melanoma and potentially also other types of cancer. Full article
Show Figures

Figure 1

Figure 1
<p>Microtubule-targeting drugs (paclitaxel and nocodazole) affect activator protein 1 (AP-1) activity in melanoma cells in vitro and in vivo. (<b>a</b>) Analyses of AP-1 luciferase reporter gene activity of human melanoma cells Mel Juso, Mel Ju, and Mel Im after treatment with the microtubule-stabilizing agent paclitaxel (PX; 5 µM) or nocodazole (NX; 30 µM), an agent promoting disruption of microtubule assembly. Control cells (ctrl) were treated with solvent DMSO (Dimethyl sulfoxide). (<b>b</b>) Electrophoretic mobility shift assays (EMSA) with nuclear extracts of PX or NX treated Mel Ju cells using the classical AP-1 consensus sequence (Oligo). Supershift experiments with an anti-c-Jun antibody demonstrate the direct involvement of c-Jun in the AP-1–DNA-binding complex. (<b>c</b>) Western blot analyses and densitometry of c-Jun in nuclear extracts of PX and NX treated Mel Juso cells and control cells (ctrl). Histone H2A was used as the loading control. (<b>d</b>,<b>e</b>) AP-1 luciferase reporter gene activity in (<b>d</b>) PX and (<b>e</b>) NX treated Hmb2-5 cells transfected with a c-Jun expression plasmid (c-Jun) or empty vector (pCDNA3; ctrl). (<b>f</b>) Immunohistochemical analyses of c-jun in melanoma tissues from <span class="html-italic">ret</span> transgenic mice (<span class="html-italic">n</span> = 3) after the treatment with PX (15 mg/kg) or PBS (ctrl). PX application was performed at day 0 and 5, and mice were sacrificed on day 7. (<b>g</b>) Immunohistochemical analyses of c- Jun in melanoma tissues from five patients before and after PX treatment. (<b>f</b>,<b>g</b>) The right panels depict the quantification (mean ± s.e.m.) of c-Jun positive nuclei per viewing field. (*: <span class="html-italic">p &lt;</span> 0.05; ns: not significant).</p>
Full article ">Figure 2
<p>c-Jun protein interacts with TUB1A (Tubulin alpha chain) in melanoma cells and TUB1A affects AP-1 activity and stabilizes c-Jun protein. (<b>a</b>,<b>b</b>) Immunoprecipitation (IP) analyses of melanoma cell (Mel Juso, Mel Ju) lysates revealed co-precipitation of TUB1A with an (<b>a</b>) anti-c-Jun antibody and vice versa, (<b>b</b>) c-Jun with anti-TUB1A antibody. (<b>c</b>) Immunofluorescence analyses showed co-localization (white arrows) of c-Jun (red) and TUB1A (green) in the cytoplasm of melanoma cells. (<b>d</b>) Western blot analyses and densitometry of c-Jun and TUB1A in whole cell lysates of Mel Juso cells after TUB1A si-RNA (siTub1A) or control si-RNA (sictrl) transfection. GAPDH (Glyceraldehyde-3-Phosphate Dehydrogenase) was used as a loading control. The bar graph depicts the quantification of protein amounts (mean ± s.d.) of three independent experiments. (<b>e</b>) Analyses of c-Jun protein expression in TUB1A-suppressed (siTub1A) and control (sictrl) Mel Juso cells after cycloheximide (CHX) treatment showed a faster decline of c-Jun levels in siTub1A compared to control cells. The bar graph (mean ± s.d. of three western blot analyses) depicts c-Jun levels normalized to GAPDH. (<b>f</b>) Western blot analyses and densitometry of nuclear extracts of Mel Juso cells showed lower c-Jun protein levels in TUB1A-suppressed (siTub1A) compared to control (sictrl) cells. The bar graph depicts c-Jun levels of three western blot analyses relative to LAMIN (Lamin A/C), which was used as a loading control. (<b>g</b>) AP-1 luciferase reporter gene analyses showed reduced AP-1 activity in TUB1A-suppressed (siTub1A) Mel Juso cells compared to control (sictrl) cells. Bars show the means ± s.d. of three independent experiments; measurements were performed in replicates. (*: <span class="html-italic">p &lt;</span> 0.05).</p>
Full article ">Figure 3
<p>Stabilization of c-Jun by TUB1A influences nuclear import of c-Jun by IPO13. (<b>a</b>) AP-1 luciferase reporter gene activity in Mel Juso cells with si-RNA mediated suppression of several importins (siIPO7, siIPO8, siIPO9, siIPO13, siIPOβ) and cells transfected with control si-RNA (sictrl). The bar graph shows the means ± s.d. of three independent experiments. (*: <span class="html-italic">p &lt;</span> 0.05 compared to sictrl; ns: not significant). (<b>b</b>,<b>c</b>) Analyses of c-Jun protein levels in (<b>b</b>) nuclear extracts and (<b>c</b>) whole cell extracts of melanoma cells with IPO13 suppression (siIPO13) and control cells (sictrl) by western blot and densitometry. GAPDH or LAMIN served as loading controls. (<b>d</b>–<b>f</b>) Immunoprecipitation (IP) analyses of whole cell lysates from Mel Juso and Mel Ju cells performing co-precipitation of (<b>d</b>) IPO13 using an anti-c-Jun antibody, (<b>e</b>) TUB1A using an anti-IPO13 antibody, and (<b>f</b>) IPO13 using an anti-TUB1A antibody. (<b>g</b>) Co-IP of Mel Juso cell lysates with si-RNA mediated suppression of TUB1A (siTub1A) or IPO13 (siIPO13) and sictrl using an anti-c-Jun-antibody. (<b>h</b>) Co-IP of extracts from Hmb2-5 cells transfected with wildtype JUN nuclear localization sequence (Jun NLS WT) or a Jun plasmid with mutated NLS (Jun NLS Mut) applying anti-TUB1A- or anti-IPO13-antibodies. Depicted are western blots using an anti-HA-tagged antibody for c-Jun detection. (<b>i</b>) Western blot analyses and densitometry showing the expression of HA-tagged c-Jun in Hmb2-5 protein lysates after transfection with Jun WT NLS or Jun MUT NLS. β-Actin served as a loading control. (<b>j</b>) Western blot analyses and densitometry showing the expression of HA-tagged c-Jun in Hmb2-5 nuclear extracts after transfection with Jun WT NLS or Jun MUT NLS. LAMIN served as a loading control. (<b>k</b>) AP-1 luciferase reporter gene activity of Hmb2-5 cells after transfection with Jun NLS WT or Jun NLS Mut. Bar graph shows the means ± s.d. of three independent experiments. (*: <span class="html-italic">p &lt;</span> 0.05).</p>
Full article ">Figure 4
<p>Schematic overview of the c-Jun/TUB1A/IPO13 complex in melanoma cells. Monomeric α-tubulin (TUB1A) stabilizes the transcription factor c-Jun for nuclear transport via importin 13 (IPO13). The complex assembly of c- Jun, TUB1A, and IPO13 occurs in a nuclear localization sequence (NLS)- dependent manner, however, TUB1A remains in the cytoplasm whereas c-Jun translocates into the nucleus via IPO13, and hence, affects AP-1 activity in melanoma cells.</p>
Full article ">
15 pages, 3082 KiB  
Article
Imaging Collagen Alterations in STICs and High Grade Ovarian Cancers in the Fallopian Tubes by Second Harmonic Generation Microscopy
by Eric C. Rentchler, Kristal L. Gant, Ronny Drapkin, Manish Patankar and Paul J. Campagnola
Cancers 2019, 11(11), 1805; https://doi.org/10.3390/cancers11111805 - 16 Nov 2019
Cited by 19 | Viewed by 3912
Abstract
The majority of high-grade serous ovarian cancers originate in the fallopian tubes, however, the corresponding structural changes in the extracellular matrix (ECM) have not been well-characterized. This information could provide new insight into the carcinogenesis and provide the basis for new diagnostic tools. [...] Read more.
The majority of high-grade serous ovarian cancers originate in the fallopian tubes, however, the corresponding structural changes in the extracellular matrix (ECM) have not been well-characterized. This information could provide new insight into the carcinogenesis and provide the basis for new diagnostic tools. We have previously used the collagen-specific Second Harmonic Generation (SHG) microscopy to probe collagen fiber alterations in high-grade serous ovarian cancer and in other ovarian tumors, and showed they could be uniquely identified by machine learning approaches. Here we couple SHG imaging of serous tubal intra-epithelial carcinomas (STICs), high-grade cancers, and normal regions of the fallopian tubes, using three distinct image analysis approaches to form a classification scheme based on the respective collagen fiber morphology. Using a linear discriminant analysis, we achieved near 100% classification accuracy between high-grade disease and the other tissues, where the STICs and normal regions were differentiated with ~75% accuracy. Importantly, the collagen in high-grade disease in both the fallopian tube and the ovary itself have a similar collagen morphology, further substantiating the metastasis between these sites. This analysis provides a new method of classification, but also quantifies the structural changes in the disease, which may provide new insight into metastasis. Full article
(This article belongs to the Special Issue Ovarian Cancer Metastasis)
Show Figures

Figure 1

Figure 1
<p>Corresponding Second Harmonic Generation (SHG) forward- and backward-collected images of a high-grade cancer in the fallopian tube, showing different image features.</p>
Full article ">Figure 2
<p>Histology and p53 stained slides were used to select regions of interest for SHG imaging. p53 stains for TP53 mutations, which are indicative of serous tubal intra-epithelial carcinomas (STIC) areas. The top row shows the H&amp;E stain, p53 stain and SHG from the same STIC region. The bottom row shows examples of SHG images of distal, STIC, and high-grade disease in the FT used in the image analysis. Scale bar = 50 microns.</p>
Full article ">Figure 3
<p>Bar plots of the mean value for each group in all five (forward and backward) of the textures calculated in the GLCM analysis. (*) and (**) correspond to <span class="html-italic">p</span> &lt; 0.05 and <span class="html-italic">p</span> &lt; 0.001, respectively.</p>
Full article ">Figure 4
<p>Workflow of the fast fourier transform (FFT) analysis. (<b>A</b>) starting image, (<b>B</b>) FFT of (<b>A</b>) produced in ImageJ. Two different approaches are then utilized to analyze the log-scale FFT. (<b>C</b>) Radial sums of the FFT produce the resulting intensity plot (<b>D</b>). (<b>E</b>) Circular sums of the FFT produce a curve (<b>F</b>) which is then fit with a single exponential decay. Field size = 150 × 150 µm.</p>
Full article ">Figure 5
<p>Bar plots of the mean value for each group in all four of the outputs calculated in the 2D-FFT analysis. (*) and (**) correspond to <span class="html-italic">p</span> &lt; 0.05 and <span class="html-italic">p</span> &lt; 0.001, respectively.</p>
Full article ">Figure 6
<p>Bar plots of the mean value for each group in all three of the outputs calculated in the CT-FIRE analysis. (*) and (**) correspond to <span class="html-italic">p</span> &lt; 0.05 and <span class="html-italic">p</span> &lt; 0.001, respectively.</p>
Full article ">Figure 7
<p>The canonical variables resulting from the CANDISC procedure using 24 (<b>a</b>) and 12 (<b>b</b>)variables. The results of the DISCRIM procedure are given in the accompanying table. Solid and dashed circles are 95% and 80% confidences, respectively. The full set of 24 metrics performed better than the reduced set of 12.</p>
Full article ">Figure 8
<p>Receiver operator characteristic (ROC) curves for classification accuracy, where (<b>a</b>) and (<b>b</b>) are one vs. the rest and cohort accuracy, respectively.</p>
Full article ">Figure 9
<p>A. The CANDISC and DISCRIM results from each image analysis separately, where (<b>a</b>) is GLCM, (<b>b</b>) 2D-FFT, and (<b>c</b>) CT-FIRE results.</p>
Full article ">Figure 10
<p>Comparison of single second harmonic generation (SHG) optical sections collected in the forward direction for HGSOC in the ovary (<b>left</b>) and fallopian tube (<b>right</b>). A similar high-frequency fiber characteristic is seen in both tissues. The SHG in the ovarian image is brighter due to denser collagen.</p>
Full article ">
16 pages, 1580 KiB  
Article
Penetrance of the TP53 R337H Mutation and Pediatric Adrenocortical Carcinoma Incidence Associated with Environmental Influences in a 12-Year Observational Cohort in Southern Brazil
by Tatiana E. J. Costa, Viviane K. Q. Gerber, Humberto C. Ibañez, Viviane S. Melanda, Ivy Z. S. Parise, Flora M. Watanabe, Mara A. D. Pianovski, Carmem M. C. M. Fiori, Ana L. M. R. Fabro, Denise B. da Silva, Diancarlos P. Andrade, Heloisa Komechen, Monalisa C. Mendes, Edna Carboni, Ana Paula Kuczynski, Emanuelle N. Souza, Mariana M. Paraizo, Marilea V. C. Ibañez, Laura M. Castilho, Amanda F. Cruz, Thuila F. da Maia, Cleber Machado-Souza, Roberto Rosati, Claudia S. Oliveira, Guilherme A. Parise, Jaqueline D. C. Passos, José R. S. Barbosa, Mirna M. O. Figueiredo, Leniza Lima, Tiago Tormen, Cesar C. Sabbaga, Sylvio G. A. Ávilla, Leila Grisa, Airton Aranha, Karina C. F. Tosin, Karin R. P. Ogradowski, Geneci Lima, Edith F. Legal, Tania H. Anegawa, Tânia L. Mazzuco, André L. Grion, José H. G. Balbinotti, Karin L. Dammski, Rosiane G. Melo, Nilton Kiesel Filho, Gislaine Custódio and Bonald C. Figueiredoadd Show full author list remove Hide full author list
Cancers 2019, 11(11), 1804; https://doi.org/10.3390/cancers11111804 - 16 Nov 2019
Cited by 13 | Viewed by 4023
Abstract
The TP53 R337H mutation is associated with increased incidence of pediatric adrenocortical tumor (ACT). The different environmental conditions where R337H carriers live have not been systematically analyzed. Here, the R337H frequencies, ACT incidences, and R337H penetrance for ACT were calculated using the 2006 [...] Read more.
The TP53 R337H mutation is associated with increased incidence of pediatric adrenocortical tumor (ACT). The different environmental conditions where R337H carriers live have not been systematically analyzed. Here, the R337H frequencies, ACT incidences, and R337H penetrance for ACT were calculated using the 2006 cohort with 4165 R337H carriers living in Paraná state (PR) subregions. The effectiveness of a second surveillance for R337H probands selected from 42,438 tested newborns in PR (2016 cohort) was tested to detect early stage I tumor among educated families without periodical exams. Estimation of R337H frequencies and ACT incidence in Santa Catarina state (SC) used data from 50,115 tested newborns without surveillance, ACT cases from a SC hospital, and a public cancer registry. R337H carrier frequencies in the population were 0.245% (SC) and 0.306% (PR), and 87% and 95% in ACTs, respectively. The ACT incidence was calculated as ~6.4/million children younger than 10 years per year in PR (95% CI: 5.28; 7.65) and 4.15/million in SC (CI 95%: 2.95; 5.67). The ACT penetrance in PR for probands followed from birth to 12 years was 3.9%. R337H carriers living in an agricultural subregion (C1) had a lower risk of developing pediatric ACT than those living in industrial and large urban subregion (relative risk = 2.4). One small ACT (21g) without recurrence (1/112) was detected by the parents in the 2016 cohort. ACT incidence follows R337H frequency in each population, but remarkably environmental factors modify these rates. Full article
(This article belongs to the Special Issue Adrenocortical Carcinoma)
Show Figures

Figure 1

Figure 1
<p>(<b>A</b>) R337H frequencies among newborns from 22 Paraná Administrative Health Regions (AHRs) and (<b>B</b>) from 16 Santa Catarina AHRs (stored blood collected in 2013–2014). AHRs are represented by bold italic numbers.</p>
Full article ">Figure 2
<p>The R337H frequencies (population versus ACT) and the obtained linear regression (LR) based on the overall averages for each state (SP, Paraná state (PR), and Santa Catarina (SC)). The blue straight line was obtained by simple LR using the method of least squares weighted by the number of individuals tested in each state, assuming equal weights for the considered variables. The shaded area represents the 95% confidence interval of the line assuming the normality of the errors.</p>
Full article ">Figure 3
<p>ACT-free probability in the 2006-C cohort.</p>
Full article ">
17 pages, 1730 KiB  
Review
CD147 Is a Promising Target of Tumor Progression and a Prognostic Biomarker
by Alexandra Landras, Coralie Reger de Moura, Fanelie Jouenne, Celeste Lebbe, Suzanne Menashi and Samia Mourah
Cancers 2019, 11(11), 1803; https://doi.org/10.3390/cancers11111803 - 16 Nov 2019
Cited by 87 | Viewed by 9576
Abstract
Microenvironment plays a crucial role in tumor development and progression. Cancer cells modulate the tumor microenvironment, which also contribute to resistance to therapy. Identifying biomarkers involved in tumorigenesis and cancer progression represents a great challenge for cancer diagnosis and therapeutic strategy development. CD147 [...] Read more.
Microenvironment plays a crucial role in tumor development and progression. Cancer cells modulate the tumor microenvironment, which also contribute to resistance to therapy. Identifying biomarkers involved in tumorigenesis and cancer progression represents a great challenge for cancer diagnosis and therapeutic strategy development. CD147 is a glycoprotein involved in the regulation of the tumor microenvironment and cancer progression by several mechanisms—in particular, by the control of glycolysis and also by its well-known ability to induce proteinases leading to matrix degradation, tumor cell invasion, metastasis and angiogenesis. Accumulating evidence has demonstrated the role of CD147 expression in tumor progression and prognosis, suggesting it as a relevant tumor biomarker for cancer diagnosis and prognosis, as well as validating its potential as a promising therapeutic target in cancers. Full article
(This article belongs to the Special Issue New Biomarkers in Cancers)
Show Figures

Figure 1

Figure 1
<p>Schematic presentation of CD147 structure. CD147 consists of 269 amino acids (aa) and composed of a signal domain, an extracellular domain, a transmembrane domain and a cytoplasmic domain. CD147 contains three Asparagine (Asn) sites of glycosylation.</p>
Full article ">Figure 2
<p>Schematic overview of CD147 associated partner, molecular pathway and microenvironment interaction involved in cancer progression.</p>
Full article ">
28 pages, 871 KiB  
Review
Long Non-Coding RNA: Dual Effects on Breast Cancer Metastasis and Clinical Applications
by Qi-Yuan Huang, Guo-Feng Liu, Xian-Ling Qian, Li-Bo Tang, Qing-Yun Huang and Li-Xia Xiong
Cancers 2019, 11(11), 1802; https://doi.org/10.3390/cancers11111802 - 16 Nov 2019
Cited by 41 | Viewed by 4738
Abstract
As a highly heterogeneous malignancy, breast cancer (BC) has become the most significant threat to female health. Distant metastasis and therapy resistance of BC are responsible for most of the cases of mortality and recurrence. Distant metastasis relies on an array of processes, [...] Read more.
As a highly heterogeneous malignancy, breast cancer (BC) has become the most significant threat to female health. Distant metastasis and therapy resistance of BC are responsible for most of the cases of mortality and recurrence. Distant metastasis relies on an array of processes, such as cell proliferation, epithelial-to-mesenchymal transition (EMT), mesenchymal-to-epithelial transition (MET), and angiogenesis. Long non-coding RNA (lncRNA) refers to a class of non-coding RNA with a length of over 200 nucleotides. Currently, a rising number of studies have managed to investigate the association between BC and lncRNA. In this study, we summarized how lncRNA has dual effects in BC metastasis by regulating invasion, migration, and distant metastasis of BC cells. We also emphasize that lncRNA has crucial regulatory effects in the stemness and angiogenesis of BC. Clinically, some lncRNAs can regulate chemotherapy sensitivity in BC patients and may function as novel biomarkers to diagnose or predict prognosis for BC patients. The exact impact on clinical relevance deserves further study. This review can be an approach to understanding the dual effects of lncRNAs in BC, thereby linking lncRNAs to quasi-personalized treatment in the future. Full article
Show Figures

Figure 1

Figure 1
<p>LncRNAs and prognosis of BC patients. Here both up-regulated lncRNA in BC tissue (HOTAIR, TINCR, LIP1, MALAT1, and LINC000473) and circulating lncRNA in plasma (HOTAIR, H19, and GAS5) predict poor prognosis of BC patients. The red or white up arrows respectively refer to up-regulation of the relevant lncRNA in BC patients’ tissue or plasma.</p>
Full article ">Figure 2
<p>LncRNAs as biomarkers for diagnosis and prognosis of TNBC patients. Up-regulated expression of DANCR, NAMPT-AS, ATB, and HIF1A-AS2 predict poor prognosis of TNBC patients. Down-regulated expression of MIR503HG predicts poor prognosis of TNBC patients. Red up arrows refer to up-regulation of the relevant lncRNA. Blue down arrows refer to down-regulation of the relevant lncRNA.</p>
Full article ">
17 pages, 275 KiB  
Article
Efficacy of Cancer Immunotherapy: An Umbrella Review of Meta-Analyses of Randomized Controlled Trials
by Jong Yeob Kim, Keum Hwa Lee, Michael Eisenhut, Hans J. van der Vliet, Andreas Kronbichler, Gwang Hun Jeong, Jae Il Shin and Gabriele Gamerith
Cancers 2019, 11(11), 1801; https://doi.org/10.3390/cancers11111801 - 15 Nov 2019
Cited by 15 | Viewed by 4298
Abstract
We conducted a systematic review for evidence of the clinical efficacy of cancer immunotherapies. We searched PubMed from inception to 14 February 2018 for meta-analyses of randomized controlled trials (RCTs) of cancer immunotherapies. Re-analyses were performed to estimate the summary effect size under [...] Read more.
We conducted a systematic review for evidence of the clinical efficacy of cancer immunotherapies. We searched PubMed from inception to 14 February 2018 for meta-analyses of randomized controlled trials (RCTs) of cancer immunotherapies. Re-analyses were performed to estimate the summary effect size under random-effects, the 95% confidence interval (CI), heterogeneity, and the 95% prediction interval, and we determined the strength of the evidence. We examined publication bias and excess significance bias. 63 articles corresponding to 247 meta-analyses were eligible. Nine meta-analyses were classified to have convincing evidence, and 75 were classified as suggestive evidence. The clinical benefit of immunotherapy was supported by convincing evidence in the following settings: anti-PD-1/PD-L1 monoclonal antibody (mAb) therapy for treating advanced melanoma and non-small cell lung cancer (NSCLC), the combination of rituximab and chemotherapy for treating chronic lymphocytic leukemia and B-cell non-Hodgkin’s lymphoma, adoptive cell immunotherapy for NSCLC, and the combination of interferon α and chemotherapy for metastatic melanoma. A further meta-analysis of 16 RCTs showed that anti-PD-1/PD-L1 mAb therapy had a benefit in patients with solid tumors (overall survival; hazard ratio = 0.73, 95% CI: 0.68–0.79; p < 0.001), supported by convincing evidence. In the future, rigorous approaches are needed when interpreting meta-analyses to gain better insight into the true efficacy of cancer immunotherapy. Full article
16 pages, 9975 KiB  
Review
Mouse Models for Immunotherapy in Hepatocellular Carcinoma
by Enya Li, Li Lin, Chia-Wei Chen and Da-Liang Ou
Cancers 2019, 11(11), 1800; https://doi.org/10.3390/cancers11111800 - 15 Nov 2019
Cited by 23 | Viewed by 13767
Abstract
Liver cancer is one of the dominant causes of cancer-related mortality, and the survival rate of liver cancer is among the lowest for all cancers. Immunotherapy for hepatocellular carcinoma (HCC) has yielded some encouraging results, but the percentage of patients responding to single-agent [...] Read more.
Liver cancer is one of the dominant causes of cancer-related mortality, and the survival rate of liver cancer is among the lowest for all cancers. Immunotherapy for hepatocellular carcinoma (HCC) has yielded some encouraging results, but the percentage of patients responding to single-agent therapies remains low. Therefore, potential directions for improved immunotherapies include identifying new immune targets and checkpoints and customizing treatment procedures for individual patients. The development of combination therapies for HCC is also crucial and urgent and, thus, further studies are required. Mice have been utilized in immunotherapy research due to several advantages, for example, being low in cost, having high success rates for inducing tumor growth, and so on. Moreover, immune-competent mice are used in immunotherapy research to clarify the role that the immune system plays in cancer growth. In this review paper, the advantages and disadvantages of mouse models for immunotherapy, the equipment that are used for monitoring HCC, and the cell strains used for inducing HCC are reviewed. Full article
(This article belongs to the Special Issue Models of Experimental Liver Cancer)
Show Figures

Figure 1

Figure 1
<p>Murine models for immunotherapy studies of HCC. (<b>A</b>) Syngeneic mouse models: Mouse tumor cells are implanted in immune-competent mice. (<b>B</b>) Chemotoxic agent mouse models: Chemicals are administered to induce HCC growth. (<b>C</b>) Genetically engineered mouse models: Tumor suppressor gene deletion or oncogene activation is built into mice. (<b>D</b>) Human cell line and patient-derived xenograft in humanized mouse models: Human peripheral blood mononuclear cells (PBMC) or human CD34<sup>+</sup> cells are given to immunodeficient mice. (PDX, patient-derived xenografts; Hu-PBL, PBMC-humanized mouse model; HSC, hematopoietic stem cells).</p>
Full article ">Figure 2
<p>Equipment or methods used for in vivo tumor monitoring. Micro-PET, Micro-CT, MRI, ultrasound, and bioluminescence are the commonly used methods for monitoring tumors non-invasively. Besides the imaging of tumors and surrounding tissues that they can provide, based on their imaging mechanism, other parameters can be provided to determine the status of a tumor. For example, the blood flow and the hypoxic regions can be used to identify the degree of angiogenesis in a tumor. Biopsy (and liquid biopsy) are also methods used for monitoring tumors, with analysis of the cells (tumor or immune cells), proteins, DNA, or any detectable tumor-related marker being used to understand or predict the tumor condition.</p>
Full article ">
23 pages, 3598 KiB  
Article
Blocking Activin Receptor Ligands Is Not Sufficient to Rescue Cancer-Associated Gut Microbiota—A Role for Gut Microbial Flagellin in Colorectal Cancer and Cachexia?
by Satu Pekkala, Anniina Keskitalo, Emilia Kettunen, Sanna Lensu, Noora Nykänen, Teijo Kuopio, Olli Ritvos, Jaakko Hentilä, Tuuli A. Nissinen and Juha J. Hulmi
Cancers 2019, 11(11), 1799; https://doi.org/10.3390/cancers11111799 - 15 Nov 2019
Cited by 9 | Viewed by 4461
Abstract
Colorectal cancer (CRC) and cachexia are associated with the gut microbiota and microbial surface molecules. We characterized the CRC-associated microbiota and investigated whether cachexia affects the microbiota composition. Further, we examined the possible relationship between the microbial surface molecule flagellin and CRC. CRC [...] Read more.
Colorectal cancer (CRC) and cachexia are associated with the gut microbiota and microbial surface molecules. We characterized the CRC-associated microbiota and investigated whether cachexia affects the microbiota composition. Further, we examined the possible relationship between the microbial surface molecule flagellin and CRC. CRC cells (C26) were inoculated into mice. Activin receptor (ACVR) ligands were blocked, either before tumor formation or before and after, to increase muscle mass and prevent muscle loss. The effects of flagellin on C26-cells were studied in vitro. The occurrence of similar phenomena were studied in murine and human tumors. Cancer modulated the gut microbiota without consistent effects of blocking the ACVR ligands. However, continued treatment for muscle loss modified the association between microbiota and weight loss. Several abundant microbial taxa in cancer were flagellated. Exposure of C26-cells to flagellin increased IL6 and CCL2/MCP-1 mRNA and IL6 excretion. Murine C26 tumors expressed more IL6 and CCL2/MCP-1 mRNA than C26-cells, and human CRC tumors expressed more CCL2/MCP-1 than healthy colon sites. Additionally, flagellin decreased caspase-1 activity and the production of reactive oxygen species, and increased cytotoxicity in C26-cells. Conditioned media from flagellin-treated C26-cells deteriorated C2C12-myotubes and decreased their number. In conclusion, cancer increased flagellated microbes that may promote CRC survival and cachexia by inducing inflammatory proteins such as MCP-1. Cancer-associated gut microbiota could not be rescued by blocking ACVR ligands. Full article
(This article belongs to the Special Issue Cancer Cachexia)
Show Figures

Figure 1

Figure 1
<p>Alpha-diversity of the mice gut microbiota samples. (<b>a</b>) Based on average Shannon indices, or (<b>b</b>) Shannon indices shown as sequences per sample, the microbiota of the control (CTRL) samples was significantly less diverse than in the other groups. (<b>c</b>) The average operational taxonomic unit (out) richness and (<b>d</b>) the OTUs shown as sequences per sample of the C26 + PBS group gut microbiota tended to be higher than in other samples. Phosphate buffered saline (PBS), a systemic blocker of activin receptor 2B ligands (sACVR2B), Control (CTRL, <span class="html-italic">n</span> = 9), cancer (C26 + PBS, <span class="html-italic">n</span> = 7), the group that received sACVR2B until tumor formation (C26 + sACVR/b, <span class="html-italic">n</span> = 7), and the group that received sACVR2B until death (C26 + sACVR/c, <span class="html-italic">n</span> = 8). * Denotes statistically significant difference between the groups.</p>
Full article ">Figure 2
<p>Beta-diversity of the mice microbiota samples. No clear differences were visually observed between the groups in principal component analysis (PCA) plot. (<b>a</b>) PCA plot of all groups; (<b>b</b>) PCA plot of groups CTRL and C26 + PBS; (<b>c</b>) PCA plot of groups CTRL and C26 + sACVR/c; (<b>d</b>) PCA plot of groups CTRL and C26 + sACVR/b; (<b>e</b>) PCA plot of groups C26 + sACVR/b and C26 + sACVR/c. Control (CTRL, <span class="html-italic">n</span> = 9), cancer (C26 + PBS, <span class="html-italic">n</span> = 7), the group that received sACVR2B until tumor formation (C26 + sACVR/b, <span class="html-italic">n</span> = 7), and the group that received sACVR2B until death (C26 + sACVR/c, <span class="html-italic">n</span> = 8).</p>
Full article ">Figure 3
<p>The gut microbiota composition of the mice at (<b>a</b>) phylum, (<b>b</b>) family, and (<b>c</b>) genus level. * Denotes significantly differing taxa between the CTRL and C26 + PBS group (False Discovery Rate (FDR) &lt; 0.05). None of the sACVR administration protocols had significant effects (no difference compared to the C26 + PBS group). The gut microbiota compositions at the phylum level are shown on the left side, the family level in the middle, and the genus level on the right side. Control (CTRL, <span class="html-italic">n</span> = 9), cancer (C26 + PBS, <span class="html-italic">n</span> = 7), the group that received sACVR2B until tumor formation (C26 + sACVR/b, <span class="html-italic">n</span> = 7), and the group that received sACVR2B until death (C26 + sACVR/c, <span class="html-italic">n</span> = 8).</p>
Full article ">Figure 4
<p>(<b>a</b>) The body weight change during the last three days before necropsy. (<b>b</b>) Several microbial phyla and genera were associated with the body weight loss, but not significantly in the CTRL and C26 + sACVR/c groups. In the heat map analysis using correlation distance and average linkage, the C26 + PBS and C26 + sACVR/b groups clustered together, indicating that the associations between body weight loss and the gut microbiota in the C26 + PBS and C26 + sACVR/b groups resembled each other and differed from the CTRL and C26 + sACVR/c groups. The FDR-corrected significant associations and differences between the groups in body weight change are marked with asterisks (*). The numeric colored scale bar at upright corner represents the Spearman correlation coefficients. (<b>c</b>) The flagellated gut microbial taxa and their association with the cachectic features of hepatic expression of acute-phase response protein SerpinA3 and white adipose tissue (WAT) mass. Control (CTRL, <span class="html-italic">n</span> = 9), cancer (C26 + PBS, <span class="html-italic">n</span> = 7), the group that received sACVR2B until tumor formation (C26 + sACVR/b, <span class="html-italic">n</span> = 7), and the group that received sACVR2B until death (C26 + sACVR/c, <span class="html-italic">n</span> = 8).</p>
Full article ">Figure 5
<p>Flagellin exposure of C26 cancer cells (<span class="html-italic">n</span> = 4 per treatment) increased inflammation dose-dependently (<b>a</b>) after 4 h and (<b>b</b>) after 24 h. (<b>c</b>) The effects of flagellin on mRNA levels were not affected by blocking CCL2 with neutralizing antibody (anti-CCL2) or (<b>d</b>) TLR5 antagonist TH1020 (<span class="html-italic">n</span> = 4 per treatment). (<b>e</b>) Flagellin exposure increased IL6 excretion from C26 cells that was blocked by CCL2-neutralizing antibody (<span class="html-italic">n</span> = 4 per treatment). * Denotes a statistically significant difference between the groups that are connected with the line. Ctrl, control; FLG, flagellin.</p>
Full article ">Figure 6
<p>(<b>a</b>) Compared to the non-implanted C26 cancer cells, mouse C26 tumors expressed more CCL2 and IL6, independent of the sACVR treatment. The expression of CCL2/MCP-1 in the tumors was associated with the level of MCP-1 in sera. (<b>b</b>) Human CRC tumors (<span class="html-italic">n</span> = 13) expressed more CCL2 than the healthy colon sites. (<b>c</b>) The right-sided tumors (<span class="html-italic">n</span> = 6) tended to have higher expression levels of IL6 and CCL2 than the left-sided tumors (<span class="html-italic">n</span> = 7). * Denotes a statistically significant difference between the groups that are connected with lines. Control (CTRL, <span class="html-italic">n</span> = 9), cancer (C26 + PBS, <span class="html-italic">n</span> = 7), the group that received sACVR2B until tumor formation (C26 + sACVR/b, <span class="html-italic">n</span> = 7), and the group that received sACVR2B until death (C26 + sACVR/c, <span class="html-italic">n</span> = 8).</p>
Full article ">Figure 7
<p>Flagellin (FLG) exposure (<b>a</b>) decreased C26 cancer cell apoptosis, i.e., caspase-1 activity (<span class="html-italic">n</span> = 4 per treatment), but not caspase-8 activity. (<b>b</b>) Flagellin increased cytotoxicity (<span class="html-italic">n</span> = 4 per treatment). (<b>c</b>) Flagellin-induced cytotoxicity was not affected by the Receptor-interacting protein (RIP) kinase inhibitor necrostatin in C26 cells. (<b>d</b>) The expression of the autophagy marker p62 tended to be increased in flagellin-treated C26 cells and CRC tumors compared to controls. (<b>e</b>) Flagellin exposure for 24 h decreased ROS levels in C26 colon cancer cells (<span class="html-italic">n</span> = 4 per treatment). a = statistically significant difference compared to control and * denotes a significant difference between the groups that are connected with lines. FLG = flagellin; TH1020 = TLR5 antagonist; ROS, reactive oxygen species.</p>
Full article ">Figure 8
<p>(<b>a</b>) Compared to the C2C12 murine myotubes growing in normal differentiation media and (<b>b</b>) conditioned media of the C26 cells with control challenge, (<b>c</b>) the conditioned media of the flagellin-challenged C26 cells deteriorated and dedifferentiated the multinucleated myotubes into mononucleated myoblasts after 48 h of exposure. The images are hematoxylin &amp; eosin stainings at 4× magnification. The scale bar is 0.5 mm. Red arrows point to the field where myotubes are detached. Yellow arrows point to areas where the myotubes are dedifferentiated. (<b>d</b>) Compared to the exposure with the conditioned media of vehicle-treated C26 cells (control), the media of flagellin-treated cells decreased the number of C2C12 myotubes after 72 h of exposure. The scoring of myotubes vs. dedifferentiated myoblasts was based on whether they were multinucleated or mononucleated, respectively. The number of myotubes in each coverslip was counted manually using three to five (depending on the extent of detachment of myotubes) random fields that with 4× magnification, which practically covered the entire coverslip. CM = conditioned media. * Denotes statistically significant difference.</p>
Full article ">Figure 9
<p>(<b>a</b>) In murine livers, no differences between the groups were found in the expression of M2-type macrophage marker Arginase-1. (<b>b</b>) Cd11b+ was found in 66% of the human tumors, with a greater prevalence in left-sided than right-sided tumors, and Arginase-1 was detected in 30% of the tumors. (<b>c</b>) Flagellin exposure started to decrease the number of THP-1 cells after 24 h, resulting in increased cytotoxicity at 72 h that was not affected by necrostatin. The blots were cut horizontally into two parts to analyze Arginase-1 and Cd11b from the same run. The original blots and the quantified intensities of the bands are provided in the <a href="#app1-cancers-11-01799" class="html-app">Supplemental file</a>. * Denotes a statistically significant difference between the groups that are connected with line. FLG = flagellin; control (CTRL, <span class="html-italic">n</span> = 9), cancer (C26 + PBS, <span class="html-italic">n</span> = 7), the group that received sACVR2B until tumor formation (C26 + sACVR/b, <span class="html-italic">n</span> = 7), and the group that received sACVR2B until death (C26 + sACVR/c, <span class="html-italic">n</span> = 8).</p>
Full article ">
21 pages, 2065 KiB  
Article
Tumor Mutational Burden and Efficacy of Immune Checkpoint Inhibitors: A Systematic Review and Meta-Analysis
by Jong Yeob Kim, Andreas Kronbichler, Michael Eisenhut, Sung Hwi Hong, Hans J. van der Vliet, Jeonghyun Kang, Jae Il Shin and Gabriele Gamerith
Cancers 2019, 11(11), 1798; https://doi.org/10.3390/cancers11111798 - 15 Nov 2019
Cited by 99 | Viewed by 5761
Abstract
Tumor mutational burden (TMB) is a genomic biomarker that predicts favorable responses to immune checkpoint inhibitors (ICIs). Here, we set out to assess the predictive value of TMB on long-term survival outcomes in patients undergoing ICIs. We systematically searched PubMed, Embase, CENTRAL and [...] Read more.
Tumor mutational burden (TMB) is a genomic biomarker that predicts favorable responses to immune checkpoint inhibitors (ICIs). Here, we set out to assess the predictive value of TMB on long-term survival outcomes in patients undergoing ICIs. We systematically searched PubMed, Embase, CENTRAL and clinicaltrials.gov from inception to 6 August 2019. We included retrospective studies or clinical trials of ICIs that reported hazard ratios (HRs) for overall survival (OS) and/or progression-free survival (PFS) according to TMB. Data on 5712 patients from 26 studies were included. Among patients who received ICIs, high TMB groups showed better OS (HR 0.53, 95% CI 0.42 to 0.67) and PFS (HR 0.52, 95% CI 0.40 to 0.67) compared to low TMB groups. In patients with high TMB, those who received ICIs had a better OS (HR 0.69, 95% CI 0.50 to 0.95) and PFS (HR = 0.66, 95% CI = 0.47 to 0.92) compared to those who received chemotherapy alone, while in patients with low TMB, such ICI benefits of OS or PFS were not statistically significant. In conclusion, TMB may be an effective biomarker to predict survival in patients undergoing ICI treatment. The role of TMB in identifying patient groups who may benefit from ICIs should be determined in future randomized controlled trials. Full article
(This article belongs to the Special Issue Cancer Biomarkers)
Show Figures

Figure 1

Figure 1
<p>Flow of the literature search.</p>
Full article ">Figure 2
<p>Meta-analysis of immune checkpoint inhibitor therapy and overall survival, high TMB group versus low TMB group.</p>
Full article ">Figure 3
<p>Meta-analysis of immune checkpoint inhibitor therapy and progression-free survival, high TMB group versus low TMB group.</p>
Full article ">
19 pages, 2869 KiB  
Article
G-Quadruplex Binders Induce Immunogenic Cell Death Markers in Aggressive Breast Cancer Cells
by Sarah Di Somma, Jussara Amato, Nunzia Iaccarino, Bruno Pagano, Antonio Randazzo, Giuseppe Portella and Anna Maria Malfitano
Cancers 2019, 11(11), 1797; https://doi.org/10.3390/cancers11111797 - 15 Nov 2019
Cited by 19 | Viewed by 3961
Abstract
Background: DNA G-quadruplex (G4) structures represent potential anti-cancer targets. In this study, we compared the effect of two G4-targeting compounds, C066-3108 and the gold standard BRACO-19. Methods: In breast and prostate cancer cells, cytotoxicity induced by both molecules was measured by a sulforhodamine [...] Read more.
Background: DNA G-quadruplex (G4) structures represent potential anti-cancer targets. In this study, we compared the effect of two G4-targeting compounds, C066-3108 and the gold standard BRACO-19. Methods: In breast and prostate cancer cells, cytotoxicity induced by both molecules was measured by a sulforhodamine B assay. In breast cancer cells, cycle, apoptosis, the formation of G4 structures, calreticulin and high mobility group box 1 (HMGB1), as well as T cell activation, were analyzed by flow cytometry and adenosine triphosphate (ATP) by luminescence. Results: Both ligands inhibited cell survival and induced DNA damage. In MCF-7 cells, G4 ligands increased the subG0/G1 phase of the cell cycle inducing apoptosis and reduced intracellular ATP. In untreated MCF-7 cells, we observed a slight presence of G4 structures associated with the G2/M phase. In MDA-MB231 cells, G4 ligands decreased the G1 and enhanced the G2/M phase. We observed a decrease of intracellular ATP, calreticulin cell surface exposure and an increase of HMGB1, accompanied by T cell activation. Both compounds induced G4 structure formation in the subG0/G1 phase. Conclusions: Our data report similar effects for both compounds and the first evidence that G4 ligands induce the release of danger signals associated with immunogenic cell death and induction of T cell activation. Full article
Show Figures

Graphical abstract

Graphical abstract
Full article ">Figure 1
<p>Chemical Structure of C066-3108 and BRACO-19. The chemical structure of C066-3108 and BRACO-19 is reported.</p>
Full article ">Figure 2
<p>Cytotoxic effects of G4 ligands. (<b>A</b>) Cytotoxic effect of G4 ligands determined by SRB assays in MCF-7, MDA-MB231, PC3 and LNCaP cell lines at 72 h of treatment with C066-3108 and BRACO-19 and (<b>B</b>) in MCF-7 and MDA-MB231 cells at six days of treatment. Figures report cell viability (mean of three independent experiments as optical density, O.D.) generated with different concentrations of G4 ligands. The statistical significance was calculated by GraphPad Prism 7 with two-way Analysis of Variance (ANOVA) using Dunnett’s multiple comparisons test (* <span class="html-italic">p</span> &lt; 0.0001, <sup>&amp;</sup> <span class="html-italic">p</span> &lt; 0.005, <sup><span>$</span></sup> <span class="html-italic">p</span> &lt; 0.01). (<b>C</b>) Survival determined by MTT assay of resting and/or PHA-activated PBMC cultured in the presence and in the absence of G4 ligands at the concentrations of 3 and 5 µM for 5 days. Figures report O.D. indicative of cell survival (data are the mean of three independent experiments). No statistical difference was observed with respect to the untreated control as calculated by GraphPad Prism 7.</p>
Full article ">Figure 3
<p>G4 ligands induce DNA damage in breast cancer cells. MCF-7 (<b>A</b>) and MDA-MB231 (<b>B</b>) cells were treated with G4 ligands at the indicated concentrations. The dot plot profiles indicate in the upper fluorescein isothiocyanate (FITC) positive panel the amount of DNA damage indicated by yH2AX staining. On our <span class="html-italic">x</span> axis the PI positivity is reported to analyze specific DNA staining. The dot plots reported are representative of a single experiment, whereas the histograms represent the mean ± standard deviation (SD) of at least three independent experiments. The statistical significance was calculated by GraphPad Prism 7 with one-way ANOVA with Dunnett’s multiple comparisons test ((<b>A</b>) * <span class="html-italic">p</span> &lt; 0.005, (<b>B</b>) * <span class="html-italic">p</span> &lt; 0.0001).</p>
Full article ">Figure 4
<p>Inhibition of cell cycle progression and apoptosis induction by G4 ligands. MCF-7 (<b>A</b>) and MDA-MB231 (<b>B</b>) cells were treated with G4 ligands at the indicated concentrations. Cells were stained with PI to evaluate cell cycle progression. A representative flow cytometry profile of cell cycle is shown for both cell lines, and the percent of cells in each phase of the cell cycle is indicated for the single experiment, whereas the bars in the histograms represent the mean ± SD of at least three independent experiments. The statistical significance was calculated by GraphPad Prism 7 with two-way ANOVA using Sidak’s multiple comparisons test ((<b>A</b>) * <span class="html-italic">p</span> &lt; 0.0001, (<b>B</b>) * <span class="html-italic">p</span> &lt; 0.05). Apoptosis induction (<b>C</b>) was evaluated by annexin V/PI staining. The percent of early apoptotic cells is reported in the histograms representing the mean ± SD of five independent experiments. The statistical significance was calculated by GraphPad Prism 7 with one-way ANOVA with Dunnett’s multiple comparisons test (* <span class="html-italic">p</span> &lt; 0.005).</p>
Full article ">Figure 4 Cont.
<p>Inhibition of cell cycle progression and apoptosis induction by G4 ligands. MCF-7 (<b>A</b>) and MDA-MB231 (<b>B</b>) cells were treated with G4 ligands at the indicated concentrations. Cells were stained with PI to evaluate cell cycle progression. A representative flow cytometry profile of cell cycle is shown for both cell lines, and the percent of cells in each phase of the cell cycle is indicated for the single experiment, whereas the bars in the histograms represent the mean ± SD of at least three independent experiments. The statistical significance was calculated by GraphPad Prism 7 with two-way ANOVA using Sidak’s multiple comparisons test ((<b>A</b>) * <span class="html-italic">p</span> &lt; 0.0001, (<b>B</b>) * <span class="html-italic">p</span> &lt; 0.05). Apoptosis induction (<b>C</b>) was evaluated by annexin V/PI staining. The percent of early apoptotic cells is reported in the histograms representing the mean ± SD of five independent experiments. The statistical significance was calculated by GraphPad Prism 7 with one-way ANOVA with Dunnett’s multiple comparisons test (* <span class="html-italic">p</span> &lt; 0.005).</p>
Full article ">Figure 5
<p>ICD induction by G4 ligands. ICD hallmarks were evaluated in MCF-7 and MDA-MB 231 cells treated with G4 ligands. Calreticulin expression as cell surface marker was evaluated in MCF7 (<b>A</b>) and MDA-MB231 (<b>B</b>) cells. Representative flow cytometry profiles of a single experiment are reported, whereas the histograms represent the mean ± SD of three independent experiments (* <span class="html-italic">p</span> &lt; 0.005). ATP intracellular release by MCF-7 and MDA-MB231 treated with G4 ligands at 5 µM was determined as luminescence by microwell plate reader (<b>C</b>) the histograms represent the mean ± SD of three independent experiments (* <span class="html-italic">p</span> &lt; 0.05). HMGB1 intracellular accumulation is reported in the histograms for MCF-7 and MDA-MB231 cells at the concentration of 3 µM (histograms report the mean ± SD of three independent experiments, <span class="html-italic">p</span> &lt; 0.05) (<b>D</b>). The statistical significance was calculated by GraphPad Prism 7 one-way ANOVA with Dunnett’s multiple comparisons test.</p>
Full article ">Figure 5 Cont.
<p>ICD induction by G4 ligands. ICD hallmarks were evaluated in MCF-7 and MDA-MB 231 cells treated with G4 ligands. Calreticulin expression as cell surface marker was evaluated in MCF7 (<b>A</b>) and MDA-MB231 (<b>B</b>) cells. Representative flow cytometry profiles of a single experiment are reported, whereas the histograms represent the mean ± SD of three independent experiments (* <span class="html-italic">p</span> &lt; 0.005). ATP intracellular release by MCF-7 and MDA-MB231 treated with G4 ligands at 5 µM was determined as luminescence by microwell plate reader (<b>C</b>) the histograms represent the mean ± SD of three independent experiments (* <span class="html-italic">p</span> &lt; 0.05). HMGB1 intracellular accumulation is reported in the histograms for MCF-7 and MDA-MB231 cells at the concentration of 3 µM (histograms report the mean ± SD of three independent experiments, <span class="html-italic">p</span> &lt; 0.05) (<b>D</b>). The statistical significance was calculated by GraphPad Prism 7 one-way ANOVA with Dunnett’s multiple comparisons test.</p>
Full article ">Figure 6
<p>T cell activation by G4 ligands. CM obtained from the experimental conditions indicated in the figure were used to evaluate T cell activation induced by G4 ligands. The figure reports CD69+CD4+T cells and CD69+CD8+T cells. The histograms represent the mean ± SD of five independent experiments. The statistical significance was calculated by GraphPad Prism 7 with one-way ANOVA with Turkey’s multiple comparisons test (* <span class="html-italic">p</span> &lt; 0.05).</p>
Full article ">Figure 7
<p>G4 ligand stabilization of G4 structures. G4 ligand stabilization in MCF-7 (<b>A</b>) and MDA-MB231 (<b>B</b>) cells was evaluated by flow cytometry detecting by gating strategies in each phase of the cell cycle on PI positive cells (PI-W versus PI-H dot plot) the percent of G4 structure positivity. Flow cytometry profiles representative of a single experiment are reported, whereas the histograms represent the mean ± SD of five independent experiments. The statistical significance was calculated by GraphPad Prism 7 with two-way ANOVA with Dunnett’s multiple comparisons test (* <span class="html-italic">p</span> &lt; 0.05).</p>
Full article ">Figure 7 Cont.
<p>G4 ligand stabilization of G4 structures. G4 ligand stabilization in MCF-7 (<b>A</b>) and MDA-MB231 (<b>B</b>) cells was evaluated by flow cytometry detecting by gating strategies in each phase of the cell cycle on PI positive cells (PI-W versus PI-H dot plot) the percent of G4 structure positivity. Flow cytometry profiles representative of a single experiment are reported, whereas the histograms represent the mean ± SD of five independent experiments. The statistical significance was calculated by GraphPad Prism 7 with two-way ANOVA with Dunnett’s multiple comparisons test (* <span class="html-italic">p</span> &lt; 0.05).</p>
Full article ">
9 pages, 10853 KiB  
Article
Non-Invasive Targeted Hepatic Irradiation and SPECT/CT Functional Imaging to Study Radiation-Induced Liver Damage in Small Animal Models
by Rafi Kabarriti, N. Patrik Brodin, Hillary Yaffe, Mark Barahman, Wade R. Koba, Laibin Liu, Patrik Asp, Wolfgang A. Tomé and Chandan Guha
Cancers 2019, 11(11), 1796; https://doi.org/10.3390/cancers11111796 - 15 Nov 2019
Cited by 5 | Viewed by 2976
Abstract
Radiation therapy (RT) has traditionally not been widely used in the management of hepatic malignancies for fear of toxicity in the form of radiation-induced liver disease (RILD). Pre-clinical hepatic irradiation models can provide clinicians with better understanding of the radiation tolerance of the [...] Read more.
Radiation therapy (RT) has traditionally not been widely used in the management of hepatic malignancies for fear of toxicity in the form of radiation-induced liver disease (RILD). Pre-clinical hepatic irradiation models can provide clinicians with better understanding of the radiation tolerance of the liver, which in turn may lead to the development of more effective cancer treatments. Previous models of hepatic irradiation are limited by either invasive laparotomy procedures, or the need to irradiate the whole or large parts of the liver using external skin markers. In the setting of modern-day radiation oncology, a truly translational animal model would require the ability to deliver RT to specific parts of the liver, through non-invasive image guidance methods. To this end, we developed a targeted hepatic irradiation model on the Small Animal Radiation Research Platform (SARRP) using contrast-enhanced cone-beam computed tomography image guidance. Using this model, we showed evidence of the early development of region-specific RILD through functional single photon emission computed tomography (SPECT) imaging. Full article
(This article belongs to the Special Issue Animal Models for Radiotherapy Research)
Show Figures

Figure 1

Figure 1
<p>Contrast-enhanced liver imaging. Transversal and coronal cone-beam computed tomography images are shown for a mouse that was administered liver contrast agent in (<b>a</b>) with the left lobe (LL), median lobe (ML) and right lobe (RL) indicated. In (<b>b</b>) the images show a mouse that was administered both the liver contrast agent and the gastrointestinal contrast agent, highlighting the stomach and small bowel.</p>
Full article ">Figure 2
<p>Illustration depicting targeted liver irradiation. The irradiation field setup is illustrated showing the partial arc radiation delivery at either a 20° or −20° stage rotation. The relative size of the animal is exaggerated as compared to the X-ray collimator for visualization purposes.</p>
Full article ">Figure 3
<p>Dose color-wash depicting radiation isocenter setup. The calculated radiation dose distribution is shown as a color-wash for two isocenters delivering 50 Gy to the median lobe and 25 Gy to the right lobe, with the dose given as cGy (1 Gy = 100 cGy). It should be noted that the incident irradiation fields were placed so that the spinal cord of the animal was spared from direct high-dose irradiation to avoid causing hind limb paralysis in the animals.</p>
Full article ">Figure 4
<p>Histopathological staining shows demarcation of DNA damage within radiation field border. Histopathological γH2AX staining of sections from the right and median of an animal that received the targeted liver irradiation. The sections are shown in lower magnification (4×) as well as high-power (20×) magnification, with γH2AX-positive cells appearing in dark brown color, indicating double strand break DNA damage. The dashed line in the right lobe section shows the clear dichotomization between irradiated and un-irradiated liver tissue.</p>
Full article ">Figure 5
<p>Functional SPECT/CT imaging shows reduced Kupffer cell perfusion in irradiated areas. The SPECT/CT images were taken at respectively 2 months and 1 year post targeted liver irradiation with the CT showing the underlying anatomy and the overlaying color-wash shows the uptake of <sup>99</sup>Tc<sup>m</sup>-labeled Sulfur Colloid within the liver. The bottom three panels show irradiatd livers with substantially reduced uptake in the areas that received high-dose irradiation lobe, indicative of reduced Kupffer cell perfusion following irradiation. The top panel shows an age-matched control animal that did not receive any liver irradiation.</p>
Full article ">
18 pages, 3838 KiB  
Article
Emodin Inhibits EBV Reactivation and Represses NPC Tumorigenesis
by Chung-Chun Wu, Mei-Shu Chen, Yu-Jhen Cheng, Ying-Chieh Ko, Su-Fang Lin, Ing-Ming Chiu and Jen-Yang Chen
Cancers 2019, 11(11), 1795; https://doi.org/10.3390/cancers11111795 - 15 Nov 2019
Cited by 23 | Viewed by 3775
Abstract
Nasopharyngeal carcinoma (NPC) is a unique malignancy derived from the epithelium of the nasopharynx. Despite great advances in the development of radiotherapy and chemotherapy, relapse and metastasis in NPC patients remain major causes of mortality. Evidence accumulated over recent years indicates that Epstein-Barr [...] Read more.
Nasopharyngeal carcinoma (NPC) is a unique malignancy derived from the epithelium of the nasopharynx. Despite great advances in the development of radiotherapy and chemotherapy, relapse and metastasis in NPC patients remain major causes of mortality. Evidence accumulated over recent years indicates that Epstein-Barr virus (EBV) lytic replication plays an important role in the pathogenesis of NPC and inhibition of EBV reactivation is now being considered as a goal for the therapy of EBV-associated cancers. With this in mind, a panel of dietary compounds was screened and emodin was found to have potential anti-EBV activity. Through Western blotting, immunofluorescence, and flow cytometric analysis, we show that emodin inhibits the expression of EBV lytic proteins and blocks virion production in EBV- positive epithelial cell lines. In investigating the underlying mechanism, reporter assays indicated that emodin represses Zta promoter (Zp) and Rta promoter (Rp) activities, triggered by various inducers. Mapping of the Zp construct reveals that the SP1 binding region is important for emodin-triggered repression and emodin is shown to be able to inhibit SP1 expression, suggesting that it likely inhibits EBV reactivation by suppression of SP1 expression. Moreover, we also show that emodin inhibits the tumorigenic properties induced by repeated EBV reactivation, including micronucleus formation, cell proliferation, migration, and matrigel invasiveness. Emodin administration also represses the tumor growth in mice which is induced by EBV activation. Taken together, our results provide a potential chemopreventive agent in restricting EBV reactivation and NPC recurrence. Full article
Show Figures

Figure 1

Figure 1
<p>Epstein-Barr virus (EBV) positive nasopharyngeal carcinoma (NPC) cells are more resistant to emodin. (<b>a</b>) The chemical structure of emodin. (<b>b</b>) NPC cell lines (TW01, HONE-1) and their EBV infected counterparts (NA, HA) were treated with indicated concentrations of emodin for 48 h, followed by cell viability assay and CC50 calculation (top of each panel). The values are means ± SD from at least three independent experiments. (* <span class="html-italic">p</span> &lt; 0.05, ** <span class="html-italic">p</span> &lt; 0.01, *** <span class="html-italic">p</span> &lt; 0.001 compared to the group of 0 μM).</p>
Full article ">Figure 2
<p>The expression of EBV lytic proteins in epithelial cell lines is inhibited by emodin. Western blot analysis of EBV positive NA (<b>a</b>) and HA (<b>b</b>) cells treated with emodin alone (left panels) or emodin and TPA+SB (right panels). Zta, Rta, EAD, DNase are EBV lytic proteins, GAPDH serves as a loading control. Forty ng/mL TPA, 3 mM SB, and 1 to 50 μM emodin were used in this experiment.</p>
Full article ">Figure 3
<p>The amount of EAD-positive cells is decreased by emodin treatment of EBV-positive epithelial cell lines. (<b>a</b>,<b>b</b>) immunofluorescence assay of NA (<b>a</b>) and HA (<b>b</b>) cells exposed to indicated concentrations of emodin one hour before TPA+SB induction (TPA+SB 24 h). EBV diffusive early antigen (EAD) serves as a surrogate marker for virus reactivation (red). Scale bar: 100 μm. (<b>c</b>,<b>d</b>) Flow cytometry analysis was used to quantitate EAD positive cells in each treatment as denoted in (<b>a</b>,<b>b</b>). TS, TPA + SB; E, emodin.</p>
Full article ">Figure 4
<p>Virus production is inhibited by emodin treatment. EBV virions released in the culture media of NA (<b>a</b>) and HA (<b>b</b>) cells treated with TPA + SB (TS) or TS plus emodin (TS + E1, TS + E10, TS + E20, TS + E50) were collected, treated with DNase I to remove free DNA present in the media. Viral genome was purified by proteinase K digestion and subjected to qPCR analysis of EBV DNA polymerase gene fragment (BALF5). Untreated cells served as spontaneous lytic replication control (Mock). Data are means ± SD of two independent experiments. (* <span class="html-italic">p</span> &lt; 0.05, ** <span class="html-italic">p</span> &lt; 0.01, *** <span class="html-italic">p</span> &lt; 0.001 compared to the TS group).</p>
Full article ">Figure 5
<p>The activities of Zp and Rp are repressed by emodin treatment of NA cells. (<b>a</b>,<b>b</b>) NA and its parental EBV negative cell line, TW01, were transfected with luciferase reporters containing Zp or Rp, followed by emodin (E) and TPA + SB (TS) treatments. After TS induction for 24 h, cell lysates were collected for measurement of luciferase activity. Data are means ± SD from at least two independent experiments. (<b>c</b>,<b>d</b>) Zta-expressing plasmid (Z) was co-transfected with Zp or Rp luciferase reporters into NA (<b>c</b>) or TW01 (<b>d</b>) cells, with same emodin and TPA+SB treatments depicted in (<b>a</b>,<b>b</b>). (<b>e</b>,<b>f</b>) same to (<b>c</b>,<b>d</b>), except Rta-expressing plasmid (R) was used. (* <span class="html-italic">p</span> &lt; 0.05, ** <span class="html-italic">p</span> &lt; 0.01, *** <span class="html-italic">p</span> &lt; 0.001 compared to the groups of TS, Z or R, respectively).</p>
Full article ">Figure 5 Cont.
<p>The activities of Zp and Rp are repressed by emodin treatment of NA cells. (<b>a</b>,<b>b</b>) NA and its parental EBV negative cell line, TW01, were transfected with luciferase reporters containing Zp or Rp, followed by emodin (E) and TPA + SB (TS) treatments. After TS induction for 24 h, cell lysates were collected for measurement of luciferase activity. Data are means ± SD from at least two independent experiments. (<b>c</b>,<b>d</b>) Zta-expressing plasmid (Z) was co-transfected with Zp or Rp luciferase reporters into NA (<b>c</b>) or TW01 (<b>d</b>) cells, with same emodin and TPA+SB treatments depicted in (<b>a</b>,<b>b</b>). (<b>e</b>,<b>f</b>) same to (<b>c</b>,<b>d</b>), except Rta-expressing plasmid (R) was used. (* <span class="html-italic">p</span> &lt; 0.05, ** <span class="html-italic">p</span> &lt; 0.01, *** <span class="html-italic">p</span> &lt; 0.001 compared to the groups of TS, Z or R, respectively).</p>
Full article ">Figure 6
<p>Z1D and ZII domains of Zp are important for emodin inhibition. (<b>a</b>) Luciferase activities of TW01 cells harboring wild type Zp (spanning −221 to +1 region, top) or serial 5’-deletion mutants (Zp-184, −167, −134, −99, −80, −51). Three hours after transfection, the cells were pre-treated with emodin for 1 h followed by TPA+SB treatment for an additional 24 h. The relative folds of luciferase activities are means ± SD from three independent experiments. (<b>b</b>) Luciferase activities of emodin/TPA+SB-treated TW01 cells harboring wild type Zp and mutants of cellular factor binding sites located in the Z1D and ZII domains (mZ1D-1, mZ1D-2, ZII-1, ZII-2). The relevant mutated sites are represented by a black triangle (▲). (<b>c</b>) The SP1 and β-actin of NA cells were detected after EBV induction with emodin treatment for 24 h. (<b>d</b>) NA cells were co-transfected with Zp reporter and vector or SP1-expressing plasmid for 3 h, respectively. After transfection, the cells were pretreated with emodin and activated EBV with TPA+SB. After 24 h of incubation, the luciferase activities were detected. Values are means ± SD from three independent experiments. (* <span class="html-italic">p</span> &lt; 0.05, ** <span class="html-italic">p</span> &lt; 0.01, *** <span class="html-italic">p</span> &lt; 0.001 compared to the group of TS).</p>
Full article ">Figure 7
<p>Emodin represses reactivation-induced tumorigenic properties. The EBV-positive cell line NA was treated with TPA+SB repeatedly to investigate various tumorigenic properties. (<b>a</b>) For detection of MN formation, the cells were harvested after 10 repeated treatments with TPA+SB, with or without emodin, and stained with DAPI for MN examination using fluorescence microscopy. (<b>b</b>) For detection of cell proliferation, the cells were subjected to WST-1 assay after 10 repeated treatments with TPA+SB, with or without emodin, to detect the cell proliferation over the following 3 days. For cell migration (<b>c</b>) and cell invasion (<b>d</b>) assays, repeated TPA+SB induced NA cells were subjected to Oris system (c) or HTS FluoroBlock transwell (d) in the presence or absence of emodin, followed by cell counts. Scale bar: 100 μm. Data are the mean ± SD from three independent experiments. * <span class="html-italic">p</span> &lt; 0.05; ** <span class="html-italic">p</span> &lt; 0.01.</p>
Full article ">Figure 8
<p>Emodin represses the tumor growth in a mouse model. NA cells were prepared for subcutaneous inoculation into severe combined immunodeficient (SCID) mice, which then received various treatments. (<b>a</b>) The diagram presents the schedule for in vivo assay of EBV reactivation inhibited by emodin. (<b>b</b>) The average animal body weights during the experiment were measured (<span class="html-italic">n</span> = 6 mice for each group). (<b>c</b>) The diameters of tumor nodules were monitored weekly using calipers throughout the experiment. (<b>d</b>) The tumor weights were measured after the mice were sacrificed. Tumor nodules were photographed as the listed pictures. Data are presented as mean ± SD. * <span class="html-italic">p</span> &lt; 0.05.</p>
Full article ">
24 pages, 956 KiB  
Review
HDAC Inhibitors in Acute Myeloid Leukemia
by Edurne San José-Enériz, Naroa Gimenez-Camino, Xabier Agirre and Felipe Prosper
Cancers 2019, 11(11), 1794; https://doi.org/10.3390/cancers11111794 - 14 Nov 2019
Cited by 116 | Viewed by 12316
Abstract
Acute myeloid leukemia (AML) is a hematological malignancy characterized by uncontrolled proliferation, differentiation arrest, and accumulation of immature myeloid progenitors. Although clinical advances in AML have been made, especially in young patients, long-term disease-free survival remains poor, making this disease an unmet therapeutic [...] Read more.
Acute myeloid leukemia (AML) is a hematological malignancy characterized by uncontrolled proliferation, differentiation arrest, and accumulation of immature myeloid progenitors. Although clinical advances in AML have been made, especially in young patients, long-term disease-free survival remains poor, making this disease an unmet therapeutic challenge. Epigenetic alterations and mutations in epigenetic regulators contribute to the pathogenesis of AML, supporting the rationale for the use of epigenetic drugs in patients with AML. While hypomethylating agents have already been approved in AML, the use of other epigenetic inhibitors, such as histone deacetylases (HDAC) inhibitors (HDACi), is under clinical development. HDACi such as Panobinostat, Vorinostat, and Tricostatin A have been shown to promote cell death, autophagy, apoptosis, or growth arrest in preclinical AML models, yet these inhibitors do not seem to be effective as monotherapies, but rather in combination with other drugs. In this review, we discuss the rationale for the use of different HDACi in patients with AML, the results of preclinical studies, and the results obtained in clinical trials. Although so far the results with HDACi in clinical trials in AML have been modest, there are some encouraging data from treatment with the HDACi Pracinostat in combination with DNA demethylating agents. Full article
(This article belongs to the Special Issue Epigenetic Dysregulation in Cancer: From Mechanism to Therapy)
Show Figures

Figure 1

Figure 1
<p>HDAC inhibitor (HDACi) effect on chromatin remodeling. Histone deacetylases (HDACs) and histone acetyltransferases (HATs) are responsible for the balance of histone acetylation, and thereby regulate gene expression. Whereas HDACs deacetylate histones, promoting transcription repression, HATs are responsible for acetylating histones and inducing transcriptional activation. HDACi inhibits HDACs, and thus maintain an open chromatin conformation.</p>
Full article ">
30 pages, 857 KiB  
Review
Proteostasis in the Endoplasmic Reticulum: Road to Cure
by Su Min Nam and Young Joo Jeon
Cancers 2019, 11(11), 1793; https://doi.org/10.3390/cancers11111793 - 14 Nov 2019
Cited by 23 | Viewed by 5155
Abstract
The endoplasmic reticulum (ER) is an interconnected organelle that is responsible for the biosynthesis, folding, maturation, stabilization, and trafficking of transmembrane and secretory proteins. Therefore, cells evolve protein quality-control equipment of the ER to ensure protein homeostasis, also termed proteostasis. However, disruption in [...] Read more.
The endoplasmic reticulum (ER) is an interconnected organelle that is responsible for the biosynthesis, folding, maturation, stabilization, and trafficking of transmembrane and secretory proteins. Therefore, cells evolve protein quality-control equipment of the ER to ensure protein homeostasis, also termed proteostasis. However, disruption in the folding capacity of the ER caused by a large variety of pathophysiological insults leads to the accumulation of unfolded or misfolded proteins in this organelle, known as ER stress. Upon ER stress, unfolded protein response (UPR) of the ER is activated, integrates ER stress signals, and transduces the integrated signals to relive ER stress, thereby leading to the re-establishment of proteostasis. Intriguingly, severe and persistent ER stress and the subsequently sustained unfolded protein response (UPR) are closely associated with tumor development, angiogenesis, aggressiveness, immunosuppression, and therapeutic response of cancer. Additionally, the UPR interconnects various processes in and around the tumor microenvironment. Therefore, it has begun to be delineated that pharmacologically and genetically manipulating strategies directed to target the UPR of the ER might exhibit positive clinical outcome in cancer. In the present review, we summarize recent advances in our understanding of the UPR of the ER and the UPR of the ER–mitochondria interconnection. We also highlight new insights into how the UPR of the ER in response to pathophysiological perturbations is implicated in the pathogenesis of cancer. We provide the concept to target the UPR of the ER, eventually discussing the potential of therapeutic interventions for targeting the UPR of the ER for cancer treatment. Full article
(This article belongs to the Special Issue Therapeutic Targeting of the Unfolded Protein Response in Cancer)
Show Figures

Figure 1

Figure 1
<p>The unfolded protein response (UPR) of the endoplasmic reticulum (ER) and ER-associated degradation (ERAD). The UPR of the ER is an adaptive interplay of signal transduction pathways to coordinate ER stress response and to relieve ER stress, resulting in the re-establishment of proteostasis. The UPR consists of three stress sensors localized at the ER membrane, activating transcription factor 6 (ATF6), inositol-requiring protein 1 (IRE1), and protein kinase RNA (PKR)-like ER kinase (PERK). Under normal conditions, these stress sensors are maintained in an inactive form via the direct binding of a chaperone, binding immunoglobulin protein (BiP) to the luminal domain of the stress sensors. ER stress-induced release of BiP from the stress sensors leads to the activation of the UPR. ERAD is conserved protein degradation machinery of the ER to remove unfolded, misfolded, or unassembled proteins by the cytosolic ubiquitin-proteasome system (UPS).</p>
Full article ">Figure 2
<p>The unfolded protein response (UPR) and its connection to cell death. Under severe endoplasmic reticulum (ER) stress, sustained protein kinase RNA (PKR)-like ER kinase (PERK) activation is required for the transition from protective to pro-apoptotic UPR function. Cell-surface binding immunoglobulin protein (BiP) forms a complex with Kringle 5, enhancing caspase-7-mediated cell death. In addition, extracellular prostate apoptosis response-4 (Par-4) binds to cell-surface BiP, thereby leading to apoptosis via activation of Fas-associated protein with death domain (FADD)/caspase-8/caspase-3 pathway. Upregulated CCAAT/enhancer-binding protein (C/EBP) homologous protein (CHOP) regulates the expression of pro-apoptotic and pro-survival genes, thereby leading to cell death. CHOP also mediates cell death via the upregulation of the expression of ER oxidoreductin 1 (ERO1α) and growth arrest and DNA damage-inducible protein (GADD34). As a molecular scaffold, inositol-requiring protein 1 (IRE1) is responsible for the recruitment of an E3 ubiquitin ligase, tumor necrosis factor (TNF) receptor-associated receptor 2 (TRAF2), and for the activation of mitogen-activated protein kinase (MAPK) signaling pathways, triggering cell death. In addition, regulated IRE1-dependent decay (RIDD)-mediated cleavage of miRNAs and mRNAs induces cell death.</p>
Full article ">
15 pages, 584 KiB  
Review
Animal Models of Hepatocellular Carcinoma Prevention
by Ram C. Shankaraiah, Laura Gramantieri, Francesca Fornari, Silvia Sabbioni, Elisa Callegari and Massimo Negrini
Cancers 2019, 11(11), 1792; https://doi.org/10.3390/cancers11111792 - 14 Nov 2019
Cited by 9 | Viewed by 4125
Abstract
Hepatocellular carcinoma (HCC) is a deadly disease and therapeutic efficacy in advanced HCC is limited. Since progression of chronic liver disease to HCC involves a long latency period of a few decades, a significant window of therapeutic opportunities exists for prevention of HCC [...] Read more.
Hepatocellular carcinoma (HCC) is a deadly disease and therapeutic efficacy in advanced HCC is limited. Since progression of chronic liver disease to HCC involves a long latency period of a few decades, a significant window of therapeutic opportunities exists for prevention of HCC and improve patient prognosis. Nonetheless, there has been no clinical advancement in instituting HCC chemopreventive strategies. Some of the major challenges are heterogenous genetic aberrations of HCC, significant modulation of tumor microenvironment and incomplete understanding of HCC tumorigenesis. To this end, animal models of HCC are valuable tools to evaluate biology of tumor initiation and progression with specific insight into molecular and genetic mechanisms involved. In this review, we describe various animal models of HCC that facilitate effective ways to study therapeutic prevention strategies that have translational potential to be evaluated in a clinical context. Full article
(This article belongs to the Special Issue Models of Experimental Liver Cancer)
Show Figures

Figure 1

Figure 1
<p>Translational aspects of hepatocellular carcinoma (HCC) prevention animal models. Various fatty liver induction, immunogenic, hepato-carcinogenic, hepato-toxic methods are used in rodents to model human hierarchical progression of liver injury to HCC. NAFLD, Non-alcoholic fatty liver disease; NASH, non-alcoholic steatohepatitis; DEN, dimethylnitrosamine; CCl<sub>4</sub>, carbon tetrachloride; TAA, thioacetamide; BDL, bile duct ligation; HBV, hepatitis B virus; HCV, hepatitis C virus.</p>
Full article ">
20 pages, 663 KiB  
Review
Breast Cancer in Young Women: Status Quo and Advanced Disease Management by a Predictive, Preventive, and Personalized Approach
by Erik Kudela, Marek Samec, Peter Kubatka, Marcela Nachajova, Zuzana Laucekova, Alena Liskova, Karol Dokus, Kamil Biringer, Denisa Simova, Eva Gabonova, Zuzana Dankova, Kristina Biskupska Bodova, Pavol Zubor and Daniela Trog
Cancers 2019, 11(11), 1791; https://doi.org/10.3390/cancers11111791 - 14 Nov 2019
Cited by 32 | Viewed by 6123
Abstract
Why does healthcare of breast cancer (BC) patients, especially in a young population, matter and why are innovative strategies by predictive, preventive, and personalized medicine (PPPM) strongly recommended to replace current reactive medical approach in BC management? Permanent increase in annual numbers of [...] Read more.
Why does healthcare of breast cancer (BC) patients, especially in a young population, matter and why are innovative strategies by predictive, preventive, and personalized medicine (PPPM) strongly recommended to replace current reactive medical approach in BC management? Permanent increase in annual numbers of new BC cases with particularly quick growth of premenopausal BC patients, an absence of clearly described risk factors for those patients, as well as established screening tools and programs represent important reasons to focus on BC in young women. Moreover, "young" BC cases are frequently "asymptomatic", difficult to diagnose, and to treat effectively on time. The objective of this article is to update the knowledge on BC in young females, its unique molecular signature, newest concepts in diagnostics and therapy, and to highlight the concepts of predictive, preventive, and personalized medicine with a well-acknowledged potential to advance the overall disease management. Full article
Show Figures

Figure 1

Figure 1
<p>FS phenotype analyzed in the family members.</p>
Full article ">
Previous Issue
Next Issue
Back to TopTop