[go: up one dir, main page]

Next Issue
Volume 15, January-1
Previous Issue
Volume 14, December-1
 
 
nutrients-logo

Journal Browser

Journal Browser

Nutrients, Volume 14, Issue 24 (December-2 2022) – 208 articles

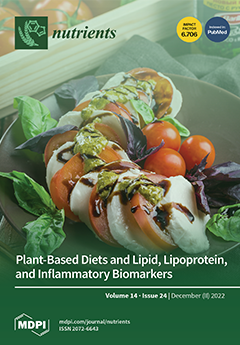
Cover Story (view full-size image): Plant-based diets (PBDs) are becoming increasingly popular. Thus far, the literature has focused on their association with lipid profiles, with less investigation of lipoprotein and inflammatory profiles. Because pro-atherogenic lipid, lipoprotein, and inflammatory processes may facilitate the development of atherosclerosis, understanding the relation between PBDs and these processes is important to inform risk mitigation strategies. Therefore, the objective of this paper was to review the literature on PBDs and lipid, lipoprotein, and inflammatory biomarkers of cardiovascular disease (CVD). View this paper
  • Issues are regarded as officially published after their release is announced to the table of contents alert mailing list.
  • You may sign up for e-mail alerts to receive table of contents of newly released issues.
  • PDF is the official format for papers published in both, html and pdf forms. To view the papers in pdf format, click on the "PDF Full-text" link, and use the free Adobe Reader to open them.
Order results
Result details
Section
Select all
Export citation of selected articles as:
12 pages, 2440 KiB  
Article
Maternal Gliadin Intake Reduces Oocyte Quality with Chromosomal Aberrations and Increases Embryonic Lethality through Oxidative Stress in a Caenorhabditis elegans Model
by Jae Hyuck Lee, Mijin Lee, Hyemin Min, Esther Youn and Yhong-Hee Shim
Nutrients 2022, 14(24), 5403; https://doi.org/10.3390/nu14245403 - 19 Dec 2022
Cited by 4 | Viewed by 2906
Abstract
Oocyte quality is essential for reproductive capacity, but it rapidly declines with age. In addition to aging, maternal nutrition is a major concern in maintaining oocyte quality. Gliadin, a major component of gluten, causes gluten toxicity, which has been reported in a variety [...] Read more.
Oocyte quality is essential for reproductive capacity, but it rapidly declines with age. In addition to aging, maternal nutrition is a major concern in maintaining oocyte quality. Gliadin, a major component of gluten, causes gluten toxicity, which has been reported in a variety of gluten-related disorders. The basis of gluten toxicity in reproduction is being understood using simple animal models such as Caenorhabditis elegans. In this study, we examined the effects of gliadin peptide (GP; amino acids 151–170) intake on oocyte quality control in C. elegans. We found that GP intake impaired oocyte quality through chromosomal aberrations and mitochondrial oxidative stress, which was suppressed by antioxidant treatment. The reduced oocyte quality by GP intake consequently increased embryonic lethality. Furthermore, the expression of oxidative stress-responding genes prdx-3 and gst-4 was significantly increased by GP intake. The increased DAF-16 activity by GP intake suggests that DAF-16 is a possible transactivator of these antioxidant genes. Taken together, GP intake reduced reproductive capacity in C. elegans by decreasing oocyte quality and increasing embryonic lethality through mitochondrial oxidative stress. Full article
(This article belongs to the Special Issue Nutrition and Supplements during Pregnancy)
Show Figures

Figure 1

Figure 1
<p>Gliadin peptide (GP) intake increases mitochondrial ROS production (mtROS) in adult <span class="html-italic">C. elegans</span>. (<b>A</b>) Experimental scheme of GP treatment. The synchronized wild-type N2 worms at L4 stage were incubated on NGM plates containing 0 (DMSO) or 3 µM of GP at 20 °C, and then worms were examined at day 1 or day 3 post L4 stage. (<b>B</b>–<b>F</b>) Comparison of the mtROS levels in worms (<b>B</b>,<b>C</b>), in the dissected gonad (<b>D</b>,<b>E</b>), or in the oocytes (<b>F</b>) treated with 0 (CT) and 3 µM of GP at the L4 stage for 1 day (<b>B</b>,<b>D</b>) or 3 days (<b>C</b>,<b>E</b>,<b>F</b>) using CellROX<sup>®</sup>Green staining. The dashed line indicates the outline of the whole body (<b>B</b>,<b>C</b>) or distal gonad (<b>D</b>,<b>E</b>). Scale bars are 50 µm (<b>B</b>–<b>E</b>) or 20 μm (<b>F</b>). Error bars represent SD. n.s.: not significant, * <span class="html-italic">p</span> &lt; 0.05, ** <span class="html-italic">p</span> &lt; 0.005, *** <span class="html-italic">p</span> &lt; 0.001 (Student’s <span class="html-italic">t</span>-test).</p>
Full article ">Figure 2
<p>Chromosomal aberrations in the oocytes, embryonic lethality, and oxidative stress sensitivity in offspring are increased by GP intake. (<b>A</b>) Chromosomal morphology was observed using DNA staining. The type of aberration was classified into three categories depending on the condensation of chromosomes: aligned and condensed (a), under-condensed (b), and misaligned and condensed (c). The graph indicates the chromosomal morphology of -1 oocytes produced from control (CT) or GP-treated adult worms. Scale bars are 10 μm. ** <span class="html-italic">p</span> &lt; 0.05 (chi-square test). (<b>B</b>) The graph indicates the percentages of unhatched embryos for 24 h in day-3 adult-stage worms treated with 0 (CT) or 3 µM of GP. Error bars represent SD. * <span class="html-italic">p</span> &lt; 0.05 (Student’s <span class="html-italic">t</span>-test). (<b>C</b>) Experimental scheme for survival assay against 100 mM paraquat (PQ) in the offspring produced from DMSO-treated (CT) or GP-treated worms (GP). (<b>D</b>) The graph indicates survival rate in the F1 progenies produced by worms treated with 0 (CT) or 3 µM GP and 100 mM PQ for 6 h. Error bars represent SD. * <span class="html-italic">p</span> &lt; 0.05 (two-way ANOVA with Tukey’s post hoc test).</p>
Full article ">Figure 3
<p>N-acetyl-L-cysteine (NAC) treatment suppresses effects of GP intake in adult <span class="html-italic">C. elegans</span>. (<b>A</b>) Experimental scheme of NAC treatment. The synchronized wild-type N2 worms at L4 stage were incubated on NGM plates containing 0 (DMSO) or 3 µM of GP at 20 °C, and treated with NAC for 24 h, and then worms were examined at day 3 post L4 stage. (<b>B</b>) Comparison of mtROS levels in oocytes produced from control (CT) and GP-treated adult worms without (CT, GP) or with NAC (CT + NAC, GP + NAC) treatment using CellROX<sup>®</sup>Green staining. The bar graph indicates the relative pixel intensity of fluorescence of CellROX<sup>®</sup>Green. Scale bars are 20 μm. Error bars represent SD. * <span class="html-italic">p</span> &lt; 0.05 (Student’s <span class="html-italic">t</span>-test). (<b>C</b>) The graph indicates chromosomal morphology of -1 oocytes produced from control (CT) or GP-treated adult worms without (CT, GP) or with NAC (CT + NAC, GP + NAC) treatment using DNA staining. The types of aberrations were classified into three categories depending on the chromosomal morphology: aligned and condensed (a), under-condensed (b), and misaligned and condensed (c). Scale bars are 10 µm, * <span class="html-italic">p</span> &lt; 0.05, ** <span class="html-italic">p</span> &lt; 0.005 (chi-square test). (<b>D</b>) The graph indicates the percentages of unhatched embryos for 24 h in day-3 adult worms treated with 0 (CT) or 3 µM of GP with or without NAC. Error bars represent SD. n.s.: not significant. * <span class="html-italic">p</span> &lt; 0.05 (Student’s <span class="html-italic">t</span>-test). (<b>E</b>) The graph indicates survival rate in the F1 progenies produced by 0 (CT) or 3 µM of GP-treated worms without (CT, GP) or with NAC (CT + NAC, GP + NAC) after 100 mM paraquat treatment for 6 h. Error bars represent SD. n.s.: not significant. * <span class="html-italic">p</span> &lt; 0.05, ** <span class="html-italic">p</span> &lt; 0.005 (two-way ANOVA with Tukey’s post hoc test).</p>
Full article ">Figure 4
<p>GP intake regulates the expression of antioxidant genes and DAF-16 activity in adult <span class="html-italic">C. elegans</span>. (<b>A</b>) The mRNA levels of antioxidant genes in GP-treated adult <span class="html-italic">C. elegans</span> were detected by three independent quantitative reverse transcription-polymerase chain reaction analyses using <span class="html-italic">cdc-42</span> mRNA in each sample as an internal control for normalization. Error bars represent SD. * <span class="html-italic">p</span> &lt; 0.05 (Student’s <span class="html-italic">t</span>-test). (<b>B</b>) Nuclear localization of DAF-16::GFP was observed in worms treated without (CT) or with GP. The graph indicates the percentage of nuclear localization of DAF-16::GFP in neurons, hypodermis, and intestines. HEAT indicates heat shock at 37 °C for 15 min, which is used for the positive control of nuclear localization of DAF-16::GFP. Scale bars are 50 µm.</p>
Full article ">Figure 5
<p>GP intake promotes intestinal disruption in adult <span class="html-italic">C. elegans</span>. (<b>A</b>) The presence of blue food dye in the body cavity indicates leakage of the intestinal barrier after 0 (CT) or 3 µM of GP treatment. Error bars represent SD. n.s.: not significant. ** <span class="html-italic">p</span> &lt; 0.05 (chi-square test). (<b>B</b>) Transgenic worms expressing <span class="html-italic">actin 5 (ACT-5)::GFP</span> were treated with 0 (CT) or 3 µM of GP at the L4 stage for 3 days. The intestinal actin localization was classified into four stages depending on mislocalization in the apical side of the intestine. The percent distributions of the respective stage in worms are presented in the graph. Scale bars are 50 µm, ** <span class="html-italic">p</span> &lt; 0.05 (chi-square test).</p>
Full article ">Figure 6
<p>Working model: maternal gliadin peptide (GP) intake in day-3 adult <span class="html-italic">C. elegans</span> increases the level of mitochondrial ROS (mtROS) and decreases oocyte quality with chromosomal aberrations, consequently increasing embryonic lethality and decreasing oxidative stress resistance in offspring.</p>
Full article ">
19 pages, 3136 KiB  
Article
Role of Zerumbone, a Phytochemical Sesquiterpenoid from Zingiber zerumbet Smith, in Maintaining Macrophage Polarization and Redox Homeostasis
by Wei-Lan Yeh, Bor-Ren Huang, Guan-Wei Chen, Vichuda Charoensaensuk, Cheng-Fang Tsai, Liang-Yo Yang, Dah-Yuu Lu, Mao-Kai Chen and Chingju Lin
Nutrients 2022, 14(24), 5402; https://doi.org/10.3390/nu14245402 - 19 Dec 2022
Cited by 9 | Viewed by 2817
Abstract
Macrophages and microglia are highly versatile cells that can be polarized into M1 and M2 phenotypes in response to diverse environmental stimuli, thus exhibiting different biological functions. In the central nervous system, activated resident macrophages and microglial cells trigger the production of proinflammatory [...] Read more.
Macrophages and microglia are highly versatile cells that can be polarized into M1 and M2 phenotypes in response to diverse environmental stimuli, thus exhibiting different biological functions. In the central nervous system, activated resident macrophages and microglial cells trigger the production of proinflammatory mediators that contribute to neurodegenerative diseases and psychiatric disorders. Therefore, modulating the activation of macrophages and microglia by optimizing the inflammatory environment is beneficial for disease management. Several naturally occurring compounds have been reported to have anti-inflammatory and neuroprotective properties. Zerumbone is a phytochemical sesquiterpenoid and also a cyclic ketone isolated from Zingiber zerumbet Smith. In this study, we found that zerumbone effectively reduced the expression of lipocalin-2 in macrophages and microglial cell lines. Lipocalin-2, also known as neutrophil gelatinase-associated lipocalin (NGAL), has been characterized as an adipokine/cytokine implicated in inflammation. Moreover, supplement with zerumbone inhibited reactive oxygen species production. Phagocytic activity was decreased following the zerumbone supplement. In addition, the zerumbone supplement remarkably reduced the production of M1-polarization-associated chemokines CXC10 and CCL-2, as well as M1-polarization-associated cytokines interleukin (IL)-6, IL-1β, and tumor necrosis factor-α. Furthermore, the expression of inducible nitric oxide synthase (iNOS) and cyclooxygenase-2 and the production of NO were attenuated in macrophages and microglial cells supplemented with zerumbone. Notably, we discovered that zerumbone effectively promoted the production of the endogenous antioxidants heme oxygenase-1, glutamate–cysteine ligase modifier subunit, glutamate–cysteine ligase catalytic subunit, and NAD(P)H quinone oxidoreductase-1 and remarkably enhanced IL-10, a marker of M2 macrophage polarization. Endogenous antioxidant production and M2 macrophage polarization were increased through activation of the AMPK/Akt and Akt/GSK3 signaling pathways. In summary, this study demonstrated the protective role of zerumbone in maintaining M1 and M2 polarization homeostasis by decreasing inflammatory responses and enhancing the production of endogenous antioxidants in both macrophages and microglia cells. This study suggests that zerumbone can be used as a potential therapeutic drug for the supplement of neuroinflammatory diseases. Full article
(This article belongs to the Special Issue Phytochemicals and Chronic Diseases Prevention)
Show Figures

Graphical abstract

Graphical abstract
Full article ">Figure 1
<p>Inhibitory effects of zerumbone on the expression of lipocalin-2 in macrophages and microglia. RAW264.7 macrophages (<b>A</b>) and IMG adult mouse microglial cell lines (<b>B</b>) were supplemented with different concentrations of zerumbone (1, 5, or 10 µM) for 30 min and administered with lipopolysaccharide (LPS; 50 ng/mL) for 6 h. Lipocalin-2 mRNA expression levels were determined using real-time PCR and normalized to β-actin. Data are presented as the mean ± standard error of the mean (SEM) (<span class="html-italic">n</span> = 3 or 4). *** <span class="html-italic">p</span> &lt; 0.005 compared with the control group. # <span class="html-italic">p</span> &lt; 0.05, ## <span class="html-italic">p</span> &lt; 0.01 compared with the LPS alone group.</p>
Full article ">Figure 2
<p>Effects of zerumbone on ROS production in microglia. IMG cells were supplemented with various concentrations of zerumbone (1, 5, or 10 μM) for 30 min, followed by 5 mM H<sub>2</sub>O<sub>2</sub> (<b>A</b>), 5 mM AAPH (<b>B</b>), or 1 mM iron (ll) with 0.5 mM H<sub>2</sub>O<sub>2</sub> (<b>C</b>) for another 90 min. The intensity of dichlorofluorescein (DCF) fluorescence was detected through flow cytometry after 40 min of incubation with 10 µM dichloro-dihydro-fluorescein diacetate (DCFH-DA). Quantitative data are represented as the mean ± SEM (<span class="html-italic">n</span> = 4). *** <span class="html-italic">p</span> &lt; 0.005 compared with the control group. # <span class="html-italic">p</span> &lt; 0.05, ## <span class="html-italic">p</span> &lt; 0.01, ### <span class="html-italic">p</span> &lt; 0.005 compared with the treatment group alone.</p>
Full article ">Figure 3
<p>Effect of zerumbone on phagocytic ability in microglia. (<b>A</b>) IMG cells were presupplemented with different concentrations of zerumbone (1, 5, or 10 μM) for 30 min and LPS (50 ng/mL) for another 24 h. After incubation of the cells with 1 μm fluorescent YG beads for 1 h at 37 °C, the intensity of the beads was analyzed using flow cytometry. The quantitative results shown in (<b>B</b>) are the mean ± SEM (<span class="html-italic">n</span> = 4): non, no bead was uptaken by cell; 1 bead, cell uptake 1 bead; &gt;2 beads, cell uptake more than 2 beads. ** <span class="html-italic">p</span> &lt; 0.01, *** <span class="html-italic">p</span> &lt; 0.005 compared with the control group. # <span class="html-italic">p</span> &lt; 0.05, ## <span class="html-italic">p</span> &lt; 0.01 compared with the LPS alone group.</p>
Full article ">Figure 4
<p>The expression of proinflammatory mediators in macrophages and microglia in response to zerumbone. RAW264.7 (<b>A</b>,<b>B</b>) and IMG (<b>C</b>,<b>D</b>) cells were supplemented with different concentrations of zerumbone (1, 5, or 10 μM) for 30 min and then activated by LPS (50 ng/mL) for another 6 h. CXCL-10 (<b>A</b>,<b>C</b>) and CCL-2 (<b>B</b>,<b>D</b>) mRNA expression was analyzed using real-time PCR and normalized to β-actin. Data are presented as the mean ± SEM (<span class="html-italic">n</span> = 3). * <span class="html-italic">p</span> &lt; 0.05, ** <span class="html-italic">p</span> &lt; 0.01, *** <span class="html-italic">p</span> &lt; 0.005 compared with the control group. # <span class="html-italic">p</span> &lt; 0.05, ## <span class="html-italic">p</span> &lt; 0.01 compared with the LPS alone.</p>
Full article ">Figure 5
<p>The expression of proinflammatory mediators in response to zerumbone in macrophages. RAW264.7 cells were supplemented with different concentrations of zerumbone (1, 5, or 10 μM) for 30 min and then stimulated with LPS (50 ng/mL) for another 6 h (<b>A</b>–<b>C</b>) or 24 h (<b>D</b>–<b>G</b>). Expressions of IL-6 (<b>A</b>), IL-1β (<b>B</b>), and TNF-α (<b>C</b>) mRNA were analyzed using real-time PCR and normalized to β-actin. (<b>D</b>) iNOS and COX-2 protein expressions were analyzed using Western blotting. Quantitative results are shown in (<b>E</b>,<b>F</b>). (<b>G</b>) The cultural supernatant was harvested for measuring NO production by NO assay. Each bar represents the mean ± SEM (<span class="html-italic">n</span> = 3 or 4). * <span class="html-italic">p</span> &lt; 0.05, ** <span class="html-italic">p</span> &lt; 0.01, *** <span class="html-italic">p</span> &lt; 0.005 compared with the control group. # <span class="html-italic">p</span> &lt; 0.05, ## <span class="html-italic">p</span> &lt; 0.01, ### <span class="html-italic">p</span> &lt; 0.005 compared with the LPS alone group.</p>
Full article ">Figure 6
<p>The expression of proinflammatory mediators in response to zerumbone in microglia. IMG cells were supplemented with different concentrations of zerumbone (1, 5, or 10 μM) for 30 min and administered with LPS (50 ng/mL) for another 6 h (<b>A</b>–<b>C</b>) or 24 h (<b>D</b>–<b>G</b>). IL-6 (<b>A</b>), IL-1β (<b>B</b>), TNF-α (<b>C</b>), iNOS (<b>D</b>), and COX-2 (<b>E</b>) mRNA expressions were analyzed using real-time PCR and normalized to β-actin. (<b>F</b>) iNOS and COX-2 protein expressions were analyzed using Western blotting. Quantitative results are shown in (<b>G</b>,<b>H</b>). (<b>I</b>) The cultural supernatant was harvested for measuring NO production by NO assay. Each bar represents the mean ± SEM (<span class="html-italic">n</span> = 3 or 4). ** <span class="html-italic">p</span> &lt; 0.01, *** <span class="html-italic">p</span> &lt; 0.005 compared with the control group. # <span class="html-italic">p</span> &lt; 0.05, ## <span class="html-italic">p</span> &lt; 0.01, ### <span class="html-italic">p</span> &lt; 0.005 compared with the LPS alone group.</p>
Full article ">Figure 7
<p>The expression of endogenous antioxidants and anti-inflammatory cytokines in response to zerumbone in microglia. (<b>A</b>) Different concentrations of zerumbone (1, 5, or 10 μM) were supplemented on IMG cells for 24 h. Protein expressions of HO-1, GCLM, GCLC, and NQO1 were evaluated using Western blotting. The quantitative results of HO-1 (<b>B</b>), GCLM (<b>C</b>), GCLC (<b>D</b>), and NQO1 (<b>E</b>) were determined by using ImageJ. Different concentrations of zerumbone (1, 5, or 10 μM) were supplemented on IMG cells for 6 h. HO-1 (<b>F</b>), GCLM (<b>G</b>), GCLC (<b>H</b>), NQO1 (<b>I</b>), and IL-10 (<b>J</b>) mRNA expressions were quantified using real-time PCR. Each bar represents the mean ± SEM (<span class="html-italic">n</span> = 3 or 4). * <span class="html-italic">p</span> &lt; 0.05, ** <span class="html-italic">p</span> &lt; 0.01, *** <span class="html-italic">p</span> &lt; 0.001 compared with the control group.</p>
Full article ">Figure 8
<p>Zerumbone-induced endogenous antioxidant expression is mediated through AMPK and Akt/GSK3 signaling pathways. IMG cells were supplemented with zerumbone (10 μM) for 30, 60, or 120 min. The phosphorylation of AMPK and ACCα (<b>A</b>) and of Akt and GSK3α/β (<b>B</b>) were examined by Western blotting. AMPK inhibitor compound C (15 μM) was administered 30 min before supplemented with zerumbone (10 μM) for another 24 h. (<b>C</b>) HO-1 and GCLM protein expressions were detected by Western blotting, with quantitative data shown in (<b>D</b>) and (<b>E</b>). Compound C, Akt inhibitor (10 μM), or SB 216763 (SB21; 20 μM) were administered 30 min before supplemented with zerumbone for another 6 h. HO-1 (<b>F</b>), GCLC (<b>G</b>), GCLM (<b>H</b>), NQO1 (<b>I</b>), and IL-10 (<b>J</b>) mRNA expressions were determined using real-time PCR and normalized to β-actin. The quantitative results in bar graphs represent the mean ± SEM (<span class="html-italic">n</span> = 3 or 4). ** <span class="html-italic">p</span> &lt; 0.01, *** <span class="html-italic">p</span> &lt; 0.005 compared with the control group. # <span class="html-italic">p</span> &lt; 0.05, ## <span class="html-italic">p</span> &lt; 0.01, ### <span class="html-italic">p</span> &lt; 0.005 compared with zerumbone alone.</p>
Full article ">
15 pages, 311 KiB  
Article
Environmental Factors Determining Body Mass Index (BMI) within 9 Months of Therapy Post Bariatric Surgery—Sleeve Gastrectomy (SG)
by Agata Wawrzyniak and Monika Krotki
Nutrients 2022, 14(24), 5401; https://doi.org/10.3390/nu14245401 - 19 Dec 2022
Viewed by 7665
Abstract
Treatment of obesity should be multidirectional and include, in addition to bariatric surgery, changing the key factors of lifestyle and eating habits. The study aimed to assess the impact of bariatric surgery and dietary care on anthropometric measurements, blood pressure, changes in lifestyle, [...] Read more.
Treatment of obesity should be multidirectional and include, in addition to bariatric surgery, changing the key factors of lifestyle and eating habits. The study aimed to assess the impact of bariatric surgery and dietary care on anthropometric measurements, blood pressure, changes in lifestyle, and eating habits of patients within 9 months after the procedure, with the selection of environmental factors determining BMI variation. The study included 30 SG patients before surgery (month zero) and at 1, 3, 6, and 9 months after SG. Patients completed a questionnaire regarding age, sex, place of residence, education, professional activity, number of family members, financial situation, family history of obesity, previous forms of therapy, self-assessment of nutritional knowledge, receiving and following nutritional recommendations, eating habits, frequency of body weight control, leisure time. Body weight, height, waist and hip circumference, and systolic and diastolic pressure were measured, and BMI and WHR (Waist to Hip Ratio) were calculated. Within 9 months after the procedure, the patients’ body weight and BMI decreased on average by 26%. Post bariatric surgery, patients changed their eating habits. The influence of bariatric SG surgery and time after surgery was decisive for the normalization of BMI and explained the 33% variation in BMI up to 9 months after the procedure. Other factors important for the normalization of BMI after surgery were: male gender, older age of patients, family obesity (non-modifiable factors), as well as previous forms of therapy related to weight loss before surgery, shortening the intervals between meals and stopping eating at night (modifiable factors). The tested model explained 68% of the BMI variation after SG surgery for all assessed factors. Changes in lifestyle and eating habits in bariatric patients are crucial to maintaining the effect of bariatric surgery. Full article
15 pages, 1573 KiB  
Article
Dp-ucMGP as a Biomarker in Sarcopenia
by Natascha Schweighofer, Christoph W. Haudum, Olivia Trummer, Alice Lind, Ewald Kolesnik, Ines Mursic, Albrecht Schmidt, Daniel Scherr, Andreas Zirlik, Thomas R. Pieber, Nicolas Verheyen and Barbara Obermayer-Pietsch
Nutrients 2022, 14(24), 5400; https://doi.org/10.3390/nu14245400 - 19 Dec 2022
Cited by 3 | Viewed by 2352
Abstract
Sarcopenia is linked with an increased risk of falls, osteoporosis and mortality and is an increasing problem for healthcare systems. No satisfying biomarkers for sarcopenia diagnosis exist, connecting bone, fat and muscle. Matrix-GLA-protein (MGP) is an adipokine that regulates bone metabolism and is [...] Read more.
Sarcopenia is linked with an increased risk of falls, osteoporosis and mortality and is an increasing problem for healthcare systems. No satisfying biomarkers for sarcopenia diagnosis exist, connecting bone, fat and muscle. Matrix-GLA-protein (MGP) is an adipokine that regulates bone metabolism and is associated with decreased muscle strength. Associations of dp-ucMGP were analyzed in the BioPersMed cohort (58 ± 9 years), including 1022 asymptomatic subjects at moderate cardiovascular risk. Serum measurements of dp-ucMGP in 760 persons were performed with the InaKtif MGP Kit with the IDS-iSYS Multi-Discipline Automated System. DXA data (792 persons) measured with the Lunar iDXA system and physical performance data (786 persons) were available. Dp-ucMGP plasma levels correlate with sarcopenia parameters like gait speed (ρ = −0.192, p < 0.001), appendicular skeletal muscle mass (ρ = 0.102, p = 0.005) and appendicular skeletal muscle mass index (ρ = 0.112, p = 0.001). They are lower in persons with sarcopenia (p < 0.001) and higher in persons with reduced physical performance (p = 0.019). Persons in the lowest dp-ucMGP quartile have the highest risk for reduced muscle mass, decreasing with each quartile, whereas persons in the highest quartile have the highest risk of reduced muscle strength. Dp-ucMGP might be a good biomarker candidate in sarcopenia characterization. Full article
(This article belongs to the Section Sports Nutrition)
Show Figures

Figure 1

Figure 1
<p>Flow chart of available measurements in the BioPersMed study participants: PP: physical performance; HGS: handgrip strength; DXA: energy X-ray absorptiometry; dp-ucMGP: dephosphorylated, uncarboxylated matrix-GLA-protein; n: number.</p>
Full article ">Figure 2
<p>Dp-ucMGP levels in persons with and without reduced muscle mass or physical performance. Dark grey box plots represent the presence of decreased muscle mass or physical performance, whereas light grey boxes represent their absence. Dp-ucMGP: dephosphorylated, uncarboxylated Matrix-GLA-protein; pmol: picomol; L: liters, n: number; ASM: appendicular skeletal muscle mass; AMMI: appendicular skeletal muscle mass index; HGS: handgrip strength. Stars represent high extreme values and light or dark grey dots high potential outliers.</p>
Full article ">Figure 3
<p>Circulating dp-ucMGP levels and correlations with sarcopenia-relevant parameters in all (<b>A</b>) and normal and overweight/obese (<b>B</b>) individuals. Correlation analysis between circulating dp-ucMGP and muscle parameters. Spearman’s rho (ρ) and <span class="html-italic">p</span> values are indicated. In all individuals, the 95% confidence interval is indicated by light grey lines. HGS: handgrip strength; ASM: appendicular skeletal muscle mass; AMMI: appendicular skeletal muscle mass index; WHR: waist-to-hip ratio; BMI: body mass index; kg: kilogram; min: minutes, L: liter; nw: normal weight; ow: overweight; ob: obese.</p>
Full article ">Figure 4
<p>Odds ratios with 95% confidence intervals for prevalent sarcopenia features according to dp-ucMGP quartiles in 700 study participants. Adjustment: age [years], alcohol consumption [drinks per week], smoking [pack years] and cardiorespiratory fitness. Boxes with darkening shades of grey represent the dp-ucMGP quartiles.</p>
Full article ">
2 pages, 191 KiB  
Editorial
Special Issue: Nutraceutical Approaches to Cardiovascular and Metabolic Diseases: Evidence and Opportunities
by Paolo Magni, Andrea Baragetti and Andrea Poli
Nutrients 2022, 14(24), 5399; https://doi.org/10.3390/nu14245399 - 19 Dec 2022
Viewed by 1695
Abstract
The effective prevention and treatment of cardiovascular and metabolic diseases is a major task for health systems since these pathological conditions are still major causes of mortality, morbidity, and disability worldwide [...] Full article
12 pages, 3591 KiB  
Article
Combination Treatment of Withalongolide a Triacetate with Cisplatin Induces Apoptosis by Targeting Translational Initiation, Migration, and Epithelial to Mesenchymal Transition in Head and Neck Squamous Cell Carcinoma
by Chitra Subramanian, Katie K. Spielbauer, Robin Pearce, Kevin J. Kovatch, Mark E. Prince, Barbara N. Timmermann and Mark S. Cohen
Nutrients 2022, 14(24), 5398; https://doi.org/10.3390/nu14245398 - 19 Dec 2022
Cited by 1 | Viewed by 2043
Abstract
Treatment regimens for head and neck squamous cell carcinoma (HNSCC) typically include cisplatin and radiotherapy and are limited by toxicities. We have identified naturally derived withalongolide A triacetate (WGA-TA) from Physalis longifolia as a lead compound for targeting HNSCC. We hypothesized that combining [...] Read more.
Treatment regimens for head and neck squamous cell carcinoma (HNSCC) typically include cisplatin and radiotherapy and are limited by toxicities. We have identified naturally derived withalongolide A triacetate (WGA-TA) from Physalis longifolia as a lead compound for targeting HNSCC. We hypothesized that combining WGA-TA with cisplatin may allow for lower, less toxic cisplatin doses. HNSCC cell lines were treated with WGA-TA and cisplatin. After treatment with the drugs, the cell viability was determined by MTS assay. The combination index was calculated using CompuSyn. The expression of proteins involved in the targeting of translational initiation complex, epithelial to mesenchymal transition (EMT), and apoptosis were measured by western blot. Invasion and migration were measured using the Boyden-chamber assay. Treatment of MDA-1986 and UMSCC-22B cell lines with either WGA-TA or cisplatin alone for 72 h resulted in a dose dependent decrease in cell viability. Cisplatin in combination with WGA-TA resulted in significant synergistic cell death starting from 1.25 μM cisplatin. Combination treatment with WGA-TA resulted in lower cisplatin dosing while maintaining the downregulation of translational initiation complex proteins, the induction of apoptosis, and the blockade of migration, invasion, and EMT transition. These results suggest that combining a low concentration of cisplatin with WGA-TA may provide a safer, more effective therapeutic option for HNSCC that warrants translational validation. Full article
(This article belongs to the Section Nutrition and Public Health)
Show Figures

Figure 1

Figure 1
<p>MDA-1986 and UMSCC-22B cells were treated with varying concentrations of either cisplatin alone or WGA-TA alone and the cell viability after 72 h was measured via MTS assay. The IC50 values (μM) shown below were calculated using GraphPad Prism.</p>
Full article ">Figure 2
<p>(<b>A</b>,<b>B</b>). Western blot showing treatment effect on the mTOR pathway and downstream substrates. MDA1986 cells were treated with varying concentrations of WGA-TA alone or in combination with 1.25 (<b>A</b>) or 2.5 (<b>B</b>) μM cisplatin as well as cisplatin alone for 24 h. Solvent treated cells were used as control. Cells were collected, lysed, and immunoblotted for mTOR pathway proteins.</p>
Full article ">Figure 3
<p>(<b>A</b>,<b>B</b>). Western blot showing the treatment effect on translation initiation. MDA-1986 cells were treated with either 1.25 (<b>A</b>) or 2.5 (<b>B</b>) µM cisplatin either alone or in combination with either 0.125 or 0.25 or 0.50 µM TA-WGA for 24 h. Solvent treated samples served as control. Post-treatment cells were collected, and equal amounts of proteins (20 µg) were loaded on SDS-PAGE gel and transferred onto a nitro cellulose membrane. The membranes were incubated with primary antibodies of translation complex proteins. The membranes were then treated with appropriate secondary antibodies and the blots were then developed using ECL.</p>
Full article ">Figure 4
<p><b>A</b> (<b>Top</b>)<b>.</b> MDA1986 cells were treated either alone or in combination for 24 h. The induction of apoptosis and necrosis was detected using a RealTime-Glo annexin V apoptosis necrosis assay. The increase in luminescence induction of apoptosis and changes in fluorescence indicates the induction of secondary necrosis. <b>B</b> (<b>Bottom</b>). Western blot showing treatment effect on protein markers for the induction of apoptosis. MDA-1986 cells were treated with either cisplatin or WGA-TA alone or in combination for 24 h. Post-treatment cells were immunoblotted for PARP. Actin was used as a loading control.</p>
Full article ">Figure 4 Cont.
<p><b>A</b> (<b>Top</b>)<b>.</b> MDA1986 cells were treated either alone or in combination for 24 h. The induction of apoptosis and necrosis was detected using a RealTime-Glo annexin V apoptosis necrosis assay. The increase in luminescence induction of apoptosis and changes in fluorescence indicates the induction of secondary necrosis. <b>B</b> (<b>Bottom</b>). Western blot showing treatment effect on protein markers for the induction of apoptosis. MDA-1986 cells were treated with either cisplatin or WGA-TA alone or in combination for 24 h. Post-treatment cells were immunoblotted for PARP. Actin was used as a loading control.</p>
Full article ">Figure 5
<p>Immunoblot analysis of MDA-1986 cells treated with either 1.25 or 2.5 μM cisplatin alone or in combination with 0.25 or 0.50 μM WGA-TA for 24 h.</p>
Full article ">Figure 6
<p>(<b>A</b>,<b>B</b>) The Boyden chamber assay utilized approximately 100,000 MDA-1986 cells treated with either 1.25 or 2.5 μM cisplatin alone or in combination with 0.25 or 0.50 μM WGA-TA for 24 h. Control inserts were used for migration (<b>A Left</b>) and Matrigel coated inserts were used for invasion (<b>B Right</b>). Post-treatment, the cells were fixed with 2% paraformaldehyde, stained with 1% crystal violet in 20% methanol, washed and imaged using a light microscope. Quantification for the migration and invasion are given below (<b>C</b>).</p>
Full article ">
13 pages, 2829 KiB  
Article
The Effect of Breast Milk Microbiota on the Composition of Infant Gut Microbiota: A Cohort Study
by Yapeng Li, Lei Ren, Yunyi Wang, Jinxing Li, Qingqing Zhou, Chenrui Peng, Yuchen Li, Ruyue Cheng, Fang He and Xi Shen
Nutrients 2022, 14(24), 5397; https://doi.org/10.3390/nu14245397 - 19 Dec 2022
Cited by 10 | Viewed by 3235
Abstract
Evidence shows that breast milk microbiota and an infant’s gut microbiota are related. This study aimed to compare the effects of breast milk microbiota on the construction and colonization of gut microbiota in newborns. In this study, 23 healthy infants were selected and [...] Read more.
Evidence shows that breast milk microbiota and an infant’s gut microbiota are related. This study aimed to compare the effects of breast milk microbiota on the construction and colonization of gut microbiota in newborns. In this study, 23 healthy infants were selected and divided into a breastfeeding group (13) and a mixed feeding group (10) based on the feeding method within one month of age. Infant fecal and breast milk samples were collected on the day of birth (0 day) and 30 days after birth (30 days) for 16S rRNA second-generation sequencing and SCFA detection. The results showed that Firmicutes and Actinobacteriota on day 0 and Firmicutes and Proteobacteria on 30 d dominated breast milk gut microbiota. There were correlations between the breast milk microbiota and the infant gut microbiota in each group (p < 0.05). Additionally, breast milk microbiota correlated more significantly with infants’ SCFAs in the breastfeeding group than in the mixed feeding group. This study showed that breast milk microbiota partially influences the construction of infant gut microbiota, with some key strains having a crucial influence, such as Lactobacillus, Bifidobacterium, and Enterobacter. However, the effect of breast milk microbiota on infant gut microbiota is not through direct strain transmission but has been indirectly influenced, which may be related to the cross-feeding effect mediated by SCFAs. Full article
Show Figures

Figure 1

Figure 1
<p>Differences in the relative abundance of breast milk microbiota among different periods and subgroups. (0 day, <span class="html-italic">n</span> = 6; 30 days, <span class="html-italic">n</span> = 19; BF, <span class="html-italic">n</span> = 9; MF, <span class="html-italic">n</span> = 10) (<b>A</b>) Differences in the relative abundance of breast milk microbiota at 0 day and 30 days at the phylum level; (<b>B</b>) Differences in the relative abundance of breast milk microbiota at 0 day and 30 days at the genus level; (<b>C</b>) Differences in the relative abundance of breast milk microbiota at the phylum level on 30 days; (<b>D</b>) Differences in the relative abundance of breast milk microbiota at the genus level on 30 days. * <span class="html-italic">p</span> &lt; 0.05, ** <span class="html-italic">p</span> &lt; 0.01.</p>
Full article ">Figure 2
<p>Correlation between breast milk microbiota and an infant’s gut microbiota. (0-day BF, <span class="html-italic">n</span> = 5; 30-days BF, <span class="html-italic">n</span> = 9; 30-days MF, <span class="html-italic">n</span> = 10) (<b>A</b>) Correlation between breast milk microbiota and infant’s gut microbiota at the phylum level in the 0-day BF group; (<b>B</b>) Correlation between breast milk microbiota and infant’s gut microbiota at the phylum level in the 30-days BF group and 30-days MF group; (<b>C</b>) Correlation between breast milk and infant’s gut microbiota at the genus level in the 0-day BF group; (<b>D</b>) Correlation between breast milk and infant’s gut microbiota at the genus level in the 30-days BF group; (<b>E</b>) Correlation between breast milk and infant’s gut microbiota at the genus level in the 30-days MF group; (<b>F</b>) The number of correlations that were significantly different among the 0-day BF group, 30-days BF group, and 30-days MF group.</p>
Full article ">Figure 3
<p>Correlation between breast milk microbiota and SCFAs of infants’ gut microbiota on day 30. (30-days BF, <span class="html-italic">n</span> = 5; 30-days MF, <span class="html-italic">n</span> = 5) (<b>A</b>) Correlation between breast milk microbiota and SCFAs in infants’ feces at the phylum level in the 30-days BF group and 30-days MF group; (<b>B</b>) Correlation between breast milk microbiota and SCFAs in infants’ feces at the genus level in the 30-days BF group and 30-days MF group. * <span class="html-italic">p</span> &lt; 0.05, ** <span class="html-italic">p</span> &lt; 0.01.</p>
Full article ">
16 pages, 637 KiB  
Review
Evaluation of Gluten Exclusion for the Improvement of Rheumatoid Arthritis in Adults
by Avinent-Calpe Lidón, Martinez-López Patricia, Dhokia Vinesh and Massip-Salcedo Marta
Nutrients 2022, 14(24), 5396; https://doi.org/10.3390/nu14245396 - 19 Dec 2022
Cited by 3 | Viewed by 3693
Abstract
There is currently a growing anti-gluten trend which, except for individuals with coeliac disease and non-coeliac gluten sensitivity (NCGS) for whom its intake is contraindicated, results in gluten (the main protein in wheat and other cereals) being considered harmful to health and excluded [...] Read more.
There is currently a growing anti-gluten trend which, except for individuals with coeliac disease and non-coeliac gluten sensitivity (NCGS) for whom its intake is contraindicated, results in gluten (the main protein in wheat and other cereals) being considered harmful to health and excluded from diets, largely due to information distributed through social networks. However, in many cases the recommendation to exclude gluten from the diet goes beyond personal choice and is promoted by health professionals. This choice and/or recommendation is especially important to individuals with chronic inflammatory diseases such as rheumatoid arthritis (RA), for which this exclusion is justified to reduce the symptoms of the disease. The aim of this literature review is to assess whether there is scientific evidence to justify the elimination of gluten in patients with RA, neither coeliac nor with NCGS, to improve their symptoms and quality of life. The results of the search on gluten and RA carried out in the Embase database and the extraction of data from 16 articles included in the review are presented. No scientific evidence was found to recommend the exclusion of gluten in patients with RA. Full article
(This article belongs to the Section Nutrition and Public Health)
Show Figures

Figure 1

Figure 1
<p>PRISMA Flowchart of screening and section of articles.</p>
Full article ">
10 pages, 433 KiB  
Article
Association between Serum Zinc and Toll-like-Receptor- Related Innate Immunity and Infectious Diseases in Well-Nourished Children with a Low Prevalence of Zinc Deficiency: A Prospective Cohort Study
by Sui-Ling Liao, Man-Chin Hua, Ming-Han Tsai, Kuan-Wen Su, Chi Lin, Tsung-Chieh Yao, Li-Chen Chen, Kuo-Wei Yeh, Jing-Long Huang and Shen-Hao Lai
Nutrients 2022, 14(24), 5395; https://doi.org/10.3390/nu14245395 - 19 Dec 2022
Cited by 4 | Viewed by 2459
Abstract
Existing reports focus on zinc-associated immunity and infection in malnourished children; however, whether zinc also plays an important role in the immune homeostasis of the non-zinc-deficient population remained unknown. This study aimed to investigate the association between zinc status and toll-like receptor (TLR)-related [...] Read more.
Existing reports focus on zinc-associated immunity and infection in malnourished children; however, whether zinc also plays an important role in the immune homeostasis of the non-zinc-deficient population remained unknown. This study aimed to investigate the association between zinc status and toll-like receptor (TLR)-related innate immunity and infectious outcome in well-nourished children. A total of 961 blood samples were collected from 1 through 5 years of age. Serum zinc was analyzed, and mononuclear cells isolated to assess TNF-α, IL-6, and IL-10 production by ELISA after stimulation with TLR ligands. Childhood infections were analyzed as binary outcomes with logistic regression. The prevalence of zinc deficiency was 1.4–9.6% throughout the first 5 years. There was significant association between zinc and TLR-stimulated cytokine responses. Higher serum zinc was associated with decreased risk of ever having pneumonia (aOR: 0.94; 95% CI: 0.90, 0.99) at 3 years, and enterocolitis (aOR: 0.96; 95% CI: 0.93, 0.99) at 5 years. Serum zinc was lower in children who have had pneumonia before 3 years of age (72.6 ± 9 vs. 81.9 ± 13 μg/dL), and enterocolitis before 5 years (89.3 ± 12 vs. 95.5 ± 13 μg/dL). We emphasize the importance of maintaining optimal serum zinc in the young population. Full article
(This article belongs to the Special Issue Feeding Practice and Infant and Young Child Health)
Show Figures

Figure 1

Figure 1
<p>Flowchart of the cohort study: valid questionnaire information and medical records were complete for all children at various ages in the main box. The side box demonstrates the number of blood samples with 1 sample/child at each specific age period for the analysis of zinc and PBMC (peripheral mononuclear cell) isolation for the cytokine stimulation tests. Missing data: mostly because participants missed the clinical visit at that specific age period or clinical data (medical records and/or anthropometric measurements) were incomplete.</p>
Full article ">Figure 2
<p>Comparing serum zinc concentration between children who have had pneumonia (<b>A</b>) and infectious enterocolitis (<b>B</b>) before the ages of 1, 3, and 5 years with those having never suffered from the above diseases. Values represent means ± SD. * means differ at that age, <span class="html-italic">p</span> &lt; 0.05.</p>
Full article ">
18 pages, 4813 KiB  
Article
Naringenin and Quercetin Exert Contradictory Cytoprotective and Cytotoxic Effects on Tamoxifen-Induced Apoptosis in HepG2 Cells
by Zhixiang Xu, Yue Jia, Jun Liu, Xiaomin Ren, Xiaoxia Yang, Xueshan Xia and Xuejun Pan
Nutrients 2022, 14(24), 5394; https://doi.org/10.3390/nu14245394 - 19 Dec 2022
Cited by 8 | Viewed by 2497
Abstract
Tamoxifen is commonly used to treat estrogen receptor-positive breast cancer and hepatocellular carcinoma. Phytoconstituents are considered candidates for chemopreventive drugs in cancer treatment. However, it remains unknown what would happen if tamoxifen and phytoconstituents were administrated simultaneously. We aimed to observe the synergistic [...] Read more.
Tamoxifen is commonly used to treat estrogen receptor-positive breast cancer and hepatocellular carcinoma. Phytoconstituents are considered candidates for chemopreventive drugs in cancer treatment. However, it remains unknown what would happen if tamoxifen and phytoconstituents were administrated simultaneously. We aimed to observe the synergistic antitumor effects of tamoxifen and naringenin/quercetin on human hepatic carcinoma and to explore the potential underlying molecular mechanisms. The HepG2 cell line was used as an in vitro model. Cell proliferation, invasion, migration, cycle progression and apoptosis were investigated along with reactive oxygen species (ROS) production and mitochondrial membrane potential (ΔΨm) repression. The signaling pathways involved were identified using real-time quantitative polymerase chain reaction analysis. As the results show, tamoxifen in combination with higher concentrations of naringenin or quercetin significantly inhibited cell growth compared to either agent alone. These antiproliferative effects were accompanied by the inhibition of cell migration and invasion but the stimulation of cell apoptosis and loss of ΔΨm, which depended on the ROS-regulated p53 signaling cascades. Conversely, lower concentrations of naringenin and quercetin inhibited the tamoxifen-induced cell antiproliferative effects by regulating cell migration, invasion, cycle and apoptosis. Taken together, our findings revealed that phytoconstituents exerted contradictory cytoprotective and cytotoxic effects induced by tamoxifen in human hepatic cancer. Full article
(This article belongs to the Section Phytochemicals and Human Health)
Show Figures

Graphical abstract

Graphical abstract
Full article ">Figure 1
<p>Effects of increasing concentrations of tamoxifen, naringenin and quercetin or their combined treatment on cell proliferation and cytotoxicity using CCK-8 assay in HepG2 cells. Cells were exposed to tamoxifen (<b>A</b>), naringenin (<b>B</b>) and quercetin (<b>C</b>) either alone or in combination (<b>D</b>) for 24, 48 and 72 h, respectively, and then the cell viability was measured using a CCK-8 assay according to the manufacturer instructions. Results are expressed as mean ± SD of three independent experiments (<span class="html-italic">n</span> = 6). <sup>a–h</sup>: Different letters indicate significant differences (<span class="html-italic">p</span> &lt; 0.05) in cell viability after cells were treated with tamoxifen, naringenin and quercetin alone or in combination. The hyphen (-) symbolizes HepG2 cells were not treated with tamoxifen, naringenin or quercetin. <span class="html-italic">TAM</span> means tamoxifen, <span class="html-italic">Nar</span> means naringenin, and <span class="html-italic">Qu</span> means quercetin, all of the abbreviations in this article are represented in this way.</p>
Full article ">Figure 2
<p>Effects of increasing concentrations of tamoxifen, naringenin and quercetin or their combined treatment on cell proliferation and cytotoxicity using RTCA assay. Cells were exposed to tamoxifen (<b>A</b>), naringenin (<b>B</b>) and quercetin (<b>C</b>) either alone or in combination (<b>D</b>–<b>F</b>) for up to 96 h, and the normalized cell index (NCI) was determined using real-time cellular impedance analysis monitoring equipment (xCELLigence RTCA S16) according to the manufacturer instructions. Results are expressed as mean ± SD of three independent experiments (<span class="html-italic">n</span> = 2).</p>
Full article ">Figure 3
<p>Effects of tamoxifen, naringenin and quercetin on cell migration and invasion in HepG2 cells. (<b>A</b>) Scratch healing following treatment with tamoxifen (20 μM), naringenin (10 and 200 μM) and quercetin (10 and 100 μM) alone or in combination for 12, 24 and 48 h. (<b>B</b>) Relative cell invasion ratio following treatment with tamoxifen, naringenin and quercetin for 24 h. (<b>C</b>,<b>D</b>) Tamoxifen, naringenin and quercetin regulated the gene expression of MMP-2, MMP-9, E-cadherin and N-cadherin in the mRNA transcription levels. Results are expressed as mean ± SD of three independent experiments (<span class="html-italic">n</span> = 3). <sup>a–g</sup>: Different letters indicate significant differences (<span class="html-italic">p</span> &lt; 0.05) in cell migration and invasion, as well as their related genes.</p>
Full article ">Figure 4
<p>Tamoxifen, naringenin and quercetin regulated cell cycle progression in HepG2 cells. Cells were exposed to tamoxifen (20 μM), naringenin (10 and 200 μM) and quercetin (10 and 100 μM) either alone or in combination for 24 h. Percentage of cell population in the (<b>A</b>) G0/G1 phase, (<b>B</b>) S phase and (<b>C</b>) G2/M phase, respectively. (<b>D</b>) Tamoxifen, naringenin and quercetin regulated the mRNA transcription of cell cycle-related genes. Results are expressed as mean ± SD of three independent experiments (<span class="html-italic">n</span> = 3). <sup>a–h</sup>: Different letters indicate significant differences (<span class="html-italic">p</span> &lt; 0.05) in cell cycle distribution and their regulated genes.</p>
Full article ">Figure 4 Cont.
<p>Tamoxifen, naringenin and quercetin regulated cell cycle progression in HepG2 cells. Cells were exposed to tamoxifen (20 μM), naringenin (10 and 200 μM) and quercetin (10 and 100 μM) either alone or in combination for 24 h. Percentage of cell population in the (<b>A</b>) G0/G1 phase, (<b>B</b>) S phase and (<b>C</b>) G2/M phase, respectively. (<b>D</b>) Tamoxifen, naringenin and quercetin regulated the mRNA transcription of cell cycle-related genes. Results are expressed as mean ± SD of three independent experiments (<span class="html-italic">n</span> = 3). <sup>a–h</sup>: Different letters indicate significant differences (<span class="html-italic">p</span> &lt; 0.05) in cell cycle distribution and their regulated genes.</p>
Full article ">Figure 5
<p>Tamoxifen, naringenin and quercetin regulated cell apoptosis in HepG2 cells. Cells were exposed to tamoxifen (20 μM), naringenin (10 and 200 μM) and quercetin (10 and 100 μM) either alone or in combination for 24 h. (<b>A</b>–<b>C</b>) Percentage of cell population in the different apoptotic stages. (<b>D</b>) Sub-G1 DNA content of cells analyzed with PI staining. Results are expressed as mean ± SD of three independent experiments (<span class="html-italic">n</span> = 3). <sup>a–i</sup>: Different letters indicate significant differences (<span class="html-italic">p</span> &lt; 0.05) in cell apoptosis.</p>
Full article ">Figure 6
<p>Representative fluorescence immunocytochemistry of HepG2 cells exposed to tamoxifen, naringenin and quercetin. Cells were stained with DAPI after treatment with tamoxifen (20 μM), naringenin (10 and 200 μM) and quercetin (10 and 100 μM) alone or in combination for 24 h. Then, cells were scrutinized for nuclear morphology at 400× magnifications, and the white arrows (→) indicate chromatin condensation and fragmentation in apoptotic cells.</p>
Full article ">Figure 7
<p>Tamoxifen, naringenin and quercetin regulated the mRNA transcription of the typical apoptosis-related genes in HepG2 cells. (<b>A</b>) The mRNA transcription levels of p21 and p53. (<b>B</b>) The mRNA transcription levels of Bcl-2 and Bax along with Bcl-2/Bax ratios. Results are expressed as mean ± SD of three independent experiments (<span class="html-italic">n</span> = 3). <sup>a–h</sup>: Different letters indicate significant differences (<span class="html-italic">p</span> &lt; 0.05) in cell apoptosis for 24 h.</p>
Full article ">Figure 8
<p>Effects of tamoxifen, naringenin and quercetin on LDH release, GSH content and caspase activity in HepG2 cells. Cells were treated with tamoxifen, naringenin and quercetin alone or in combination for 24 h. LDH release in the culture medium (<b>A</b>) and GSH content (<b>C</b>) were measured using an LDH cytotoxicity assay and glutathione reductase assay, respectively, according to the manufacturer instructions. The relative correlations between cell viability and LDH release (<b>B</b>) or GSH content (<b>D</b>) were depicted utilizing the linear fit. (<b>E</b>,<b>F</b>) The activities of caspase-3 and caspase-9 were measured using colorimetric assay kits. Results are expressed as mean ± SD of three independent experiments (<span class="html-italic">n</span> = 6). <sup>a–h</sup>: Different letters indicate significant differences (<span class="html-italic">p</span> &lt; 0.05) in LDH release, GSH content and caspase activity.</p>
Full article ">Figure 9
<p>Tamoxifen, naringenin and quercetin regulated mitochondrial membrane potential and reactive oxygen species generation in HepG2 cells. Cells were exposed to tamoxifen (20 μM), naringenin (10 and 200 μM) and quercetin (10 and 100 μM) either alone or in combination for 24 h. (<b>A</b>) Percentage of mitochondrial membrane potential loss by JC-1 staining is represented as a bar diagram. (<b>B</b>) Loss of ΔΨm was monitored with JC-1 dye using fluorescence microscopy at a magnification of 200×. (<b>C</b>) Representative flow cytometry images showed that tamoxifen, naringenin and quercetin regulated ROS generation compared with the untreated control group. (<b>D</b>) The percentage of the cell population of DFCH-DA positive is represented as a bar diagram. Results are expressed as mean ± SD of three independent experiments (<span class="html-italic">n</span> = 3). <sup>a–h</sup>: Different letters indicate significant differences (<span class="html-italic">p</span> &lt; 0.05) in the loss of ΔΨm and ROS generation.</p>
Full article ">
12 pages, 2691 KiB  
Article
Association of Vasopressors Dose Trajectories with Enteral Nutrition Tolerance in Patients with Shock: A Prospective Observational Study
by Luping Wang, Tao Zhang, Hua Yao, Qian Xu, Xin Fu, Jing Yang, Bo Wang, Zhongwei Zhang, Xiaodong Jin, Yan Kang and Qin Wu
Nutrients 2022, 14(24), 5393; https://doi.org/10.3390/nu14245393 - 19 Dec 2022
Cited by 1 | Viewed by 2847
Abstract
(1) Background: Studies on the long-term patterns of using vasopressors in patients with shock and their correlations with the risk of feeding intolerance (FI) are limited. This study aimed to characterize the norepinephrine equivalent dose (NEQ) trajectories and explore its correlations with FI [...] Read more.
(1) Background: Studies on the long-term patterns of using vasopressors in patients with shock and their correlations with the risk of feeding intolerance (FI) are limited. This study aimed to characterize the norepinephrine equivalent dose (NEQ) trajectories and explore its correlations with FI in patients with shock. (2) Methods: This study prospectively enrolled patients with shock, who received vasopressors from August 2020 to June 2022. The Growth Mixed Model (GMM) was used to traverse longitudinal NEQ data at six-hour intervals and identify the latent trajectories of NEQ use in these patients. Cox proportional hazards regression models were used to examine the correlations of NEQ trajectories with FI. (3) Results: This study included a total of 210 patients with shock recruited from August 2020 to June 2022. Four trajectories of NEQ dose were identified and characterized by low-dose stable NEQ (L-NEQ, n = 98), moderate-dose stable NEQ (M-NEQ, n = 74), high-dose stable NEQ (H-NEQ, n = 21), and rapidly rising NEQ (R-NEQ, n = 17), with NEQ doses of 0.2, 0.4, 0.4, and 0.5 µg/kg/min at enteral nutrition (EN) initiation, respectively. The incidences of FI were 37.76%, 67.57%, 80.95%, and 76.47% in the L-NEQ, M-NEQ, H-NEQ, and R-NEQ groups, respectively (p < 0.001). As compared to the L-NEQ group, the risk of FI occurrence increased in the M-NEQ, H-NEQ, and R-NEQ groups (all p < 0.05). (4) Conclusions: The risk of FI was significantly associated with NEQ trajectories. It might be appropriate to initiate EN when the NEQ dose is stabilized below 0.2 µg/kg/min in patients with shock. Full article
(This article belongs to the Section Clinical Nutrition)
Show Figures

Figure 1

Figure 1
<p>The enrollment and follow-up of patients. ICU, intensive care unit; EN, enteral nutrition.</p>
Full article ">Figure 2
<p>Trajectories of NEQ use in patients with shock after EN initiation. NEQ, norepinephrine equivalent dose; EN, enteral nutrition.</p>
Full article ">Figure 3
<p>Radar charts of patient characteristics in the four groups. APACHE II, Acute Physiology and Chronic Health Evaluation II; BMI, body mass index; NRS2002, Nutritional Risk Screening 2002; CRP, C-reactive protein; NEQ, norepinephrine equivalent dose; PCT, procalcitonin; L-NEQ, low-dose stable NEQ; M-NEQ, moderate-dose stable NEQ; H-NEQ, high-dose stable NEQ; R-NEQ, rapidly rising NEQ.</p>
Full article ">Figure 4
<p>Stack graph of the percentage of patients with FI at different days in each group. FI, feeding intolerance; L-NEQ, low-dose stable NEQ; M-NEQ, moderate-dose stable NEQ; H-NEQ, high-dose stable NEQ; R-NEQ, rapidly rising NEQ.</p>
Full article ">Figure 5
<p>Kaplan–Meier survival curves (<b>a</b>) and cumulative risk (<b>b</b>) of FI for NEQ trajectory groups. NEQ, norepinephrine equivalent dose; L-NEQ, low-dose stable NEQ; M-NEQ, moderate-dose stable NEQ; H-NEQ, high-dose stable NEQ; R-NEQ, rapidly rising NEQ.</p>
Full article ">
17 pages, 6450 KiB  
Article
Effects of Bifidobacterium with the Ability of 2′-Fucosyllactose Utilization on Intestinal Microecology of Mice
by Bingyong Mao, Zhujun He, Yang Chen, Catherine Stanton, Reynolds Paul Ross, Jianxin Zhao, Wei Chen and Bo Yang
Nutrients 2022, 14(24), 5392; https://doi.org/10.3390/nu14245392 - 19 Dec 2022
Cited by 1 | Viewed by 2287
Abstract
In breast milk, 2′-Fucosyllactose (2′FL) is the most abundant breast milk oligosaccharide and can selectively promote the proliferation of bifidobacteria. This study aimed to explore the effect of ifidobacterial with different utilization capacities of 2′FL on the intestinal microecology of mice. Furthermore, the [...] Read more.
In breast milk, 2′-Fucosyllactose (2′FL) is the most abundant breast milk oligosaccharide and can selectively promote the proliferation of bifidobacteria. This study aimed to explore the effect of ifidobacterial with different utilization capacities of 2′FL on the intestinal microecology of mice. Furthermore, the effects of ifidobacterial with different 2′FL utilization capabilities on mice gut microbiota under the competitive pressure of 2′FL as a carbon source were explored. Compared with the control group, 2′FL, Bifidobacterium (B.) bifidum M130R01M51 + 2′FL, B. longum subsp. Longum CCFM752, and CCFM752 + 2′FL treatments significantly decreased the food intake. Moreover, the water intake, body weight, and fecal water content in all groups showed no significant difference compared with the control group. The combination of B. longum subsp. longum CCFM752 and 2′FL can significantly increase the levels of pro-inflammatory and anti-inflammatory factors. B. bifidum M130R01M51 and mixed strains combined with 2′FL significantly increased the contents of acetic acid and isobutyric acid. The results showed that B. bifidum M130R01M51, B. breve FHuNCS6M1, B. longum subsp. longum CCFM752, and B. longum subsp. infantis SDZC2M4 combined with 2′FL significantly increased the species richness of the gut microbiota. Moreover, B. longum subsp. longum CCFM752 and B. longum subsp. infantis SDZC2M4 significantly increased the abundance of Faecalibaculum and Bifidobacterium, respectively. In conclusion, exploring the impact on intestinal microecology can provide theoretical guidance for the development of personalized prebiotics for different bifidobacteria, which has the potential to improve the ecological imbalance of infant gut microbiota. Full article
(This article belongs to the Special Issue Effects of Diet–Microbiome Interactions on Chronic Diseases)
Show Figures

Figure 1

Figure 1
<p>Effects of <span class="html-italic">Bifidobacterium</span> with different utilization of 2′FL on physiological indexes in mice (n=8). (<b>A</b>) Food intake, (<b>B</b>) water intake, (<b>C</b>) body weight, (<b>D</b>) fecal water content (%). Statistical differences were calculated by ANOVA followed by Duncan analysis and different letters indicate significant differences between the groups (<span class="html-italic">p</span> &lt; 0.05).</p>
Full article ">Figure 2
<p>Effects of <span class="html-italic">Bifidobacterium</span> with different utilizations of 2′FL on morphological structure. (<b>A</b>) Colon, (<b>B</b>) ileum.</p>
Full article ">Figure 3
<p>Effects of <span class="html-italic">Bifidobacterium</span> with different utilization of 2′FL on the concentration of cytokines in mice colon tissue (n = 8). (<b>A</b>) IL-6, (<b>B</b>) IL-10, (<b>C</b>) TNF-α (<b>D</b>) IL-1β, and (<b>E</b>) IL-4. Statistical differences were calculated by ANOVA followed by Duncan analysis and different letters indicate significant differences between the groups (<span class="html-italic">p</span> &lt; 0.05).</p>
Full article ">Figure 4
<p>Effects of <span class="html-italic">Bifidobacterium</span> with different utilization of 2′FL on the concentration of short-chain fatty acid content in feces (n=8). (<b>A</b>) Acetic acid, (<b>B</b>) propionic acid, (<b>C</b>) isobutyric acid, (<b>D</b>) butyric acid, (<b>E</b>) isovaleric acid, and (<b>F</b>) valeric acid. Statistical differences were calculated by ANOVA followed by Duncan analysis and different letters indicate significant differences between the groups (<span class="html-italic">p</span> &lt; 0.05).</p>
Full article ">Figure 5
<p>α diversity index of different groups (n=8 for each group). (<b>A</b>) Chao1 index, (<b>B</b>) Shannon index, and (<b>C</b>) Simpson index. Statistical differences were calculated by ANOVA followed by Duncan analysis and different letters indicate significant differences between the groups (<span class="html-italic">p</span> &lt; 0.05).</p>
Full article ">Figure 6
<p>Phylum level composition of <span class="html-italic">Bifidobacterium</span>, <span class="html-italic">Bifidobacterium</span> + 2′FL, mixed strains group, and mixed strains + 2′FL groups (n = 8 for each group).</p>
Full article ">Figure 7
<p>LDA analysis of <span class="html-italic">Bifidobacterium</span> groups (<b>A</b>), <span class="html-italic">Bifidobacterium</span> + 2′FL groups (<b>B</b>), mixed strains groups (<b>C</b>), and mixed strains + 2′FL groups (<b>D</b>) (n = 8 for each group).</p>
Full article ">Figure 8
<p>Differences in the abundance of genus levels of <span class="html-italic">Bifidobacterium</span> group (<b>A</b>), <span class="html-italic">Bifidobacterium</span> + 2′FL group (<b>B</b>), mixed strains group (<b>C</b>), and mixed strains + 2′FL group (<b>D</b>) (n = 8 for each group).</p>
Full article ">Figure 9
<p><span class="html-italic">Bifidobacterium</span> composition analysis of mixed strains group (<b>A</b>) and mixed strains + 2′FL group (<b>B</b>) (n = 8 for each group). a1–a8 represents different samples of the mixed strains group; b1–b8 represents different samples of the mixed strains + 2′FL group. The size of the circle represents the relative abundance. The negative value represents a decrease in the relative abundance after intragastric administration, while the positive value represents an increase in the relative abundance after intragastric administration.</p>
Full article ">Figure 10
<p>Correlation analysis of horizontal composition with short-chain fatty acids and cytokines of the fecal flora of mice in the <span class="html-italic">Bifidobacterium</span> group. * <span class="html-italic">p &lt;</span> 0.05; ** <span class="html-italic">p</span> &lt; 0.01; *** <span class="html-italic">p</span> &lt; 0.001. The size of the circle represents the strength of the correlation, the negative value represents the negative correlation, and the positive value represents the positive correlation.</p>
Full article ">
11 pages, 489 KiB  
Article
The Difference in the Prevalence of Metabolic Syndrome According to Meeting Guidelines for Aerobic Physical Activity and Muscle-Strengthening Exercise: A Cross-Sectional Study Performed Using the Korea National Health and Nutrition Examination Survey, 2014–2019
by Du Ho Kwon, Young Gyu Cho, Hyun Ah Park and Ho Seok Koo
Nutrients 2022, 14(24), 5391; https://doi.org/10.3390/nu14245391 - 19 Dec 2022
Cited by 2 | Viewed by 2627
Abstract
Physical activity and muscle strengthening are essential for preventing and managing metabolic syndrome. This study was conducted to investigate the relationship between the prevalence of metabolic syndrome and meeting the guidelines for aerobic physical activity (APA), muscle strengthening exercise (MSE), and combined exercise. [...] Read more.
Physical activity and muscle strengthening are essential for preventing and managing metabolic syndrome. This study was conducted to investigate the relationship between the prevalence of metabolic syndrome and meeting the guidelines for aerobic physical activity (APA), muscle strengthening exercise (MSE), and combined exercise. We used data from 22,467 Koreans aged 40 years or older, who participated in in the Korea National Health and Nutrition Examination Survey (KNHANES) 2014–2019. We used the Global Physical Activity Questionnaire (GPAQ) to measure physical activity and surveyed frequency of MSE through a questionnaire. Metabolic syndrome was defined according to the American heart association and the National Heart, Lung, and Blood Institute. Compared with none exercise group, odds ratios of APA, MSE, and combined exercise group (CEG) on metabolic syndrome prevalence were 0.85 (95% confidence interval (CI), 0.74–0.98), 0.81 (95% CI, 0.67–0.99), and 0.65 (95% CI, 0.54–0.78) among men, respectively. Among women, ORs of APA, MSE, and CEG were 0.83 (95% CI, 0.73–0.93), 0.73 (95% CI, 0.58–0.91), and 0.74 (95% CI, 0.58–0.93), respectively. This study showed that meeting guidelines for APA and MSE was associated with lower prevalence of metabolic syndrome. Furthermore, subjects who met both APA and MSE had the lowest metabolic syndrome prevalence. Full article
(This article belongs to the Section Nutrition and Public Health)
Show Figures

Figure 1

Figure 1
<p>Odds ratio and 95% confidence interval of each exercise group on the prevalence of metabolic syndrome (reference: none exercise group). Model 1: adjusted by age (continuous), Model 2: adjusted by age (continued), smoking (present or not), alcohol (&lt;1/year, &lt;1/month, ≥2/month), BMI (continuous), Model 3: adjusted by age (continuous), smoking (present or not), alcohol (&lt;1/year, &lt;1/month, ≥2/month), BMI (continuous), locality of dwelling (urban or rural), education level (under elementary school, elementary school graduate or middle school less, middle school graduate or high school less, university undergraduate or graduate) and household income (lower, middle, middle upper, and upper). Abbreviations: APA, aerobic physical activity group; MSE, muscle strengthening exercise group; CEG, combined exercise group.* <span class="html-italic">p</span>-value &lt; 0.05, ** <span class="html-italic">p</span>-value &lt; 0.01, *** <span class="html-italic">p</span>-value &lt; 0.001.</p>
Full article ">
12 pages, 2460 KiB  
Article
Chebulic Acid Prevents Hypoxia Insult via Nrf2/ARE Pathway in Ischemic Stroke
by Rong Zhou, Kuan Lin, Changlong Leng, Mei Zhou, Jing Zhang, Youwei Li, Yujing Liu, Xiansheng Ye, Xiaoli Xu, Binlian Sun, Xiji Shu and Wei Liu
Nutrients 2022, 14(24), 5390; https://doi.org/10.3390/nu14245390 - 19 Dec 2022
Cited by 2 | Viewed by 3531
Abstract
Excessive reactive oxygen species (ROS) production contributes to brain ischemia/reperfusion (I/R) injury through many mechanisms including inflammation, apoptosis, and cellular necrosis. Chebulic acid (CA) isolated from Terminalia chebula has been found to have various biological effects, such as antioxidants. In this study, we [...] Read more.
Excessive reactive oxygen species (ROS) production contributes to brain ischemia/reperfusion (I/R) injury through many mechanisms including inflammation, apoptosis, and cellular necrosis. Chebulic acid (CA) isolated from Terminalia chebula has been found to have various biological effects, such as antioxidants. In this study, we investigated the mechanism of the anti-hypoxic neuroprotective effect of CA in vitro and in vivo. The results showed that CA could protect against oxygen-glucose deprivation/reoxygenation (OGD/R) induced neurotoxicity in SH-SY5Y cells, as evidenced by the enhancement of cell viability and improvement of total superoxide dismutase (T-SOD) in SH-SY5Y cells. CA also attenuated OGD/R-induced elevations of malondialdehyde (MDA) and ROS in SH-SY5Y cells. Nuclear factor-E2-related factor 2 (Nrf2) is one of the key regulators of endogenous antioxidant defense. CA acted as antioxidants indirectly by upregulating antioxidant-responsive-element (ARE) and Nrf2 nuclear translocation to relieve OGD/R-induced oxidative damage. Furthermore, the results showed that CA treatment resulted in a significant decrease in ischemic infarct volume and improved performance in the motor ability of mice 24 h after stroke. This study provides a new niche targeting drug to oppose ischemic stroke and reveals the promising potential of CA for the control of ischemic stroke in humans. Full article
Show Figures

Graphical abstract

Graphical abstract
Full article ">Figure 1
<p>Chebulic acid attenuates OGD/R induced cell death in SH-SY5Y cells. (<b>A</b>) Chemical structure of chebulinic acid (CA). (<b>B</b>) SH-SY5Y cells were incubated for 24 h with various concentrations of CA (10–300 μg/mL). Cell viability was determined using CCK8 assay; bars represent the percentage of cell viability. (<b>C</b>) SH-SY5Y cells were inoculated with different concentrations of CA (10–100 μg /mL) and exposed to OGD/R. (<b>D</b>) T-SOD levels in cells. (<b>E</b>) MDA levels in cells. Results are expressed as mean ± SD. # <span class="html-italic">p</span> &lt; 0.05, ## <span class="html-italic">p</span> &lt; 0.01, and ### <span class="html-italic">p</span> &lt; 0.001 compared with the control. * <span class="html-italic">p</span> &lt; 0.05, ** <span class="html-italic">p</span> &lt; 0.01, and *** <span class="html-italic">p</span> &lt; 0.001 versus OGD/R group.</p>
Full article ">Figure 2
<p>Effect of CA on ROS levels. (<b>A</b>,<b>B</b>) Representative images of ROS with magnification at 20×. (<b>C</b>,<b>D</b>) ROS production was detected in each condition. (<b>E</b>,<b>F</b>) The apoptosis rate was measured using flow cytometry. Results are expressed as mean ± SD. ### <span class="html-italic">p</span> &lt; 0.001 compared with the control. ** <span class="html-italic">p</span> &lt; 0.01, and *** <span class="html-italic">p</span> &lt; 0.001 versus OGD/R group.</p>
Full article ">Figure 3
<p>Nrf2 nuclear translocation was enhanced by CA in OGD/R-insulted SH-SY5Y cells. (<b>A</b>) SH-SY5Y cells in different groups were first stained with anti- Nrf2 antibody (red) and then counterstained with DAPI (blue) (40×). (<b>B</b>–<b>D</b>) The expression of nuclear Nrf2 and total Nrf2 were determined by western blot. (<b>E</b>–<b>H</b>) Chebulinic acid promoted the activation of Nrf2-ARE pathways. Western blot analysis was carried out with specific antibodies for detecting the activation of Keap1, iNOS, HO-1. Results are expressed as mean ± SD. # <span class="html-italic">p</span> &lt; 0.05, and ## <span class="html-italic">p</span> &lt; 0.01 compared with the control. * <span class="html-italic">p</span> &lt; 0.05, and ** <span class="html-italic">p</span> &lt; 0.01 versus OGD/R group.</p>
Full article ">Figure 4
<p>CA decreased cerebral damage and apoptosis following ischemia-reperfusion in vivo. (<b>A</b>) The timeline of CA administration in the OGD/R model. (<b>B</b>,<b>C</b>) Mouse behavioral performance in the mNSS score test and rotarod test with different treatments. (<b>D</b>,<b>E</b>) Effect of CA on apoptosis on the affected side of mice (TUNEL staining). Three animals were randomly selected from each group, and five fields of view were randomly selected from each section. ## <span class="html-italic">p</span> &lt; 0.01, and ### <span class="html-italic">p</span> &lt; 0.001 compared with the sham group. * <span class="html-italic">p</span> &lt; 0.05, ** <span class="html-italic">p</span> &lt; 0.01, and *** <span class="html-italic">p</span> &lt; 0.001 versus MCAO group.</p>
Full article ">Figure 5
<p>CA reduced infarct volume after ischemia-reperfusion in vivo. (<b>A</b>,<b>B</b>) Cerebral infarct volumes of rats in different treatment groups. Red staining represents normal tissues, and white staining represents the infarct region. (<b>C</b>–<b>G</b>) Chebulic acid increases activation of the Nrf2-ARE pathway in vivo. Western blot analysis was performed with specific antibodies to detect the activation of Nrf2, Keap1, iNOS, and HO−1 in the ischemic hemisphere (representative images from three independent experiments are shown). The results are expressed as mean ± SD. # <span class="html-italic">p</span> &lt; 0.05 and ### <span class="html-italic">p</span> &lt; 0.001 compared with the sham group. * <span class="html-italic">p</span> &lt; 0.05, ** <span class="html-italic">p</span> &lt; 0.01, and *** <span class="html-italic">p</span> &lt; 0.001 versus MCAO group.</p>
Full article ">
10 pages, 580 KiB  
Article
Examining the Composition of the Oral Microbiota as a Tool to Identify Responders to Dietary Changes
by Kirstin Vach, Ali Al-Ahmad, Annette Anderson, Johan Peter Woelber, Lamprini Karygianni, Annette Wittmer and Elmar Hellwig
Nutrients 2022, 14(24), 5389; https://doi.org/10.3390/nu14245389 - 19 Dec 2022
Cited by 1 | Viewed by 2170
Abstract
Background: The role of diet and nutrition in the prevention of oral diseases has recently gained increasing attention. Understanding the influence of diet on oral microbiota is essential for developing meaningful prevention approaches to oral diseases, and the identification of typical and atypical [...] Read more.
Background: The role of diet and nutrition in the prevention of oral diseases has recently gained increasing attention. Understanding the influence of diet on oral microbiota is essential for developing meaningful prevention approaches to oral diseases, and the identification of typical and atypical responders may contribute to this. Methods: We used data from an experimental clinical study in which 11 participants were exposed to different dietary regimens in five consecutive phases. To analyse the influence of additional nutritional components, we examined changes in bacterial concentrations measured by culture techniques compared to a run-in phase. A measure of correspondence between the mean and individual patterns of the bacterial composition is introduced. Results: The distance measures introduced showed clear differences between the subjects. In our data, two typical and three atypical responders appear to have been identified. Conclusions: The proposed method is suitable to identify typical and atypical responders, even in small datasets. We recommend routinely performing such analyses. Full article
Show Figures

Figure 1

Figure 1
<p>Description of the study design.</p>
Full article ">Figure 2
<p>(<b>a</b>) Sorted mean values of the average changes for bacteria 1 to 10 for phase II (top) to phase V (bottom). (<b>b</b>) Colour scheme for the bacterial groups; spp. = species pluralis.</p>
Full article ">Figure 3
<p>Individual mean changes for all bacteria and phases. Black line: population mean. The bacteria in each phase are in descending order according to their mean value.</p>
Full article ">Figure 4
<p>Individual mean changes for participants 1 (red) and 6 (purple) for all bacteria in phase V. Black line: population mean. The bacteria in each phase are in descending order according to their mean value.</p>
Full article ">Figure 5
<p><math display="inline"><semantics> <mi>τ</mi> </semantics></math> for all 11 participants acrosss phases II–V.</p>
Full article ">Figure 6
<p>Individual patterns for atypical responders 6 (purple), 8 (orange), and 11 (lavender). Black line: population mean. (<b>a</b>) Individual bacterial concentrations of all bacteria in phases I–V. For the bacterial colour scheme used, see <a href="#nutrients-14-05389-f002" class="html-fig">Figure 2</a>. (<b>b</b>) Individual mean changes for phases II–V. The bacteria in each phase are presented in descending order according to their mean values.</p>
Full article ">
15 pages, 1210 KiB  
Article
Nutritional Impact and Eating Pattern Changes in Schizophrenic Spectrum Disorders after Health Education Program on Symbiotic Dietary Modulation Offered by Specialised Psychiatric Nursing–Two-Arm Randomised Clinical Trial
by Alfonso Sevillano-Jiménez, Manuel Romero-Saldaña, María García-Rodríguez, Rafael Molina-Luque and Guillermo Molina-Recio
Nutrients 2022, 14(24), 5388; https://doi.org/10.3390/nu14245388 - 19 Dec 2022
Cited by 2 | Viewed by 3992
Abstract
Background: The traditional therapeutic approach has perceived the role of nutrition as a minor intervention in psychiatry. The microbiota–gut–brain axis theory evidences the influence of dietary and nutritional patterns on mental health. Aims: To evidence the impact of dietary advice on increasing symbiotic [...] Read more.
Background: The traditional therapeutic approach has perceived the role of nutrition as a minor intervention in psychiatry. The microbiota–gut–brain axis theory evidences the influence of dietary and nutritional patterns on mental health. Aims: To evidence the impact of dietary advice on increasing symbiotic intake on nutritional status and dietary habits in individuals with schizophrenia spectrum disorders. Methods: Randomised clinical trial (two-arm, double-blind, balanced-block, six-month intervention) in 50 individuals diagnosed with schizophrenia spectrum disorders. The control group received conventional dietary advice on an individual basis. A personal nutritional education programme was established in the intervention group (IG) to increase prebiotic and probiotic intake through dietary advice (dairy and fermented foods, green leafy vegetables, high-fibre fruit, whole grains, etc.). Data on nutritional status and dietary habits were collected (baseline and six months). The degree of dietary adherence to the recommended patterns was recorded weekly. Anthropometric parameters were also analysed monthly. Results: Finally, 44 subjects completed the follow-up. All participants exceeded the dietary reference intakes. The overall and intra-group analysis showed a statistically significant (p < 0.05) reduction in macro and micronutrient intakes with a closer approximation to the recommended dietary intakes, except for polyunsaturated fatty acids, oligosaccharides, polysaccharides and dietary fibre. After six months of intervention, statistical differences (p < 0.001) were found in all variables of the anthropometric profile in the IG, as well as an increase in the consumption of foods with a high symbiotic content (at baseline and six months). Likewise, a reduction in eggs, meat, fish, sugars and ultra-processed foods was evident, leading to significant intra-group differences (p < 0.05). Conclusions: Implementing conventional nutritional education strategies and specific nutritional advice with a symbiotic effect improves the dietary-nutritional profile in patients with schizophrenia spectrum disorders. Furthermore, it highlights the nutritional impact on mental health, stating itself as adjuvant therapy for physical health and lifestyle improvement. Full article
(This article belongs to the Special Issue Clinical Nutrition for Prevention and Treatment of Chronic Diseases)
Show Figures

Figure 1

Figure 1
<p>Study Design. * Data collected at baseline and six months of intervention: (1) Nutritional profile. ** Data collected at baseline and monthly during the intervention: (1) Anthropometric data (weight, height, Body Mass Index—BMI, waist circumference and waist-to-height ratio—WHtR-); (2) R-24 (weekly determination of foods with high symbiotic content in adherence to established dietary plan).</p>
Full article ">Figure 2
<p>CONSORT flow diagram.</p>
Full article ">
16 pages, 5247 KiB  
Article
Flavor Wheel Construction and Sensory Profile Description of Human Milk
by Mingguang Yu, Chengdong Zheng, Qinggang Xie, Yuan Tang, Ying Wang, Baosong Wang, Huanlu Song, Yalin Zhou, Yajun Xu and Rongqiang Yang
Nutrients 2022, 14(24), 5387; https://doi.org/10.3390/nu14245387 - 19 Dec 2022
Cited by 7 | Viewed by 6079
Abstract
To explore the flavor characteristics of human milk, we constructed a three-tiered human milk flavor wheel based on 53 sensory descriptors belonging to different sensory categories. Fifteen sensory descriptors were selected using M-value and multivariate statistical methods, and the corresponding references were set [...] Read more.
To explore the flavor characteristics of human milk, we constructed a three-tiered human milk flavor wheel based on 53 sensory descriptors belonging to different sensory categories. Fifteen sensory descriptors were selected using M-value and multivariate statistical methods, and the corresponding references were set up to realize qualitative and quantitative sensory evaluation of the human milk samples. To ensure the accuracy and reliability of the sensory evaluation, the performance of the sensory panelists was also tested. The sensory profile analysis indicated that the established sensory descriptors could properly reflect the general sensory properties of the human milk and could also be used to distinguish different samples. Further investigation exposed that the fat content might be an important factor that influence the sensory properties of human milk. To the best of our knowledge, this is the first report on the flavor wheel of human milk. Full article
(This article belongs to the Special Issue Nutrition and Metabolism in the First 1,000 Days of Life)
Show Figures

Figure 1

Figure 1
<p>Human milk flavor wheel.</p>
Full article ">Figure 2
<p>Principal component analysis (PCA) and hierarchical cluster analysis (HCA) of the sensory profile descriptors of human milk. (<b>A</b>,<b>B</b>) aroma, (<b>C</b>,<b>D</b>) flavor, (<b>E</b>,<b>F</b>) mouthfeel.</p>
Full article ">Figure 3
<p>Evaluation of the sensory panel performance. (<b>A</b>,<b>B</b>) consistency, (<b>C</b>(<b>a</b>)) discrimination ability, (<b>C</b>(<b>b</b>)) repeatability. (p: panelists). (<b>B</b>(<b>a</b>–<b>d</b>)) Manhattan plot of dairy-fat, creamy, grassy/green and sweet, respectively).</p>
Full article ">Figure 4
<p>The sensory profile spider-web diagrams of human milk samples. (<b>A</b>) human milk samples from different geographical regions (BJ: Beijing; JS: Jiangsu; AH: Anhui), (<b>B</b>) human milk samples with different total fat contents (TFC), (<b>C</b>) human milk samples with different lactation periods (LP). (LP-H: high lactation period; LP-M: medium lactation period; LP-L: low lactation period; TFC-H: high total fat content, TFC-M: medium total fat content; TFC-L: low total fat content; BJ: Beijing; JS: Jiangsu; AH: Anhui). The sensory intensity of human milk was quantitatively scored on a scale of 0 to 5 with 0.5 increments, where “0” means that the flavor was not felted, and “5” means that the flavor was strong.)</p>
Full article ">
12 pages, 270 KiB  
Article
Nutrient Content and Compliance with Sodium Standards in Elementary School Meals in the United States Pre- and Post-COVID-19
by Leah Elizabeth Chapman, Scott Richardson, Amanda A. Harb, Evan Fear, Tara P. Daly, Deborah A. Olarte, Meghan Hawley, Emelia Zukowski, Colin Schwartz, Meghan Maroney and Juliana F. W. Cohen
Nutrients 2022, 14(24), 5386; https://doi.org/10.3390/nu14245386 - 19 Dec 2022
Cited by 2 | Viewed by 3863
Abstract
Various federal policies have weakened school meal nutrition standards in the United States since the passage of the Healthy, Hunger-Free Kids Act in 2010, including temporary school meal nutrition waivers to promote post-COVID-19 pandemic recovery. This study used school menu and nutrient data [...] Read more.
Various federal policies have weakened school meal nutrition standards in the United States since the passage of the Healthy, Hunger-Free Kids Act in 2010, including temporary school meal nutrition waivers to promote post-COVID-19 pandemic recovery. This study used school menu and nutrient data from a nationally representative sample of 128 elementary school districts to examine differences in nutrients (average calories, total fat, saturated fat, sodium, total sugar, and fiber) and alignment with United States Department of Agriculture (USDA) sodium targets in 2019 (pre-pandemic) and in 2022 (post-pandemic). Data were analyzed using analysis of variance accounting for repeated measures within school districts, adjusting for geographic region and urbanicity. Small differences in the nutrient content for both breakfast and lunch were observed between 2019 and 2022. Most weeks met USDA sodium Target 1 for breakfast (≥95% of weeks) and Target 1 (≥96% of weeks) and Target 1A for lunch (≥92% of weeks) in both 2019 and 2022, although compliance decreased slightly when condiments were included. Additionally, meals provided on average 57 g of total sugar. Overall, many meals are already in alignment with lower sodium targets. Simple strategies, such as offering lower sodium condiments, can further reduce sodium in school meals. The total sugar levels observed highlight that the USDA should consider limits on added sugars in school meals. Full article
(This article belongs to the Special Issue School Meals and Children’s Dietary Behaviour)
9 pages, 2296 KiB  
Article
Association between Free Sugars Intake and Risk of Metabolic Syndrome in Chinese Adults: Results from the China Health and Nutrition Survey, 2000–2018
by Feng Pan, Zhihong Wang, Huijun Wang, Chang Su, Jiguo Zhang, Wenwen Du, Xiaofang Jia, Liusen Wang, Hongru Jiang, Weiyi Li, Bing Zhang and Gangqiang Ding
Nutrients 2022, 14(24), 5385; https://doi.org/10.3390/nu14245385 - 19 Dec 2022
Cited by 2 | Viewed by 2420
Abstract
The association of free sugars intake with metabolic syndrome (MetS) is controversial. This study aimed to examine the association between free sugars intake and risk of MetS in Chinese adults. The data were from seven waves of the China Health and Nutrition Survey [...] Read more.
The association of free sugars intake with metabolic syndrome (MetS) is controversial. This study aimed to examine the association between free sugars intake and risk of MetS in Chinese adults. The data were from seven waves of the China Health and Nutrition Survey (2000–2018), a longitudinal and open prospective cohort study. Dietary intake was calculated based on the data collected by consecutive 3-day 24-h dietary recalls combined with household weighing for foods or condiments. Cox proportion hazard regressions and restricted cubic spline (RCS) were performed to explore the associations between free sugars intake and the risk of MetS. The present study selected 12,048 adults aged 18 years and above. During a median (IQR) follow-up of 9.0 (7.0, 15.0) years with 131,844.0 person-years, 3970 (32.95%) MetS occurred. After adjusting for all potential confounders, compared to adults with free sugars intake of <5 g/day group, adults with free sugars intake of 5–20 g/day were associated with a higher risk of MetS (HR, 1.094; 95% CI, 1.009–1.186). No significant association was observed between free sugars intake of >20 g/day and the risk of MetS (HR, 1.011; 95% CI, 0.800–1.277). There is an urgent need to pay attention to the intake of free sugars and comprehensive measures such as the improvements in the processing of sugary foods, and sugar composition should be included on food nutrition labels to control intake of free sugars in China. Full article
(This article belongs to the Section Nutritional Epidemiology)
Show Figures

Figure 1

Figure 1
<p>The relationships between free sugars intake and the risk of MetS during follow-up. The hazard ratio for MetS with the corresponding 95% confidence interval as a function of free sugars intake from Cox proportional hazard regression models adjusted for gender, age, educational level, place of residence, region of residence, individual annual income, drinking history, smoking history, physical activity, and total energy. (<b>a</b>) overall participants, <span class="html-italic">p</span> for nonlinear = 0.1623; (<b>b</b>) men, <span class="html-italic">p</span> for nonlinear = 0.4183; (<b>c</b>) women, <span class="html-italic">p</span> for nonlinear = 0.0374.</p>
Full article ">
12 pages, 1026 KiB  
Article
Caffeine Intake throughout Pregnancy, and Factors Associated with Non-Compliance with Recommendations: A Cohort Study
by María Rosario Román-Gálvez, Sandra Martín-Peláez, Loreto Hernández-Martínez, Naomi Cano-Ibáñez, Rocío Olmedo-Requena, Juan Miguel Martínez-Galiano, Aurora Bueno-Cavanillas and Carmen Amezcua-Prieto
Nutrients 2022, 14(24), 5384; https://doi.org/10.3390/nu14245384 - 18 Dec 2022
Cited by 1 | Viewed by 3293
Abstract
Maternal caffeine consumption is associated with adverse gestational outcomes. The aim of this study was to assess the intake of caffeine and factors associated with the non-adherence to caffeine intake recommendations in a cohort of 463 women before (T0) and in each trimester [...] Read more.
Maternal caffeine consumption is associated with adverse gestational outcomes. The aim of this study was to assess the intake of caffeine and factors associated with the non-adherence to caffeine intake recommendations in a cohort of 463 women before (T0) and in each trimester of gestation (T1, T2, and T3), by using validated questionnaires. Caffeine intake (median (mg/day), IQR) was 100.0 (181.1) at T0, 9.42 (66.2) at T1, 12.5 (65.6) at T2, and 14.0 (61.1) at T3 (p < 0.001). Non-compliance prevalence (intake > 200 mg/day) was 6.2% at T1, 4.2% at T2, and 2.7% at T3. Not being an active smoker at T1 (OR = 0.17; 95% CI 0.05–0.59) and T2 (OR = 0.22; 95% CI 0.09–0.52), adherence to the Mediterranean Diet at T1 (OR = 0.50; 95% CI 0.28–0.88) and T2 (OR = 0.39; 95% CI 0.15–1.02), and moderate physical activity at T1 (OR = 0.50; 95% CI 0.28–0.88) were inversely associated with caffeine consumption. Although caffeine intake may be considered low, intake prevalence increases throughout pregnancy. Although the main source of caffeine during pregnancy is coffee, attention must be also paid to the increasingly intake of chocolate, of which the effect during pregnancy is controversial. Smoking, non-adherence to a good quality diet, and light physical activity are associated with a higher caffeine intake and a lower compliance with caffeine intake recommendations. Perinatal dietary and lifestyle educational policies are needed. Full article
(This article belongs to the Special Issue Dietary Bioactives, Gut Microbiota, and Human Health)
Show Figures

Figure 1

Figure 1
<p>Cohort flow chart.</p>
Full article ">Figure 2
<p>Prevalence of caffeine intake before and during pregnancy. T0 (pre-pregnancy), T1, T2, T3: first (12th gestational week), second (24th ± 2 gestational weeks), and third (at 32nd gestational week) trimester of gestation, respectively.</p>
Full article ">
12 pages, 2889 KiB  
Article
p-Hydroxybenzoic Acid Ameliorates Colitis by Improving the Mucosal Barrier in a Gut Microbiota-Dependent Manner
by Xue Han, Miaomiao Li, Lijun Sun, Xinjuan Liu, Yue Yin, Jianyu Hao and Weizhen Zhang
Nutrients 2022, 14(24), 5383; https://doi.org/10.3390/nu14245383 - 18 Dec 2022
Cited by 11 | Viewed by 2520
Abstract
Inflammatory bowel disease (IBD) is a chronic intestinal inflammatory disease characterized by intestinal inflammatory cell infiltration and intestinal mucosal damage. The mechanism by which diet contributes to the pathogenesis of IBD remains largely unknown. In this study, we explored the therapeutic effect of [...] Read more.
Inflammatory bowel disease (IBD) is a chronic intestinal inflammatory disease characterized by intestinal inflammatory cell infiltration and intestinal mucosal damage. The mechanism by which diet contributes to the pathogenesis of IBD remains largely unknown. In this study, we explored the therapeutic effect of p-hydroxybenzoic acid (HA), a phenolic acid mainly derived from dietary polyphenols in the gut, on DSS-induced colitis. HA intervention effectively relieved the dextran sulfate sodium salt (DSS)-induced colitis, reduced inflammation, and enhanced mucosal barrier function, as evidenced by an increment of goblet cell numbers and MUC2. These effects were largely dependent on the gut microbiota (GM), as antibiotics treatment substantially attenuated the improvement of colitis by HA. On the other hand, transplantation of GM from colitis mice treated with HA significantly reduced the colitis induced by DSS. Our study demonstrates that HA ameliorates DSS-induced colitis by improving the mucosal barrier in a GM-dependent manner. This study provides new dietary choices for the prevention and treatment of IBD. Full article
(This article belongs to the Section Nutrition and Metabolism)
Show Figures

Graphical abstract

Graphical abstract
Full article ">Figure 1
<p>HA ameliorates colitis induced by DSS. (<b>A</b>) Experimental design. (<b>B</b>) Percentage change in body weight after DSS treatment. (<b>C</b>) Disease activity index on day 7. (<b>D</b>,<b>E</b>) Representative images and length of the colon. (<b>F</b>,<b>G</b>) Representative image of H&amp;E staining of colon and pathological score. The right lower panels (20×) are images enlarged from the low magnification panels (2.5×). (<b>H</b>) Relative mRNA expression of inflammatory factors in the colon. (<b>I</b>–<b>M</b>) Concentrations of IL4, IL6, TNFa, IL17, and IL10 in serum. Data are expressed as mean ± SE, n = 8–10, * <span class="html-italic">p</span> &lt; 0.05, ** <span class="html-italic">p</span> &lt; 0.01.</p>
Full article ">Figure 2
<p>HA improves mucosal barrier. (<b>A</b>) Relative mRNA expression of tight junction genes and mucin genes in the colon. (<b>B</b>,<b>C</b>) Immunohistochemical analysis of MUC2 in the colon (20×). (<b>D</b>,<b>E</b>) PAS-AB staining of the colon (20×). Data are expressed as mean ± SE, n = 8–10, * <span class="html-italic">p</span> &lt; 0.05, ** <span class="html-italic">p</span> &lt; 0.01.</p>
Full article ">Figure 3
<p>Antibiotics treatment blunts the effects of HA. (<b>A</b>) The β-diversity analysis of GM by principal component analysis (PCA) plot of Control, DSS, and DSS + HA (<span class="html-italic">n</span> = 4–5). (<b>B</b>) Experimental design of antibiotics (AB) treatment. (<b>C</b>) Percentage change in body weight after DSS treatment. (<b>D</b>) Disease activity index (DAI) on day 7. (<b>E</b>,<b>F</b>) Representative image and length of the colon. (<b>G</b>,<b>H</b>) Representative image of H&amp;E staining of colon and pathological score. The small panels (20×) were enlarged from the large panels (2.5×). (<b>I</b>) Relative mRNA expression of tight junction genes and mucin genes in the colon. (<b>J</b>,<b>L</b>) Immunohistochemical analysis of MUC2 in the colon (20×). (<b>K</b>,<b>M</b>) PAS-AB staining of the colon (20×). (<b>N</b>) Relative mRNA expression of inflammatory factors in the colon. Data are expressed as mean ± SE, n = 8–10, * <span class="html-italic">p</span> &lt; 0.05.</p>
Full article ">Figure 4
<p>Microbiota Transplants (FMT) from colitis mice treated with HA ameliorate colitis. (<b>A</b>) Experimental design. (<b>B</b>) Percentage change in body weight after DSS treatment. (<b>C</b>) Disease activity index on day 7. (<b>D</b>,<b>E</b>) Representative images and length of the colon. (<b>F</b>,<b>G</b>) Representative image of H&amp;E staining of colon and pathological score. The small panels (20×) were enlarged from the large panels (2.5×). Data are expressed as mean ± SE, n = 8–10, and significant differences (<span class="html-italic">p</span> &lt; 0.05) are denoted by a,b,c.</p>
Full article ">Figure 5
<p>FMT from colitis mice treated with HA improves the mucosal barrier. (<b>A</b>) Relative mRNA expression of mucin genes in the colon. (<b>B</b>,<b>C</b>) Immunohistochemical analysis of MUC2 in the colon (20×). (<b>D</b>,<b>E</b>) PAS-AB staining of the colon (20×). Data are expressed as mean ± SE, n = 8–10, * <span class="html-italic">p</span> &lt; 0.05, ** <span class="html-italic">p</span> &lt; 0.01, lowercase letters (a,b) indicate significant differences (<span class="html-italic">p</span> &lt; 0.05).</p>
Full article ">Figure 6
<p>FMT from colitis mice treated with HA increases the abundance of <span class="html-italic">Akkermansia muciniphila</span>. (<b>A</b>) The LefSe analysis of the DSS + NC FMT group and DSS + HA FMT group. (<b>B</b>–<b>E</b>) The α-diversity analysis of the gut microbiome at the OTU level, determined by the Chao1, Observed OTUs, Shannon and Simpson index. (<b>F</b>) The β-diversity analysis by principal component analysis (PCA) plot. (<b>G</b>) The microbial predicted metabolic functional data using Tax4Fun method. Data are expressed as mean ± SE, n = 5, * <span class="html-italic">p</span> &lt; 0.05.</p>
Full article ">
14 pages, 2075 KiB  
Article
Rice Germ Ameliorated Chronic Unpredictable Mild Stress-Induced Depressive-like Behavior by Reducing Neuroinflammation
by Sosorburam Batsukh, Seyeon Oh, Kyoungmin Rheu, Bae-Jin Lee, Chul-Hyun Park, Kuk Hui Son and Kyunghee Byun
Nutrients 2022, 14(24), 5382; https://doi.org/10.3390/nu14245382 - 18 Dec 2022
Cited by 7 | Viewed by 2957
Abstract
Stress-induced neuroinflammation is widely regarded as one of the primary causes of depression. Gamma-aminobutyric acid (GABA)-enriched foods relieve stress and reduce inflammatory reactions. This study aimed to evaluate whether rice germ with 30% GABA (RG) reduced neuroinflammation in mice exposed to chronic unpredictable [...] Read more.
Stress-induced neuroinflammation is widely regarded as one of the primary causes of depression. Gamma-aminobutyric acid (GABA)-enriched foods relieve stress and reduce inflammatory reactions. This study aimed to evaluate whether rice germ with 30% GABA (RG) reduced neuroinflammation in mice exposed to chronic unpredictable mild stress (CUMS). CUMS mice were administered 40, 90, and 140 mg/kg of RG. CUMS increased serum and hypothalamic pro-inflammatory cytokine (TNF-α and IL-6) levels, which were decreased by RG. In the hypothalamus, CUMS elevated M1-type microglia markers of CD86 and NF-κB, whereas RG lowered these levels. The expression levels of NLRP3 inflammasome complex (NLRP3, apoptosis-associated speck-like protein containing a caspase recruitment domain, and caspase-1), IL-1β, and IL-18 were increased in the hypothalamus of CUMS mice and decreased by RG. RG attenuated depressive-like behaviors in CUMS mice, as measured by the forced swim test and tail suspension test. In conclusion, RG decreased hypothalamic inflammation-related signals, such as TNF-α, IL-6, M1 polarization, NF-κB, NLRP3 inflammasome complex, caspase-1, IL-1β, and IL-18, to diminish depressive-like behavior. Full article
(This article belongs to the Section Nutrition and Public Health)
Show Figures

Figure 1

Figure 1
<p>Reduction effect of RG on TNF-α and IL-6 expression levels in the serum and hypothalamus of CUMS mice model. (<b>A</b>,<b>B</b>) TNF-α (<b>A</b>) and IL-6 (<b>B</b>) protein expression levels were significantly increased in serum of CUMS compared to those in the Non-CUMS group and decreased upon RG, GABA, and theanine treatment in CUMS; (<b>C</b>–<b>E</b>) TNF-α (<b>upper lane of</b> (<b>C</b>)) and IL-6 (<b>lower lane of</b> (<b>C</b>)) expression levels in the hypothalamus of CUMS were validated using DAB staining (<b>C</b>, scale bar = 200 μm). Arrows point positive signals. Quantification graphs (<b>D</b>,<b>E</b>) are depicted in (<b>C</b>). The expression levels of TNF-α and IL-6 were higher in CUMS compared to those in control. However, their expression was decreased after RG, GABA, and theanine treatment. Data are presented as the mean ± SD (<span class="html-italic">n</span> = 3/group). CUMS, chronic unpredictable mild stress; DAB, 3,3′-diaminobenzidine; GABA, gamma-aminobutyric acid; IL-6, interleukin-6; RG, rice germ with 30% GABA; TNF-α, tumor necrotic factor-alpha. **, <span class="html-italic">p</span> &lt; 0.01 and ***, <span class="html-italic">p</span> &lt; 0.05 vs. Non-CUMS; <span>$</span>, <span class="html-italic">p</span> &lt; 0.05, <span>$</span><span>$</span>, <span class="html-italic">p</span> &lt; 0.01 and, <span>$</span><span>$</span><span>$</span>, <span class="html-italic">p</span> &lt; 0.001 vs. CUMS; #, <span class="html-italic">p</span> &lt; 0.05 vs. CUMS/RG90; †, <span class="html-italic">p</span> &lt; 0.05 vs. CUMS/GABA; ^, <span class="html-italic">p</span> &lt; 0.05 vs. CUMS/Theanine.</p>
Full article ">Figure 2
<p>Effect of NF-κB reduction due to M1 reduction and M2 elevation by RG in the hypothalamus of CUMS mice model. (<b>A</b>) The expression levels of CD86 (M1 marker; <b>upper lane in</b> (<b>A</b>)), CD206 (M2 marker; <b>lower lane in</b> (<b>A</b>)), and NF-κB (<b>D</b>) in the hypothalamus of CUMS were validated using DAB staining (scale bar = 200 μm). Arrows point positive signals; (<b>B</b>,<b>C</b>,<b>E</b>) Quantification graphs are depicted in (<b>A</b>,<b>D</b>). The expression levels of CD86 (<b>B</b>) and NF-κB (<b>E</b>) increased in CUMS relative to those in the control. However, their expression decreased after RG, GABA, and theanine treatment. CD206 (<b>C</b>) expression decreased in CUMS compared to that in the Non-CUMS. However, their expression increased after RG, GABA, and theanine treatment. Data are presented as the mean ± SD (<span class="html-italic">n</span> = 3/group). CD206, cluster of differentiation 206; CD86, cluster of differentiation 86; CUMS, chronic unpredictable mild stress; DAB, 3,3′-diaminobenzidine; GABA, gamma-aminobutyric acid; RG, rice germ with 30% GABA; NF-κB, nuclear factor kappa-light-chain-enhancer of activated B cells. **, <span class="html-italic">p</span> &lt; 0.01 and ***, <span class="html-italic">p</span> &lt; 0.05 vs. Non-CUMS; <span>$</span>, <span class="html-italic">p</span> &lt; 0.05, <span>$</span><span>$</span>, <span class="html-italic">p</span> &lt; 0.01 and, <span>$</span><span>$</span><span>$</span>, <span class="html-italic">p</span> &lt; 0.001 vs. CUMS; ##, <span class="html-italic">p</span> &lt; 0.01 and ###, <span class="html-italic">p</span> &lt; 0.001 vs. CUMS/RG90; ††, <span class="html-italic">p</span> &lt; 0.01 and †††, <span class="html-italic">p</span> &lt; 0.001 vs. CUMS/GABA; ^^, <span class="html-italic">p</span> &lt; 0.01 and ^^^, <span class="html-italic">p</span> &lt; 0.001 vs. CUMS/Theanine.</p>
Full article ">Figure 3
<p>Reduction effects of RG on inflammasome and pyroptosis cytokines in the hypothalamus of CUMS mice model. (<b>A</b>–<b>F</b>) The mRNA levels of ASC (<b>A</b>), NLRP3 (<b>B</b>), Caspase-1 (<b>C</b>), IL-1β (<b>D</b>), IL-18 (<b>E</b>), and cell death mediated by GSDMD (<b>F</b>) were significantly upregulated in CUMS compared to those in the control but downregulated after RG, GABA, and theanine treatment. Data were normalized to <span class="html-italic">Actb,</span> and expression levels were reported relative to the control group using the comparative CT method. Data are presented as the mean ± SD (<span class="html-italic">n</span> = 3/group). ASC, apoptosis-associated speck-like protein containing a caspase recruitment domain; IL, interleukin; CUMS, chronic unpredictable mild stress; GABA, gamma-aminobutyric acid; GSDMD, gasdermin D; RG, rice germ with 30% GABA; NLRP3, NOD-like receptor family pyrin domain containing 3. ***, <span class="html-italic">p</span> &lt; 0.05 vs. Non-CUMS; <span>$</span>, <span class="html-italic">p</span> &lt; 0.05, <span>$</span><span>$</span>, <span class="html-italic">p</span> &lt; 0.01 and, <span>$</span><span>$</span><span>$</span>, <span class="html-italic">p</span> &lt; 0.001 vs. CUMS; #, <span class="html-italic">p</span> &lt; 0.05, ##, <span class="html-italic">p</span> &lt; 0.01 and ###, <span class="html-italic">p</span> &lt; 0.001 vs. CUMS/RG90; †, <span class="html-italic">p</span> &lt; 0.05, ††, <span class="html-italic">p</span> &lt; 0.01 and †††, <span class="html-italic">p</span> &lt; 0.001 vs. CUMS/GABA; ^, <span class="html-italic">p</span> &lt; 0.05, ^^, <span class="html-italic">p</span> &lt; 0.01 and ^^^, <span class="html-italic">p</span> &lt;0.001 vs. CUMS/Theanine.</p>
Full article ">Figure 4
<p>Effect of reducing anxiety-related depressive-like behavior by rice germ (RG) in the chronic unpredictable mild stress (CUMS) mice model. (<b>A</b>) The immobility duration of forced swimming test (FST) significantly increased in CUMS compared to that in the control; however, it decreased after treatment with RG, gamma-aminobutyric acid (GABA), and theanine. (<b>B</b>) The immobility duration of tail suspension test (TST) significantly increased in CUMS compared to that in the control; however, it decreased after treatment with RG, GABA, and theanine. Data are presented as the mean ± SD (<span class="html-italic">n</span> = 6/group). (<b>C</b>) Summary of this study. Due to RG intake, TNF- α and IL-6 in serum decreased (↓), and these cytokines pass through the BBB and acted on the hypothalamus. Cytokines that cross BBB (TNF- α and IL-6) suppressed (↓) TNF-α/IL-6, M1 polarization, NF-κB, and the NRLP3 inflammasome complex, which attenuated depressive-like behaviors. CUMS, chronic unpredictable mild stress; FST, forced swimming test; TST, tail suspension test; TNF-α, tumor necrotic factor-alpha; GABA, gamma-aminobutyric acid; IL-6, inerlukin-6; RG, rice germ with 30% GABA; NLRP3, NOD-like receptor family pyrin domain containing 3. **, <span class="html-italic">p</span> &lt; 0.01 vs. Non-CUMS; <span>$</span>, <span class="html-italic">p</span> &lt; 0.05, and <span>$</span><span>$</span>, <span class="html-italic">p</span> &lt; 0.01 vs. CUMS; #, <span class="html-italic">p</span> &lt; 0.05 vs. CUMS/RG90; ††, <span class="html-italic">p</span> &lt; 0.01 vs. CUMS/GABA; ^^, <span class="html-italic">p</span> &lt; 0.01 vs. CUMS/Theanine.</p>
Full article ">
14 pages, 784 KiB  
Article
The Influence of Nutrition and Physical Activity on Exercise Performance after Mild COVID-19 Infection in Endurance Athletes-CESAR Study
by Daniel Śliż, Szczepan Wiecha, Jakub S. Gąsior, Przemysław Seweryn Kasiak, Katarzyna Ulaszewska, Marek Postuła, Łukasz A. Małek and Artur Mamcarz
Nutrients 2022, 14(24), 5381; https://doi.org/10.3390/nu14245381 - 18 Dec 2022
Cited by 7 | Viewed by 3820
Abstract
COVID-19 and imposed restrictions are linked with numerous health consequences, especially among endurance athletes (EA). Unfavorable changes in physical activity and nutrition may affect later sports and competition performance. The aims of this study were: (1) to assess the impact of COVID-19 infection [...] Read more.
COVID-19 and imposed restrictions are linked with numerous health consequences, especially among endurance athletes (EA). Unfavorable changes in physical activity and nutrition may affect later sports and competition performance. The aims of this study were: (1) to assess the impact of COVID-19 infection and pandemic restrictions on the nutrition and physical activity of EAs and (2) to compare them with the results of cardiopulmonary exercise testing (CPET). In total, 49 EAs (nmale = 43, nfemale = 6, mean age = 39.9 ± 7.8 year., height = 178.4 ± 6.8 cm, weight = 76.3 ± 10.4 kg; BMI = 24.0 ± 2.6 kg·m−2) underwent pre- and post-COVID-19 CPET and fulfilled the dietary and physical activity survey. COVID-19 infection significantly deteriorated CPET performance. There was a reduction in oxygen uptake and in heart rate post-COVID-19 (both p < 0.001). Consuming processed meat and replacing meat with plant-based protein affected blood lactate concentration (p = 0.035). Fat-free mass was linked with consuming unsaturated fatty acids (p = 0.031). Adding salt to meals influenced maximal speed/power (p = 0.024) and breathing frequency (p = 0.033). Dietary and Fitness Practitioners and Medical Professionals should be aware of possible COVID-19 infection and pandemic consequences among EA. The results of this study are a helpful guideline to properly adjust the treatment, nutrition, and training of EA. Full article
Show Figures

Figure 1

Figure 1
<p>Study procedure. Abbreviations: EA, endurance athlete; PCR, polymerase chain reaction; COVID-19, coronavirus disease 2019; CPET, cardiopulmonary exercise test; ECG, 12-lead electrocardiogram; ECHO, echocardiography examination; CBC, complete blood count; COPD, Chronic obstructive pulmonary disease.</p>
Full article ">
13 pages, 1515 KiB  
Article
The Role of Food Literacy in Managing Nutritional Precarity in the Migrant Experience: Dietary Lifestyles of Cambodia Migrants in Thailand
by Sary Seng, Hart Nadav Feuer and Sayamol Charoenratana
Nutrients 2022, 14(24), 5380; https://doi.org/10.3390/nu14245380 - 18 Dec 2022
Viewed by 3330
Abstract
The paper explores the dietary lifestyles of young Cambodian migrants in Thailand to illuminate the role of food literacy in determining nutritional outcomes and well-being, including during crises, such as the COVID-19 pandemic. In this context, food literacy is defined as food skills [...] Read more.
The paper explores the dietary lifestyles of young Cambodian migrants in Thailand to illuminate the role of food literacy in determining nutritional outcomes and well-being, including during crises, such as the COVID-19 pandemic. In this context, food literacy is defined as food skills and abilities to plan, select, and prepare to achieve adequate consumption under new or adverse social and culinary contexts of the migrant experience. In this paper, we consider both how nutritional precarity arises in the migrant experience, and to what extent food literacy can mitigate it under various conditions. The research approach involves a combination of qualitative and quantitative approaches that were adjusted to address the limited mobility for social science research during the COVID-19 pandemic in Thailand. Data collection was conducted through hybrid (online and in-person) ethnography, focus group discussions, food literacy questionnaires, and key informant interviews, often facilitated through internet messaging clients. The findings indicate that, while generally high food literacy may facilitate the transition to the foreign food systems found in migration destinations, optimizing nutrition and well-being requires reinforcement by context-specific food literacy, such as openness to foreign flavors and recipes. Contextual food literacy most directly leads to positive social and health outcomes while simultaneously expanding universal food literacy in the long-term. Full article
(This article belongs to the Section Nutrition and Public Health)
Show Figures

Figure 1

Figure 1
<p>Food Literacy pillars and components (Source: Vidgen and Gallegos, 2014).</p>
Full article ">Figure 2
<p>How survey respondents report balancing market needs against health and nutritional needs when grocery shopping.</p>
Full article ">Figure 3
<p>The percentage of key ingredients in Thai cuisine that respondents are able to use in their own cooking. In total, 78 out of 100 respondents report being able to competently cook with more than half (51–90%) of everyday Thai ingredients, which facilitates economical food planning.</p>
Full article ">Figure 4
<p>Degree of confidence in ability to cook a wide variety of meals from scratch.</p>
Full article ">
16 pages, 2464 KiB  
Article
Salvia plebeia R. Br. Water Extract Ameliorates Hepatic Steatosis in a Non-Alcoholic Fatty Liver Disease Model by Regulating the AMPK Pathway
by Subin Bae, Yoo-Hyun Lee, Jeongmin Lee, Jeongjin Park and Woojin Jun
Nutrients 2022, 14(24), 5379; https://doi.org/10.3390/nu14245379 - 18 Dec 2022
Cited by 2 | Viewed by 3162
Abstract
Salvia plebeia R. Br. (SP), grown from autumn to spring, is used as a medicinal herb from roots to leaves. This herb exhibits antioxidant activities and various physiological effect, including anti-asthma, immune-promoting, anti-obesity, and anti-cholesterol effects. However, the effectiveness of SP against non-alcoholic [...] Read more.
Salvia plebeia R. Br. (SP), grown from autumn to spring, is used as a medicinal herb from roots to leaves. This herb exhibits antioxidant activities and various physiological effect, including anti-asthma, immune-promoting, anti-obesity, and anti-cholesterol effects. However, the effectiveness of SP against non-alcoholic fatty liver disease (NAFLD) and the associated mechanism have not been elucidated. In this study, alleviation of NAFLD by SP was confirmed in a mouse model of hepatic steatosis induced by a high-fat diet and in HepG2 cells administered free fatty acids (FFA). In the experimental model, intrahepatic lipid accumulation was investigated using the AdipoRedTM assay, Oil Red O staining, biomarker analysis, and hematoxylin and eosin staining. Furthermore, glucose tolerance was examined based on the fasting glucose levels and oral glucose tolerance. The molecular mechanisms related to hepatic steatosis were determined based on marker mRNA levels. Blood FFAs were found to flow into the liver via the action of fatty acid translocase, cluster of differentiation 36, and fatty acid transporter proteins 2 and 5. Salvia plebeia R. Br. water extract (SPW) suppressed the FFAs inflow by regulating the expression of the above-mentioned proteins. Notably, modulating the expression of AMP-activated protein kinase (AMPK) and liver X receptor, which are involved in the regulation of lipid metabolism, stimulated peroxisome proliferator activated receptor α in the nucleus to induce the expression genes involved in β-oxidation and increase β-oxidation in the mitochondria. AMPK modulation also increased the expression of sterol regulatory element binding protein-1c, which activated lipid synthesis enzymes. As a consequence of these events, triglyceride synthesis was reduced and lipid accumulation in hepatocytes was alleviated. Overall, our findings suggested that SPW could ameliorate NAFLD by inhibiting hepatic steatosis through AMPK modulation. Full article
(This article belongs to the Section Phytochemicals and Human Health)
Show Figures

Graphical abstract

Graphical abstract
Full article ">Figure 1
<p><span class="html-italic">Salvia plebeia</span> R. Br. water extract (SPW) treatment decreased lipid accumulation in free fatty acid-induced HepG2 cells. (<b>A</b>) Cytotoxicity was determined using the XTT assay. (<b>B</b>) Intracellular triglyceride was measured using the AdipoRed<sup>TM</sup> assay, and (<b>C</b>) lipid accumulation was measured using Oil Red O staining. Quantitative lipid accumulation of Oil Red O contents at 500 nm. (<b>D</b>) Oil Red O staining image of HepG2 cells. Data are expressed as mean ± SD (<span class="html-italic">n</span> = 4 for each group). CON, control; FFA, free fatty acid; TG, triglyceride; XTT, 2,3-bis [2-methoxy-4-nitro-5-sulfophen-yl]-2H-tetrazolium-5-carboxyanilide; SD, standard deviation; ns., not significant; SPW 50, FFA + SPW 50 µg/mL; SPW 100, FFA + SPW 100 µg/mL. Different letters above the bar indicate statistical difference based on the Duncan’s multiple range test (<span class="html-italic">p</span> &lt; 0.05, a &gt; b &gt; c).</p>
Full article ">Figure 2
<p><span class="html-italic">Salvia plebeia</span> R. Br. water extract (SPW) treatment regulated the expression of genes related to lipid metabolism in FFA-induced HepG2 cells. The mRNA expression level of (<b>A</b>) lipid uptake markers, CD36, FATP2, and FATP5; (<b>B</b>) lipid metabolism markers, AMPK, LXRα, and LXRβ; (<b>C</b>) β-oxidation markers, CPT-1 and PPARα; and (<b>D</b>) lipid synthesis markers, SREBP-1c, FAS, and ACC. Data are expressed as mean ± SD (<span class="html-italic">n</span> = 4 for each group). CON, control; FFA, free fatty acid; SPW 50, FFA + SPW 50 µg/mL; SPW 100, FFA + SPW 100 µg/mL; CD36, cluster of differentiation 36; FATP2, fatty acid transport protein 2; FATP5, fatty acid transport protein 5; AMPK, AMP-activated protein kinase; LXRα, liver X receptor α; LXRβ, liver X receptor β; CPT-1, carnitine palmitoyl transferase-1α; PPARα, peroxisome proliferator-activated receptors α; SREBP-1c, sterol regulatory element binding protein-1c; FAS, fatty acid synthase; ACC, acetyl-CoA carboxylase. Different letters above the bar indicate statistical difference based on the Duncan’s multiple range test (<span class="html-italic">p</span> &lt; 0.05, a &gt; b &gt; c &gt; d).</p>
Full article ">Figure 3
<p><span class="html-italic">Salvia plebeia</span> R. Br. water extract (SPW) intake improved glucose levels in HFD-induced NAFLD mice. After mice were subjected to a 16 h fasting period before the experiment, (<b>A</b>) fasting glucose levels and (<b>B</b>) glucose levels were measured for a total of 2 h at 30 min intervals in for OGTT. Data represent mean ± SE (<span class="html-italic">n</span> = 5 for each group). AUC, area under the curve; CON, control; HFD, high-fat diet; HFD + SPW, HFD + 200 mg/kg/day SPW; OGTT, Oral Glucose Tolerance Test; SE, standard error. The different letters within a column indicate statistical difference based on the Duncan multiple range test (<span class="html-italic">p</span> &lt; 0.05, a &gt; b &gt; c).</p>
Full article ">Figure 4
<p><span class="html-italic">Salvia plebeia</span> R. Br. water extract (SPW) intake ameliorated liver injury in HFD-induced NAFLD mice. (<b>A</b>) H&amp;E stained liver tissues and (<b>B</b>) liver histology. (<b>C</b>) AST and ALT levels were measured in mice. Data represent mean ± SE (<span class="html-italic">n</span> = 5 for each group). AST, aspartate transaminase; ALT, alanine transaminase; CON, control; HFD, high-fat diet; HFD + SPW, HFD + 200 mg/kg/day SPW; H&amp;E, hematoxylin and eosin. The different letters above the bar indicate statistical difference based on Duncan’s multiple range test (<span class="html-italic">p</span> &lt; 0.05, a &gt; b).</p>
Full article ">Figure 5
<p><span class="html-italic">Salvia plebeia</span> R. Br. water extract (SPW) intake regulated the gene expression of lipid metabolism factors in HFD-induced NAFLD mice. The protein expression level was measured by Western blotting. β-actin was used as standard for normalizing the expression. (<b>A</b>) Representative Western blot of AMPK, p-AMPK, and β-actin. (<b>B</b>) Normalized protein expression level. The mRNA expression level of (<b>C</b>) lipid uptake markers, CD36, FATP2, and FATP5; (<b>D</b>) lipid metabolism marker, AMPK; (<b>E</b>) lipid synthesis markers, SREBP-1c, FAS, and ACC; and (<b>F</b>) β-oxidation markers, CPT-1 and PPARα. Data represents the mean ± SE (standard error, <span class="html-italic">n</span> = 5 for each group): CON, control; HFD, high-fat diet; HFD + SPW, HFD + 200 mg/kg/day SPW; NAFLD, non-alcoholic fatty liver disease; p-AMPK; phospho-AMPK. The different letters above the bar indicate statistical difference based on the Duncan multiple range test (<span class="html-italic">p</span> &lt; 0.05, a &gt; b &gt; c).</p>
Full article ">Figure 6
<p>Scheme for NAFLD pathway in the liver. Yellow arrows were meant up-regulated the expression and blue arrows were meant down-regulated the expression.</p>
Full article ">
28 pages, 2184 KiB  
Review
The Influence of the Differentiation of Genes Encoding Peroxisome Proliferator-Activated Receptors and Their Coactivators on Nutrient and Energy Metabolism
by Agnieszka Maciejewska-Skrendo, Myosotis Massidda, Filippo Tocco and Katarzyna Leźnicka
Nutrients 2022, 14(24), 5378; https://doi.org/10.3390/nu14245378 - 18 Dec 2022
Cited by 7 | Viewed by 3196
Abstract
Genetic components may play an important role in the regulation of nutrient and energy metabolism. In the presence of specific genetic variants, metabolic dysregulation may occur, especially in relation to the processes of digestion, assimilation, and the physiological utilization of nutrients supplied to [...] Read more.
Genetic components may play an important role in the regulation of nutrient and energy metabolism. In the presence of specific genetic variants, metabolic dysregulation may occur, especially in relation to the processes of digestion, assimilation, and the physiological utilization of nutrients supplied to the body, as well as the regulation of various metabolic pathways and the balance of metabolic changes, which may consequently affect the effectiveness of applied reduction diets and weight loss after training. There are many well-documented studies showing that the presence of certain polymorphic variants in some genes can be associated with specific changes in nutrient and energy metabolism, and consequently, with more or less desirable effects of applied caloric reduction and/or exercise intervention. This systematic review focused on the role of genes encoding peroxisome proliferator-activated receptors (PPARs) and their coactivators in nutrient and energy metabolism. The literature review prepared showed that there is a link between the presence of specific alleles described at different polymorphic points in PPAR genes and various human body characteristics that are crucial for the efficacy of nutritional and/or exercise interventions. Genetic analysis can be a valuable element that complements the work of a dietitian or trainer, allowing for the planning of a personalized diet or training that makes the best use of the innate metabolic characteristics of the person who is the subject of their interventions. Full article
(This article belongs to the Special Issue Alternative Diets, Supplementation Strategies and Sports Nutrition)
Show Figures

Figure 1

Figure 1
<p>The actions of PPAR proteins: Activation of transcription of target genes involving PPAR–RXR heterodimers and coactivators (own elaboration, after: Brunmeir and Xu 2018 [<a href="#B46-nutrients-14-05378" class="html-bibr">46</a>]). RXR—retinoid X receptor; PPAR—peroxisome proliferator-activated receptor; PPRE—PPAR response element; DBD—DNA binding domain; LBD—ligand binding domain; AF-1—activation function 1 domain; AF-2—activation function 2 domain.</p>
Full article ">Figure 2
<p>The main physiological function of PPARγ (own elaboration, after: Skat-Rørdam et al. 2018 [<a href="#B78-nutrients-14-05378" class="html-bibr">78</a>]). PEPCK—Phosphoenolpyruvate carboxykinase; LPL—lipoprotein lipase.</p>
Full article ">Figure 3
<p>The main physiological function of PPARδ (own elaboration, after: Reilly and Lee 2008 [<a href="#B133-nutrients-14-05378" class="html-bibr">133</a>]).</p>
Full article ">Figure 4
<p>The main physiological function of PPARα (own elaboration, after: Pawlak et al. 2015 [<a href="#B150-nutrients-14-05378" class="html-bibr">150</a>]). PKC—protein kinase C; PKA—protein kinase A.</p>
Full article ">Figure 5
<p>The main physiological function of PGC-1α (own elaboration, after: Cheng et a. 2018 [<a href="#B16-nutrients-14-05378" class="html-bibr">16</a>]). UCP1—uncoupling protein 1.</p>
Full article ">
14 pages, 3813 KiB  
Article
The TriMet_DB: A Manually Curated Database of the Metabolic Proteins of Triticum aestivum
by Vincenzo Cunsolo, Antonella Di Francesco, Maria Gaetana Giovanna Pittalà, Rosaria Saletti and Salvatore Foti
Nutrients 2022, 14(24), 5377; https://doi.org/10.3390/nu14245377 - 18 Dec 2022
Cited by 1 | Viewed by 2165
Abstract
Mass-spectrometry-based wheat proteomics is challenging because the current interpretation of mass spectrometry data relies on public databases that are not exhaustive (UniProtKB/Swiss-Prot) or contain many redundant and poor or un-annotated entries (UniProtKB/TrEMBL). Here, we report the development of a manually curated database of [...] Read more.
Mass-spectrometry-based wheat proteomics is challenging because the current interpretation of mass spectrometry data relies on public databases that are not exhaustive (UniProtKB/Swiss-Prot) or contain many redundant and poor or un-annotated entries (UniProtKB/TrEMBL). Here, we report the development of a manually curated database of the metabolic proteins of Triticum aestivum (hexaploid wheat), named TriMet_DB (Triticum aestivum Metabolic Proteins DataBase). The manually curated TriMet_DB was generated in FASTA format so that it can be read directly by programs used to interpret the mass spectrometry data. Furthermore, the complete list of entries included in the TriMet_DB is reported in a freely available resource, which includes for each protein the description, the gene code, the protein family, and the allergen name (if any). To evaluate its performance, the TriMet_DB was used to interpret the MS data acquired on the metabolic protein fraction extracted from the cultivar MEC of Triticum aestivum. Data are available via ProteomeXchange with identifier PXD037709. Full article
Show Figures

Figure 1

Figure 1
<p>Scheme of the approach carried out to compile the manually curated TriMet Database. (<b>a</b>) Scheme of the approach that used as a starting point the complete list of <span class="html-italic">Triticum aestivum</span> entries reported in the Swiss-Prot section of the UniProt database; (<b>b</b>) scheme of the approach that used as a starting point the list of metabolic wheat proteins identified, by means of a MS-shotgun approach, in the recent work of Di Francesco et al. (Di Francesco et al., 2019) [<a href="#B31-nutrients-14-05377" class="html-bibr">31</a>] (<b>c</b>) Number of sequence entries included in the TriMet_DB FASTA file.</p>
Full article ">Figure 2
<p>Examples of sequences discarded because of redundancy. For each example, the alignment of the query and the redundant entries is reported. Alignment displays the consensus symbols, which denote the degree of conservation observed in each column. The symbol “*” means that the amino acids in that column are identical in both sequences. The symbol “:” means that conserved substitutions are observed. The symbol “.” means that semi-conserved substitutions are observed. (<b>a</b>) Example of two sequences differing only for a point amino acid mutation in the peptide signal (reported in the red rectangle); (<b>b</b>) example of fragment sequence; (<b>c</b>) example of duplicate sequences.</p>
Full article ">Figure 3
<p>Venn diagram reporting the proteins identified using two different databases, <span class="html-italic">T. aestivum</span> Swiss-Prot_DB and TriMet_DB.</p>
Full article ">Figure 4
<p>The fundamentals of Occam’s razor strategy (principle of maximum parsimony) in Proteomics, by which proteins can be related through shared matches, and used to create the final report of the identified proteins. (<b>a</b>) B is a subset of protein A. Protein B may be present in the sample, but there is no evidence for this, so parsimony may be dropped from the report. (<b>b</b>) Protein C can be considered as an “intersection protein” (i.e., a subset of the combined matches to A and B). By Occam’s razor, it may be discarded from the report because it is not identified by unique peptides.</p>
Full article ">Figure 5
<p>Alignment of the tr|A0A3B6RD12 and sp|P12862 entries. The characterized sequence traits are reported in bold (see also the table on the right). In bold red is the reported sequence trait 402–423 characterized by the identification of the two unique peptides (reported in red in the table on the right) related only to unreviewed entry tr|A0A3B6RD12.</p>
Full article ">Figure 6
<p>Occam’s razor strategy applied to assemble the fourteen analyzed peptide sequences (showed in the table on the bottom of <a href="#nutrients-14-05377-f006" class="html-fig">Figure 6</a>) into a list of identified proteins by searching both the Swiss-Prot and the manually curated TriMet database. See the main text for details.</p>
Full article ">Figure 7
<p>Alignment of the tr|A0A3B6G229, sp|O64393, and sp|O64392 entries. Alignment displays the consensus symbols, denoting the degree of conservation observed in each column.</p>
Full article ">
7 pages, 228 KiB  
Commentary
Nutrition, Food and Diet in Health and Longevity: We Eat What We Are
by Suresh I. S. Rattan and Gurcharan Kaur
Nutrients 2022, 14(24), 5376; https://doi.org/10.3390/nu14245376 - 18 Dec 2022
Cited by 10 | Viewed by 7780
Abstract
Nutrition generally refers to the macro- and micro-nutrients essential for survival, but we do not simply eat nutrition. Instead, we eat animal- and plant-based foods without always being conscious of its nutritional value. Furthermore, various cultural factors influence and shape our taste, preferences, [...] Read more.
Nutrition generally refers to the macro- and micro-nutrients essential for survival, but we do not simply eat nutrition. Instead, we eat animal- and plant-based foods without always being conscious of its nutritional value. Furthermore, various cultural factors influence and shape our taste, preferences, taboos and practices towards preparing and consuming food as a meal and diet. Biogerontological understanding of ageing has identified food as one of the three foundational pillars of health and survival. Here we address the issues of nutrition, food and diet by analyzing the biological importance of macro- and micro-nutrients including hormetins, discussing the health claims for various types of food, and by reviewing the general principles of healthy dietary patterns, including meal timing, caloric restriction, and intermittent fasting. We also present our views about the need for refining our approaches and strategies for future research on nutrition, food and diet by incorporating the molecular, physiological, cultural and personal aspects of this crucial pillar of health, healthy ageing and longevity. Full article
(This article belongs to the Special Issue Nutrition and Aging - Featured Perspectives on Health and Metabolism)
9 pages, 945 KiB  
Article
Physical Fitness, Nutrition and Quality of Life in German Medical Students
by Lukas Walnik, Momme Kück, Uwe Tegtbur, Volkhard Fischer and Arno Kerling
Nutrients 2022, 14(24), 5375; https://doi.org/10.3390/nu14245375 - 17 Dec 2022
Viewed by 2284
Abstract
Background: Medical students are exposed to high cognitive demands as well as to a high learning effort, which as a consequence can lead to a limited quality of life (Qol) with reduced physical performance and unhealthy eating behaviors. The aim of this retrospective [...] Read more.
Background: Medical students are exposed to high cognitive demands as well as to a high learning effort, which as a consequence can lead to a limited quality of life (Qol) with reduced physical performance and unhealthy eating behaviors. The aim of this retrospective analysis was to evaluate the abovementioned factors and their relationship to each other. Methods: We included 380 medical students (167 men, 213 women, age 22.2 ± 3.9 yrs) who participated in the sports medicine elective subject. Qol was measured with the SF-36 questionnaire, and endurance capacity was measured by using an incremental running test. Daily dietary intake was measured using a 7-day diary protocol. Depending on sex and the maximum speed achieved, students were divided into three performance groups. Results: Men achieved higher maximal speed, heart rate, and lactate. Carbohydrates and fat intake did not meet recommendations in either group. Dietary fibre intake differed significantly between the performance groups in men and women, with the better groups having higher intakes. Conclusions: Our data do not suggest increased risk or health-damaging behaviors in medical students compared with the general population. Irrespective of this, incentives should be set to enable a healthy life even during complex studies with a high learning effort. Full article
Show Figures

Figure 1

Figure 1
<p>Dietary intake of men (<span class="html-italic">n</span> = 167) and women (<span class="html-italic">n</span> = 213), divided by performance groups. Displayed are 95% confidence intervals. <span class="html-italic">p</span><sub>ANOVA</sub>: <span class="html-italic">p</span>-value of ANOVA between groups divided by sex.</p>
Full article ">Figure 2
<p>Quality of life of men (<span class="html-italic">n</span> = 167) and women (<span class="html-italic">n</span> = 213), divided by performance groups. Displayed are 95% confidence intervals. PF: physical functioning; RP: role physical; BP: bodily pain; GH: general health; VT: vitality; SF: social functioning; RE: role emotional; MH: mental health; PSS: physical sum score; MSS: mental sum score; <span class="html-italic">p</span><sub>ANOVA</sub>: <span class="html-italic">p</span>-value of ANOVA between groups.</p>
Full article ">
21 pages, 401 KiB  
Review
Protective Role of Natural Compounds under Radiation-Induced Injury
by Annamaria Altomare, Michele Fiore, Gabriele D’Ercole, Elena Imperia, Roberta Maria Nicolosi, Susanna Della Posta, Gabriella Pasqua, Michele Cicala, Laura De Gara, Sara Ramella and Michele Pier Luca Guarino
Nutrients 2022, 14(24), 5374; https://doi.org/10.3390/nu14245374 - 17 Dec 2022
Cited by 5 | Viewed by 3364
Abstract
In recent years, evidence has shown the potential therapeutic effects of different natural compounds for the prevention and treatment of radiotherapy-induced mucositis (RIOM). RIOM represents one of the most frequent side effects associated with anti-neoplastic treatments affecting patients’ quality of life and treatment [...] Read more.
In recent years, evidence has shown the potential therapeutic effects of different natural compounds for the prevention and treatment of radiotherapy-induced mucositis (RIOM). RIOM represents one of the most frequent side effects associated with anti-neoplastic treatments affecting patients’ quality of life and treatment response due to radiation therapy discontinuation. The innate radio-protective ability of natural products obtained from plants is in part due to the numerous antioxidants possessed as a part of their normal secondary metabolic processes. However, oxygen presence is a key point for radiation efficacy on cancer cells. The aim of this review is to describe the most recent evidence on radiation-induced injury and the emerging protective role of natural compounds in preventing and treating this specific damage without compromising treatment efficacy. Full article
Previous Issue
Back to TopTop