[go: up one dir, main page]

Next Issue
Volume 25, May-1
Previous Issue
Volume 25, April-1
 
 
molecules-logo

Journal Browser

Journal Browser

Molecules, Volume 25, Issue 8 (April-2 2020) – 244 articles

Cover Story (view full-size image): 
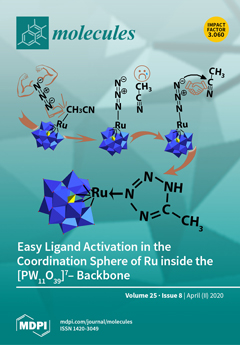
The research of noble metals containing polyoxometalates is a challenging field that combines smart synthetic approaches and nontrivial reactivity with wide perspectives for different catalytic applications. The unique combination of ruthenium and polyoxoanions creates a new generation of water oxidation and organic substrates activation catalysts. In this report, we summarized our studies of Ru-atom reactivity inside the POM backbone towards azide. Two reaction pathways result in i) azide-acetonitrile click reaction and ii) azide decomposition. The first pathway produces coordinated tetrazole and the second generates a novel POM complex with a coordinated N2 molecule. Such reactivity is important for the transformation of organic substrates and N2 activation. View this paper.


  • Issues are regarded as officially published after their release is announced to the table of contents alert mailing list.
  • You may sign up for e-mail alerts to receive table of contents of newly released issues.
  • PDF is the official format for papers published in both, html and pdf forms. To view the papers in pdf format, click on the "PDF Full-text" link, and use the free Adobe Reader to open them.
Order results
Result details
Section
Select all
Export citation of selected articles as:
11 pages, 1043 KiB  
Article
Extraction of Protein from Four Different Seaweeds Using Three Different Physical Pre-Treatment Strategies
by Jack O’ Connor, Steve Meaney, Gwilym A. Williams and Maria Hayes
Molecules 2020, 25(8), 2005; https://doi.org/10.3390/molecules25082005 - 24 Apr 2020
Cited by 63 | Viewed by 7348
Abstract
Seaweeds are a rich source of protein and can contain up to 47% on the dry weight basis. It is challenging to extract proteins from the raw biomass of seaweed due to resilient cell-wall complexes. Four species of macroalgae were used in this [...] Read more.
Seaweeds are a rich source of protein and can contain up to 47% on the dry weight basis. It is challenging to extract proteins from the raw biomass of seaweed due to resilient cell-wall complexes. Four species of macroalgae were used in this study-two brown, Fucus vesiculosus and Alaria esculenta, and two red, Palmaria palmata and Chondrus crispus. Three treatments were applied individually to the macroalgal species: (I) high-pressure processing (HPP); (II) laboratory autoclave processing and (III) a classical sonication and salting out method. The protein, ash and lipid contents of the resulting extracts were estimated. Yields of protein recovered ranged from 3.2% for Fucus vesiculosus pre-treated with high pressure processing to 28.9% protein recovered for Chondrus crispus treated with the classical method. The yields of protein recovered using the classical, HPP and autoclave pre-treatments applied to Fucus vesiculosus were 35.1, 23.7% and 24.3%, respectively; yields from Alaria esculenta were 18.2%, 15.0% and 17.1% respectively; yields from Palmaria palmata were 12.5%, 14.9% and 21.5% respectively, and finally, yields from Chondrus crispus were 35.2%, 16.1% and 21.9%, respectively. These results demonstrate that while macroalgal proteins may be extracted using either physical or enzymatic methods, the specific extraction procedure should be tailored to individual species. Full article
(This article belongs to the Special Issue Bioactives and Functional Ingredients in Foods and Beverages)
Show Figures

Figure 1

Figure 1
<p><b>A</b>–<b>D</b>: Percentage (%) lipid in raw, protein pellets and spent biomass of macroalgae.</p>
Full article ">Figure 2
<p>Proximate analysis of each seaweed species by pre-treatment method. Raw = raw biomass, PP = protein pellet, SB = spent biomass.</p>
Full article ">
8 pages, 741 KiB  
Article
Synthetic Kavalactone Analogues with Increased Potency and Selective Anthelmintic Activity against Larvae of Haemonchus contortus In Vitro
by H.M.P. Dilrukshi Herath, Aya C. Taki, Nghi Nguyen, José Garcia-Bustos, Andreas Hofmann, Tao Wang, Guangxu Ma, Bill C.H. Chang, Abdul Jabbar, Brad E. Sleebs and Robin B. Gasser
Molecules 2020, 25(8), 2004; https://doi.org/10.3390/molecules25082004 - 24 Apr 2020
Cited by 3 | Viewed by 2726
Abstract
Kava extract, an aqueous rhizome emulsion of the plant Piper methysticum, has been used for centuries by Pacific Islanders as a ceremonial beverage, and has been sold as an anxiolytic agent for some decades. Kavalactones are a major constituent of kava extract. [...] Read more.
Kava extract, an aqueous rhizome emulsion of the plant Piper methysticum, has been used for centuries by Pacific Islanders as a ceremonial beverage, and has been sold as an anxiolytic agent for some decades. Kavalactones are a major constituent of kava extract. In a previous investigation, we had identified three kavalactones that inhibit larval development of Haemonchus contortus in an in vitro-bioassay. In the present study, we synthesized two kavalactones, desmethoxyyangonin and yangonin, as well as 17 analogues thereof, and evaluated their anthelmintic activities using the same bioassay as employed previously. Structure activity relationship (SAR) studies showed that a 4-substituent on the pendant aryl ring was required for activity. In particular, compounds with 4-trifluoromethoxy, 4-difluoromethoxy, 4-phenoxy, and 4-N-morpholine substitutions had anthelmintic activities (IC50 values in the range of 1.9 to 8.9 µM) that were greater than either of the parent natural products—desmethoxyyangonin (IC50 of 37.1 µM) and yangonin (IC50 of 15.0 µM). The synthesized analogues did not exhibit toxicity on HepG2 human hepatoma cells in vitro at concentrations of up to 40 µM. These findings confirm the previously-identified kavalactone scaffold as a promising chemotype for new anthelmintics and provide a basis for a detailed SAR investigation focused on developing a novel anthelmintic agent. Full article
Show Figures

Graphical abstract

Graphical abstract
Full article ">Figure 1
<p>Structures of the natural products, yangonin and desmethoxyyangonin, and their activities against <span class="html-italic">Haemonchus contortus</span> in the larval development assay (see [<a href="#B7-molecules-25-02004" class="html-bibr">7</a>]).</p>
Full article ">Figure 2
<p>The activity of desmethoxyyangonin, yangonin and selected analogues (<b>3</b>, <b>4</b>, <b>5,</b> and <b>10</b>) against <span class="html-italic">Haemonchus contortus</span> in the larval development assay (conducted over 7 days). Dose-response curves for the two parent kavalactones (<b>1</b> and <b>2</b>) and four analogues (<b>3</b>, <b>4</b>, <b>5</b> and <b>10</b>) for developmental inhibition in comparison to monepantel or moxidectin. Information on compounds is given in <a href="#molecules-25-02004-t001" class="html-table">Table 1</a>.</p>
Full article ">
14 pages, 4930 KiB  
Article
Combretum quadrangulare Extract Attenuates Atopic Dermatitis-Like Skin Lesions through Modulation of MAPK Signaling in BALB/c Mice
by Ju-Hyoung Park, Min Hee Hwang, Young-Rak Cho, Seong Su Hong, Jae-Shin Kang, Won Hee Kim, Seung Hwan Yang, Dong-Wan Seo, Joa Sub Oh and Eun-Kyung Ahn
Molecules 2020, 25(8), 2003; https://doi.org/10.3390/molecules25082003 - 24 Apr 2020
Cited by 17 | Viewed by 3977
Abstract
Atopic dermatitis (AD) is a chronic inflammatory disease. Combretum quadrangulare (C. quadrangulare) is used as a traditional medicine to improve various pathologies in Southeast Asia. In this study, we investigated the effects of C. quadrangulare ethanol extract (CQ) on 1-chloro-2,4-dinitrobenzene (DNCB)-induced [...] Read more.
Atopic dermatitis (AD) is a chronic inflammatory disease. Combretum quadrangulare (C. quadrangulare) is used as a traditional medicine to improve various pathologies in Southeast Asia. In this study, we investigated the effects of C. quadrangulare ethanol extract (CQ) on 1-chloro-2,4-dinitrobenzene (DNCB)-induced AD like skin lesions in BALB/c mice. After administration with CQ (100, 200, and 400 mg/kg) for 6 weeks, AD symptoms, protein expression, immunoglobulin E (IgE), thymus and activation-regulated chemokine (TARC), and ceramidase level were measured in skin lesions of DNCB-induced BALB/c mice. CQ group improved the dermatitis score, skin pH, transepidermal water loss (TEWL), and skin hydration. Furthermore, histological analysis revealed that CQ attenuated the increased epidermal thickness and infiltration of mast cells caused by DNCB. CQ also increased the expression of filaggrin, and reduced the expression of ceramidase, serum IgE level, and the number of eosinophils. CQ effectively inhibited cytokines and chemokines such as interleukin (IL)-6, IL-13, TARC, and thymic stromal lymphopoietin (TSLP) at the mRNA levels, as well as the activation of mitogen-activated protein kinase (MAPK), including extracellular signal-regulated kinase (ERK), c-jun N-terminal kinase (JNK), and p38 in the skin lesions. Taken together, these findings demonstrate that CQ may be an effective treatment of AD-like skin lesions by inhibiting the expression of inflammatory mediators via the MAPK signaling pathways. Full article
Show Figures

Figure 1

Figure 1
<p>HPLC-DAD chromatogram (254 nm) of <span class="html-italic">Combretum quadrangulare</span> ethanol extract (CQ). Compounds are identified in the figure by number: 1 (tR = 7.92 min)—casuarinin, 2 (tR = 11.23 min)—isoorientin A, 3 (tR = 12.16 min)—orientin, 4 (tR = 14.13 min)—ellagic acid, 5 (tR = 44.21 min)—kamatakenin, 6 (tR = 45.12 min)—ayanin.</p>
Full article ">Figure 2
<p>Experimental schematic diagram and change of the body weight. (<b>a</b>) After 1 week acclimation, the dorsal part to induce AD-like skin lesions was removed. The shaved dorsal skin was sensitized with 200 μL application of 1.5% 1-chloro-2,4-dinitrobenzene (DNCB) dissolved in mixture of acetone/corn oil (3:1). Thereafter, 150 μL application of 0.5% DNCB was challenged 3 times a week for 6 weeks. The mice were randomly divided into six groups with 10 mice per group (5 mice per cage): normal, DNCB, DNCB + CQ (100, 200, and 400 mg/kg) and DNCB + PC 10 mg/kg. CQ was orally administered for 6 weeks; (<b>b</b>) Mice of all groups were provided food and water ad libitum for the experiment. The body weight change was recorded twice a week.</p>
Full article ">Figure 3
<p>The severity on dorsal skin lesions in DNCB-induced BALB/c mice. (<b>a</b>) To demonstrate the effect of CQ in DNCB-induced BALB/c mice, clinical assessment of the dorsal skin lesions was performed once a week. The mice were randomly divided into six groups: normal, DNCB, and DNCB + CQ (100, 200, and 400 mg/kg) and DNCB + PC 10 mg/kg for 6 weeks; (<b>b</b>) The dermatitis score including erythema, dryness, edema, and erosion was calculated once a week.</p>
Full article ">Figure 4
<p>The expression of immunoglobulin E (IgE) and eosinophils in DNCB-induced BALB/c mice. (<b>a</b>) To demonstrate the effect of CQ in DNCB-induced BALB/c mice, blood was collected and serum was separated at the end of the experiment. The serum IgE level was analyzed with ELISA; (<b>b</b>) The number of eosinophil in whole blood was counted randomly. The mice were randomly divided into six groups: normal, DNCB, and DNCB + CQ (100, 200, and 400 mg/kg) and DNCB + PC 10 mg/kg for 6 weeks. All data are presented as mean ± SD; <span class="html-italic"><sup>*</sup> p &lt;</span> 0.05 vs. DNCB-induced group.</p>
Full article ">Figure 5
<p>Histological analysis of epidermal thickness and mast cell infiltration on DNCB-induced skin lesions. (<b>a</b>,<b>b</b>) To observe epidermal thickness, dorsal skin section was stained with H&amp;E and taken using a light microscope at ×100 magnification (scale bar = 100 μm); (<b>c</b>,<b>d</b>) To observe mast cell infiltration, dorsal skin section was stained with TB and taken using a light microscope at ×100 magnification (scale bar = 100 μm). All data are presented as mean ± SD; <span class="html-italic"><sup>*</sup> p &lt;</span> 0.05 vs. DNCB-induced group.</p>
Full article ">Figure 5 Cont.
<p>Histological analysis of epidermal thickness and mast cell infiltration on DNCB-induced skin lesions. (<b>a</b>,<b>b</b>) To observe epidermal thickness, dorsal skin section was stained with H&amp;E and taken using a light microscope at ×100 magnification (scale bar = 100 μm); (<b>c</b>,<b>d</b>) To observe mast cell infiltration, dorsal skin section was stained with TB and taken using a light microscope at ×100 magnification (scale bar = 100 μm). All data are presented as mean ± SD; <span class="html-italic"><sup>*</sup> p &lt;</span> 0.05 vs. DNCB-induced group.</p>
Full article ">Figure 6
<p>The expression of filaggrin and ceramidase on dorsal skin lesions in DNCB-induced BALB/c mice. (<b>a</b>) To demonstrate the effect of CQ in DNCB-induced BALB/c mice, the tissue was collected, homogenized, and lysed in lysis buffer at the end of the experiment. The expression of filaggrin was analyzed by Western blotting; (<b>b</b>) The relative expression level of filaggrin was measured using an image analyzer; (<b>c</b>) The level of ceramidase was analyzed with ELISA. The mice were randomly divided into five groups: normal, DNCB, and DNCB + CQ (100, 200, and 400 mg/kg) for 6 weeks. All data are presented as mean ± SD; <span class="html-italic"><sup>#</sup> p &lt;</span> 0.05 vs. normal group, <span class="html-italic"><sup>*</sup> p &lt;</span> 0.05 vs. DNCB-induced group.</p>
Full article ">Figure 7
<p>Proinflammatory cytokines and chemokines in DNCB-induced BALB/c mice. (<b>a</b>) To demonstrate the effect of CQ in DNCB-induced BALB/c mice, the tissue was collected and homogenized and the total RNA was extracted at the end of the experiment; (<b>b</b><b>–</b><b>e</b>) The expression of IL-6, IL-13, thymus and activation-regulated chemokine (TARC), and thymic stromal lymphopoietin (TSLP) was measured by reverse transcription polymerase chain reaction (RT-PCR) and densitometry protocol. All data are presented as mean ± SD; <span class="html-italic"><sup>*</sup> p &lt;</span> 0.05 vs. DNCB-induced group.</p>
Full article ">Figure 8
<p>Phosphorylation of mitogen-activated protein kinase (MAPK) on dorsal skin lesions in DNCB-induced BALB/c mice. (<b>a</b>) To demonstrate the effect of CQ in DNCB-induced BALB/c mice, the tissues were collected, homogenized, and lysed in ice-cold lysis buffer at the end of the experiment. The expression of total protein was measured by western blotting; (<b>b</b>) The activities of phospho (p)-ERK (extracellular signal-regulated kinase), p-JNK (c-jun N-terminal kinase), and p-p38 were determined by densitometry protocol. All data are presented as mean ± SD; <span class="html-italic"><sup>*</sup> p &lt;</span> 0.05 vs. DNCB-induced group.</p>
Full article ">Figure A1
<p>Effect of CQ on the expression of chemokines in HaCaT cells. HaCaT cells were treated with 100 μM CQ and stimulated with IFN-γ and TNF-α (10 ng/mL) for 24 h. The mRNA expression of MDC and TARC was analyzed using RT-PCR in HaCaT cells. Dexamethasone was used as a positive control (PC). 1. Ayanin, 2. 3,7-Dimethoxy-5,3′,4′-trihydroxyflavone, 3. 3,4′-Dimethoxy-5,7,3′-trihydroxyflavone, 4. Kamatakenin, 5. Unknown, 6. Kamatakenin, 7. Unknown, 8. Retusin, 9. Casuarinin, 10. Casuarinin.</p>
Full article ">
15 pages, 5098 KiB  
Article
Metallurgical Preparation of Nb–Al and W–Al Intermetallic Compounds and Characterization of Their Microstructure and Phase Transformations by DTA Technique
by Tomas Cegan, Daniel Petlak, Katerina Skotnicova, Jan Jurica, Bedrich Smetana and Simona Zla
Molecules 2020, 25(8), 2001; https://doi.org/10.3390/molecules25082001 - 24 Apr 2020
Cited by 9 | Viewed by 2884
Abstract
The possibilities of metallurgical preparation of 40Nb-60Al and 15W-85Al intermetallic compounds (in at.%) by plasma arc melting (PAM) and vacuum induction melting (VIM) were studied. Both methods allow easy preparation of Nb–Al alloys; however, significant evaporation of Al was observed during the melting, [...] Read more.
The possibilities of metallurgical preparation of 40Nb-60Al and 15W-85Al intermetallic compounds (in at.%) by plasma arc melting (PAM) and vacuum induction melting (VIM) were studied. Both methods allow easy preparation of Nb–Al alloys; however, significant evaporation of Al was observed during the melting, which affected the resulting chemical composition. The preparation of W–Al alloys was more problematic because there was no complete re-melting of W during PAM and VIM. However, the combination of PAM and VIM allowed the preparation of W–Al alloy without any non-melted parts. The microstructure of Nb–Al alloys consisted of Nb2Al and NbAl3 intermetallic phases, and W–Al alloys consisted mainly of needle-like WAl4 intermetallic phase and Al matrix. The effects of melting conditions on chemical composition, homogeneity, and microstructure were determined. Differential thermal analysis was used to determine melting and phase transformation temperatures of the prepared alloys. Full article
(This article belongs to the Special Issue Intermetallics: Synthesis, Structure, Function)
Show Figures

Graphical abstract

Graphical abstract
Full article ">Figure 1
<p>(<b>a</b>) Sample Nb–Al-VIM-1 after induction melting; (<b>b</b>) sample Nb–Al-PAM-1 after plasma arc melting; (<b>c</b>) concentration profile of cuts of Nb–Al samples after vacuum induction melting (VIM) (energy-dispersive X-ray spectrography (EDS), dotted lines indicate average value); (<b>d</b>) concentration profile of cuts of Nb–Al samples after plasma arc melting (PAM) (EDS, dotted lines indicate average value).</p>
Full article ">Figure 2
<p>(<b>a</b>) Scanning electron microscopy back-scattered electron (SEM-BSE) image of the W–Al-PAM-1 alloy; (<b>b</b>) optical microscopy (OM) image of the W–Al-PAM-2-alloy.</p>
Full article ">Figure 3
<p>Concentration profile of cuts of W–Al samples after VIM (EDS, dotted lines indicate average value).</p>
Full article ">Figure 4
<p>(<b>a</b>) SEM-BSE image of the Nb–Al-VIM-1 alloy; (<b>b</b>) SEM-BSE image of the Nb–Al-PAM-1 alloy; (<b>c</b>) X-ray diffraction patterns of the Nb–Al-VIM-1 alloy; (<b>d</b>) dependence between content of Nb<sub>2</sub>Al phase and Nb content in Nb–Al alloys.</p>
Full article ">Figure 5
<p>(<b>a</b>) SEM-BSE image of the bottom part of the W–Al-VIM-1 alloy; (<b>b</b>) SEM-BSE image of the upper part of the W–Al-VIM-1 alloy; (<b>c</b>) SEM-BSE image of WAl<sub>12</sub> phase in the bottom part of the W–Al-VIM-1 alloy; (<b>d</b>) diffraction pattern of sample W–Al-VIM-1.</p>
Full article ">Figure 6
<p>Microstructure evolution with distance from the wall of the mould in the bottom part of the W–Al-VIM-1 ingot.</p>
Full article ">Figure 7
<p>Shrinkage in the upper part of the W–Al-VIM-1 alloy.</p>
Full article ">Figure 8
<p>(<b>a</b>) SEM-BSE image of the bottom part of the W–Al-VIM-2 alloy; (<b>b</b>) SEM-BSE image of WAl<sub>12</sub> phase in the bottom part of the W-Al-VIM-2 alloy; (<b>c</b>) diffraction pattern of sample W–Al-VIM-2; (<b>d</b>) SEM-BSE image of the upper part of the W–Al-VIM-2 alloy.</p>
Full article ">Figure 9
<p>Microstructure evolution with distance from the wall of the mould in bottom part of W–Al-VIM-2 ingot.</p>
Full article ">Figure 10
<p>(<b>a</b>) Differential thermal analysis (DTA) curves for samples Nb–Al-VIM-1 and Nb–Al-PAM-1; (<b>b</b>) DTA curves for samples W–Al-VIM-1 and W–Al-VIM-2.</p>
Full article ">Figure 11
<p>Binary diagram of Nb–Al system (Thermo-Calc; dotted red lines mark composition of analysed alloys).</p>
Full article ">Figure 12
<p>Binary diagram of W–Al system (Thermo-Calc; dotted red lines mark composition of analysed alloys).</p>
Full article ">
21 pages, 1065 KiB  
Review
Induced Pluripotent Stem Cell (iPSC)-Based Neurodegenerative Disease Models for Phenotype Recapitulation and Drug Screening
by Chia-Yu Chang, Hsiao-Chien Ting, Ching-Ann Liu, Hong-Lin Su, Tzyy-Wen Chiou, Shinn-Zong Lin, Horng-Jyh Harn and Tsung-Jung Ho
Molecules 2020, 25(8), 2000; https://doi.org/10.3390/molecules25082000 - 24 Apr 2020
Cited by 75 | Viewed by 12481
Abstract
Neurodegenerative diseases represent a significant unmet medical need in our aging society. There are no effective treatments for most of these diseases, and we know comparatively little regarding pathogenic mechanisms. Among the challenges faced by those involved in developing therapeutic drugs for neurodegenerative [...] Read more.
Neurodegenerative diseases represent a significant unmet medical need in our aging society. There are no effective treatments for most of these diseases, and we know comparatively little regarding pathogenic mechanisms. Among the challenges faced by those involved in developing therapeutic drugs for neurodegenerative diseases, the syndromes are often complex, and small animal models do not fully recapitulate the unique features of the human nervous system. Human induced pluripotent stem cells (iPSCs) are a novel technology that ideally would permit us to generate neuronal cells from individual patients, thereby eliminating the problem of species-specificity inherent when using animal models. Specific phenotypes of iPSC-derived cells may permit researchers to identify sub-types and to distinguish among unique clusters and groups. Recently, iPSCs were used for drug screening and testing for neurologic disorders including Alzheimer’s disease (AD), amyotrophic lateral sclerosis (ALS), spinocerebellar atrophy (SCA), and Zika virus infection. However, there remain many challenges still ahead, including how one might effectively recapitulate sporadic disease phenotypes and the selection of ideal phenotypes and for large-scale drug screening. Fortunately, quite a few novel strategies have been developed that might be combined with an iPSC-based model to solve these challenges, including organoid technology, single-cell RNA sequencing, genome editing, and deep learning artificial intelligence. Here, we will review current applications and potential future directions for iPSC-based neurodegenerative disease models for critical drug screening. Full article
(This article belongs to the Special Issue Phenotypic Drug Discovery)
Show Figures

Figure 1

Figure 1
<p>Apply induced pluripotent stem cells (iPSC)-derived neurons/glia for neurological disease phenotype confirmation, mechanism study, and drug test.</p>
Full article ">Figure 2
<p>Combine novel technologies and iPSCs for disease model improvement, genetic studies, make complex neuronal organoids, and large-scale drug screening. scRNA: single cell RNA, SNP: single nucleotide polymorphism, BBB: blood–brain barrier, NMJ: neuromuscular junction.</p>
Full article ">
11 pages, 2459 KiB  
Article
Effect of Saturated Steam Heat Treatment on Physical and Chemical Properties of Bamboo
by Qiuyi Wang, Xinwu Wu, Chenglong Yuan, Zhichao Lou and Yanjun Li
Molecules 2020, 25(8), 1999; https://doi.org/10.3390/molecules25081999 - 24 Apr 2020
Cited by 70 | Viewed by 3581
Abstract
The aim of this study was to investigate the effects of the heat treatment time and initial moisture content of bamboo on the corresponding chemical composition, crystallinity, and mechanical properties after saturated steam heat treatment at 180 °C. The mechanism of saturated steam [...] Read more.
The aim of this study was to investigate the effects of the heat treatment time and initial moisture content of bamboo on the corresponding chemical composition, crystallinity, and mechanical properties after saturated steam heat treatment at 180 °C. The mechanism of saturated steam heat treatment of bamboo was revealed on the micro-level, providing a theoretical basis for the regulation of bamboo properties and the optimization of heat treatment process parameters. XRD patterns of the treated bamboo slices were basically the same. With the increase in the initial moisture content of bamboo, the crystallinity of bamboo increased first and then decreased after treatment. Due to the saturated steam heat treatment, the content of cellulose and lignin in bamboo slices increased while the content of hemicellulose decreased, but the content of cellulose in bamboo with a 40% initial moisture content increased first and then decreased. The shear strength of treated bamboo changed little within 10 min after saturated steam heat treatment, and then decreased rapidly. During the first 20 min with saturated steam heat treatment, the compressive strength, flexural strength, and flexural modulus of elasticity of the treated bamboo increased, and then decreased. Full article
Show Figures

Figure 1

Figure 1
<p>(<b>A</b>) The XRD curves of the bamboo slices after 180 °C saturated steam heat treatment. The corresponding diffraction peak location of cellulose (002) plane (<b>B</b>), and relative crystallinities (<b>C</b>) of bamboo slices with different initial moisture contents and heat treatment times.</p>
Full article ">Figure 2
<p>Complete (<b>A</b>) and partial (<b>B</b>) FTIR curves of the bamboo slices with 25% initial moisture content treated by saturated steam heat at 180 °C with different times.</p>
Full article ">Figure 3
<p>(<b>A</b>–<b>E</b>) The percentage of lignin, cellulose, and hemicellulose of bamboo slices after the saturated steam heat treatment with different initial moisture content.</p>
Full article ">Figure 4
<p>The changes in shear strength (<b>A</b>) and corresponding change rate (<b>B</b>) with heat treatment time.</p>
Full article ">Figure 5
<p>(<b>A</b>) Results of compressive strength along grain of bamboo before and after saturated steam heat treatment under different moisture content conditions, and (<b>B</b>) the change rate with the prolongation in heat treatment time.</p>
Full article ">Figure 6
<p>(<b>A</b>) Results of bending strength of bamboo before and after saturated steam heat treatment under different moisture content conditions, and (<b>B</b>) the change rate with the prolongation in heat treatment time. (<b>C</b>) Results of modulus of elasticity of bamboo before and after saturated steam heat treatment under different moisture content conditions, and (<b>D</b>) the change rate with the prolongation in heat treatment time.</p>
Full article ">
20 pages, 1380 KiB  
Review
Antimicrobial Peptides as Probes in Biosensors Detecting Whole Bacteria: A Review
by Éric Pardoux, Didier Boturyn and Yoann Roupioz
Molecules 2020, 25(8), 1998; https://doi.org/10.3390/molecules25081998 - 24 Apr 2020
Cited by 28 | Viewed by 5192
Abstract
Bacterial resistance is becoming a global issue due to its rapid growth. Potential new drugs as antimicrobial peptides (AMPs) are considered for several decades as promising candidates to circumvent this threat. Nonetheless, AMPs have also been used more recently in other settings such [...] Read more.
Bacterial resistance is becoming a global issue due to its rapid growth. Potential new drugs as antimicrobial peptides (AMPs) are considered for several decades as promising candidates to circumvent this threat. Nonetheless, AMPs have also been used more recently in other settings such as molecular probes grafted on biosensors able to detect whole bacteria. Rapid, reliable and cost-efficient diagnostic tools for bacterial infection could prevent the spread of the pathogen from the earliest stages. Biosensors based on AMPs would enable easy monitoring of potentially infected samples, thanks to their powerful versatility and integrability in pre-existent settings. AMPs, which show a broad spectrum of interactions with bacterial membranes, can be tailored in order to design ubiquitous biosensors easily adaptable to clinical settings. This review aims to focus on the state of the art of AMPs used as the recognition elements of whole bacteria in label-free biosensors with a particular focus on the characteristics obtained in terms of threshold, volume of sample analysable and medium, in order to assess their workability in real-world applications. Full article
(This article belongs to the Special Issue Antimicrobial Peptides: From Synthesis to Application)
Show Figures

Figure 1

Figure 1
<p>Tethering AMPs can prevent the triggering of killing mechanisms of the bacteria. (<b>A</b>) Free floating peptides can self-organize onto the bacterial membrane and subsequently disrupt it or insert themselves inside the cell in order to kill it. (<b>B</b>) Tethered peptides can no longer self-organize at the surface of the bacterial membrane, thus inhibiting their bactericidal activity. Interaction abilities can, however, still be conserved, thus allowing the design of capture surfaces for biosensing purposes.</p>
Full article ">Figure 2
<p>Schematic principle of the assays developed by Kulagina et al. in which the antimicrobial peptides were covalently immobilized on a surface, thus acting as capture molecules binding to bacteria. The detection itself is performed using fluorescent labelling, either of the bacteria directly or through a specific fluorescing antibody. Reproduced from [<a href="#B60-molecules-25-01998" class="html-bibr">60</a>].</p>
Full article ">Figure 3
<p>AMP-based device for the electrical detection of bacterial pathogens. (<b>A</b>) Schematic of the interdigitated microelectrode array, with immobilized AMPs. (<b>B</b>) Representation of the magainin I in helical form, with the added terminal cysteine residue, allowing its anchoring on gold. Hydrophobic and hydrophilic residues are highlighted to emphasize the amphiphilic nature of magainin I. (<b>C</b>) Binding of bacterial cells on the array, thus enabling the detection. (<b>D</b>) Optical image of the interdigitated microelectrode array (scale bar: 50 µm). Reproduced from [<a href="#B31-molecules-25-01998" class="html-bibr">31</a>].</p>
Full article ">
21 pages, 2386 KiB  
Review
Viral Hepatitis and Iron Dysregulation: Molecular Pathways and the Role of Lactoferrin
by Romina Mancinelli, Luigi Rosa, Antimo Cutone, Maria Stefania Lepanto, Antonio Franchitto, Paolo Onori, Eugenio Gaudio and Piera Valenti
Molecules 2020, 25(8), 1997; https://doi.org/10.3390/molecules25081997 - 24 Apr 2020
Cited by 34 | Viewed by 5585
Abstract
The liver is a frontline immune site specifically designed to check and detect potential pathogens from the bloodstream to maintain a general state of immune hyporesponsiveness. One of the main functions of the liver is the regulation of iron homeostasis. The liver detects [...] Read more.
The liver is a frontline immune site specifically designed to check and detect potential pathogens from the bloodstream to maintain a general state of immune hyporesponsiveness. One of the main functions of the liver is the regulation of iron homeostasis. The liver detects changes in systemic iron requirements and can regulate its concentration. Pathological states lead to the dysregulation of iron homeostasis which, in turn, can promote infectious and inflammatory processes. In this context, hepatic viruses deviate hepatocytes’ iron metabolism in order to better replicate. Indeed, some viruses are able to alter the expression of iron-related proteins or exploit host receptors to enter inside host cells. Lactoferrin (Lf), a multifunctional iron-binding glycoprotein belonging to the innate immunity, is endowed with potent antiviral activity, mainly related to its ability to block viral entry into host cells by interacting with viral and/or cell surface receptors. Moreover, Lf can act as an iron scavenger by both direct iron-chelation or the modulation of the main iron-related proteins. In this review, the complex interplay between viral hepatitis, iron homeostasis, and inflammation as well as the role of Lf are outlined. Full article
(This article belongs to the Collection Molecular Medicine)
Show Figures

Figure 1

Figure 1
<p>Iron uptake and excretion in hepatocytes. Tf-bound ferric iron uptake is mediated by TfR1, inducing endocytosis. Once in the acidic endosome, ferric iron is reduced by a ferric reductase and exported to the cytoplasm by DMT1. The ferrous iron is then utilized for cell metabolism or sequestered into Ftn. Acquisition of NTBI involves the reductase-mediated ZIP-4 import as ferrous iron. Moreover, heme-bound iron is imported by LRP1 or though hemoglobin internalization. Despite the numerous uptake mechanisms, iron is exported only through the Fpn/Cp system. Tf: transferrin; Holo-Tf: transferrin-bound iron; Fpn: ferroportin; Cp: ceruloplasmin; TfR1: transferrin receptor 1; NTBI: non-transferrin-bound iron; ZIP-14: ZRT/IRT-like protein-14; DMT-1: divalent metal transporter 1; Ftn: ferritin; LRP1: Low Density Lipoprotein receptor related protein. This figure has been drawn, with few modifications, according to the scheme proposed by Knutson et al. [<a href="#B50-molecules-25-01997" class="html-bibr">50</a>].</p>
Full article ">Figure 2
<p>Iron uptake and excretion in inflamed hepatocytes. The liver is the major organ responsible for iron storage upon inflammatory stimuli. The iron homeostasis disorders start with the up-regulation of systemic IL-6, which stimulates the synthesis of hepcidin by the liver. Hepcidin binding to Fpn leads to the internalization and lysosomal-mediated degradation of the permease, thus blocking iron export. Accordingly, Tf-independent and -dependent iron uptake systems are up-regulated (purple arrows), guaranteeing that excess systemic iron is accumulated in Ftn. Notably, intracellular iron overload induces ROS which, in turn, damage proteins, lipid membranes, and DNA, thus inducing tissue injury and organ failure. According to intracellular iron overload, anemia of inflammation is established.IL-6: interleukin-6; Fpn: ferroportin; Tf: transferrin; Holo-Tf: saturated transferrin; Apo-Tf: unsaturated transferrin; TfR1: transferring receptor 1; Ftn: ferritin; NTBI: non-transferrin-bound iron; ZIP-14: ZRT/IRT-like protein-14; DMT-1: divalent metal transporter 1; Ftn: ferritin; ROS: reactive oxygen species; LRP1: Low Density Lipoprotein receptor related protein.</p>
Full article ">Figure 3
<p>Morphological evaluation and immunohistochemistry of lactoferrin and hepcidin in normal and HCV-infected liver performed according to the procedures reported in our previous papers [<a href="#B124-molecules-25-01997" class="html-bibr">124</a>,<a href="#B176-molecules-25-01997" class="html-bibr">176</a>,<a href="#B177-molecules-25-01997" class="html-bibr">177</a>]. (<b>A</b>) Hematoxylin and eosin stain (HE): morphology of a normal liver, with a regular histological appearance and a liver with chronic hepatitis C infection (HCV), with portal and periportal fibrosis and inflammation (blue arrows) together with steatosis (yellow arrows). (<b>B</b>) Immunohistochemistry: HCV infection induces a significant up-regulation of lactoferrin synthesis (red arrows), probably related to the activation of the inflammatory process. (<b>C</b>) Immunohistochemistry: HCV infection significantly down-regulates the expression of hepcidin compared to normal liver (green arrows). OM 20×. Scale bar = 50 μm.</p>
Full article ">
15 pages, 2787 KiB  
Article
Potential Antimicrobial and Anticancer Activities of an Ethanol Extract from Bouea macrophylla
by Ngoc Hong Nguyen, Thuy Trang Nguyen, Phu Cuong Ma, Qui Thanh Hoai Ta, Thuc-Huy Duong and Van Giau Vo
Molecules 2020, 25(8), 1996; https://doi.org/10.3390/molecules25081996 - 24 Apr 2020
Cited by 32 | Viewed by 5849
Abstract
Bouea macrophylla is a tree widely grown throughout South East Asia. It is used in folk medicine for the treatment of various illnesses. The present study aimed to identify the chemical constituents and to test the antimicrobial and anticancer activities of an ethanol [...] Read more.
Bouea macrophylla is a tree widely grown throughout South East Asia. It is used in folk medicine for the treatment of various illnesses. The present study aimed to identify the chemical constituents and to test the antimicrobial and anticancer activities of an ethanol extract from B. macrophylla leaves. The extract exhibited excellent antibacterial properties against 9 out of 10 target microorganisms. including four Gram-negative bacteria (Escherichia coli, Shigella flexneri, Vibrio cholera, and Pseudomonas aeruginosa) and four Gram-positive bacteria (Staphylococcus aureus, Listeria monocytogenes, Enterococcus faecalis, and Bacillus cereus), as well as a fungus (Candida albicans). In addition, the extract was also tested on HeLa and human colorectal carcinoma (HCT116) cells to evaluate its cytostatic effects. The ethanol extract was able to inhibit the proliferation of HeLa and HCT116 cells, showing IC50 = 24 ± 0.8 and 28 ± 0.9 µg/mL, respectively, whereas the IC50 values of doxorubicin (standard) were 13.6 ± 1.3 and 15.8 ± 1.1 µg/mL respectively. Also, we identified various bioactive compounds in the extract such as polyphenols, flavonoids, caryophyllene, phytol, and trans-geranylgeraniol by GC-MS, which could contribute to the extract’s biological activities. Therefore, our findings strongly indicate that the constituents of the B. macrophylla ethanol extract could be active against the tested bacteria and fungi as well as cancer cells. Further investigation is needed to understand the mechanisms mediating the antimicrobial and anticancer effects and identify signaling pathways that could be targeted for therapeutic application. Full article
(This article belongs to the Special Issue Biological Activities of Medicinal Plants)
Show Figures

Figure 1

Figure 1
<p>Chromatogram of the <span class="html-italic">B. macrophylla</span> extract. The x-axis indicates the retention time in minutes, while the y-axis indicates the peak % signal intensity.</p>
Full article ">Figure 2
<p>Antioxidant potential determined by Ferric Reducing Antioxidant Power (FRAP) assay (<b>A</b>) and DPPH radical-scavenging capacity (<b>B</b>) of the <span class="html-italic">B. macrophylla</span> extract. Data are shown as mean ± SD of three independent experiments (*<span class="html-italic">p</span> &lt; 0.01; the mean difference is significant at the 0.01 level compared to the control by one-way ANOVA).</p>
Full article ">Figure 3
<p>Growth inhibition of some pathogenic bacterial strains caused by the <span class="html-italic">B. macrophylla</span> extract at concentrations of 10<sup>−2</sup>, 10<sup>−1</sup>, 1, 10, 100, and 500 mg/mL. PC, positive control (ciprofloxacin); NC, negative control.</p>
Full article ">Figure 4
<p>Cell survival curves of HeLa (<b>A</b>) and HCT116 (<b>B</b>) cell lines treated for 48 h with Doxorubicin and the <span class="html-italic">B. macrophylla</span> ethanol extract at difference concentrations. Data are shown as mean ± SD of three independent experiments (* <span class="html-italic">p</span> &lt; 0.05; the mean difference is significant at the 0.05 level compared to the control by one-way ANOVA).</p>
Full article ">Figure 5
<p>Morphological changes of (<b>A</b>) HeLa and (<b>B</b>) HCT116 cells treated with the <span class="html-italic">B. macrophylla</span> ethanol extract at difference concentrations for 48 h. Morphological changes corresponding to cell shrinkage re indicated by red arrows.</p>
Full article ">
21 pages, 5874 KiB  
Article
Fluorescent Biaryl Uracils with C5-Dihydro- and Quinazolinone Heterocyclic Appendages in PNA
by Ali Heidari, Arash Ghorbani-Choghamarani, Maryam Hajjami and Robert H. E. Hudson
Molecules 2020, 25(8), 1995; https://doi.org/10.3390/molecules25081995 - 24 Apr 2020
Cited by 6 | Viewed by 3263
Abstract
There has been much effort to exploit fluorescence techniques in the detection of nucleic acids. Canonical nucleic acids are essentially nonfluorescent; however, the modification of the nucleobase has proved to be a fruitful way to engender fluorescence. Much of the chemistry used to [...] Read more.
There has been much effort to exploit fluorescence techniques in the detection of nucleic acids. Canonical nucleic acids are essentially nonfluorescent; however, the modification of the nucleobase has proved to be a fruitful way to engender fluorescence. Much of the chemistry used to prepare modified nucleobases relies on expensive transition metal catalysts. In this work, we describe the synthesis of biaryl quinazolinone-uracil nucleobase analogs prepared by the condensation of anthranilamide derivatives and 5-formyluracil using inexpensive copper salts. A selection of modified nucleobases were prepared, and the effect of methoxy- or nitro- group substitution on the photophysical properties was examined. Both the dihydroquinazolinone and quinazolinone modified uracils have much larger molar absorptivity (~4–8×) than natural uracil and produce modest blue fluorescence. The quinazolinone-modified uracils display higher quantum yields than the corresponding dihydroquinazolinones and also show temperature and viscosity dependent emission consistent with molecular rotor behavior. Peptide nucleic acid (PNA) monomers possessing quinazolinone modified uracils were prepared and incorporated into oligomers. In the sequence context examined, the nitro-substituted, methoxy-substituted and unmodified quinazolinone inserts resulted in a stabilization (∆Tm = +4.0/insert; +2.0/insert; +1.0/insert, respectively) relative to control PNA sequence upon hybridization to complementary DNA. All three derivatives responded to hybridization by the “turn-on” of fluorescence intensity by ca. 3-to-4 fold and may find use as probes for complementary DNA sequences. Full article
Show Figures

Graphical abstract

Graphical abstract
Full article ">Figure 1
<p>Selected examples of uracil nucleobase (<b>a</b>) structural modifications: ring fusion (<b>b</b>), extension of conjugation (<b>c</b>), biaryl (<b>d</b>) and heterocycle biaryl (<b>e</b>) derivatives. Ph = phenyl.</p>
Full article ">Figure 2
<p>Generic structure of a peptide nucleic acid oligomer (PNA, left) and two examples of fluorescent nucleobases. B = nucleobase, Ph = phenyl.</p>
Full article ">Figure 3
<p>Top: chemical structures and dehydrogenation conditions. Bottom: molecular representations of the structures at minimum energy states; most energetically favorable tautomer for (<b>a</b>) dihydroquinazolinone (<b>b</b>) and quinazolinone.</p>
Full article ">Figure 4
<p>Fluorescence excitation spectra (broken lines) and emission spectra (solid lines) for the single-stranded probe containing PNAs (grey lines) and for the heteroduplexes formed with complementary PNA (black lines) at 2 µM strand concentration; 100 mM sodium phosphate buffer, pH = 7.0, 23 °C. (<b>a</b>) H-GTAGA<b><sup>Q</sup>U</b>CACT-Lys-NH<sub>2</sub>, (<b>b</b>) H-GTAGA<b><sup>Q</sup>U<sup>(MeO)</sup></b>CACT-Lys-NH<sub>2</sub>, (<b>c</b>) H-GTAGA<b><sup>Q</sup>U<sup>(NO2)</sup></b>CACT-Lys-NH<sub>2</sub>.</p>
Full article ">Figure 4 Cont.
<p>Fluorescence excitation spectra (broken lines) and emission spectra (solid lines) for the single-stranded probe containing PNAs (grey lines) and for the heteroduplexes formed with complementary PNA (black lines) at 2 µM strand concentration; 100 mM sodium phosphate buffer, pH = 7.0, 23 °C. (<b>a</b>) H-GTAGA<b><sup>Q</sup>U</b>CACT-Lys-NH<sub>2</sub>, (<b>b</b>) H-GTAGA<b><sup>Q</sup>U<sup>(MeO)</sup></b>CACT-Lys-NH<sub>2</sub>, (<b>c</b>) H-GTAGA<b><sup>Q</sup>U<sup>(NO2)</sup></b>CACT-Lys-NH<sub>2</sub>.</p>
Full article ">Scheme 1
<p>Synthesis of modified quinazolinone-based uracil scaffolds. 4-HO-TEMPO = 4-hydroxy-2,2,6,6-tetramethylpiperidin-1-oxyl; DABCO = (1,4-diazabicyclo[2.2.2]octane).</p>
Full article ">Scheme 2
<p>CuCl/DABCO/4-HO-TEMPO-catalyzed one-pot aerobic oxidative synthesis of quinazolinone modified uracil.</p>
Full article ">Scheme 3
<p>Synthesis of quinazolinone-uracil PNA monomers.</p>
Full article ">
12 pages, 919 KiB  
Brief Report
Nanoparticle-Mediated Gene Silencing for Sensitization of Lung Cancer to Cisplatin Therapy
by Daniel P. Feldmann, Joshua Heyza, Christoph M. Zimmermann, Steve M. Patrick and Olivia M. Merkel
Molecules 2020, 25(8), 1994; https://doi.org/10.3390/molecules25081994 - 24 Apr 2020
Cited by 10 | Viewed by 3944
Abstract
Platinum-based chemotherapy remains a mainstay treatment for the management of advanced non-small cell lung cancer. A key cellular factor that contributes to sensitivity to platinums is the 5′-3′ structure-specific endonuclease excision repair cross-complementation group 1 (ERCC1)/ xeroderma pigmentosum group F (XPF). ERCC1/XPF is [...] Read more.
Platinum-based chemotherapy remains a mainstay treatment for the management of advanced non-small cell lung cancer. A key cellular factor that contributes to sensitivity to platinums is the 5′-3′ structure-specific endonuclease excision repair cross-complementation group 1 (ERCC1)/ xeroderma pigmentosum group F (XPF). ERCC1/XPF is critical for the repair of platinum-induced DNA damage and has been the subject of intense research efforts to identify small molecule inhibitors of its nuclease activity for the purpose of enhancing patient response to platinum-based chemotherapy. As an alternative to small molecule inhibitors, small interfering RNA (siRNA) has often been described to be more efficient in interrupting protein–protein interactions. The goal of this study was therefore to determine whether biocompatible nanoparticles consisting of an amphiphilic triblock copolymer (polyethylenimine-polycaprolactone-polyethylene glycol (PEI-PCL-PEG)) and carrying siRNA targeted to ERCC1 and XPF made by microfluidic assembly are capable of efficient gene silencing and able to sensitize lung cancer cells to cisplatin. First, we show that our PEI-PCL-PEG micelleplexes carrying ERCC1 and XPF siRNA efficiently knocked down ERCC1/XPF protein expression to the same extent as the standard siRNA transfection reagent, Lipofectamine. Second, we show that our siRNA-carrying nanoparticles enhanced platinum sensitivity in a p53 wildtype model of non-small cell lung cancer in vitro. Our results suggest that nanoparticle-mediated targeting of ERCC1/XPF is feasible and could represent a novel therapeutic strategy for targeting ERCC1/XPF in vivo. Full article
Show Figures

Graphical abstract

Graphical abstract
Full article ">Figure 1
<p>Western Blot analysis of excision repair cross-complementation group 1 (ERCC1) and xeroderma pigmentosum group F (XPF) protein levels within A549 cells following (<b>A</b>) single transfection of micelleplexes (PPP) loaded with 50 pmol small interfering RNA (siRNA) after 72 h and (<b>B</b>) double transfection of micelleplexes (PPP) loaded with 100 pmol siRNA after 72h. Lipofectamine 2000 (LF) lipoplexes were prepared according to manufacturer’s protocol with 50 pmol (A) and 100 pmol (B) siRNA (n = 2).</p>
Full article ">Figure 2
<p>ERCC1 and XPF gene knockdown efficiency was validated in lung adenocarcinoma cells (A549) after 72 h following double transfection of Lipofectamine 2000 (LF) or micelleplexes (PPP) with 100 pmol ERCC1-XPF siRNA or negative control (NC) siRNA. ERCC1 and XPF expression was normalized with GAPDH expression and quantified by real time PCR. Data points indicate mean ± SD. (n = 6).</p>
Full article ">Figure 3
<p>Colony survival assay in A549 cells following transfection with Lipofectamine 2000 (<b>A</b>) or PEI-PCL-PEG (PPP) micelleplexes (<b>B</b>). Untreated (open circle), negative control (filled triangles) or ERCC1-XPF (filled squares) siRNA transfected cells were treated with increasing doses of cisplatin for 2 h, and cell viability was determined by a clonogenic assay. Results are represented as mean ± SD. IC<sub>50</sub> values were calculated using Compusyn software.</p>
Full article ">
14 pages, 3105 KiB  
Article
The Cytotoxic and Apoptotic Effects of the Brown Algae Colpomenia sinuosa are Mediated by the Generation of Reactive Oxygen Species
by Reem Al Monla, Zeina Dassouki, Achraf Kouzayha, Yahya Salma, Hala Gali-Muhtasib and Hiba Mawlawi
Molecules 2020, 25(8), 1993; https://doi.org/10.3390/molecules25081993 - 24 Apr 2020
Cited by 18 | Viewed by 4766
Abstract
Brown algae are a novel resource of biogenic molecules, however few studies have been conducted in the Mediterranean to assess the cytotoxic mechanisms of algal-derived compounds. This study focuses on the antineoplastic activity of extracts from non-investigated algae of the Lebanese coast, Colpomenia [...] Read more.
Brown algae are a novel resource of biogenic molecules, however few studies have been conducted in the Mediterranean to assess the cytotoxic mechanisms of algal-derived compounds. This study focuses on the antineoplastic activity of extracts from non-investigated algae of the Lebanese coast, Colpomenia sinuosa. Extracts’ antineoplastic activities were evaluated by MTT and trypan blue on different tumorigenic cells. Results indicated that the most potent extract was obtained by soxhlet using dichloromethane:methanol solvent (DM soxhlet) against HCT-116. Wound healing assay confirmed that this extract decreased the migration potential of HCT-116 cells with minimal effects on non-tumorigenic cells. It also induced an increase in the subG1 population as determined by flow cytometry. Western blot analysis demonstrated that apoptosis in treated HCT-116 cells was induced via upregulation of p21 protein and downregulation of the anti-apoptotic Bcl 2, which led to caspases activation. The latter, catalyzes the degradation of PARP-1, and thus suppresses cancer proliferation. Morphological alterations, further confirmed apoptosis. A strong pro-oxidant activity evidenced by the enhanced generation of reactive oxygen species (ROS) was observed in HCT-116 treated cells. Interestingly, a strong antioxidant effectively blocked effect induced by the extract. These results indicate that C. sinuosa is a source of bioactive compounds possessing pro-apoptotic and anti-migratory efficacy. Full article
(This article belongs to the Special Issue Algae and Microalgae and Their Bioactive Molecules for Human Health)
Show Figures

Graphical abstract

Graphical abstract
Full article ">Figure 1
<p>Cytotoxicity of <span class="html-italic">C. sinuosa</span> organic extracts on colon cancer by MTT assay. Cells were seeded in 96-well plates and treated subsequently with 100–750 µg·mL<sup>−1</sup> of extracts: (<b>A</b>,<b>B</b>) Effect on HCT-116 post 24 h treatment and 48 h treatment, respectively; (<b>C</b>,<b>D</b>) Effect on HT-29 cell line post 24 and 48 h treatments, respectively. Results are reported as the mean ± SD from three independent experiments (n = 3). <span class="html-italic">* p &lt; 0.05</span> and <span class="html-italic">** p &lt; 0.01</span> with respect to control.</p>
Full article ">Figure 2
<p>Cytotoxic activity of different concentrations of <span class="html-italic">C. sinuosa</span> extracts on HeLa and MCF-7 cell lines determined by MTT assay: (<b>A</b>,<b>B</b>) Effect on HeLa at 24 and 48 h; (<b>C</b>,<b>D</b>) Effect on MCF-7 at 24 and 48 h. Results are reported as the mean ± SD from three independent experiments (n = 3). * <span class="html-italic">p &lt; 0.05</span> and <span class="html-italic">** p &lt; 0.01</span> with respect to control.</p>
Full article ">Figure 3
<p>Minimal cytotoxic effects of dichloromethane:methanol solvent (DM soxhlet) extract against the NCM460 non-tumorigenic human colon cell line. Results by MTT are reported as the mean ± SD from three independent experiments (n = 3).</p>
Full article ">Figure 4
<p>In vitro anti-migratory potentials of DM soxhlet extract on HCT-116 cell line migration analyzed by wound healing assay. “Wound” was created by a straight line scratch across the cancer cells monolayer: (<b>A</b>) Percentage of cell-covered area at 6, 12, and 24 h over 0 h as mean ± SD; (<b>B</b>) Representative images of two independent experiments done in triplicate. Significant differences are indicated as <span class="html-italic">* p &lt; 0.05</span> and <span class="html-italic">** p &lt; 0.01</span> with respect to control.</p>
Full article ">Figure 5
<p>Flow cytometry analysis confirms that DM soxhlet extract of <span class="html-italic">C. sinuosa</span> increases the subG1 population in colon cancer cells at 24 h. Significant differences vs. control cells, comparing cell cycle phases (SubG1, G0/G1, S, G2/M), are indicated by <span class="html-italic">* p &lt; 0.05</span> and by <span class="html-italic">** p &lt; 0.01</span>. Data values represent the mean ± SD (n = 2).</p>
Full article ">Figure 6
<p>DM soxlet promotes apoptosis in colon carcinoma cells: (<b>A</b>) Representative Western blot analysis showing a significant increase of p21 and decrease in the levels of Bcl 2, procaspases, and PARP-1, along with caspase 3 activation. Expression of GAPDH was used as an internal control; (<b>B</b>) DAPI micrographs of HCT-116 cells treated with DM soxhlet extract at different concentrations (500, 250, 100, and 0 µg·mL<sup>−1</sup>). Nuclei were counterstained with DAPI (blue) at 40× magnification Scale bars = 20 μm; (<b>C)</b> Quantification of the western blots using image J analysis <span class="html-italic">* p &lt; 0.05</span> and <span class="html-italic">** p &lt; 0.01.</span></p>
Full article ">Figure 7
<p>DM soxhlet extract triggers an increase in DCFDA fluorescence intensity (ROS production) in HCT-116 colon cancer cells: (<b>A</b>) Quantitative analysis of DCFDA intensity upon treatment with increasing concentrations of extract; (<b>B</b>) pretreatment with the ROS inhibitor NAC for 1 h prior to the 24 h incubation with DM soxhlet extract, further confirmed the role of ROS in the extract cytotoxic activity. Data values represent the mean ± SD (n = 3). <span class="html-italic">* p &lt; 0.05</span> and <span class="html-italic">** p &lt; 0.01.</span></p>
Full article ">
15 pages, 1815 KiB  
Article
Membrane Phospholipids and Polyphosphates as Cofactors and Binding Molecules of SERPINA12 (vaspin)
by Catherine A. Tindall, Sebastian Dommel, Veronika Riedl, David Ulbricht, Stefanie Hanke, Norbert Sträter and John T. Heiker
Molecules 2020, 25(8), 1992; https://doi.org/10.3390/molecules25081992 - 24 Apr 2020
Cited by 4 | Viewed by 3612
Abstract
Visceral adipose tissue derived serine protease inhibitor (vaspin) is a member of the serpin family and has been shown to have beneficial effects on glucose tolerance, insulin stability as well as adipose tissue inflammation, parameters seriously affected by obesity. Some of these effects [...] Read more.
Visceral adipose tissue derived serine protease inhibitor (vaspin) is a member of the serpin family and has been shown to have beneficial effects on glucose tolerance, insulin stability as well as adipose tissue inflammation, parameters seriously affected by obesity. Some of these effects require inhibition of target proteases such as kallikrein 7(KLK7) and many studies have demonstrated vaspin-mediated activation of intracellular signaling cascades in various cells and tissues. So far, little is known about the exact mechanism how vaspin may trigger these intracellular signaling events. In this study, we investigated and characterized the interaction of vaspin with membrane lipids and polyphosphates as well as their potential regulatory effects on serpin activity using recombinant vaspin and KLK7 proteins and functional protein variants thereof. Here, we show for the first time that vaspin binds to phospholipids and polyphosphates with varying effects on KLK7 inhibition. Vaspin binds strongly to monophosphorylated phosphatidylinositol phosphates (PtdInsP) with no effect on vaspin activation. Microscale thermophoresis (MST) measurements revealed high-affinity binding to polyphosphate 45 (KD: 466 ± 75 nM) and activation of vaspin in a heparin-like manner. Furthermore, we identified additional residues in the heparin binding site in β-sheet A by mutating five basic residues resulting in complete loss of high-affinity heparin binding. Finally, using lipid overlay assays, we show that these residues are additionally involved in PtdInsP binding. Phospholipids play a major role in membrane trafficking and signaling whereas polyphosphates are procoagulant and proinflammatory agents. The identification of phospholipids and polyphosphates as binding partners of vaspin will contribute to the understanding of vaspins involvement in membrane trafficking, signaling and beneficial effects associated with obesity. Full article
(This article belongs to the Special Issue Protein-Peptide and Protein-Small Molecule Interactions)
Show Figures

Figure 1

Figure 1
<p>Vaspin affinity for immobilized membrane lipids. Shown are lipid overlay assays analyzing binding of vaspin to a variety of membrane lipids with 100 pmol/spot of lipid immobilized on each spot and 1 µg/mL vaspin was used for incubation of (<b>A</b>) membrane lipid and sphingo lipid strips, (<b>B</b>) PtdIns lipid strip and (<b>C</b>) PtdIns array with serial dilutions of different PtdInsPs from 100 pmol down to 1.56 pmol/spot as indicated. TG: triglyceride, DAG: diacylglycerol, PA: phosphatidic acid, PS: phosphatidylserine, PE: phosphatidylethanolamine, PC: phosphatidylcholine, PG: phosphatidylglycerol, CL: cardiolipin, SG: sphingosine, S1P: sphingosine-1-phosphate, PSG: phytosphingosine, C: ceramide, SM: sphingomyelin, SPC: sphingosylphosphorylcholine, LPA: lysophosphatidic acid, Myr: myriosine, M-GM1: monosialoganglioside-GM1, D-GD3: disiaganglioside-GD3, S: sulfatide, P: psychosine, Ch: cholesterol, PtdIns: phosphatidylinositol, PtdIns(3)P: phosphatidylinositol (3)-phosphate, PtdIns(4)P: phosphatidylinositol (4)-phosphate, PtdIns(5)P: phosphatidylinositol (5)-phosphate, PtdIns(3,4)P<sub>2</sub>: phosphatidylinositol (3,4)-bisphosphate, PtdIns(3,5)P<sub>2</sub>: phosphatidylinositol (3,5)-bisphosphate, PtdIns(4,5)P<sub>2</sub>: phosphatidylinositol (2,4)-bisphosphate, PtdIns(3,4,5)P<sub>3</sub>: phosphatidylinositol (3,4,5)-trisphosphate.</p>
Full article ">Figure 2
<p>Influence of PtdInsPs on vaspin/KLK7 complex formation and KLK7 activity. (<b>A</b>) SDS-PAGE analysis of vaspin/KLK7 complex formation. Vaspin wt was incubated with x-fold excess of PtdInsPs (0.1, 1 and 10-fold) or unfractionated heparin (ufh, 10-fold) as indicated. Notable and indicated bands are: 1-vaspin-protease complex; 2-full-length vaspin; 3-<span class="html-italic">N</span>-terminally cleaved vaspin; 4-RCL- and <span class="html-italic">N</span>-terminally cleaved vaspin; 5-KLK7. KLK7 was incubated with vaspin (at a molar ratio 3:1) for 2 min. C<sub>0</sub>: control reaction after t = 0 min. (<b>B</b>) Densitometric quantification of complex formation with and without PtdInsPs or ufh. Presented is the relative increase of complex band intensity as x-fold over control (vaspin without PtdInsP). (<b>C</b>) Inhibition of KLK7 by vaspin was measured under pseudo-first-order conditions (ligand/serpin ratio of 10). Presented is the relative increase in second-order rate constant as x-fold over control (without PtdInsP or heparin). (<b>D</b>) KLK7 activity was measured in presence of 10 or 100-fold excess of PtdInsPs. Presented is the relative KLK7 activity as x-fold over control (without PtdInsPs). Data are presented as means ± SEM. Statistical significance was determined by one-way ANOVA followed by Dunnett’s post-hoc test. * <span class="html-italic">p</span> &lt; 0.05, *** <span class="html-italic">p</span> &lt; 0.001.</p>
Full article ">Figure 3
<p>Influence of polyphosphates on complex formation. (<b>A</b>) Shown is complex formation of vaspin with KLK7 (protease/serpin molar ratio 3:1) with increasing concentrations of polyP<sub>3</sub> and polyP<sub>45</sub> (0.8−400-fold as indicated) after 1 min. Notable and indicated bands are: 1-vaspin-protease complex; 2-full-length vaspin; 3-<span class="html-italic">N</span>-terminally cleaved vaspin; 4-RCL- and <span class="html-italic">N</span>-terminally cleaved vaspin; 5-KLK7. (<b>B</b>) Densitometric quantification of complex band intensities in relation to ligand/vaspin ratio of SDS gels. (<b>C</b>) Inhibition of KLK7 by vaspin under pseudo first-order conditions in presence of polyP<sub>45</sub> (polyP/serpin ratio of 10:1). Presented is the second-order rate constant as x–fold over control (without polyP). (<b>D</b>) Binding of polyP<sub>45</sub> to fluorescently labeled vaspin in submicromolar range. The curve was derived from the measurement of the thermophoretic mobility after titration of polyP<sub>45</sub> to a constant vaspin concentration. Data are presented as means ± SEM. Statistical significance was determined by Student’s two-tailed <span class="html-italic">t</span>-test. ** <span class="html-italic">p</span> &lt; 0.01.</p>
Full article ">Figure 4
<p>Investigation of the PtdInsP binding site using a non-heparin binding (NHB) vaspin variant. (<b>A</b>) Thermal stability of wt vaspin and NHB variant (K188A/K131A/R211A/K359A/R363A). Denaturation was observed by nanoDSF plotting the intrinsic tryptophan and tyrosine fluorescence ratio of 350 nm/330 nm against temperature. (<b>B</b>) Complex formation of wt vaspin, R211A/K359A and NHB variant in the absence (−) and presence of heparin (+; heparin/vaspin ratio of 10:1) for 1 min. Notable and indicated bands are: 1-vaspin-protease complex; 2-full-length vaspin; 3-<span class="html-italic">N</span>-terminally cleaved vaspin; 4-RCL- and <span class="html-italic">N</span>-terminally cleaved vaspin; 5-KLK7. (<b>C</b>) Binding of the low-molecular weight heparin clexane to wt vaspin, R211A/K359A and NHB variant. Data from the wt and R211A/K359A was originally published in the Journal of Biological Chemistry: Ulbricht D, Oertwig K, Arnsburg K, Saalbach A, Pippel J, Strater N and Heiker JT. Basic Residues of β-Sheet A Contribute to Heparin Binding and Activation of Vaspin (Serpin A12). <span class="html-italic">J Biol Chem</span>. 2017, 292, 994–1004, © the American Society for Biochemistry and Molecular Biology. Curves were derived from changes in fluorescence (wt or R211A/K359A) or thermophoretic mobility (NHB) after titration of enoxaparin to a constant vaspin concentration. (<b>D</b>) Lipid strips incubated with wt vaspin (alone (−) or in presence of heparin, with a molar ratio serpin/heparin of 1:1 or 10:1 as indicated) and vaspin variants. NHB: non-heparin binding variant, con: control, ufh: unfractionated heparin.</p>
Full article ">Figure 5
<p>Heparin and phosphate ion binding site of vaspin. (<b>A</b>,<b>B</b>) Electrostatic potential at the molecular surface of vaspin (PDB 4IF8) [<a href="#B7-molecules-25-01992" class="html-bibr">7</a>] as viewed from the opposite sides. A large area of strong positive potential is visible in the orientation depicted in (<b>B</b>). Potential values &lt; −8 kT/e are colored in red and values &gt; +8 kT/e in blue. The electrostatic potential was generated with the program APBS [<a href="#B35-molecules-25-01992" class="html-bibr">35</a>]. The protein orientation in (<b>B</b>) is the same as that of (<b>C</b>), showing the protein fold and the basic residues generating the strong positive electrostatic potential. The reactive center loop (RCL, red) is flexible in the crystal structure and modeled here for orientation. Five basic resides are present in the area of the distinct positive potential (<b>C</b>) and a sulfate ion is coordinated by three side chains (<b>D</b>).</p>
Full article ">
21 pages, 3275 KiB  
Article
Effects of Graphene Oxide Nanofilm and Chicken Embryo Muscle Extract on Muscle Progenitor Cell Differentiation and Contraction
by Jaśmina Bałaban, Mateusz Wierzbicki, Marlena Zielińska, Jarosław Szczepaniak, Malwina Sosnowska, Karolina Daniluk, Dominik Cysewski, Piotr Koczoń, André Chwalibog and Ewa Sawosz
Molecules 2020, 25(8), 1991; https://doi.org/10.3390/molecules25081991 - 23 Apr 2020
Cited by 11 | Viewed by 3866
Abstract
Finding an effective muscle regeneration technique is a priority for regenerative medicine. It is known that the key factors determining tissue formation include cells, capable of proliferating and/or differentiating, a niche (surface) allowing their colonization and growth factors. The interaction between these factors, [...] Read more.
Finding an effective muscle regeneration technique is a priority for regenerative medicine. It is known that the key factors determining tissue formation include cells, capable of proliferating and/or differentiating, a niche (surface) allowing their colonization and growth factors. The interaction between these factors, especially between the surface of the artificial niche and growth factors, is not entirely clear. Moreover, it seems that the use of a complex of complementary growth factors instead of a few strictly defined ones could increase the effectiveness of tissue maturation, including muscle tissue. In this study, we evaluated whether graphene oxide (GO) nanofilm, chicken embryo muscle extract (CEME), and GO combined with CEME would affect the differentiation and functional maturation of muscle precursor cells, as well as the ability to spontaneously contract a pseudo-tissue muscle. CEME was extracted on day 18 of embryogenesis. Muscle cells obtained from an 8-day-old chicken embryo limb bud were treated with GO and CEME. Cell morphology and differentiation were observed using different microscopy methods. Cytotoxicity and viability of cells were measured by lactate dehydrogenase and Vybrant Cell Proliferation assays. Gene expression of myogenic regulatory genes was measured by Real-Time PCR. Our results demonstrate that CEME, independent of the culture surface, was the main factor influencing the intense differentiation of muscle progenitor cells. The present results, for the first time, clearly demonstrated that the cultured tissue-like structure was capable of inducing contractions without externally applied impulses. It has been indicated that a small amount of CEME in media (about 1%) allows the culture of pseudo-tissue muscle capable of spontaneous contraction. The study showed that the graphene oxide may be used as a niche for differentiating muscle cells, but the decisive influence on the maturation of muscle tissue, especially muscle contractions, depends on the complexity of the applied growth factors. Full article
(This article belongs to the Section Medicinal Chemistry)
Show Figures

Figure 1

Figure 1
<p>(<b>A</b>) Transmission electron microscopic images of graphene oxide flakes at increasing magnification: 1) 5,000, 2) 8,500, 3) 34,000, 4) 70,000; (<b>B</b>) Fourier Transform Infrared Spectroscopic spectrum of graphene oxide with the assignment of bands to appropriate vibrations of groups and bonds present in the sample.</p>
Full article ">Figure 2
<p>Atomic Force Microscopy (AFM) mages and a topography model of the surface of a culture plate (<b>A</b>) and graphene oxide nanofilm (<b>B</b>).</p>
Full article ">Figure 3
<p>Cell morphology evaluated by optical microscopy (<b>A</b>,<b>B</b>) and scanning electron microscopy (<b>C</b>); the images show the control group (CTRL), cells cultured on graphene oxide nanofilm (GO), cells cultured with the addition of the extract (CEME), and cells cultured on GO nanofilm with addition of the extract (GO + CEME); cells were stained with eosin/hematoxylin for visualization of nucleic acids and proteins (<b>B</b>); myotubes (yellow arrows), filopodia (green arrow); multilayer of undifferentiated cells (blue arrows).</p>
Full article ">Figure 4
<p>(<b>A</b>) Fluorescent images with labeled nuclei (blue) and actin (red) of cells after 5 days of culture: control group (CTRL); culture with chicken embryo muscle extract supplementation (CEME); nuclei in myotubes (green arrows), myotubes (grey arrows), striated sarcomeric structure (yellow arrow); quantitative analysis of the fusion index of the differentiating cells (<b>B</b>). The error bars represent standard deviations. Different letters (a, b) above the columns indicate statistically significant differences between the groups (<span class="html-italic">p</span> ≤ 0.05).</p>
Full article ">Figure 5
<p>Lactate dehydrogenase (LDH) release (<b>A</b>,<b>B</b>) and cell viability (<b>C</b>,<b>D</b>) were determined using LDH and MTT assays, respectively. Tests were performed after 48 and 96 h of primary culture. Negative control for LDH maximum release (Triton X), control group (CTRL), cells cultured on graphene oxide nanofilm (GO), cells cultured with addition of the extract (CEME), and cells cultured on GO nanofilm with addition of the extract (GO + CEME). The error bars represent standard deviations. Different letters (a, b, c, d) above the columns indicate statistically significant differences between the groups (<span class="html-italic">p</span> ≤ 0.05).</p>
Full article ">Figure 6
<p>Real-Time PCR analysis of gene expression at the mRNA level in muscle progenitor cells from the chicken embryo after 5 days of primary culture. Expression of genes related to proliferation, basic metabolism (<b>A</b>), and muscle cells differentiation (<b>B</b>) was investigated; the figure shows the results for the control group (<b>CTRL</b>), cells cultured on GO nanofilm (GO), cells cultured with addition of the extract (CEME), and cells cultured on GO nanofilm and extract (GO + CEME); Relative expression was calculated using housekeeping genes, ACTB and GAPDH; the results are presented as 2-ΔΔCT values compared to the control group; different letters above the columns indicate statistically significant differences between the groups (<span class="html-italic">p</span> ≤ 0.05). The error bars represent standard deviations.</p>
Full article ">
15 pages, 1478 KiB  
Article
Protective Effects of Vitamin K Compounds on the Proteomic Profile of Osteoblasts under Oxidative Stress Conditions
by Marta Muszyńska, Ewa Ambrożewicz, Agnieszka Gęgotek, Grzegorz Grynkiewicz and Elżbieta Skrzydlewska
Molecules 2020, 25(8), 1990; https://doi.org/10.3390/molecules25081990 - 23 Apr 2020
Cited by 10 | Viewed by 3154
Abstract
Oxidative stress, which accompanies the pathogenesis of many bone diseases, contributes to the reduction of osteoblast activity, resulting in the inhibition of differentiation. This study aimed to assess the effect of vitamins K1 and K2 (MK4 and MK7) on the proteomic profile of [...] Read more.
Oxidative stress, which accompanies the pathogenesis of many bone diseases, contributes to the reduction of osteoblast activity, resulting in the inhibition of differentiation. This study aimed to assess the effect of vitamins K1 and K2 (MK4 and MK7) on the proteomic profile of human osteoblasts cell line under oxidative conditions induced by hydrogen peroxide (H2O2). The analysis was performed using QExactiveHF mass spectrometer with a nanoelectrospray ionization source. The osteoblast protein exposed to oxidative stress and vitamin K was compared with the proteome of cells exposed only to oxidative stress. Our proteomic analysis identified 1234 proteins changed after 5 days, 967 after 15 days, and 1214 after 20 days of culture. We observed the most frequent changes in the expression of proteins with catalytic activity or protein/DNA binding properties (45% and 40%, respectively). Significant changes were also observed in proteins with transcription/translation regulator activity (2–6%), regulators of molecular functions (5–6%), signal transducers (1–4%), transporters (4–6%), and structural molecules (3–5%). Our results clearly show that vitamins K protect cells from H2O2-induced changes in protein expression, primarily through their effects on transcriptional regulators and transporter proteins. As a result, vitamins K can support the formation, remodeling, and mineralization of bone tissue. Full article
(This article belongs to the Collection Molecular Medicine)
Show Figures

Figure 1

Figure 1
<p>The molecular functions and <span class="html-italic">t</span>-test analysis of proteins in osteoblasts treated with H<sub>2</sub>O<sub>2</sub> (200 μM for 24 h) (<b>A</b>) and K1 (<b>B</b>), MK4 (<b>C</b>), or MK7 (<b>D</b>) (10 µM for 5, 15, and 20 days). <span class="html-italic">p</span>-values less than 0.05 were considered statistically significant. <span class="html-italic">p</span>-values presented on figure are included in <a href="#app1-molecules-25-01990" class="html-app">Table S4</a>.</p>
Full article ">Figure 1 Cont.
<p>The molecular functions and <span class="html-italic">t</span>-test analysis of proteins in osteoblasts treated with H<sub>2</sub>O<sub>2</sub> (200 μM for 24 h) (<b>A</b>) and K1 (<b>B</b>), MK4 (<b>C</b>), or MK7 (<b>D</b>) (10 µM for 5, 15, and 20 days). <span class="html-italic">p</span>-values less than 0.05 were considered statistically significant. <span class="html-italic">p</span>-values presented on figure are included in <a href="#app1-molecules-25-01990" class="html-app">Table S4</a>.</p>
Full article ">
11 pages, 2748 KiB  
Article
MnO2/rGO/CNTs Framework as a Sulfur Host for High-Performance Li-S Batteries
by Wei Dong, Lingqiang Meng, Xiaodong Hong, Sizhe Liu, Ding Shen, Yingkai Xia and Shaobin Yang
Molecules 2020, 25(8), 1989; https://doi.org/10.3390/molecules25081989 - 23 Apr 2020
Cited by 28 | Viewed by 3638
Abstract
Lithium-sulfur batteries are very promising next-generation energy storage batteries due to their high theoretical specific capacity. However, the shuttle effect of lithium-sulfur batteries is one of the important bottlenecks that limits its rapid development. Herein, physical and chemical dual adsorption of lithium polysulfides [...] Read more.
Lithium-sulfur batteries are very promising next-generation energy storage batteries due to their high theoretical specific capacity. However, the shuttle effect of lithium-sulfur batteries is one of the important bottlenecks that limits its rapid development. Herein, physical and chemical dual adsorption of lithium polysulfides are achieved by designing a novel framework structure consisting of MnO2, reduced graphene oxide (rGO), and carbon nanotubes (CNTs). The framework-structure composite of MnO2/rGO/CNTs is prepared by a simple hydrothermal method. The framework exhibits a uniform and abundant mesoporous structure (concentrating in ~12 nm). MnO2 is an α phase structure and the α-MnO2 also has a significant effect on the adsorption of lithium polysulfides. The rGO and CNTs provide a good physical adsorption interaction and good electronic conductivity for the dissolved polysulfides. As a result, the MnO2/rGO/CNTs/S cathode delivered a high initial capacity of 1201 mAh g−1 at 0.2 C. The average capacities were 916 mAh g−1, 736 mAh g−1, and 547 mAh g−1 at the current densities of 0.5 C, 1 C, and 2 C, respectively. In addition, when tested at 0.5 C, the MnO2/rGO/CNTs/S exhibited a high initial capacity of 1010 mAh g−1 and achieved 780 mAh g−1 after 200 cycles, with a low capacity decay rate of 0.11% per cycle. This framework-structure composite provides a simple way to improve the electrochemical performance of Li-S batteries. Full article
Show Figures

Graphical abstract

Graphical abstract
Full article ">Figure 1
<p>The schematic synthesis processes of MnO<sub>2</sub>, MnO<sub>2</sub>/rGO, and MnO<sub>2</sub>/rGO/CNTs. rGO: reduced graphene oxide; CNTs: carbon nanotubes.</p>
Full article ">Figure 2
<p>SEM images of MnO<sub>2</sub> (<b>a</b>), rGO (<b>b</b>), MnO<sub>2</sub>/rGO (<b>c</b>), and MnO<sub>2</sub>/rGO/CNTs (<b>d</b>), HRTEM images of MnO<sub>2</sub>/rGO/CNTs (<b>e, f</b>).</p>
Full article ">Figure 3
<p>XRD patterns of rGO, MnO<sub>2</sub>, MnO<sub>2</sub>/rGO, and MnO<sub>2</sub>/rGO/CNTs (<b>a</b>); XRD patterns of rGO/S, MnO<sub>2</sub>/S, MnO<sub>2</sub>/rGO/S, and MnO<sub>2</sub>/rGO/CNTs/S (<b>b</b>); Nitrogen adsorption–desorption isotherms (<b>c</b>) and pore size distribution curves (<b>d</b>) for MnO<sub>2</sub>/rGO and MnO<sub>2</sub>/rGO/CNTs.</p>
Full article ">Figure 4
<p>Charge–discharge curves (<b>a</b>); rate performance (<b>b</b>); cycling performance and coulombic efficiency (<b>c</b>) of rGO/S, MnO<sub>2</sub>/S, MnO<sub>2</sub>/rGO/S, and MnO<sub>2</sub>/rGO/CNTs/S; long cycle performance of MnO<sub>2</sub>/rGO/CNTs/S (<b>d</b>).</p>
Full article ">Figure 5
<p>Cyclic voltammograms of rGO/S (<b>a</b>), MnO<sub>2</sub>/rGO/S (<b>b</b>), and MnO<sub>2</sub>/rGO/CNTs/S (<b>c</b>); electrochemical impedance spectroscopy (EIS) curves of MnO<sub>2</sub>/rGO/S and MnO<sub>2</sub>/rGO/CNTs/S (<b>d</b>).</p>
Full article ">
12 pages, 2578 KiB  
Article
Mechanical and Thermal Properties of Polyether Polytriazole Elastomers Formed by Click-Chemical Reaction Curing Glycidyl Azide Polymer
by Liming He, Jun Zhou, Yutao Wang, Zhongliang Ma and Chunlin Chen
Molecules 2020, 25(8), 1988; https://doi.org/10.3390/molecules25081988 - 23 Apr 2020
Cited by 10 | Viewed by 2946
Abstract
Energetic binders are a research hot-spot, and much emphasis has been placed on their mechanical properties. In this study, propargyl-terminated ethylene oxide-tetrahydrofuran copolymer (PTPET) was synthesized. Then, PTPET and low-molecular-weight ester-terminated glycidyl azide polymer (GAP) were reacted by the click reaction without using [...] Read more.
Energetic binders are a research hot-spot, and much emphasis has been placed on their mechanical properties. In this study, propargyl-terminated ethylene oxide-tetrahydrofuran copolymer (PTPET) was synthesized. Then, PTPET and low-molecular-weight ester-terminated glycidyl azide polymer (GAP) were reacted by the click reaction without using catalysts to obtain a polyether polytriazole elastomer. Through tensile tests, where R = 0.5, the tensile strength reached 0.332 MPa, with an elongation at break of 897.1%. Swelling tests were used to measure the cross-linked network and showed that the cross-linked network regularity was reduced as R increased. The same conclusions were confirmed by dynamic mechanical analysis (DMA). In DMA curves, Tg was around −70 to −65 °C, and a small amount of crystallization appeared at between −50 and −30 °C, because locally ordered structures were also present in random copolymers, thereby forming localized crystals. Their thermal performance was tested by Differential Scanning Calorimeter (DSC) and Thermal Gravimetric Analyzer (TG), and the main mass loss occurred at around 350 to 450 °C, which meant that they were stable. In conclusion, the polyether polytriazole elastomer can be used as a binder in a composite propellant. Full article
(This article belongs to the Special Issue Advanced Chemistry of Energetic Materials)
Show Figures

Figure 1

Figure 1
<p>FTIR spectra of PET and PTPET. PET, ethylene oxide-tetrahydrofuran copolymer; PTPET, propargyl-terminated ethylene oxide-tetrahydrofuran copolymer.</p>
Full article ">Figure 2
<p><sup>1</sup>H NMR spectra of PET and PTPET.</p>
Full article ">Figure 3
<p>Mechanical properties: effect of R value for polytriazole elastomers S0–S5.</p>
Full article ">Figure 4
<p>Volume swelling curves of S1–S5.</p>
Full article ">Figure 5
<p>Storage and loss modulus of S1–S5.</p>
Full article ">Figure 6
<p>The tan δ curves of S1–S5.</p>
Full article ">Figure 7
<p>DSC curves of PTPET and S1–S5.</p>
Full article ">Figure 8
<p>TG curves of PTPET and S1–S5.</p>
Full article ">Figure 9
<p>The reaction mechanism of azide and alkynyl.</p>
Full article ">
20 pages, 4051 KiB  
Review
Type 2 Diabetes Mellitus: A Review of Multi-Target Drugs
by Angelica Artasensi, Alessandro Pedretti, Giulio Vistoli and Laura Fumagalli
Molecules 2020, 25(8), 1987; https://doi.org/10.3390/molecules25081987 - 23 Apr 2020
Cited by 244 | Viewed by 27214
Abstract
Diabetes Mellitus (DM) is a multi-factorial chronic health condition that affects a large part of population and according to the World Health Organization (WHO) the number of adults living with diabetes is expected to increase. Since type 2 diabetes mellitus (T2DM) is suffered [...] Read more.
Diabetes Mellitus (DM) is a multi-factorial chronic health condition that affects a large part of population and according to the World Health Organization (WHO) the number of adults living with diabetes is expected to increase. Since type 2 diabetes mellitus (T2DM) is suffered by the majority of diabetic patients (around 90–95%) and often the mono-target therapy fails in managing blood glucose levels and the other comorbidities, this review focuses on the potential drugs acting on multi-targets involved in the treatment of this type of diabetes. In particular, the review considers the main systems directly involved in T2DM or involved in diabetes comorbidities. Agonists acting on incretin, glucagon systems, as well as on peroxisome proliferation activated receptors are considered. Inhibitors which target either aldose reductase and tyrosine phosphatase 1B or sodium glucose transporters 1 and 2 are taken into account. Moreover, with a view at the multi-target approaches for T2DM some phytocomplexes are also discussed. Full article
Show Figures

Graphical abstract

Graphical abstract
Full article ">Figure 1
<p>Pathophysiology of type 2 diabetes mellitus (T2DM).</p>
Full article ">Figure 2
<p>Glucose-lowering medication in T2DM.</p>
Full article ">Figure 3
<p>Different strategies to design multi-target ligands.</p>
Full article ">Figure 4
<p>Amino acid sequences of glucagon-like peptide 1 (GLP-1), glucagon, and of glucose-dependent insulinotropic polypeptide (GIP).</p>
Full article ">Figure 5
<p>Structure of glucagon, GLP-1 and chimeric peptides. (<b>a</b>) Amino acid sequence and structure of glucagon and GLP-1 chimera. Underlined residues indicate site of lactam formation. (<b>b</b>) Helical wheel representation of glucagon, GLP-1 and chimeric peptide showing residues 12–29.</p>
Full article ">Figure 6
<p>(<b>a</b>) Sequence alignment and receptor agonist potencies of Oxyntomodulin (OXM) and related peptides. Conserved residues are highlighted: (<b>b</b>) Structure of a Glucagon-Like Peptide 1/Glucagon Receptor Dual Agonist and (<b>c</b>) in vitro receptor agonist potencies (cAMP release) against mGLP1R and mGCGR and ED<sub>50</sub> (nM) in the <span class="html-italic">ex vivo</span> mouse liver glycogenolysis assay (mGlyco).</p>
Full article ">Figure 7
<p>Amino acid sequences of glucagon, the incretin hormones, and triagonist.</p>
Full article ">Figure 8
<p>Sequence alignment of peptides Y2, EP45, glucagon, and incretin hormones.</p>
Full article ">Figure 9
<p>Structure of Sotaglifozin, a Dual SGLT1/SGLT2 Inhibitor.</p>
Full article ">Figure 10
<p>General structure of aldose reductase (AR)/protein tyrosine phosphatase 1B (PTP1B) inhibitors.</p>
Full article ">Figure 11
<p>Structures of several peroxisome proliferation activated receptor (PPAR)-α/γ dual agonists.</p>
Full article ">Figure 12
<p>Chemical structure of a PPAR-γ/δ agonist.</p>
Full article ">Figure 13
<p>Different example of PPARs pan agonist.</p>
Full article ">
16 pages, 2023 KiB  
Review
Interactions of Tea-Derived Catechin Gallates with Bacterial Pathogens
by Peter W. Taylor
Molecules 2020, 25(8), 1986; https://doi.org/10.3390/molecules25081986 - 23 Apr 2020
Cited by 17 | Viewed by 3864
Abstract
Green tea-derived galloylated catechins have weak direct antibacterial activity against both Gram-positive and Gram-negative bacterial pathogens and are able to phenotypically transform, at moderate concentrations, methicillin-resistant Staphylococcus aureus (MRSA) clonal pathogens from full β-lactam resistance (minimum inhibitory concentration 256–512 mg/L) to complete susceptibility [...] Read more.
Green tea-derived galloylated catechins have weak direct antibacterial activity against both Gram-positive and Gram-negative bacterial pathogens and are able to phenotypically transform, at moderate concentrations, methicillin-resistant Staphylococcus aureus (MRSA) clonal pathogens from full β-lactam resistance (minimum inhibitory concentration 256–512 mg/L) to complete susceptibility (~1 mg/L). Reversible conversion to susceptibility follows intercalation of these compounds into the bacterial cytoplasmic membrane, eliciting dispersal of the proteins associated with continued cell wall peptidoglycan synthesis in the presence of β-lactam antibiotics. The molecules penetrate deep within the hydrophobic core of the lipid palisade to force a reconfiguration of cytoplasmic membrane architecture. The catechin gallate-induced staphylococcal phenotype is complex, reflecting perturbation of an essential bacterial organelle, and includes prevention and inhibition of biofilm formation, disruption of secretion of virulence-related proteins, dissipation of halotolerance, cell wall thickening and cell aggregation and poor separation of daughter cells during cell division. These features are associated with the reduction of capacity of potential pathogens to cause lethal, difficult-to-treat infections and could, in combination with β-lactam agents that have lost therapeutic efficacy due to the emergence of antibiotic resistance, form the basis of a new approach to the treatment of staphylococcal infections. Full article
(This article belongs to the Special Issue Catechins in Human Health 2020)
Show Figures

Figure 1

Figure 1
<p>Structures of (−)-epicatechin gallate (ECg), (−)-epigallocatechin gallate (EGCg), (−)-epicatechin (EC), (−)-3,5-dihydroxy B-ring modified (−)-ECg (1), (−)-3-hydroxy B-ring modified (−)-ECg (2), (−) B-ring modified (−)-ECg (3), (−)-A,B-ring modified (−)-ECg (4) and A,B-ring modified (−)-Cg (5). Reproduced from Palacios et al. [<a href="#B81-molecules-25-01986" class="html-bibr">81</a>] under the terms of the Creative Commons Attribution license.</p>
Full article ">Figure 2
<p>Scanning electron micrographs of <span class="html-italic">S. aureus</span> BB568 cells grown in non-supplemented Müller–Hinton broth (MHB; <b>A</b>), in MHB containing 12.5 mg/L ECg (<b>B</b>). BB568 cells were incubated with cationised ferritin after growth in non-supplemented (<b>C</b>) and ECg-supplemented (<b>D</b>) MHB. Reproduced from [<a href="#B7-molecules-25-01986" class="html-bibr">7</a>] with permission from RightsLink/Elsevier.</p>
Full article ">Figure 3
<p>Proteins of the divisome recruited to the division septum of methicillin-resistant <span class="html-italic">Staphylococcus aureus</span> (MRSA) during cell division. Cytoplasmic synthesis of lipid II, the peptidoglycan precursor polymerised by penicillin-binding proteins (PBPs), is also shown in the not-to-scale representation. (Figure kindly provided by Dr. Sarah Paulin; from her PhD thesis 2014).</p>
Full article ">
12 pages, 5647 KiB  
Article
N-Acetylation of Amines in Continuous-Flow with Acetonitrile—No Need for Hazardous and Toxic Carboxylic Acid Derivatives
by György Orsy, Ferenc Fülöp and István M. Mándity
Molecules 2020, 25(8), 1985; https://doi.org/10.3390/molecules25081985 - 23 Apr 2020
Cited by 8 | Viewed by 7765
Abstract
A continuous-flow acetylation reaction was developed, applying cheap and safe reagent, acetonitrile as acetylation agent and alumina as catalyst. The method developed utilizes milder reagent than those used conventionally. The reaction was tested on various aromatic and aliphatic amines with good conversion. The [...] Read more.
A continuous-flow acetylation reaction was developed, applying cheap and safe reagent, acetonitrile as acetylation agent and alumina as catalyst. The method developed utilizes milder reagent than those used conventionally. The reaction was tested on various aromatic and aliphatic amines with good conversion. The catalyst showed excellent reusability and a scale-up was also carried out. Furthermore, a drug substance (paracetamol) was also synthesized with good conversion and yield. Full article
Show Figures

Graphical abstract

Graphical abstract
Full article ">Figure 1
<p>Schematic representation of the reactor used in the study.</p>
Full article ">Figure 2
<p>The effect of temperature (<b>a</b>), pressure (<b>b</b>), flow rate (<b>c</b>) and concentration (<b>d</b>) on the reaction conversion catalyzed by Al<sub>2</sub>O<sub>3</sub>. The effect of the pressure was measured at room temperature and the effect of temperature was determined at 50 bar, while the effect of the flow rate and concentration was analyzed at the optimized conditions.</p>
Full article ">Figure 3
<p>Robustness of the acetylation investigated in the reaction of benzylamine. The same reaction was repeated 10 times on the same catalyst.</p>
Full article ">Scheme 1
<p>The suspected reaction mechanism of acetylation.</p>
Full article ">
12 pages, 3074 KiB  
Article
Hematite Nanoparticles from Unexpected Reaction of Ferrihydrite with Concentrated Acids for Biomedical Applications
by Afanasy V. Lunin, Anna A. Lizunova, Elizaveta N. Mochalova, Maria N. Yakovtseva, Vladimir R. Cherkasov, Maxim P. Nikitin and Eugene L. Kolychev
Molecules 2020, 25(8), 1984; https://doi.org/10.3390/molecules25081984 - 23 Apr 2020
Cited by 15 | Viewed by 4676
Abstract
The development of synthetic ways to fabricate nanosized materials with a well-defined shape, narrow-sized distribution, and high stability is of great importance to a rapidly developing area of nanotechnology. Here, we report an unusual reaction between amorphous two-line ferrihydrite and concentrated sulfuric or [...] Read more.
The development of synthetic ways to fabricate nanosized materials with a well-defined shape, narrow-sized distribution, and high stability is of great importance to a rapidly developing area of nanotechnology. Here, we report an unusual reaction between amorphous two-line ferrihydrite and concentrated sulfuric or other mineral and organic acids. Instead of the expected dissolution, we observed the formation of new narrow-distributed brick-red nanoparticles (NPs) of hematite. Different acids produce similar nanoparticles according to scanning (SEM) and transmission electron microscopy (TEM), selected area electron diffraction (SAED), X-ray diffraction (XRD), infrared spectroscopy (FTIR), and energy-dispersive X-ray spectroscopy (EDX). The reaction demonstrates new possibilities for the synthesis of acid-resistant iron oxide nanoparticles and shows a novel pathway for the reaction of iron hydroxide with concentrated acids. The biomedical potential of the fabricated nanoparticles is demonstrated by the functionalization of the particles with polymers, fluorescent labels, and antibodies. Three different applications are demonstrated: i) specific targeting of the red blood cells, e.g., for red blood cell (RBC)-hitchhiking; ii) cancer cell targeting in vitro; iii) infrared ex vivo bioimaging. This novel synthesis route may be useful for the development of iron oxide materials for such specificity-demanding applications such as nanosensors, imaging, and therapy. Full article
(This article belongs to the Special Issue Complex Multifunctional Organic/Inorganic Nanocarriers)
Show Figures

Graphical abstract

Graphical abstract
Full article ">Figure 1
<p>(<b>a</b>) The X-ray diffraction patterns of the synthesized nanoparticles; (<b>b</b>) The reference patterns.</p>
Full article ">Figure 2
<p>(<b>a</b>) Scanning electron microscopy; (<b>b</b>) Transmission electron microscopy images of the nanoparticles (NPs); (<b>c</b>) Selected area electron diffraction pattern of the NPs.</p>
Full article ">Figure 3
<p>Attenuated total reflectance (ATR) infrared spectroscopy (FTIR) spectra. (<b>a</b>) Comparison of the hematite nanoparticles (HNPs) spectrum with the standard hematite sample; (<b>b</b>) Spectra of polymer-coated HNPs in 770–3200 cm<sup>−1</sup> range in comparison with the spectra of pure polymers.</p>
Full article ">Figure 4
<p>Flow cytometry and fluorescent immunoassay results. (<b>a</b>) Interaction between erythrocytes (RBCs) and coated HNPs, higher side scattering indicates stronger interactions; (<b>b</b>), (<b>c</b>) Binding of HNPs@PAA@TER-Cy3 (<b>b</b>) and HNPs@CMD@TER-Cy3 (<b>c</b>) with human total immunoglobulin (IgG), bovine serum albumin (BSA), and anti-rat Ig, adsorbed on polystyrene, the data are plotted as mean  ± standard deviation (<span class="html-italic">n</span> = 3); (<b>d</b>), (<b>e</b>) Imaging flow cytometry analysis of the interaction between HNPs@PAA@TER-Cy3 and HNPs@CMD@TER-Cy3 with red blood cells (RBCs), green lines show the distribution obtained in the TER-119 monoclonal antibody (TER)-containing incubation mixture; (<b>f</b>) Flow cytometry analysis of the interaction of BT-474 (HER2/neu-positive) and CHO (HER2/neu-negative) cells with HNPs@PAA@Trastuzumab-Cy3; (<b>g</b>) Images of an interaction between RBCs and two types of polyacrylic acid sodium salt (PAA)-coated nanoparticles, conjugated with the RBC-binding and RBC-nonbinding antibodies (in bright field, Cy3-channel and in side scatter channel). The scale bar is 10 μm. Significance levels were calculated using unpaired one-tailed t-test (* <span class="html-italic">p</span> &lt; 0.05; ** <span class="html-italic">p</span> &lt; 0.01; *** <span class="html-italic">p</span> &lt; 0.001; n.s. <span class="html-italic">p</span> &gt; 0.05).</p>
Full article ">Figure 5
<p>Fluorescent ex vivo imaging of the excised mouse organs.</p>
Full article ">
18 pages, 2454 KiB  
Article
Structure–Activity Relationships and Biological Evaluation of 7-Substituted Harmine Analogs for Human β-Cell Proliferation
by Kunal Kumar, Peng Wang, Ethan A. Swartz, Susmita Khamrui, Cody Secor, Michael B. Lazarus, Roberto Sanchez, Andrew F. Stewart and Robert J. DeVita
Molecules 2020, 25(8), 1983; https://doi.org/10.3390/molecules25081983 - 23 Apr 2020
Cited by 11 | Viewed by 3815
Abstract
Recently, we have shown that harmine induces β-cell proliferation both in vitro and in vivo, mediated via the DYRK1A-NFAT pathway. We explore structure–activity relationships of the 7-position of harmine for both DYRK1A kinase inhibition and β-cell proliferation based on our related previous structure–activity [...] Read more.
Recently, we have shown that harmine induces β-cell proliferation both in vitro and in vivo, mediated via the DYRK1A-NFAT pathway. We explore structure–activity relationships of the 7-position of harmine for both DYRK1A kinase inhibition and β-cell proliferation based on our related previous structure–activity relationship studies of harmine in the context of diabetes and β-cell specific targeting strategies. 33 harmine analogs of the 7-position substituent were synthesized and evaluated for biological activity. Two novel inhibitors were identified which showed DYRK1A inhibition and human β-cell proliferation capability. The DYRK1A inhibitor, compound 1-2b, induced β-cell proliferation half that of harmine at three times higher concentration. From these studies we can draw the inference that 7-position modification is limited for further harmine optimization focused on β-cell proliferation and cell-specific targeting approach for diabetes therapeutics. Full article
(This article belongs to the Section Medicinal Chemistry)
Show Figures

Graphical abstract

Graphical abstract
Full article ">Figure 1
<p>Optimization of the 7-position of harmine.</p>
Full article ">Figure 2
<p>Dual-specificity Tyrosine-phosphorylation-Regulated Kinase A (DYRK1A) inhibition of 7-C harmine analogs <span class="html-italic"><sup>a</sup></span>.</p>
Full article ">Figure 3
<p>Docking of selected 7-substituted harmine analogs. <b>A.</b> Docking of <b>1-2a</b> (subpanel A), <b>1-2b</b> (subpanel B), <b>1-2c</b> (subpanel C), <b>1-2e</b> (subpanel D), <b>1-2l</b> (subpanel E), <b>1-3b</b> (subpanel F). Ligands are shown in green, the protein surface in gray, and selected residues in light blue. <b>B.</b> Docking of compounds <b>1-10</b> (subpanel A,D)<b>, 1-11</b> (subpanel B,E), and <b>1-12</b> (subpanel C,F). Subpanel A-C stick model of the ligand docked into the ATP-binding pocket of DYRK1A. Subpanel D–F, space filling models of the same structures shown in A–C. All three compounds are unable to hydrogen bond with the backbone of Leu 241 (used by harmine, panel D) due to the unfavorable orientation of their carbonyl oxygen. The hydrophobic substituents however interact with a hydrophobic cleft formed by the side chain of Ile 165 and Met 240 (shown in yellow). <b>C.</b> Docking of 7-substituted Harmine analogs containing carboxylic acid groups. Compound <b>1-4c</b> is shown in green and compounds <b>1-4e</b> in yellow. <b>D.</b> Harmine bound to DYRK1A (PDB 3ANR). The surface of the protein is colored according to the electrostatic potential (red for negative and blue for positive).</p>
Full article ">Figure 4
<p>Effects of harmine analogues on human β-cell proliferation. (<b>A</b>). Initial screening of harmine analogues on human β-cell proliferation at 10 μM. DMSO was used as a negative control, and harmine was used as a positive control (<span class="html-italic">n</span> = 3). (<b>B</b>) Dose–response curves for human β-cell proliferation for <b>1-2b</b> in human β-cells (<span class="html-italic">n</span> = 3 human islet donors for each dose; harmine (10 μM) is the positive control. (<b>C</b>) A representative example from (<b>B</b>) of Ki67-insulin double-positive cells induced by <b>1-2b</b> and harmine. Error bars indicate SEM and * indicates <span class="html-italic">p</span> &lt; 0.05. A minimum of 1000 β-cells was counted for each graph. In all relevant panels, error bars indicate SEM and, * indicates <span class="html-italic">p</span> &lt; 0.05. A minimum of 1000 β-cells was counted for each graph.</p>
Full article ">Scheme 1
<p>Synthesis of 7-Substituted Harmine Analogs. Reagents and conditions: (<b>a</b>) AcOH, 48% HBr, reflux, 12 h, 99%; (<b>b</b>) Cs<sub>2</sub>CO<sub>3</sub> (1.5 eq.), Br(CH<sub>2</sub>)<sub>n</sub>CO<sub>2</sub>R (1.5 eq.), DMF, 50 °C, 12 h, 32–68%; (<b>c</b>) 7N NH<sub>3</sub> in MeOH (20 eq.), 90 °C, 12 h, 84–97%; (<b>d</b>) 4N HCl in dioxane, rt, 12 h, 82–98%; (<b>e</b>) 4N HCl in dioxane, dioxane, rt, 12 h, 90–99%; (<b>f</b>) Acetic anhydride (1 eq.), Et<sub>3</sub>N (2.2eq.), DCM, rt, 12 h, 49–79%; (<b>g</b>) Tf<sub>2</sub>O (1.2 eq.), Pyridine, DCM, 0 °C-rt, 12h, 92%; (<b>h</b>) NaNO<sub>2</sub> (2 eq.), Pd<sub>2</sub>(dba)<sub>3</sub> (5 mol%), BrettPhos (12 mol%), TDA (5 mol%), <span class="html-italic">t</span>-BuOH, 150 °C, 24 h, 77%; (<b>i</b>) 10% wt Pd on C, N<sub>2</sub>H<sub>4</sub>.H<sub>2</sub>O (20 eq.), MeOH, reflux, 2 h, 98%; (<b>j</b>) Benzoyl chloride (1.05 eq.), Et<sub>3</sub>N (2 eq.), THF, 0 °C-rt, 12 h, 75%; (<b>k</b>) Acetic anhydride (1.2 eq.), Et<sub>3</sub>N (2 eq.), THF, rt, 24 h, 77%; (<b>l</b>) Isopropylisocyanate (1.1 eq.), DMF, rt, 12 h, 32%.</p>
Full article ">
14 pages, 3605 KiB  
Article
Technetium-Radiolabeled Mannose-Functionalized Gold Nanoparticles as Nanoprobes for Sentinel Lymph Node Detection
by Oscar J. Estudiante-Mariquez, Andrés Rodríguez-Galván, David Ramírez-Hernández, Flavio F. Contreras-Torres and Luis A. Medina
Molecules 2020, 25(8), 1982; https://doi.org/10.3390/molecules25081982 - 23 Apr 2020
Cited by 13 | Viewed by 3188
Abstract
Gold nanoparticles (AuNPs) are considered valuable nanomaterials for the design of radiolabeled nanoprobes for single-photon emission computed tomography (SPECT) imaging. Radiolabeled and functionalized AuNPs could improve lymphatic mapping by enhancing the radioactive signaling of individual particles in the sentinel node. In this study, [...] Read more.
Gold nanoparticles (AuNPs) are considered valuable nanomaterials for the design of radiolabeled nanoprobes for single-photon emission computed tomography (SPECT) imaging. Radiolabeled and functionalized AuNPs could improve lymphatic mapping by enhancing the radioactive signaling of individual particles in the sentinel node. In this study, an alternative method for functionalizing commercial AuNps with mannose is described. The chemical derivatization and biofunctionalization of AuNPs were performed with lipoic acid and mannose, respectively. Several levels of mannose were tested; the thiolate hydrazinonicotinamide-glycine-glycine-cysteine (HYNIC) molecule was also used for 99mTc radiolabeling. Physicochemical characterization of this system includes U-V spectroscopy, dynamic light scattering, Fourier-transform infrared spectroscopy, and transmission electron microscopy. The most stable nanoprobe, in terms of the aggregation, radiolabeling efficiency, and purity, was tested in a sentinel lymph node model in a rat by microSPECT/computed tomography (CT) imaging. The SPECT images revealed that 99mTc-radiolabeled AuNPs functionalized with mannose can track and accumulate in lymph nodes in a similar way to the commercial 99mTc-Sulfur colloid, commonly used in clinical practice for sentinel lymph node detection. These promising results support the idea that 99mTc-AuNPs-mannose could be used as a SPECT contrast agent for lymphatic mapping. Full article
(This article belongs to the Section Materials Chemistry)
Show Figures

Graphical abstract

Graphical abstract
Full article ">Figure 1
<p>The attenuated total reflection Fourier transform infrared (ATR-FTIR) spectra for the covalent bonding of 2-aminoethyl 2,3,4,6-tetra-<span class="html-italic">O</span>-acetyl-α-<span class="html-small-caps">d</span>-mannopyranoside hydrochloride (MAN) molecules on lipoic acid (ALA) moieties.</p>
Full article ">Figure 2
<p>Ultraviolet-visible spectra for: (<b>a</b>) Gold nanoparticles (AuNPs)-ALA, (<b>b</b>) AuNPs-MAN, and (<b>c</b>) hydrazinonicotinamide-glycine-glycine-cysteine (HYNIC)-AuNPs-MAN. The red color indicates the spectra of pristine gold nanoparticles and the yellow, green, blue, and purple colors indicate the incubation times at 2, 24, 48, and 72 h, respectively.</p>
Full article ">Figure 3
<p>Representative transmission electron microscopy images, size histogram distribution, and HRTEM analysis for (<b>a</b>) AuNPs, (<b>b</b>) AuNPs-ALA, and (<b>c</b>) AuNPs-MAN. Results correspond to the 48 h incubation group.</p>
Full article ">Figure 4
<p>Illustrative picture of the <sup>99m</sup>Tc-AuNPs-MAN<sub>48h</sub> mapping in lymphatic vessels and nodes in a rat. The lymph nodes are identified as popliteal (PO), iliac (IL), inguinal (IN), and renal (RE).</p>
Full article ">Figure 5
<p>Micro single-photon emission computed tomography (SPECT)/computed tomography (CT) images depicting AuNPs-MAN<sub>48h</sub> vs. AuNPs-ALA<sub>48h</sub> accumulation in the popliteal lymph node. Arrows indicate the location of the nodes. ALA and MAN notation indicates the injection of AuNPs-ALA<sub>48h</sub> and AuNPs-MAN<sub>48h</sub> in the left and right footpad, respectively. Animals were oriented in a prone position.</p>
Full article ">Figure 6
<p>MicroSPECT/CT images of two different rats at different times, illustrating the differences in the lymphatic mapping of <sup>99m</sup>Tc-Sulfur colloid (S) and <sup>99m</sup>Tc-AuNPs-MAN<sub>48h</sub> (MAN). Arrows indicate the location of the lymph nodes. Animals were oriented in a prone position.</p>
Full article ">Figure 7
<p>A box and whisker plot showing the results of the percentage of injected dose at the injection site (left) and popliteal node (right) at 3 and 6 h after the injection of either <sup>99m</sup>Tc-Sulfur colloid or <sup>99m</sup>Tc-AuNPs-MAN<sub>48h</sub>. Boxes extend from 1st to 3rd quartiles; thick lines and + symbols inside boxes represent the median and mean (n = 5), respectively; whiskers go from the smallest to the largest values in each group and there were no outliers. No statistical difference was observed after ANOVA.</p>
Full article ">
15 pages, 1159 KiB  
Article
Volatilome of Chill-Stored European Seabass (Dicentrarchus labrax) Fillets and Atlantic Salmon (Salmo salar) Slices under Modified Atmosphere Packaging
by Athanasios Kritikos, Ioanna Aska, Sotirios Ekonomou, Athanasios Mallouchos, Foteini F. Parlapani, Serkos A. Haroutounian and Ioannis S. Boziaris
Molecules 2020, 25(8), 1981; https://doi.org/10.3390/molecules25081981 - 23 Apr 2020
Cited by 27 | Viewed by 4091
Abstract
Fish spoilage occurs due to production of metabolites during storage, from bacterial action and chemical reactions, which leads to sensory rejection. Investigating the volatilome profile can reveal the potential spoilage markers. The evolution of volatile organic molecules during storage of European seabass ( [...] Read more.
Fish spoilage occurs due to production of metabolites during storage, from bacterial action and chemical reactions, which leads to sensory rejection. Investigating the volatilome profile can reveal the potential spoilage markers. The evolution of volatile organic molecules during storage of European seabass (Dicentrarchus labrax) fillets and Atlantic salmon (Salmo salar) slices under modified atmosphere packaging at 2 °C was recorded by solid-phase microextraction combined with gas chromatography-mass spectrometry. Total volatile basic nitrogen (TVB-N), microbiological, and sensory changes were also monitored. The shelf life of seabass fillets and salmon slices was 10.5 days. Pseudomonas and H2S-producing bacteria were the dominant microorganisms in both fish. TVB-N increased from the middle of storage, but never reached concentrations higher than the regulatory limit of 30–35 mg N/100 g. The volatilome consisted of a number of aldehydes, ketones, alcohols and esters, common to both fish species. However, different evolution patterns were observed, indicating the effect of fish substrate on microbial growth and eventually the generation of volatiles. The compounds 3-hydroxy-2-butanone, 2,3-butanediol, 2,3-butanedione and acetic acid could be proposed as potential spoilage markers. The identification and quantification of the volatilities of specific fish species via the development of a database with the fingerprint of fish species stored under certain storage conditions can help towards rapid spoilage assessment. Full article
(This article belongs to the Special Issue Food Traceability and Authenticity within Analytical Chemistry)
Show Figures

Figure 1

Figure 1
<p>Overall acceptance scores of cooked (<b>a</b>) sea bass fillets and (<b>b</b>) salmon slices stored under modified atmosphere packaging (MAP) at 2 °C. Each data point is the mean score of 5 panelists. The cross-section of the dashed lines represents the point of minimum acceptability.</p>
Full article ">Figure 2
<p>Microbiological changes during storage of (<b>a</b>) sea bass fillets and (<b>b</b>) salmon slices at 2 °C under MAP. Total viable count (●), <span class="html-italic">Enterobacteriaceae</span> (□), <span class="html-italic">Brochothrix thermosphacta</span> (▲), <span class="html-italic">Pseudomonas</span> spp. (○), Lactic acid bacteria (Δ) and H<sub>2</sub>S producing bacteria (■). Each data point and the error bars show the mean ± standard deviation of 4 replicates. The cross-section of dashed lines indicates the point of sensory rejection (11 days).</p>
Full article ">Figure 3
<p>TVB-N changes of sea bass fillets (▲) and salmon slices (●) stored under MAP at 2 °C. Each data point and the error bars show the mean ± standard deviation (mg N/100 g) of 4 replicates. The cross-section of the dashed lines represents the point of sensory rejection (11 days).</p>
Full article ">Figure 4
<p>Changes of volatiles in relation to the remaining shelf life during storage of sea bass fillets under MAP at 2 °C: (<b>a</b>) Group Ald-1, Ket-1, Alc-1 and Est-1; (<b>b</b>) Group Ald-2, Ket-2, Alc-2 and Est-2; (<b>c</b>) Group Ket-3 and 2,3-butanediol; (<b>d</b>) Acetic acid. The compounds included in each group are described in <a href="#molecules-25-01981-t001" class="html-table">Table 1</a>.</p>
Full article ">Figure 5
<p>Changes of volatiles in relation to remaining shelf life during storage of salmon slices under MAP at 2 °C. (<b>a</b>) Group Ald-1 and Alc-1; (<b>b</b>) Group Ald-2 and Ket-1; (<b>c</b>) Group Est-2 and Alc-2; (<b>d</b>) Group Alc-3 and Acetic acid. The compounds included in each group are described in <a href="#molecules-25-01981-t001" class="html-table">Table 1</a>.</p>
Full article ">
17 pages, 7099 KiB  
Article
In Vitro and in Vivo Activity of mTOR Kinase and PI3K Inhibitors Against Leishmania donovani and Trypanosoma brucei
by Trong-Nhat Phan, Kyung-Hwa Baek, Nakyung Lee, Soo Young Byun, David Shum and Joo Hwan No
Molecules 2020, 25(8), 1980; https://doi.org/10.3390/molecules25081980 - 23 Apr 2020
Cited by 20 | Viewed by 3695
Abstract
Kinetoplastid parasites, including Leishmania and Trypanosoma spp., are life threatening pathogens with a worldwide distribution. Next-generation therapeutics for treatment are needed as current treatments have limitations, such as toxicity and drug resistance. In this study, we examined the activities of established mammalian target [...] Read more.
Kinetoplastid parasites, including Leishmania and Trypanosoma spp., are life threatening pathogens with a worldwide distribution. Next-generation therapeutics for treatment are needed as current treatments have limitations, such as toxicity and drug resistance. In this study, we examined the activities of established mammalian target of rapamycin (mTOR)/phosphoinositide 3-kinase (PI3K) inhibitors against these tropical diseases. High-throughput screening of a library of 1742 bioactive compounds against intracellular L. donovani was performed, and seven mTOR/PI3K inhibitors were identified. Dose-dilution assays revealed that these inhibitors had half maximal effective concentration (EC50) values ranging from 0.14 to 13.44 μM for L. donovani amastigotes and from 0.00005 to 8.16 μM for T. brucei. The results of a visceral leishmaniasis mouse model indicated that treatment with Torin2, dactolisib, or NVP-BGT226 resulted in reductions of 35%, 53%, and 54%, respectively, in the numbers of liver parasites. In an acute T. brucei mouse model using NVP-BGT226 parasite numbers were reduced to under the limits of detection by five consecutive days of treatment. Multiple sequence and structural alignment results indicated high similarities between mTOR and kinetoplastid TORs; the inhibitors are predicted to bind in a similar manner. Taken together, these results indicated that the TOR pathways of parasites have potential for the discovery of novel targets and new potent inhibitors. Full article
Show Figures

Figure 1

Figure 1
<p>Pilot screening results for intracellular <span class="html-italic">L. donovani</span> infection in THP-1 cell line. Red, negative control (DMSO); black, positive control (4 μM amphotericin B); gray, compound. A total of 1742 compounds were screened, with R<sup>2</sup> = 0.922 (<b>A</b>)<b>,</b> Z′ = 0.798 (<b>B</b>), and host cell survival and intracellular parasite survival inhibition &gt; 60%, black squares (<b>C</b>), and cell ratio and intracellular parasite survival inhibition of 58 mammalian target of rapamycin (mTOR)/phosphoinositide 3-kinase (PI3K) compounds (<b>D</b>).</p>
Full article ">Figure 2
<p>Structures of compounds investigated in this work.</p>
Full article ">Figure 3
<p>Dose-response curves of miltefosine, amphotericin B, and mTOR/PI3K compounds against <a href="#molecules-25-01980-t001" class="html-table">Table 1</a> cells infected with intracellular <span class="html-italic">L. donovani</span>. Inhibition infection ratio (%) (● black-filled circles); inhibition parasite number (%) (<span style="color:#0070C0">■</span> blue-filled squares); and host cell ratio (%) (<span style="color:#C00000">▼</span> red-filled triangles). The results are expressed as mean ± standard deviation values for duplicate experiments.</p>
Full article ">Figure 4
<p>Dose-response curves of pentamidine and mTOR/PI3K compounds against <span class="html-italic">T. brucei</span> bloodstream form growth. The results are expressed as mean ± standard deviation values for duplicate experiments.</p>
Full article ">Figure 5
<p>Correlation of pEC<sub>50</sub> values for seven mTOR/PI3K inhibitors against <span class="html-italic">L. donovani</span> and <span class="html-italic">T. brucei.</span> (<b>A</b>) Correlation of pEC<sub>50</sub> values against intracellular <span class="html-italic">L. donovani</span> and promastigotes. (<b>B</b>) Correlation of pEC<sub>50</sub> values against intracellular <span class="html-italic">L. donovani</span> and <span class="html-italic">T. brucei</span> BSF. (<b>C</b>) Correlation of pEC<sub>50</sub> values against <span class="html-italic">L. donovani</span> promastigotes and <span class="html-italic">T. brucei</span> BSF.</p>
Full article ">Figure 6
<p>Activity of miltefosine and mTOR/PI3K compounds in <span class="html-italic">L. donovani</span>-infected BALB/c mice. Animals were infected and treated as described, and numbers of LDUs on slides of liver smears were counted. All treatments began 7 days after infection. The results are expressed as mean ± standard deviation values. (<b>A</b>) Groups of animals (five mice per group) were treated with single 30 mg/kg doses of miltefosine, a vehicle control with PBS, or with Torin2, dactolisib, NVP-BGT226 formulations at 15, 50, and 5 mg/kg, respectively, for 5 days via the oral route. (<b>B</b>) Postmortem Giemsa-stained liver smears were obtained from mice after no treatment or exposure to the vehicle, miltefosine, or mTOR/PI3K compounds at the doses indicated.</p>
Full article ">Figure 7
<p>In vivo results for <span class="html-italic">T. brucei</span> mouse model of infection. (<b>A</b>) Mouse survival after treatment with 30 mg/kg pentamidine (solid green line), 15 mg/kg Torin2 (solid black line), 5 mg/kg NVP-BGT226 (dotted black line), or the PBS control (solid blue line) for 5 days. (<b>B</b>) Parasitemia as a function of time after treatment.</p>
Full article ">Figure 8
<p>Multiple sequence alignments of the FKBP-rapamycin-binding (FRB) domains of the TOR1/2/3 kinases of <span class="html-italic">L. donovani, L. major, T. cruzi,</span> and <span class="html-italic">T. brucei,</span> and human mTOR. Seventeen amino acid residues around binding sites are indicated using red squares.</p>
Full article ">Figure 9
<p>Modeling of <span class="html-italic">L. donovani</span> TOR domains. (<b>A</b>–<b>C</b>) Structural alignment of <span class="html-italic">Ld</span>TOR1/2/3 and mTORDeltaN-mLST8-Torin2 using PyMOL. The blue cartoon represents the structure of the <span class="html-italic">Ld</span>TOR1, the yellow cartoon represents the structure of the <span class="html-italic">Ld</span>TOR2, and the cyan cartoon represents the structure of the <span class="html-italic">Ld</span>TOR3. The green cartoon represents the structure of the mTORDeltaN-mLST8 and the red stick is the Torin2 structure. (<b>D</b>) Structures of Torin2 inhibitor bound to the <span class="html-italic">Ld</span>TOR2 catalytic cleft of <span class="html-italic">L. donovani</span>. Stick representation of Torin2 (C, red; N, blue; F, green) and of <span class="html-italic">Ld</span>mTOR2 residues within 4 Å (except for Asp<sup>2074</sup> and Asp<sup>2242</sup>). Red-dotted lines indicate atoms within hydrogen-bonding distance. (<b>E</b>) Torkinib-<span class="html-italic">Ld</span>mTOR2 structure, represented as in (<b>D</b>), with stick representation of torkinib.</p>
Full article ">
21 pages, 5037 KiB  
Article
The Rheolaser Master™ and Kinexus Rotational Rheometer® to Evaluate the Influence of Topical Drug Delivery Systems on Rheological Features of Topical Poloxamer Gel
by Maria Chiara Cristiano, Francesca Froiio, Antonia Mancuso, Federica De Gaetano, Cinzia Anna Ventura, Massimo Fresta and Donatella Paolino
Molecules 2020, 25(8), 1979; https://doi.org/10.3390/molecules25081979 - 23 Apr 2020
Cited by 29 | Viewed by 4580
Abstract
Poloxamer 407 copolymer is a versatile and widely used thermo-reversible material. Its use has many advantages, such as bio-adhesion, enhanced solubilization of poorly water-soluble drugs and many applications fields like oral, rectal, topical, nasal drug administration. Hydrogels made up of Poloxamer 407 are [...] Read more.
Poloxamer 407 copolymer is a versatile and widely used thermo-reversible material. Its use has many advantages, such as bio-adhesion, enhanced solubilization of poorly water-soluble drugs and many applications fields like oral, rectal, topical, nasal drug administration. Hydrogels made up of Poloxamer 407 are characterized by specific rheological features, which are affected by temperature, concentration and presence of other compounds. A strategic approach in topical therapeutic treatments may be the inclusion of drug delivery systems, such as ethosomes, transfersomes and niosomes, into hydrogel poloxamer formulation. The evaluation of the interaction between colloidal carriers and the Poloxamer 407 hydrogel network is essential for a suitable design of an innovative topical dosage form. For this reason, the Rheolaser Master™, based on diffusing wave spectroscopy, and a Kinexus Rotational Rheometer were used to evaluate the influence of nanocarriers on the microrheological features of hydrogels. The advantages of the Rheolaser Master™ analyzer are: (i) its ability to determine viscoelastic parameter, without altering or destroying the sample and at rest (zero shear); (ii) possibility of aging analysis on the same sample. This study provide evidence that vesicular systems do not influence the rheological features of the gel, supporting the possibility to encapsulate an innovative system into a three-dimensional network. Full article
(This article belongs to the Special Issue Nanosystems in Pharmaceutical Technology)
Show Figures

Graphical abstract

Graphical abstract
Full article ">Figure 1
<p>Transmission and backscattering profiles of ethosomes (<b>A</b>), transfersomes (<b>B</b>) and niosomes (<b>C</b>) determined by Turbiscan Lab<sup>®</sup> Expert. Various runs were representative of three independent experiments. Data are reported as a function of time (0–1 h) and sample height.</p>
Full article ">Figure 2
<p>Turbiscan Stability Index (TSI) in function of time obtained for ethosomes, transfersomes and niosomes, by using Turbiscan Lab<sup>®</sup> Expert.</p>
Full article ">Figure 3
<p>Mean square displacement MSD of hydrogel prepared with different concentrations of poloxamer 407: 20% (<span class="html-italic">w</span>/<span class="html-italic">w</span>) (<b>A</b>), 25% (<span class="html-italic">w</span>/<span class="html-italic">w</span>) (<b>B</b>) and 30% (<span class="html-italic">w</span>/<span class="html-italic">w</span>) (<b>C</b>), as a function of decorrelation time. The illustrated results were representative of three independent experiments.</p>
Full article ">Figure 4
<p>Elasticity Index (EI) (<b>A</b>) and Solid Liquid Balance (<b>B</b>) profiles versus time for 20% poloxamer 407, 25% poloxamer 407 and 30% poloxamer 407 samples.</p>
Full article ">Figure 5
<p>Mean square displacement of hydrogels made up of poloxamer 407 at 20% (<span class="html-italic">w</span>/<span class="html-italic">w</span>) alone (<b>A</b>) or in the presence of ethosomes (<b>B</b>), transfersomes (<b>C</b>) and niosomes (<b>D</b>) as a function of decorrelation time. The illustrated results were representative of three independent experiments.</p>
Full article ">Figure 6
<p>Elasticity Index (EI) (<b>A</b>) and Solid Liquid Balance profile (<b>B</b>) versus time for 20% poloxamer 407 with and without TDDSs.</p>
Full article ">Figure 7
<p>Flow curves (shear viscosity versus shear rate) of (<b>A</b>) 20% Poloxamer 407, (<b>B</b>) 25% Poloxamer 407 and (<b>C</b>) 30% Poloxamer 407, with and without carriers. The illustrated results were representative of three independent experiments.</p>
Full article ">Figure 8
<p>Complex shear modulus (<span class="html-italic">G*</span>) versus Frequency for 20% Poloxamer 407 (<b>A</b>), 25% Poloxamer 407 (<b>B</b>) and 30% Poloxamer 407 (<b>C</b>) with and without TDDSs. The illustrated results were representative of three independent experiments.</p>
Full article ">Figure 9
<p>In vitro percutaneous permeation of paclitaxel from different formulations through SCE membranes, in comparison with a hydroalcoholic drug solution (as the control). Values represent the mean of three different experiments ± standard deviation.</p>
Full article ">
15 pages, 2066 KiB  
Article
In the Mists of a Fungal Metabolite: An Unexpected Reaction of 2,4,5-Trimethoxyphenylglyoxylic Acid
by Immo Serbian, Anne Loesche, Sven Sommerwerk, Phil Liebing, Dieter Ströhl and René Csuk
Molecules 2020, 25(8), 1978; https://doi.org/10.3390/molecules25081978 - 23 Apr 2020
Viewed by 2415
Abstract
The reactions of phenylglyoxylic acids during the synthesis and biological evaluation of fungal metabolites led to the discovery of hitherto unknown compounds with a p-quinone methide (p-QM) structure. The formation of these p-QMs using 13C-labelled starting materials revealed [...] Read more.
The reactions of phenylglyoxylic acids during the synthesis and biological evaluation of fungal metabolites led to the discovery of hitherto unknown compounds with a p-quinone methide (p-QM) structure. The formation of these p-QMs using 13C-labelled starting materials revealed a key-step of this reaction being a retro-Friedel–Crafts alkylation. Full article
Show Figures

Graphical abstract

Graphical abstract
Full article ">Figure 1
<p>Structure emodine, chrysophanol and daunorubicin isolated from fungi or lichens and <span class="html-italic">p</span>-quinone methide (<span class="html-italic">p</span>-QM) derived natural products rugaurones A–C and cherylline.</p>
Full article ">Figure 2
<p><sup>1</sup>H-NMR Spectra of the intermediate <b>15</b>; temperatures: <b>violet</b>, 40 °C; <b>cyan</b>, 27 °C; <b>green</b>, −30 °C; red, −50 °C.</p>
Full article ">Figure 3
<p>NMR Spectra of the intermediate <b>15</b> in different solvents; CDCl<sub>3</sub> (<b>red</b>), toluene-d<sub>8</sub> (<b>green</b>), DMSO-d<sub>6</sub> (<b>blue</b>) at room temperature.</p>
Full article ">Figure 4
<p>The molecular structure of compound <b>6</b> in the crystal. Displacement ellipsoids of C and O atoms drawn at the 50% probability level, H atoms as spheres of arbitrary size.</p>
Full article ">Figure 5
<p>Intermolecular π interactions in compound <b>6</b>, resulting in a one-dimensional supramolecular structure extending along the crystallographic <span class="html-italic">a</span> axis.</p>
Full article ">Scheme 1
<p>Reactions and conditions: (<b>a</b>) SeO<sub>2</sub>, pyridine, 80 °C, 4 h, 57%; (<b>b</b>) TiCl<sub>4</sub>, ClC(=O)CO<sub>2</sub>Et, DCM, −20 °C, 2 h, 94%; (<b>c</b>) KOH, MeOH, H<sub>2</sub>O, r.t. 99%; (<b>d</b>) AlCl<sub>3</sub>, DCM, microwave, 50 °C, 3 h, 13%; (<b>e</b>) aq. HCl, 40 °C, 3 h, 56%; (<b>f</b>) <b>3</b>, HCl, 40 °C, 4 h, 96%; (<b>g</b>) aq. HCl, 40 °C, 4 h, 49%; (<b>h</b>) Ac<sub>2</sub>O, BF<sub>3</sub><sup>.</sup>Et<sub>2</sub>O, 85 °C, 1 h, 66%; (<b>i</b>) SeO<sub>2</sub>, pyridine, 80 °C, 20 h, 44%; (<b>j</b>) DCM, oxalyl chloride, DMF, r.t. 14 h, 36%; (<b>k</b>) DCM, oxalyl chloride, DMF, 0 °C, 2h, traces.</p>
Full article ">Scheme 2
<p>Reactions and conditions: (<b>a</b>) AcCl, TiCl<sub>4</sub>, DCM, −20 °C, 2 h, 95%; b) SeO<sub>2</sub>, pyridine, 80 °C, 4 h, 53%; (<b>c</b>) aq. HCl, 0 °C, 2 h, 3%; (<b>d</b>) aq. HCl, Δ,2 h, 48%.</p>
Full article ">Scheme 3
<p>Proposed mechanism for the formation of <b>6</b> (TMP = 2,4,5-trimethoxyphenyl; TMB = 1,2,4-trimethoxybenzene).</p>
Full article ">Scheme 4
<p>Reactions and conditions: (<b>a</b>) anisole, HCl, 40 °C, 4 h, 74%; (<b>b</b>) Boc-aniline, HCl, 40 °C, 4 h, 43%; (<b>c</b>) BzCl, NEt<sub>3</sub>, DCM, r.t. 6 h, 69%; (<b>d</b>) Zn/HCl, 0 °C, 4 h, 43%; (<b>e</b>) benzene, HCl, 2 h, 18%.</p>
Full article ">
15 pages, 271 KiB  
Article
Antimicrobial Testing of Schinus molle (L.) Leaf Extracts and Fractions Followed by GC-MS Investigation of Biological Active Fractions
by Giovanni Turchetti, Stefania Garzoli, Valentina Laghezza Masci, Carla Sabia, Ramona Iseppi, Pierluigi Giacomello, Antonio Tiezzi and Elisa Ovidi
Molecules 2020, 25(8), 1977; https://doi.org/10.3390/molecules25081977 - 23 Apr 2020
Cited by 13 | Viewed by 3418
Abstract
Schinus molle (L.) is a dioecious plant of the Anacardiaceae family, originating in South America and currently widespread in many regions throughout the world. In this work leaf extracts and derived low-pressure column chromatography (LPCC) fractions of S. molle L. male and female [...] Read more.
Schinus molle (L.) is a dioecious plant of the Anacardiaceae family, originating in South America and currently widespread in many regions throughout the world. In this work leaf extracts and derived low-pressure column chromatography (LPCC) fractions of S. molle L. male and female plants were investigated for the antimicrobial activity. Leaf extracts were tested on microbes Escherichia coli, Pseudomonas aeruginosa, Staphylococcus aureus, Enterococcus faecalis, Candida albicans and Bacillus subtilis. Furthermore, the extracts showing antimicrobial activity were fractionated by LPCC and the obtained fractions tested on the same microorganism strains. Positive fractions were investigated by gas-chromatography/mass spectrometry (GC-MS) and were seen to be rich in sesquiterpenes, sesquiterpenoids and other terpens. The obtained effects highlighted the antimicrobial properties of S. molle (L.) leaf compounds and revealed their importance as a source of bioactive molecules of potential pharmaceutical interest. To our knowledge, this is the first paper reporting investigations on the chemical composition of the extracts and derived positive fractions from Schinus molle (L.) plants grown in central Italy Full article
23 pages, 4327 KiB  
Article
Tailoring the Properties of Thermo-Compressed Polylactide Films for Food Packaging Applications by Individual and Combined Additions of Lactic Acid Oligomer and Halloysite Nanotubes
by Sandra Rojas-Lema, Luis Quiles-Carrillo, Daniel Garcia-Garcia, Beatriz Melendez-Rodriguez, Rafael Balart and Sergio Torres-Giner
Molecules 2020, 25(8), 1976; https://doi.org/10.3390/molecules25081976 - 23 Apr 2020
Cited by 32 | Viewed by 3995
Abstract
In this work, films of polylactide (PLA) prepared by extrusion and thermo-compression were plasticized with oligomer of lactic acid (OLA) at contents of 5, 10, and 20 wt%. The PLA sample containing 20 wt% of OLA was also reinforced with 3, 6, and [...] Read more.
In this work, films of polylactide (PLA) prepared by extrusion and thermo-compression were plasticized with oligomer of lactic acid (OLA) at contents of 5, 10, and 20 wt%. The PLA sample containing 20 wt% of OLA was also reinforced with 3, 6, and 9 parts per hundred resin (phr) of halloysite nanotubes (HNTs) to increase the mechanical strength and thermal stability of the films. Prior to melt mixing, ultrasound-assisted dispersion of the nanoclays in OLA was carried out at 100 °C to promote the HNTs dispersion in PLA and the resultant films were characterized with the aim to ascertain their potential in food packaging. It was observed that either the individual addition of OLA or combined with 3 phr of HNTs did not significantly affect the optical properties of the PLA films, whereas higher nanoclay contents reduced lightness and induced certain green and blue tonalities. The addition of 20 wt% of OLA increased ductility of the PLA film by nearly 75% and also decreased the glass transition temperature (Tg) by over 18 °C. The incorporation of 3 phr of HNTs into the OLA-containing PLA films delayed thermal degradation by 7 °C and additionally reduced the permeabilities to water and limonene vapors by approximately 8% and 47%, respectively. Interestingly, the highest barrier performance was attained for the unfilled PLA film plasticized with 10 wt% of OLA, which was attributed to a crystallinity increase and an effect of “antiplasticization”. However, loadings of 6 and 9 phr of HNTs resulted in the formation of small aggregates that impaired the performance of the blend films. The here-attained results demonstrates that the properties of ternary systems of PLA/OLA/HNTs can be tuned when the plasticizer and nanofiller contents are carefully chosen and the resultant nanocomposite films can be proposed as a bio-sourced alternative for compostable packaging applications. Full article
(This article belongs to the Special Issue Recent Trends in Active Food Packaging)
Show Figures

Figure 1

Figure 1
<p>Visual aspect of the polylactide (PLA)/oligomer of lactic acid (OLA)/halloysite nanotubes (HNTs) films.</p>
Full article ">Figure 2
<p>Transmission electron microscopy (TEM) images corresponding to (<b>a</b>) individual isolated halloysite nanotube (HNT) and (<b>b</b>) aggregate of HNTs. Images were taken at 52,000× showing scale markers of 100 nm.</p>
Full article ">Figure 3
<p>Field emission scanning electron microscopy (FESEM) images of the fracture surfaces of the polylactide (PLA) films with different weight contents (wt%) of oligomer of lactic acid (OLA): (<b>a</b>) PLA; (<b>b</b>) PLA + 5 wt% OLA; (<b>c</b>) PLA + 10 wt% OLA; (<b>d</b>) PLA + 20 wt% OLA. Images were taken at 2000× showing scale markers of <span class="html-italic">2</span> µm.</p>
Full article ">Figure 4
<p>Field emission scanning electron microscopy (FESEM) images of the fracture surfaces of the polylactide (PLA) films containing 20 wt% of oligomer of lactic acid (OLA) and 6 parts per hundred resin (<span class="html-italic">phr</span>) of halloysite nanotubes (HNTs): (<b>a,b</b>) HNTs were dispersed in OLA by magnetic stirring; (<b>c,d</b>) HNTs were ultrasonicated in OLA at 100 °C. Images on the left were taken at 5000×, while images on the right at 10000×. Scale markers at both magnifications represent 1 µm.</p>
Full article ">Figure 5
<p>Field emission scanning electron microscopy (FESEM) images of the fracture surfaces of the polylactide (PLA) films containing 20 wt% of oligomer of lactic acid (OLA) and different parts per hundred resin (<span class="html-italic">phr</span>) of halloysite nanotubes (HNTs): (<b>a</b>) PLA; (<b>b</b>) PLA + 20 wt% OLA + 3 <span class="html-italic">phr</span> HNTs; (<b>c</b>) PLA + 20 wt% OLA + 6 <span class="html-italic">phr</span> HNTs; (<b>d</b>) PLA + 20 wt% OLA + 9 <span class="html-italic">phr</span> HNTs. Images were taken at 5000× with scale markers of <span class="html-italic">2</span> µm.</p>
Full article ">Figure 6
<p>Differential scanning calorimetry (DSC) thermograms taken during second heating of the polylactide (PLA)/oligomer of lactic acid (OLA)/halloysite nanotubes (HNTs) films.</p>
Full article ">Figure 7
<p>(<b>a</b>) Thermogravimetric analysis (TGA) and (<b>b</b>) first derivate thermogravimetric (DTG) curves of the polylactide (PLA)/oligomer of lactic acid (OLA)/halloysite nanotubes (HNTs) films.</p>
Full article ">Figure 8
<p>Evolution as a function of temperature of the (<b>a</b>) storage modulus and (<b>b</b>) dynamic damping factor (<span class="html-italic">tan δ</span>) of the polylactide (PLA)/oligomer of lactic acid (OLA)/ halloysite nanotubes (HNTs) films.</p>
Full article ">
13 pages, 6105 KiB  
Article
Kinetic Studies on Radical Scavenging Activity of Kaempferol Decreased by Sn(II) Binding
by Zhi-Yin Yang, Ling-Ling Qian, Yi Xu, Meng-Ting Song, Chao Liu, Rui-Min Han, Jian-Ping Zhang and Leif H. Skibsted
Molecules 2020, 25(8), 1975; https://doi.org/10.3390/molecules25081975 - 23 Apr 2020
Cited by 9 | Viewed by 2976
Abstract
Sn(II) binds to kaempferol (HKaem, 3,4′,5,7-tetrahydroxy-2-(4-hydroxyphenyl)-4H-1-benzopyran-4-one) at the 3,4-site forming [Sn(II)(Kaem)2] complex in ethanol. DPPH scavenging efficiency of HKaem is dramatically decreased by SnCl2 coordination due to formation of acid inhibiting deprotonation of HKaem as ligands and [...] Read more.
Sn(II) binds to kaempferol (HKaem, 3,4′,5,7-tetrahydroxy-2-(4-hydroxyphenyl)-4H-1-benzopyran-4-one) at the 3,4-site forming [Sn(II)(Kaem)2] complex in ethanol. DPPH scavenging efficiency of HKaem is dramatically decreased by SnCl2 coordination due to formation of acid inhibiting deprotonation of HKaem as ligands and thus reduces the radical scavenging activity of the complex via a sequential proton-loss electron transfer (SPLET) mechanism. Moderate decreases in the radical scavenging of HKaem are observed by Sn(CH3COO)2 coordination and by contact between Sn and HKaem, in agreement with the increase in the oxidation potential of the complex compared to HKaem, leading to a decrease in antioxidant efficiency for fruits and vegetables with Sn as package materials. Full article
Show Figures

Figure 1

Figure 1
<p>Slow reaction of tin chloride (SnCl<sub>2</sub>) with HHHHhhKaem and no reaction of SnCl<sub>2</sub> with apigenin (HApi). (<b>a</b>) Absorption spectra of 50 µM SnCl<sub>2</sub> and 50 µM kaempferol (HKaem) in ethanol measured every 30 s for total time of 30 min. (<b>b</b>) Time evolutions at 433 and 366 nm from <a href="#molecules-25-01975-f001" class="html-fig">Figure 1</a>a corresponding to the transformation of HKaem into the [Sn(II)(Kaem)<sub>2</sub>] complex. (<b>c</b>) Absorption spectra of 50 µM HApi and solutions of 50 µM HApi and 50 µM SnCl<sub>2</sub> in ethanol at 30 min and 24 h after mixing.</p>
Full article ">Figure 2
<p>Determination of the Sn:Kaem ratio. (<b>a</b>) Absorption spectra of 50 µM HKaem, 50 µM SnCl<sub>2</sub>, and solutions of 50 µM HKaem addition of SnCl<sub>2</sub> in varying ratio (1:0.2–1:5) in ethanol. (<b>b</b>) Job’s plots of absorbance at 430 nm obtained by mixing solutions of HKaem and SnCl<sub>2</sub> with total concentration of 50 μM in HKaem:Sn(II) molar ratios varying from 9:1 to 1:9.</p>
Full article ">Figure 3
<p>Mass spectra of solutions of 100 μM HKaem with 50 μM SnCl<sub>2</sub> in methanol.</p>
Full article ">Figure 4
<p>Effects of addition of water, acid, and base on the stability of the [Sn(II)(Kaem)<sub>2</sub>] complex. Absorption spectra of solution of 50 µM HKaem and 50 µM SnCl<sub>2</sub> measured (<b>a</b>) in water:ethanol = 1:1, <span class="html-italic">v</span>/<span class="html-italic">v</span>, and in ethanol by addition of (<b>b</b>) 50, 500, and 5000 µM hydrochloric acid and (<b>c</b>) 1 mM sodium hydroxide. Absorption spectra of 50 µM HKaem alone under the same conditions is indicated by a dashed line for comparison.</p>
Full article ">Figure 5
<p>Time evolution of absorbance at 517 nm for 100 μM 2,2-diphenyl-1-picrylhydrazyl (DPPH<sup>•</sup>) scavenged by (<b>a</b>) 25, 50, 100, and 250 μM HKaem; (<b>b</b>) 100 μM HKaem, 100 μM SnCl<sub>2</sub>, and solutions of 100 μM HKaem with 2, 4, 6, 8, 10, 100, and 1000 μM SnCl<sub>2</sub>; and (<b>c</b>) 100 μM HKaem, and solutions of 100 μM HKaem with 100 and 200 μM Sn(OAc)<sub>2</sub> in ethanol. The samples of DPPH<sup>•</sup> alone and solutions of DPPH<sup>•</sup> with SnCl<sub>2</sub> and Sn(OAc)<sub>2</sub> are shown for comparison. Ethanol was used as the solvent.</p>
Full article ">Figure 6
<p>Absorption spectra in ethanol of 50 µM HKaem alone, 50 µM HKaem plus 50 µM Sn(OAc)<sub>2</sub>, 50 µM HKaem plus 50 µM SnCl<sub>2</sub>, and the linear combination of spectra of 50 µM HKaem plus 50 µM Sn(OAc)<sub>2</sub>, S<sub>Kaem + Sn(OAc)2</sub>, using spectrum of HKaem alone, <span class="html-italic">S<sub>Kaem</sub></span>, and spectrum of 50 µM HKaem plus 50 µM SnCl<sub>2</sub>, <span class="html-italic">S<sub>Kaem+SnCl</sub></span><sub>2</sub> giving the relationship of 0.59<span class="html-italic">S<sub>Kaem</sub></span> + 0.20<span class="html-italic">S<sub>Kaem+SnCl</sub></span><sub>2.</sub></p>
Full article ">Figure 7
<p>Absorption spectra of 100 µM DPPH<sup>•</sup>, 100 µM DPPH<sup>•</sup> plus 100 µM HKaem, 100 µM DPPH<sup>•</sup> plus 100 µM SnCl<sub>2</sub>/Sn(OAc)<sub>2</sub>, and 100 µM DPPH<sup>•</sup> plus 100 µM HKaem + 100 µM SnCl<sub>2</sub>/Sn(OAc)<sub>2</sub>. Ethanol was used as the solvent.</p>
Full article ">Figure 8
<p>Time evolution of absorbance at 517 nm for 50 μM DPPH<sup>•</sup> scavenged by 100 μM HKaem in ethanol stored for 48 h in glass vessel and in a Sn can.</p>
Full article ">Figure 9
<p>Cyclic voltammograms of 100 μM HKaem alone and (<b>a</b>) 100 μM SnCl<sub>2</sub> and solutions of 100 μM HKaem with 10, 50, 100, and 200 μM SnCl<sub>2</sub>, and (<b>b</b>) 100 μM Sn(OAc)<sub>2</sub> and solutions of 100 μM HKaem plus 100 μM Sn(OAc)<sub>2</sub>. All samples were in ethanol relative to 50 μM ferrocene with 0.1 M sodium perchlorate, NaClO<sub>4</sub>.</p>
Full article ">Scheme 1
<p>Molecular structures of (<b>a</b>) HKaem, (<b>b</b>) HApi and (<b>c</b>) proposed structure of the complex [Sn(II)(Kaem)<sub>2</sub>(EtOH)] complex.</p>
Full article ">
Previous Issue
Next Issue
Back to TopTop