J. Zool., Lond. (2005) 267, 9–18
�
C 2005 The Zoological Society of London
Printed in the United Kingdom
doi:10.1017/S0952836905007119
Identification of individual tigers (Panthera tigris)
from their pugmarks
Sandeep Sharma†, Yadvendradev Jhala* and Vishwas B. Sawarkar
Wildlife Institute of India, P.B. No. 18, Chandrabani, Dehradun, Uttaranchal 248001, India
(Accepted 20 January 2005)
Abstract
An objective multivariate technique is described for identification of individual tigers Panthera tigris from their
pugmarks. Tracings and photographs of hind pugmarks were obtained from 23 pugmark-sets of 19 individually
known tigers (17 wild and two captive tigers). These 23 pugmark-sets were then divided into two groups, one of
15 pugmark-sets for model building and another of eight pugmark-sets for model testing and validation. A total of
93 measurements were taken from each pugmark along with three gait measurements. We used CV ratio, F-ratio
and removed highly correlated variables to finally select 11 variables from these 93 variables. These 11 variables
did not differ between left and right pugmarks. Stepwise discriminant function analysis (DFA) based on these
11 variables correctly classified pugmark-sets to individual tigers. A realistic population estimation exercise was
simulated using the validation dataset. The algorithms developed here correctly allocated each pugmark-set to the
correct individual tiger. The effect of extraneous factors, i.e. soil depth and multiple tracers, was also tested and
pugmark tracings compared with pugmark photographs. We recommend collecting pugmarks from soil depths
ranging between 0.5 and 1.0 cm, and advocate the use of pugmark photographs rather than pugmark tracings to
eliminate the chance of obtaining substandard data from untrained tracers. Our study suggests that tigers can be
individually identified from their pugmarks with a high level of accuracy and pugmark-sets could be used for
population estimation of tigers within a statistically designed mark–recapture framework.
Key words: footprints, individual identification, multivariate analysis, Panthera tigris, pugmark, spoor, tiger, tracks
INTRODUCTION
The estimation of number of individuals of a species in
a population is a key question in the field of ecology
and wildlife conservation (Caughley, 1977; Seber, 1992).
Population estimates of any species are required for
formulation of a conservation strategy, prioritization and
allocation of resources, as well as for evaluating the success of conservation programmes, and also for political
reasons (Nowell & Jackson, 1996; Karanth, 2003).
The tiger Panthera tigris is considered an icon for
conservation in all ecosystems wherever it occurs.
Owing to its endangered, umbrella and flagship status,
accurate and reliable population estimates are critical for
implementation and assessment of conservation measures
and management practices (Nowell & Jackson, 1996).
Population estimation of tigers, like that of other felids
is difficult owing to their low densities, territoriality,
*All correspondence to: Y. V. Jhala
E-mail: jhalay@wii.gov.in
† Current address: C-14/59, Rishinagar, Ujjain (MP) 456010, India.
E-mail: san_cobra@rediffmail.com
nocturnal and cryptic behaviour (Bertram, 1979;
Karanth & Nichols, 1998, 2000).
Currently three methods are being used for population
monitoring of tigers:
(1) total count based on expert identification of individual
tiger pugmarks in India (Panwar, 1979a; Choudhury,
1970, 1972; Karanth et al., 2003) Nepal (McDougal,
1977, 1999) and Bangladesh;
(2) indices of snow track encounter rates calibrated to
tiger densities used in the Russian Far East (Miquelle
et al., 1996; Hayward et al., 2002);
(3) mark–recapture population estimates based on
photographs of tigers obtained using camera-traps in a
few selected tiger reserves (Karanth & Nichols, 2000;
Kawanishi & Sunquist, 2004).
Of the above methods, the camera trap technique using
the mark–recapture framework is statistically the most
robust. For estimating the population of any endangered
species, however, it is essential that the estimates are
accurate as well as precise. Population estimates of tigers
based on mark–recapture using camera traps suffer from
problems such as high cost of equipment, risk of camera
theft and low precision of density estimates especially
in areas of low tiger density (Karanth & Nichols, 2000)
�10
S. SHARMA, Y. JHALA AND V. B. SAWARKAR
because the technique relies on sampling tigers at only a
few predetermined locations where camera traps are set.
Use of tracks for identifying individual animals
Attempts have been made to identify individuals of a species based on information from their tracks. Researchers
and field managers could distinguish between individual
mountain lions Felis concolor by using deformations
and gross differences in size and shapes (Currier, Sheriff &
Russel, 1977; Kutilek et al., 1983; Fitzhugh & Gorenzel,
1985; Van Dyke, Brocke & Shaw, 1986), by one or more
track measurements (Koford, 1976; Currier et al., 1977;
Fitzhugh & Gorenzel, 1985; Smallwood & Fitzhugh,
1993; Grigione et al., 1999; Lewison, Fitzhugh &
Galentine, 2001; Fitzhugh, Lewison & Galentine, 2000),
in combination with radio-telemetry locations and distances between track sets (Currier et al., 1977; Shaw, 1983;
Fitzhugh & Gorenzel, 1985; Van Dyke et al., 1986; Neal,
Steger& Bertram, 1987), and by morphometric analysis
of pad shape (Grigione & Burman, 2000). Successful
attempts have also been made in identifying individuals
of other species from their tracks, e.g. Asian rhinos
(Strickland, 1967; Schenkel & Schenkel-Hulliger, 1969;
Kurt, 1970; Borner, 1970; Flynn & Abdullah, 1983;
Van Strien, 1985), black rhino Diceros bicornis (Jewell,
Alibhai & Law, 2001), mountain tapir Tapirus pinchaque
(Lizcano & Cavelier, 2000), pine marten Martes martes
(Zalewski, 1999), snow leopard Uncia uncia (Riordan,
1998), and jaguar Panthera onca (M. Aranda & C. Miller,
pers. comm.).
Tracking tigers for hunting was a tradition among Indian
hunters, which flourished under royal patronage (Sankhla,
1978; L. A. K. Singh, 1999). Champion (1929) and
Brander (1930) were the first to describe characteristics
of tiger pugmarks. It was claimed that sex, age, physical
condition and also the individual identity of a tiger could
be determined from its tracks (Corbett, 1944; Abramov,
1961; Choudhury, 1970, 1971, 1972; Sankhla, 1978;
Panwar, 1979a,b; Jayarajan, 1983a,b; Sawarkar, 1987;
Basappanavar, 1988; Gogate et al., 1989; Rishi, 1997;
L. A. K. Singh, 1999).
Use of pugmarks for monitoring tiger populations
The first attempt to enumerate tigers from their pugmarks
was made by W. J. Nicholson of Imperial Forest Service in
Palamau district, Bihar in 1934, which gave him a figure
of 32 tigers for an area of 299 km2 (Jayarajan, 1983a).
A systematic methodological approach for recording
pugmarks for individual tiger identification and their
census was formally conceptualized and advocated by
S. R. Choudhury (1970, 1971). He introduced the ‘tiger
tracer’ and developed the methodology for a census of
pugmarks. This method was again fine-tuned by Panwar
(1979a), Sawarkar (1987) and Singh (1999). The basic
premise of the method is that experienced persons can
identify each individual tiger from their pugmark tracing
(Panwar, 1979a,b; Sale & Berkmuller, 1988; Sharma,
2001). McDougal (1977, 1999) also identified a few
resident individual tigers from their pugmarks in Chitwan
National Park, Nepal.
The reliability of the pugmark census technique has
often been questioned owing to its subjectivity and lack
of validation on populations of known free-ranging tigers
(Schaller, 1967; A. Singh, 1972, 1984; S. D. Ripley quoted
in Sankhla, 1978: 190–191; Karanth, 1987, 1993, 1995,
1999, 2003; Karanth & Nichols, 2000; Karanth et al.,
2003). Critics of the technique believed that an individual
tiger’s pugmark changes in shape and size over different
substrate (soil texture, moisture and depth). Another
source of variability is the variation between different
tracers’ abilities to trace the features of the pugmark on
the tracing sheet (Karanth, 1987).
The currently used technique of tiger population
estimation based on pugmarks is believed to have the
following drawbacks (Karanth et al., 2003):
(1) poor data quality: pugmark tracings and plaster
casts obtained by several field personnel are often
inconsistent and of poor quality;
(2) individual tigers are believed to be identifiable from
these substandard data by supervisory officials;
(3) the method assumes total enumeration of tigers by
obtaining pugmarks of all tigers that are subsequently
identified to individuals.
Attempts have been made to quantitatively and
objectively assess the individual identification of tigers
based on pugmarks (Gogate et al., 1989; Gore et al., 1993;
Das & Sanyal, 1995; Riordan, 1998). These studies suggest that pugmarks do possess quantifiable information
that could permit individual identification. Owing to the
limitations of experimental design and the lack of an
appropriate sample size of pugmark data from known
tigers, however, these studies were not conclusive. Recent
more definitive studies on the tracks of mountain lions
(Smallwood & Fitzhugh, 1993; Grigione et al., 1999;
Lewison et al., 2001), black rhinos (Jewell et al., 2001),
mountain tapirs (Lizcano & Cavelier, 2000), snow leopards and tigers (Riordan, 1998), jaguars (C. Miller, pers.
comm.) and pine martens (Zalewski,1999) used a quantitative approach for discriminating amongst individuals on
the basis of a group of track sets.
In the present study, an objective approach is proposed
for identifying individual tigers from their pugmark-sets
that has potential for use in population estimation and
monitoring. A multivariate model is developed based on
nine variables from tiger pugmarks and two gait variables
using discriminant function analysis (DFA) that permits
individual identification of tigers. Once the individual
identity of a tiger is ascertained, we propose to use
this information in a mark–recapture framework (Pollock
et al., 1990) for population estimation and monitoring.
STUDY AREA AND STUDY DESIGN
To achieve the objective of this study, sets of tiger pugmarks with reasonable replicates from definitively known
�Identifying individual tigers
11
Table 1. Details of the pugmark-sets collected from individually known tigers Panthera tigris from different study areas between November
2000 and April 2001
1
2
3
4
5
Keoladeo National Park, Rajasthan
3
Ranthabhore Tiger Reserve, Rajasthan
8
Kanha Tiger Reserve, Madhya Pradesh
7
Bandhavgarh Tiger Reserve, Madhya Pradesh 2
National Zoological Garden, New Delhi
6
Total
26
individual tigers were needed. This was achieved by sampling sets of tiger pugmarks from different tiger reserves
and zoos in India (Table 1). Tracings or photographs of
right and/or left hind pugmarks from a pugmark-set was
collected if > 5 pugmark replicates of the same known
tiger were found from a fresh pugmark trail. We ensured
that individual pugmark-sets that were sampled within a
tiger reserve were from different tigers, primarily by direct
sighting of tigers (n = 10 tigers). In the few cases where
pugmark-sets were separated by distances > 50 km and
formed within the past 12 h, they were considered to be
from two different tigers. Most of the pugmark-sets were
collected from a long series of pugmarks, where the tiger
had walked in normal gait. The gait was judged as normal
after examining the pugmark trail for consistency in stride
length and pattern of foot-fall (Sawarkar, 1987).
Pugmarks from well-beaten dirt roads having a finely
pulverized soil depth of 0.5–1.0 cm, over flat terrain were
traced on acetate sheets using indelible ink pen following
the standard pugmark tracing technique (Choudhury,
1971; Panwar, 1979a; Fjelline & Mansfield, 1989;
Sharma, Jhala & Sawarkar, 2003). Pugmarks were also
photographed from a fixed height using a pugmark-photography stand (Sharma et al., 2003). Five to 10 samples
of gait variables, i.e. stride, straddle and step, were also
measured for each pugmark-set recorded (L. A. K. Singh,
1999; Zielinski & Kucera, 1995) (Fig. 1).
1
8
6
2
2
19
22
80
78
16
33
229
1
2
3
7 (6–10)
10 (8–12)
11 (10–14)
8 (6–10)
11 (8–12)
10 (6–14)
1
5
3
1
2
12
4
10
5
11
6
7
8
Stride
Site
no. Study site
Average no. of
No. of
No. of individual
No. of
pugmarks per
No. of pugmark
pugmark-sets tigers represented
pugmarks track-set (range photo-sets of
collected
by the pugmark-set collected of pugmarks)
individual tigers
Straddle
9
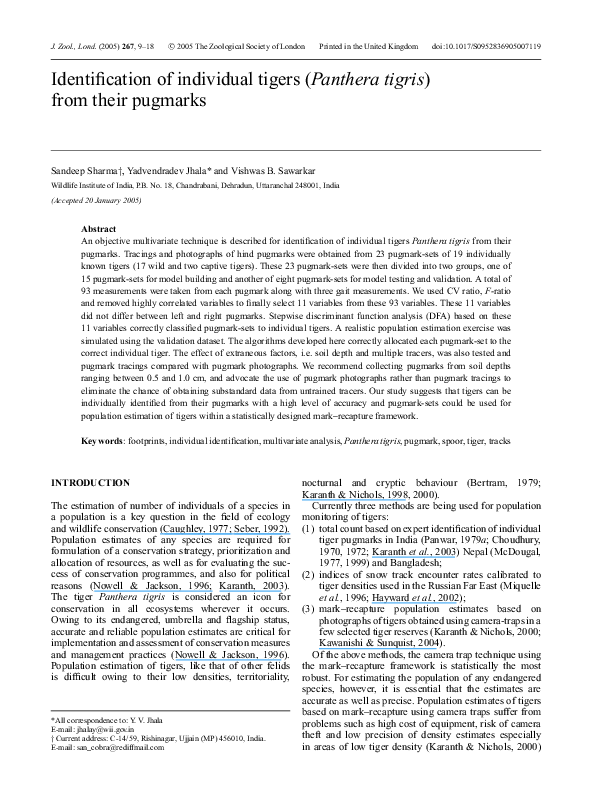
Fig. 1. Eleven final predictor variables used in the analysis of tiger
Panthera tigris pugmarks and gait: nine measurements were taken
from the pugmark while the remaining two measurements were gait
measurements taken from the field. 1, Area of toe no.3 (AT3); 2,
length of minor axis of toe no. 3 (MiT3); 3, distance between toe
no. 2 and toe no. 3 (DT2T3); 4, length of minor axis of toe no. 2
(LT’2); 5, distance between main pad top to toe base-line (H); 6,
angle between toe no. 2 and toe no. 3 (QT2T3); 7, heel to lead toe
length (HLTL); 8, distance between notch 1 and notch 2 (DN1N2);
9, width of the pugmark (Wpg); 10, stride; 11, straddle.
Assessing tracer’s variability and substratum effect
Image analysis of pugmark tracings and photographs
The major sources of variability likely to influence
individual identification from pugmarks were:
(1) the variability in pugmark shape and size due to soil
depth;
(2) variability associated with the different tracers and
their tracing skills.
Pugmark-sets of a known solitary tigress in Keoladeo
National Park, Bharatpur (Rajasthan) were traced and
photographed at 3 different soil depths of < 0.5 cm, 0.5–
1 cm and 2 cm, respectively, over 3 days.
To address the issue of multiple tracers’ variability, 3 of
us (SS, YVJ, VBS) traced the same 28 pugmarks from the
pugmark-sets of 1 male and 1 female tiger at the National
Zoological Garden, New Delhi.
The pugmark tracings and photographs were scanned
using a flatbed scanner to convert them to digital images
for further analysis. A 5-cm line was introduced in every
tracing during the scanning for calibrating various measurements obtained from the pugmark. Assignment of centroids and morphometric measurements were obtained
using Arc Info 8.0.2 (Environmental Systems Research
Institute Inc., Redlands, CA, U.S.A.), Arc View 3 (Environmental Systems Research Institute Inc., Redlands, CA,
U.S.A.) and Sigma Scan Pro 4 (SPSS Inc.) software.
A total of 93 measurements that were likely to cover
most aspects of the geometry of a pugmark were measured
from left and from right pugmarks of the hind feet. The
reason for measuring a large number of variables was
�12
S. SHARMA, Y. JHALA AND V. B. SAWARKAR
to extract the maximum possible information from the
pugmark and to determine which measurements probably
had the maximum discriminating power between tigers.
Many of the same variables that earlier studies (Gogate
et al., 1989; Gore et al., 1993; Das & Sanyal, 1995)
had identified as being useful were used. Out of the 93
variables measured, 47 were linear, 7 were area, 11 were
angle, 18 were ratio and 10 were shape variables.
Comparison of tracings and photographs
of the pugmark
To assess the use of pugmark photographs in place of
pugmark tracings, photographs and tracings were taken of
3 different pugmark-sets and then statistical comparisons
performed.
Statistical methods
of different tigers. Such variables would have better ability
to discriminate between different tigers.
Although the left and right pugmarks of the same tiger
were not mirror images of each other, it seemed probable
that some of the variables measured were similar between
the left and right hindfoot. If some of these variables of the
left and right pugmark could be pooled for the analysis,
then the number of variables in the model would be reduced thereby giving a more parsimonious model. Simultaneously the sample size of pugmarks in a pugmark-set
would increase (left and right together) thereby increasing
the discriminating power of the model (Johnson &
Wichern, 1992). The variables selected by the maximum
CV, and F-ratios were paired for left and right pugmarks
of the same pugmark-set and tested by a paired t-test (Zar,
1984). Pearson’s correlation coefficients were computed
for those variables that were not statistically different
between left and right pugmarks of the same tiger. Only
one of a pair of highly correlated variables (r > 0.8,
P < 0.05) was selected for further analysis.
The 23 pugmark-sets were divided into 2 groups, set 1
(n = 15 pugmark-sets) for variable selection and model
building and set 2 (n = 8 pugmark-sets) for model testing
and validation. SPSS 8.0 (SPSS Inc.) was used for all statistical analysis. Since variables were of different scales,
all were converted to their Z-scores before subjecting
them to further statistical analysis (Zar, 1984).
Ability to discriminate individual tigers
Variable selection
Validation of model for individual discrimination of tigers
by pugmark-sets
The objective of this exercise was to reduce the data
dimensionality, so as to achieve maximum discrimination
with a parsimonious model containing few robust
variables. We used the coefficient of variation (CV)
ratio method and the F-ratio method as criteria to select
variables.
In the CV ratio method, the coefficient of variation
(CV) for each measured variable of a pugmark-set was
computed for individual tigers (CVt ). A grand coefficient
of variation (CVg ) was computed for the same variable
from all pugmark-sets of set 1 (tigers). CVg was then
divided by the CVt for each variable to get CV ratio
(CVr = CVg /CVt ). This procedure was repeated for all
variables. A large value of CVr denotes that a particular
variable has small variation within pugmark-sets relative
to between the pugmark-sets (tigers). Such variables
would have a greater capability to discriminate between
individual tigers.
For the F-ratio method, the following were computed
for each variable: (1) the sum of squared deviations of
individual variables from their mean for each pugmark-set
(Sw2); (2) the sum of squared deviations of group averages
of each variable of each pugmark-set from the grand mean
obtained from all pugmark-sets (Sb2 ). The F-ratio is Sb2 /Sw2
(Zar, 1984). A large value of F-ratio for a particular
variable suggests that it is fairly consistent within the
same pugmark-set but differs between the pugmark-sets
Multiple group stepwise DFA was used for discriminating
between individual pugmark-sets (tigers). The smallest
F-ratio method with a probability of 0.05 for variable
entry and 0.1 probability for variable removal from the
model was selected.
The model was validated by using the variables selected
above in a predictive DFA to correctly assign unknown
pugmark-sets to individually known tigers (Williams,
1983; Johnson & Wichern, 1992). For predictive DFA,
each pugmark-set (set 1 and 2, n = 23 pugmark-sets) of
19 tigers was divided into 2 halves, by randomly picking
50% of the pugmarks from all pugmark-sets. The first
half of this dataset was used as the training dataset to
develop discriminant functions. The remaining dataset of
pugmarks was used as a test set. Class assignment pattern
for each pugmark to their respective pugmark-set was
examined.
Since the entire pugmark-set (a series of continuous
pugmarks made by the same tiger) and not a single pugmark implies the identity of a tiger, it was the accuracy
of correct classification of the pugmark-sets and not
the individual pugmark, which were of relevance. The
decision rule for correct classification of a pugmark-set
was devised based on the correct classification of > 50%
of pugmarks of that test set to the correct training
pugmark-set (tiger). Considering a rare event, when 50%
of the test set of pugmarks was classified into 2 or more
training sets, then the training set which had the larger
average probability of classification of pugmarks from the
test set was considered to be the group assigned by the
model.
�Identifying individual tigers
13
This exercise was repeated 5 times by randomly
assigning 50% of the pugmarks from each pugmark-set
as the training set and the remaining as a prediction or
test set.
were classified as a distinct group. If, however, some of
the pugmarks of the pugmark-set were classified into 2 or
more groups, then the probability of group assignment for
each pugmark into those groups was examined.
Estimating the sample size of pugmarks in a pugmark-set
for accurate identification
Assessing effect of soil depth, multiple tracers and
comparison between pugmark photographs and tracings
To estimate the number of pugmarks in a pugmark-set that
would be needed to accurately predict the identity of an
individual tiger; a dataset of 10 tigers was used that had a
minimum of 10 pugmarks each in their pugmark-sets. An
attempt was made to discriminate between these tigers by
starting with 2 pugmarks in each pugmark-set and then
incrementing the pugmark-set by 2 pugmarks for each
run of predictive DFA. The average per cent accuracy of
individual identification vs the number of pugmarks in a
pugmark-set was plotted.
DFA was used to discriminate between pugmark-sets of
5 tigers whose pugmark size was similar to that of the
tiger whose pugmark-sets were traced from soil depths
of < 0.5, 0.5–1.0, and 2 cm (comparison of 8 pugmarksets).
DFA was used to compare the classification of pugmarksets from tracings and photographs of the same pugmarksets. Six pugmark-sets of 2 known tigers traced by 3 different tracers were compared with pugmark tracings of
5 other tigers (comparison of 11 pugmark-sets) by DFA.
Tiger population estimation exercise
RESULTS
In the previous exercise, the actual number of tigers was
known a priori and the model was tested to predict the
correct grouping of each pugmark-set to individual tigers.
In a field population estimation exercise, however, several
pugmark-sets could be recorded without knowing the
identity of the tiger. An analytical technique needs to be
developed that permits recognition of a set of pugmarks
as belonging to a ‘new’ tiger or assigning the pugmark-set
to a tiger whose pugmarks have been recorded earlier.
In a typical field situation it is probable that multiple
pugmark-sets of the same tiger from different locations are
obtained.
To address this problem, a population of pugmark-sets
of 15 known tigers (set 1, n of pugmarks in pugmark-sets
were 6–10) and 8 pugmark-sets (set 2, n of pugmarks in
pugmark-sets were 10–14) from tigers whose identity
needed to be ascertained was used. The 8 pugmark-sets
(set 2) represented 4 new tigers and 2 pugmark-sets of
tigers that were already present in the population of the 15
known tigers. Our model (built from set 1) was tested to
see if it could correctly classify these 8 pugmark-sets to
the already known individuals and identify the new tigers
as additional to the simulated population to predict the
correct number of tigers represented by these 23 pugmarksets.
Each of the 8 new pugmark-sets was entered in the
model for discrimination 1 at a time. Half of the data of
each new pugmark-set was randomly split into 2 groups.
One of the groups was given the identity of the pugmarkset (training set) and the other left unassigned to any
group (test set). This data (new pugmark-set along with
15 known tiger pugmark-sets) was then analysed using
variables selected by the earlier model developed from
set 1 with DFA. The predicted group membership and
probability of group assignment was examined for the
new pugmark-set. The pugmark-set was considered as a
new tiger where all the pugmarks of an entire pugmark-set
Variable selection
By using a combination of maximum CV ratio and maximum F-ratio, 33 variables were selected out of the 96
variables, that maximized information from a tiger’s pugmark for discriminating between individuals. Variables
that differed between left and right hind pugmarks (paired
t-test, P < 0.05) were removed from further analysis. After
removing one of a pair of highly correlated variables
(r > 0.8, P < 0.05) from the remaining variables, 11 variables were left, which were used as predictor variables in
the stepwise DFA (Fig. 1). All of the 11 variables were
found to contribute significantly to the discriminant
functions which correctly classified all 15 pugmark-sets
to individual tigers.
Model validation
In all the five test runs of the model validation, the test
dataset was correctly classified to the individual tiger. DFA
analysis of the entire dataset (19 tigers, set 1 and 2) gave 11
significant (P < 0.05) standardized canonical discriminant
functions that correctly discriminated between tigers
(Table 2). Pugmarks from most of the pugmark-sets had
a high probability of correct classification. The average
probability of correct classification of pugmarks to the
correct pugmark-set was 0.92 (SD 0.083).
Variability owing to substratum and multiple tracers
The pugmark-sets of the same tiger taken from two different soil depths (< 0.5 cm and 2 cm) showed a wide dispersion and mixing with pugmark-sets from other tigers.
However, the pugmark-set of the same tiger from a soil
depth of 0.5 to 1.0 cm formed a distinct cluster (Fig. 2).
�14
S. SHARMA, Y. JHALA AND V. B. SAWARKAR
6
4
Group Centroids
Pugmark set 3
(Soil depth <0.5 cm)
2
Pugmark set 2
(Soil depth 2 cm)
Same
tiger
Pugmark set 1
(Soil depth 0.5-1cm)
0
Pugmark set 8
Pugmark set 7
Function 2
-2
Pugmark set 6
Pugmark set 5
-4
Pugmark set 4
-8
-6
-4
-2
0
2
4
6
Function 1
Fig. 2. Group centroids and pugmark clusters of eight tiger Panthera tigris pugmark-sets on canonical function axis, using 11 variables.
Pugmark-sets no. 1, 2, and 3 are of the same tiger traced from three different soil depths (< 0.5, 0.5−1.0 and 2 cm). Pugmarks of
pugmark-set 3 forms a single cluster, whereas pugmarks from pugmark-set 1 and 2 are intermixed and dispersed in canonical space. The
remaining five pugmark-sets (pugmark set nos 1, 2, 3, 4 and 5) are different tigers forming distinct clusters.
Table 2. The discriminant function model coefficients and relevant
statistics for the significant (P < 0.01) canonical functions
explaining > 95% of variation for a population of 19 known tigers
Panthera tigris
Functions
Variables
1
2
3
4
5
AT3
MiT3
D23
LT’2
H
QT2T3
HLTL
DN1N2
Wpg
Stride
Straddle
Eigen value
% of variance
Cumulative %
Wilks’ lambda
0.321
−0.232
−0.222
0.221
0.375
−0.002
−0.338
0.192
0.289
0.373
0.788
18.68
51.94
51.94
0
0.003
0.211
0.037
0.145
0.213
−0.251
0.012
0.209
−0.134
0.917
−0.579
10.36
28.82
80.76
0
0.692
−0.433
0.728
−0.315
0.339
0.178
0.187
0.179
−0.145
−0.299
−0.148
2.18
6.05
86.81
0.01
−0.318
−0.117
0.548
0.398
−0.501
0.369
0.144
−0.096
−0.672
0.238
0.277
1.81
5.03
91.84
0.04
0.325
−0.007
−0.546
0.451
−0.658
0.321
0.359
0.114
0.241
−0.235
−0.05
1.33
3.69
95.53
0.12
Variability between pugmark tracing and pugmark
photos
The results of this analysis showed that DFA could
not differentiate between tracings and photographs of
pugmarks. On examining the classification table, it was
found that pugmark tracings and pugmark photographs
for the same tiger were classified as a single group.
Sample size of pugmarks in a pugmark-set
Accuracy of pugmark classification to the correct pugmark-set increased as sample size of pugmarks in the
pugmark-set increased (Fig. 4). A sample of 10 pugmarks
per pugmark-set (n = 10) gave an average accuracy of
96.2% (SE 7.9) of correct classification of pugmarks to
the correct tiger (pugmark-set), while using 12 pugmarks
per pugmark-set gave 100% classification accuracy for a
sample of four pugmark-sets.
Population estimation exercise
The DFA correctly classified 11 pugmark-sets belonging to seven different tigers where six pugmark-sets from
two known tigers were traced by three different observers
(one set per tiger by each observer) (Fig. 3).
After considering the predicted group memberships and
the probabilities of group classification, all eight pugmarksets (six sets representing four new tigers and two sets
�Identifying individual tigers
15
20
Group centroids
Tracer 3
Tracer 2
Tiger 2
10
Tracer 1
Tracer 3
Tracer 2
Tiger 1
Tracer 1
0
Tiger 5
Tiger 4
Function 2
Tiger 3
Tiger 2
-10
Tiger 1
-20
-10
0
10
20
Function 1
Fig. 3. Group centroids and pugmark clusters of 11 pugmark-sets of 7 different tigers Panthera tigris on canonical function axis, using
11 variables. Three different observers traced six pugmark-sets of two different tigers. These are seen forming two distinct clusters here
ascertaining that those six pugmark-sets belong to two distinct tigers. The other five clusters represent five different tigers.
a pugmark-set that entered the model belonged to an
already existing tiger within the dataset, however, there
was intermixing of the test-set pugmarks with the training
set and with the pugmark-set of the same tiger in set 1. The
average sum of probabilities of intermixing of pugmarks
belonging to the same tiger but from different pugmarksets was 0.713 (SE 0.072 with a 95% lower bound of 0.64).
% Classification accuracy
100
90
80
70
60
DISCUSSION, CONCLUSIONS AND MANAGEMENT
IMPLICATIONS
50
40
2
4
6
8
10
12
Pugmarks/pugmark set
Fig. 4. Sample size estimation of the number of Panthera tigris
pugmarks needed in a pugmark-set for accurate classification. Error
bars are standard errors.
belonging to already existing tigers within the simulated
pugmark-set population) were correctly classified either
as new tigers or as belonging to the already existing tigers
(represented by the 15 known tiger pugmark-sets). When
the newly entered pugmark-set belonged to a new tiger,
the classification was unambiguous in our dataset. When
Our dataset, though limited to 23 pugmark-sets of
19 tigers, strongly suggests the potential of using pugmark and gait variables for identifying individual tigers.
Individual identification would be the first step for population estimation and monitoring. Total counts of tigers
based on this method may only be feasible in very small
reserves with a few tigers. In an average tiger reserve with
even a moderate density of tigers, however, total counts
would be difficult to obtain (Karanth, 2003; Karanth et al.,
2003). Models based on a mark–recapture framework
(Pollock et al., 1990) could provide population estimates
when coupled with identifying individual tigers from their
pugmark-sets.
In most tiger reserves in central and western India,
conditions are conducive for obtaining good data on pugmark-sets. Sampling pugmark-sets has several advantages
�16
S. SHARMA, Y. JHALA AND V. B. SAWARKAR
compared to sighting–resighting based on camera traps,
which is limited to predetermined sites and therefore needs
much more effort in achieving required sample sizes for
precise estimates of abundance, especially in areas of low
tiger densities (Karanth, 1999; Carbone et al., 2001). In
contrast, owing to the tiger’s habit of using trails, obtaining
pugmark-sets is relatively easy. Sufficient samples of
pugmark-sets could be obtained even from low-density
areas by intensive search.
A prerequisite for the currently available mark–recapture models is that the identity of a captured animal
is known with certainty. Within our limited dataset, this
level of accuracy of identifying each tiger uniquely from
its pugmark-sets was achieved. This may not, however, be
possible for all pugmark-set data. There may be some pugmark-sets whose identity may not be known with certainty.
Our data suggests that a minimum of 10 pugmarks per
pugmark-set should be recorded to determine the identity
of a pugmark-set with a high level of certainty in a
pugmark-set population of c. 20.
Pugmarks from a pugmark-set would be classified into a
group with a probability ranging from 0 to 1. One approach
would be to set cut-off bounds based on large datasets from
known tigers. For this dataset, the average probability
of a pugmark being correctly classified to its pugmarkset group was 0.92 (SD 0.083). When two pugmark-sets
from the same tigers were considered, the average sum of
cross-classification probability was 0.71 with a 95% lower
bound of 0.64. Thus, if a new entrant pugmark-set gets
mixed with a pre-existing pugmark-set and the average
sum of this probability (of intermixing) is > 0.64, then
the two pugmark-sets could be considered as belonging
to the same tiger. In rare cases, a pugmark-set may get
dispersed into several groups with small probabilities of
classification in these groups, although no such case was
seen in our data. An approach to incorporate the error
probabilities of uncertain identification into the population
estimation model as reported for genotyping errors in
mark–recapture studies (Lukacs & Burnhum, in press)
would need to be developed. In the eight pugmark-sets
used for the population estimation exercise, each set had
data ranging from 10 to 14 pugmarks. Larger numbers of
pugmarks (> 10) recorded for each pugmark-set would
increase the probability of correct classification in the
model. Data was used from 15 known tigers as training
data to which a new entrant pugmark-set was added for
comparison and classification. It is essential to have a
training dataset of a minimum of five to eight known tigers.
Preferably, these pugmark-sets should be from both sexes
and of varied sizes (age groups). Each time a new tiger
is added, the training dataset increases in size. When a
pugmark-set is classified as belonging to a pre-existing
tiger (in the training data) then the new pugmark-set gets
the same identity as that of the pre-existing set, thereby
increasing its sample of pugmarks.
It is probable that the accuracy of correct classification
of pugmark-sets may drop as the number of pugmarksets being compared becomes large. For any meaningful
comparison the number of pugmark-sets that actually
need to be compared would be 10–35. It would be
pointless to compare tiger pugmark-sets separated in space
by > 40 km and time by < 12 h. Even considering sample
sizes for multiple mark–recapture sessions (Pollock et al.,
1990) it is unlikely that comparisons within and between
sessions would exceed 35 pugmark-sets even in high tiger
density areas (as is seen from camera trap data in tiger
habitats (Karanth & Nichols, 2000). Our data strongly
suggest that a high level of accuracy is likely to be achieved
in individual identification of tigers within these sample
sizes. Studies such as this would need to be replicated
to ensure that this level of accuracy is replicable with
pugmark-set data from other tigers.
The availability of suitable substrate is a limiting factor
for obtaining useful pugmark-sets. Thus, the method can
be used only in those areas where the substrate is conducive for the registration of pugmarks, e.g. in tiger
habitats of central and western India and not in tropical
rainforests, terai floodplains or mangrove swamps. Even
with our limited data, pugmarks registered in soil depths
> 1 cm were likely to give imprecise results.
Population monitoring based on pugmarks has potential
for monitoring other large carnivores including felids,
canids and ursids. With intensive data-collection this
method could also be used for studying the gross ranging
pattern of individual tigers when more invasive and
expensive technology such as radio-telemetry is not
feasible. The method has been effectively demonstrated
for obtaining sex-ratios in tiger populations (Sharma et al.,
2003) and can be further developed to provide information
on stage-based population structure. The technique for
individual identification based on pugmarks also has
potential for identifying problem tigers and resolving
conflicts.
The methodology for individual identification proposed
in this paper uses the quantifiable information from
hindfeet pugmarks and gait variables. Unique information
could also be extracted from measurements of front
feet pugmarks as also observed in mountain lions
(Smallwood & Fitzhugh, 1993). Obtaining front feet pugmarks of tigers is not always possible as the hindfeet
pugmarks overlap the impressions of the front feet,
thereby obliterating them. It would also be possible to use non-quantifiable information in the form of
various permanent idiosyncratic features such as seams
and creases in the pad, irregular placement of toes, distinct
shape of toes, etc., for individual identification. Amongst
our dataset such irregularities were obvious in 11 out of
19 tigers. Such information, though not used in the current
study, could be used in a logical framework to stratify
pugmark-sets that should be compared statistically. Such
an approach would probably increase the precision of
individual identification by limiting comparisons between
truly ambiguous pugmark-sets.
Monitoring of tiger populations from their pugmarks is
cost-effective, non-invasive, rapid and a practical method
in harmony with the traditional practice of the tiger census
done by wildlife managers. Because of this, the method is
likely to be acceptable and will fill an important void for
�Identifying individual tigers
an objective tiger population monitoring system in central
and western India.
Acknowledgements
The study was funded as a fellowship to the first author,
from Wildlife Institute of India (Ministry of Environment
and Forest, Government of India). We thank the Director
and colleagues at the Wildlife Institute of India for their
support; the Chief Wildlife Warden of Madhya Pradesh,
Rajasthan, Maharashtra and Karnataka for granting permissions for this study; the Field Directors, DCFs and the
staff of Ranthambhore Tiger Reserve, Kanha Tiger Reserve, Bandhavgarh Tiger Reserve, Tadoba Tiger Reserve,
Keoladeo National Park, Bannerghatta National Park,
Nagzira Wildlife Sanctuary and National Zoological
Garden, New Delhi for their cooperation during the fieldwork. Our special thanks to H. S. Panwar for his constant
encouragement and assistance. Discussions with V. Rishi
and R. Gopal were extremely helpful in developing this
methodology. S. S. thanks Belinda Wright, Wildlife Protection Society of India, for support to continue this study.
We thank J. D. Nichols, S. Smallwood and an anonymous
reviewer for their constructive comments that greatly
improved the manuscript.
REFERENCES
Abramov, K. G. (1961). Voprosy organizatsii I metody ucheta
resoursov fauny nazmnyh. [Proceedings of a symposium on
orgnization and methods of registration of ground vertebrates].
Izdatelstvo ANIMA USSR. (In Russian.)
Basappanavar, C. H. (1988). Counting tigers. Sanctuary 7(2): 77–
85.
Bertram, B. C. R. (1979). Studying predators. 2nd edn. Nairobi:
African Wildlife Leadership Foundation.
Borner, M. (1979). A field study of the Sumatran rhinoceros
(Dicerorhinus sumatrancesis), Fischer. PhD dissertation,
University of Basel, Switzerland.
Brander Dunbar, A. (1930). Tiger tracks. J. Bombay nat. Hist. Soc.
33: 972.
Carbone, C., Christie, S., Conforti, K., Coulson, N., Franklin, N.,
Ginsberg, J. R., Griffiths, M., Holden, J., Kawannishi, K.,
Kinnaird, M., Laidlaw, R., Lynam, A., Macdonald, W. D., Martyr,
D., McDougal, C., Nath, L., O’Brian, T., Seidensticker, J., Smith,
D. L. J., Sunquist, M., Tilson, R., and Wan Shahruddin,W. N.,
(2001). The use of Photographic rates to estimate densities of
tigers and other cryptic mammals. Anim. Conserv. 4: 75–79.
Caughley, G. (1977). Analysis of vertebrate populations. New York:
Wiley.
Champion, F. W. (1929). Tiger tracks, J. Bombay nat. Hist. Soc. 33:
284–287.
Choudhury, S. R. (1970). Let us count our tiger. Cheetal 14(2):
41–51.
Choudhury, S. R. (1971). The tiger tracer. Cheetal 13(1): 27–31.
Choudhury, S. R. (1972). Tiger census in India, Part I and II. Cheetal
15(1): 67–84.
Corbett, J. (1944). Maneaters of Kumaon. London: Oxford University Press.
Currier, M. J. P., P., Sheriff, S. L. & Russel, K. R. (1977). Mountain
lion population and harvest near Canon City, Colorado.
Colorado division, Wildlife Special Report 42.
17
Das, P. K. & Sanyal, P. (1995). Assessment of stable pug measurement variables for identification of tiger. Tiger Paper 22: 20–26.
Fitzhugh, E. L. & Gorenzel, W. P. (1985). Design and analysis of
mountain lion track surveys. In Cal-Neva wildlife transactions,
Western Section: 78–87. Bleich, V. C. (Ed.). Sacramento, CA:
Wildlife Society.
Fitzhugh, E. L., Lewison, R. L. & Galentine, S. P. (2000). Identifying
individual puma from tracks. In Wildlife, land & people – priorities for the 21st century. Fileld, R., Warren, R. J., Okarma, H. &
Sivert, P. R. (Eds). Bethesda, MD: Wildlife Society.
Fjelline, D. P. & Mansfield, T. M. (1988). Method to standardize the
procedure for measuring mountain lion tracks. In Proceedings of
the third mountain lion workshop, Arizona: 49–51. Smith, R. H.
(Ed.). Prescott, AZ: Wildlife Society and Arizona Game and Fish
Department.
Flynn, R. W. & Abdullah, M. T. (1983). Distribution and number of
Sumatran rhinoceros in the Endau–Rompin region of peninsular
Malaysia. Malay. Nat. J. 36: 219–247.
Gogate, M. G., Joshi, P. A., Gore, A. P. & Paranjape, S. A. (1989).
Tiger pugmark studies: a statistical perspective. Tech. Bulletin
No. 2, Directorate, Project Tiger, Melghat, Paratwada
(Maharashtra).
Gore, A. P., Paranjape, S. A., Rajgopalan Geeta, Kharshikar, A. V.,
Joshi, N. V., Watve, M. & Gogate, M. (1993). Tiger census: role
of quantification. Curr. Sci. 64: 711–714.
Grigione, M. M. & Burman, P. (2000). What is revealed in a
mountain lion’s heel: using heel shape to ascertain identity. Trans.
West. Sect. Wildl. Soc. 36: 21–26.
Grigione, M. M., Burman, P., Bleich, V. C. & Pierce, B. M. (1999).
Identifying individual mountain lions Felis concolor by their
tracks: refinement of an innovative technique. Biol. Conserv. 88:
25–32.
Hayward, G. D., Miquelle, D. G., Smirnov, E. N. & Nations, C.
(2002). Monitoring Amur tiger populations: characteristics of
track surveys in snow. Wildl. Soc. Bull. 30: 4, 1150–1159.
Jayarajan, O. (1983a). Pugmark census. Cheetal 25(3): 44–51.
Jayarajan, O. (1983b). Pugmark census. Cheetal 25(4): 3–6.
Jewell, Z. C., Alibhai, S. K. & Law, R. P. (2001). Censusing and
monitoring black rhino (Diceros bicornis) using an objective
spoor (footprint) identification technique. J. Zool. (Lond.) 254:
1–16.
Johnson, R. A. & Wichern, D. W. (1992). Applied multivariate
statistical analysis. New Jersey: Prentice Hall.
Karanth, K. U. (1987). Tigers in India: a critical review of field
censuses. Pages In Tigers of the world: the biology, biopolitics,
management and conservation of an endangered species: 118–
133. Tilson, R. L. & Seal, U. S. (Eds). New Jersey: Park Ridge,
Noyes.
Karanth, K. U. (1993). How many tigers? Field censuses in India.
Hornbill 1: 2–9.
Karanth, K. U. (1995). Estimating tiger Panthera tigris populations
from camera-trap data using capture recapture models. Biol.
Conserv. 71: 333–338.
Karanth, K. U. (1999). Counting tigers with confidence. In Riding
the tiger: 350–353. Seidensticker, J., Christie, S. & Jackson, P.
(Eds). Cambridge: Cambridge University Press.
Karanth, K. U. (2003). Tiger ecology and conservation in the Indian
subcontinent. J. Bombay nat. Hist. Soc. 100: 169–189.
Karanth, K. U. & Nichols, J. D. (1998). Estimation of tiger densities
in India using photographic captures and recaptures. Ecology 79:
2852–2862.
Karanth, K. U. & Nichols, J. D. (2000). Ecological status and
conservation of tigers in India. Final Technical Report to the
Division of International Conservation, US Fish and Wildlife
Service, Washington DC and Wildlife Conservation Society,
New York, Center for Wildlife Studies, Banglore, India.
Karanth, K. U., Nichols, J. D., Seidensticker, J., Dinerstein, E.,
Smith, J. L. D., McDougal, C., Johnsingh, A. J. T., Chundawat,
�18
S. SHARMA, Y. JHALA AND V. B. SAWARKAR
R. S. & Thapar, V. (2003). Science deficiency in conservation
practice: the monitoring of tiger populations in India. Anim.
Conserv. 6: 141–146.
Kawanishi, K. & Sunquist, M. E. (2004). Conservation status
of tigers in a primary rainforest of Peninsular Malaysia. Biol.
Conserv. 120: 329–344.
Koford, C. B. (1976). The welfare of the puma in California.
Carnivore 1: 92–96.
Kurt, F. (1970). Final report to IUCN/SSC and WWF International
of project 596: Leuser Reserve, Sumatra. (Unpub.)
Kutilek, M. J., Hopkins, R. A., Clinite, E. W. & Smith, T. E.
(1983). Monitoring population trends of large carnivores using
track transacts. In Renewable resource inventories for monitoring
changes and trends: 104–106. Bell, J. F. & Atterbury, T. (Eds).
Corvallis, OR: College of Forestry, Oregon State University.
Lewison, R., Fitzhugh, E. L. & Galentine, S. P. (2001). Validation of
a rigorous track classification technique: identifying individual
mountain lions. Biol. Conserv. 99: 313–321.
Lizcano, M., D. J. & Cavelier, J. (2000). Densidad poblacional
y disponibilidad de habitat de la danta de montana (Tapirus
pinchaque) en los Andes centrales de Colombia. Biotropica 32:
165–173.
Lukacs, P. M. & Burnhum, K. P. (2005). Estimating population size from DNA-based capture–recapture data incorporating genotyping error. J. Wildl. Manage. 69: 396–403.
McDougal, C. (1977). The face of the tiger. London: Rivington
Books.
McDougal, C. (1999). You can tell some tigers by their tracks
with confidence. In Riding the tiger: 190–191. Seidensticker, J.,
Christie, S. & Jackson, P. (Eds). Cambridge: Cambridge University Press.
Miquelle, D. G., Smirnov, E. N., Quigley, H. G., Hornocker M. G.,
Nikolaev, I. G., Matushkin, E. N. (1996). Food habits of Amur
tigers in Sikhote–Alin Zapovednik and the Russian Far East, and
implications for conservation. J. Wildl. Res. 1: 138–147.
Neal, D. L., Steger, G. N. & Bertram, R. C. (1987). Mountain lions:
preliminary findings on home-range use and density in the
central Sierra Nevada. USDA Research Note PSW–392, Pacific
Southwest Forest and Range Experiment Station, Berkeley,
California.
Nowell, K. & Jackson, P. (1996). Wild cats: status survey and
conservation action plan. Gland, Switzerland: IUCN.
Panwar, H. S. (1979a). A note on tiger census technique based on
pugmark tracings. Indian For. (Special Issue): 70–77.
Panwar, H. S. (1979b). Population dynamics and land tenure of
tigers in Kanha National Park. Indian For. (Spec. Issue): 18–36.
Pollock, K. J., Nichols, J. D., Brownie, C. & Hines, J. E. (1990).
Statistical inference for capture–recapture experiments. Wildl.
Monogr. 107: 1–97.
Riordan, P. (1998). Unsupervised recognition of individual tigers
and snow leopards from their footprints. Anim. Conserv. 1: 253–
262.
Rishi, V. (1997). Monitoring tiger populations by impression-pad
method. Indian For. 123: 583–600.
Sale, J. B. & K. Berkmuller. (1988). Manual of wildlife techniques
for India. Dehradun. India: Wildlife Institute of India.
Sankhla, K. (1978). Tiger! The story of the Indian tiger. Calcutta,
India: Rupa.
Sawarkar, V. B. (1987). Some more on tiger tracks. Cheetal 28(4):
1–8.
Schaller, G. B. (1967). The deer and the tiger. Chicago: University
of Chicago Press.
Schenkel, R. & Schenkel-Hulliger, L. (1969). The Javan rhinoceros
(Rhinoceros sondiacus Desm.) in Udjung Kulon nature reserve:
its ecology and behaviour. Field study 1967 and 1968. Acta
tropica 26(2): 97–135.
Seber, G. A. F. (1992). A review of estimating animal abundance II.
Int. Stat. Rev. 60: 129–166.
Sharma, S. (2001). Evaluation of pugmark census technique.
MSc thesis, Saurashtra University, Rajkot (Gujrat) and Wildlife
Institute of India, Dehradun, India.
Sharma, S., Jhala, Y. V. & Sawarkar, V. B. (2003). Gender discrimination of tigers by using their pugmarks. Wildl. Soc. Bull. 31:1,
258–264.
Shaw, H. G. (1983). Mountain lion field guide. Special Report
No. 9. Phoenix, AZ: Arizona Game and Fish Department.
Singh, A. (1972). A note on tiger census. Cheetal 15(3): 24–26.
Singh, A. (1984). Tiger! Tiger!. London: Jonathan Cape.
Singh, L. A. K. (1999). Tracking tigers: guidelines for estimating
wild tiger populations using the pugmark technique. New Delhi,
India: WWF Tiger Conservation Program.
Smallwood, K. S. & Fitzhugh, E. L. (1993). A rigorous technique
for identifying individual mountain lions Felis concolor by their
tracks. Biol. Conserv. 65: 51–59.
Strickland, D. L. (1967). Ecology of the rhinoceros in Malaya.
Malay. Nat. J. 20: 1–17.
Van Dyke, F. G., Brocke, R. H. & Shaw, H. G. (1986). Use of
road track count as indices of mountain lion presence. J. Wildl.
Manage. 50: 102–109.
Van Strien, N. J. (1985). The Sumatran rhinoceros (Dicerorhinus
sumatransis, Fisher) in the Gunung Leuser National Park,
Sumatra, Indonesia, its distribution, ecology and conservation.
Privately published, Doorn, Netherlands.
Williams, B. K. (1983). Some observations on the use of
Discriminant analysis in ecology. Ecology 64: 1283–1291.
Zalewski, A. (1999). Identifying sex and individuals of pine marten using snow track measurements. Wildl. Soc. Bull. 27: 28–
31.
Zar, J. H. (1984). Biostatistical analysis. New Jersey: Prentice-Hall.
Zielinski, W. J. & Kucera, T. E. (1995). American marten, fisher,
lynx, and wolverine: survey methods for their detection.
General Technical Report, PSW-GTR-157. Albany, CA: Pacific
Southwest Research Station, Forest Service, U. S. Department of
Agriculture.
�