[go: up one dir, main page]

Page MenuHomePhabricator

Gaps in Grafana graphs using Thanos
Open, Needs TriagePublicBUG REPORT

Description

Steps to replicate the issue (include links if applicable):

What happens?:

  • There are gaps in the RefreshLinksJob::getParserOutputFromCache (Prometheus) graph
  • When zooming out to 12 hours or more, these gaps vanish and the data seems to be present.
  • The gaps are not present in the RefreshLinksJob::getParserOutputFromCache (graphite) graph (these two graphs should show the same data, and they seem to do so, except for the data from prometheus being more "spikey")

What should have happened instead?:

Other information (browser name/version, screenshots, etc.):

24 hour window works fine:

grafik.png (404×1 px, 65 KB)

6 hour window is broken:

grafik.png (407×1 px, 52 KB)

15 minute window is broken:

grafik.png (408×1 px, 44 KB)

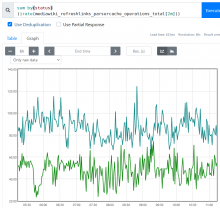
The query works fine for a 6 hour window on Thanos:

grafik.png (740×780 px, 165 KB)

Event Timeline

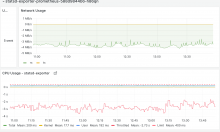
Thank you for the detailed report @daniel ! Made it super easy to reproduce and investigate. I have played around with rate() interval and it looked like there wasn't enough data for e.g. rate([2m]) to plot sth meaningful. Given that we scrape every 60s I thought maybe prometheus can't scrape often enough from statsd-exporter. Sure enough, e.g. for mw-jobrunner namespace statsd-exporter appears to be heavily cpu throttled (unless I'm misreading the graphs) https://grafana.wikimedia.org/goto/pfQrsErIR?orgId=1 (link will break unfortunately when statsd-exporter gets new pods)

2024-08-06-155659_1858x1123_scrot.png (1×1 px, 146 KB)

I'm working on bumping the statsd-exporter limits, and in the meantime I got curious on general cpu throttling stats in k8s: https://w.wiki/ArXp

unsurprisingly statsd-exporter is in the top 15, with a few service containers too:

{container="statsd-exporter", namespace="mw-web", site="eqiad"}21.931203316177598
{container="statsd-exporter", namespace="mw-api-ext", site="eqiad"}13.23978883967244
{container="statsd-exporter", namespace="mw-web", site="codfw"}11.908566182694393
{container="statsd-exporter", namespace="mw-api-int", site="eqiad"}7.6056624905245105
{container="thumbor-8082", namespace="thumbor", site="eqiad"}6.3241434191838914
{container="statsd-exporter", namespace="mw-jobrunner", site="eqiad"}6.201692060091147
{container="statsd-exporter", namespace="mw-api-ext", site="codfw"}5.848601039738285
{container="linkrecommendation-internal", namespace="linkrecommendation", site="eqiad"}5.102385104628782
{container="wikifeeds-production-tls-proxy", namespace="wikifeeds", site="eqiad"}4.340646963265761
{container="thumbor-8081", namespace="thumbor", site="eqiad"}3.969756827945107
{container="wikifeeds-production-tls-proxy", namespace="wikifeeds", site="codfw"}2.745671794745576
{container="statsd-exporter", namespace="mw-parsoid", site="eqiad"}2.6688748266749003
{container="thumbor-8080", namespace="thumbor", site="eqiad"}1.9259288830619037
{container="mobileapps-production", namespace="mobileapps", site="eqiad"}1.4022554075214957
{container="thumbor-8080", namespace="thumbor", site="codfw"}1.175055309842738

Change #1060411 had a related patch set uploaded (by Filippo Giunchedi; author: Filippo Giunchedi):

[operations/deployment-charts@master] mw-jobrunner: bump limit/request for statsd-exporter

https://gerrit.wikimedia.org/r/1060411

Change #1060411 merged by Filippo Giunchedi:

[operations/deployment-charts@master] mw-jobrunner: bump limit/request for statsd-exporter

https://gerrit.wikimedia.org/r/1060411

Even though there's no throttling now, e.g. mw-jobrunner statsd-exporter still shows as down from e.g. prometheus eqiad k8s: https://prometheus-eqiad.wikimedia.org/k8s/targets?scrapePool=k8s-pods&search=jobrunner

And indeed trying to simulate a scrape, curl sits there waiting for an answer after the GET:

prometheus1005:~$ curl 10.67.184.160:9125/metrics -v
* Uses proxy env variable no_proxy == '.wmnet'
*   Trying 10.67.184.160:9125...
* Connected to 10.67.184.160 (10.67.184.160) port 9125 (#0)
> GET /metrics HTTP/1.1
> Host: 10.67.184.160:9125
> User-Agent: curl/7.74.0
> Accept: */*
>

Just a quick update: @hnowlan rightfully pointed out that I was looking at port 9125 as failed, which it does, though statsd-exporter actually exports on 9102 which does work as expected:

prometheus1005:~$ curl 10.67.184.160:9102/metrics -s | grep -i refreshlinks
mediawiki_EventBus_outgoing_events_total{event_service_name="eventgate_main",event_service_uri="http_localhost_6005_v1_events",event_type="TYPE_JOB",function_name="send",stream_name="mediawiki_job_refreshLinks"} 373350
# HELP mediawiki_WikibaseClient_PageUpdates_RefreshLinks_jobs_total Metric autogenerated by statsd_exporter.
# TYPE mediawiki_WikibaseClient_PageUpdates_RefreshLinks_jobs_total counter
mediawiki_WikibaseClient_PageUpdates_RefreshLinks_jobs_total 54934
# HELP mediawiki_WikibaseClient_PageUpdates_RefreshLinks_titles_total Metric autogenerated by statsd_exporter.
# TYPE mediawiki_WikibaseClient_PageUpdates_RefreshLinks_titles_total counter
mediawiki_WikibaseClient_PageUpdates_RefreshLinks_titles_total 54934
# HELP mediawiki_refreshlinks_failures_total Metric autogenerated by statsd_exporter.
# TYPE mediawiki_refreshlinks_failures_total counter
mediawiki_refreshlinks_failures_total{reason="lock_failure"} 60
mediawiki_refreshlinks_failures_total{reason="page_not_found"} 6
# HELP mediawiki_refreshlinks_parsercache_operations_total Metric autogenerated by statsd_exporter.
# TYPE mediawiki_refreshlinks_parsercache_operations_total counter
mediawiki_refreshlinks_parsercache_operations_total{status="cache_hit"} 106048
mediawiki_refreshlinks_parsercache_operations_total{html_changed="n_a",status="cache_hit"} 23027
mediawiki_refreshlinks_parsercache_operations_total{html_changed="no",status="cache_miss"} 48282
mediawiki_refreshlinks_parsercache_operations_total{html_changed="unknown",status="cache_miss"} 97965
mediawiki_refreshlinks_parsercache_operations_total{html_changed="yes",status="cache_miss"} 4332
# HELP mediawiki_refreshlinks_superseded_updates_total Metric autogenerated by statsd_exporter.
# TYPE mediawiki_refreshlinks_superseded_updates_total counter
mediawiki_refreshlinks_superseded_updates_total 78182

Investigation continues

Regarding the throttling: Maybe it would help to set GOMAXPROCS to something sensible/related to the CPU limit (see https://wikitech.wikimedia.org/wiki/Kubernetes/Resource_requests_and_limits, https://github.com/uber-go/automaxprocs/tree/master)

Edit: Whoops, I completely missed T371885#10048618 onward before posting this. In any case, question still stands re: the annotation :)

For the endpoints marked down: it looks as if prometheus is scraping both container ports - i.e., 9102 (correct) and 9125 (statsd listen port, incorrect).

Not sure if that could somehow cause problems like those described in the task description, but it would at least explain T371885#10048571.

I wonder if we need to add an explicit prometheus.io/port annotation to ensure only 9102 is scraped?

I couldn't find any gaps in the data, but please let me know if you do!

For awareness: https://grafana.com/blog/2020/09/28/new-in-grafana-7.2-__rate_interval-for-prometheus-rate-queries-that-just-work/

Possibly $__rate_interval is calculating some interval that yields no data (or not enough data to render a valid rate() result). I tried updating "min step" on the graph to 2m and zooming seems to work with that.

Edit: Whoops, I completely missed T371885#10048618 onward before posting this. In any case, question still stands re: the annotation :)

For the endpoints marked down: it looks as if prometheus is scraping both container ports - i.e., 9102 (correct) and 9125 (statsd listen port, incorrect).

Not sure if that could somehow cause problems like those described in the task description, but it would at least explain T371885#10048571.

I wonder if we need to add an explicit prometheus.io/port annotation to ensure only 9102 is scraped?

That's not the best way to do it in modern-wmf-k8s, although we haven't fixed a lot of those cases. The correct thing to do here is to declare prometheus.io/scrape_by_name: true instead of prometheus.io/scrape: true, that will make prometheus only scrape ports with name ending in -metrics.

Change #1060669 had a related patch set uploaded (by Giuseppe Lavagetto; author: Giuseppe Lavagetto):

[operations/deployment-charts@master] statsd-exporter: only scrape metrics from the prometheus ports

https://gerrit.wikimedia.org/r/1060669

Change #1060669 merged by jenkins-bot:

[operations/deployment-charts@master] statsd-exporter: only scrape metrics from the prometheus ports

https://gerrit.wikimedia.org/r/1060669

Possibly $__rate_interval is calculating some interval that yields no data (or not enough data to render a valid rate() result). I tried updating "min step" on the graph to 2m and zooming seems to work with that.

Right - so this is an issue with Grafana rather than Thanos/Prometheus.

It seems like $__rate_interval is based on the "Interval" query option, which in turn is based on the zoom level. When that drops below the actual scrape rate, no data is found for most intervals. Setting the "Min interval" option to 2m indeed fixes it. The documentation sais that Min interval should be set to the write frequency. Is there a way we can do that automatically based on the data source? Or at least globally for all Prometheus sorces? Doing this for every graph manually is really annoying...

Thank you all for the investigation and help on this -- appreciate it!

To recap, this problem is actually the same as what's discussed at T371102: Include long-retention Prometheus data from Thanos into Grafana queries and the fix I have is to set min interval + scrape interval on the default thanos datasource so dashboards using $__rate_interval will work out of the box. Also for context rate_interval is set to 4x min interval (IIRC) and scrape interval is also taken into account. In our case scrape interval is 60s and with min interval to 30s that will yield a minimium rate_interval of 2m which is what we're after. I'll followup on T371102

Change #1061856 had a related patch set uploaded (by Filippo Giunchedi; author: Filippo Giunchedi):

[operations/deployment-charts@master] mediawiki: bump limit/request for statsd-exporter

https://gerrit.wikimedia.org/r/1061856

Change #1061856 merged by Filippo Giunchedi:

[operations/deployment-charts@master] mediawiki: bump limit/request for statsd-exporter

https://gerrit.wikimedia.org/r/1061856

Mentioned in SAL (#wikimedia-operations) [2024-08-19T17:29:00Z] <swfrench-wmf> statsd-exporter resource bumps (https://gerrit.wikimedia.org/r/1061856) are now everywhere - T371885