This application claims priority to U.S. provisional application No.62/024,456 filed on day 7, 2014 and U.S. provisional application No.62/160,403 filed on day 12, 2015, 7, and hereby incorporated by reference in its entirety for all purposes.
The contents of the electronic submission text file are incorporated herein in their entirety by reference: a sequence table copied in a computer-readable format (file name: VRCT-008_02WO _ st25.txt, recording date: 2015, 7 months, 14 days; file size: 9 kilobytes).
Detailed Description
The methods disclosed herein provide an alternative or complementary approach for evaluating cell or tissue samples obtained by a bronchoscopy procedure (or other procedure for evaluating respiratory tissue), and increase the likelihood that the procedure will yield information useful for managing the care of the patient. The methods disclosed herein are highly sensitive and yield information about the likelihood of a subject having lung cancer from cell or tissue samples often obtained from regions of the airway distant from malignant lung tissue (e.g., bronchial brushings of airway epithelial cells). In general, the methods disclosed herein involve performing a gene expression analysis on a biological sample obtained from a subject to assess gene expression levels. However, in some embodiments, the likelihood of the subject having lung cancer is determined in other parts based on the results of a histological examination of the biological sample or by taking into account other diagnostic indicators such as protein levels, mRNA levels, imaging results, chest X-ray examination results, and the like.
As used herein, the term "subject" generally refers to a mammal. Typically, the subject is a human. However, the term encompasses other species, such as pigs, mice, rats, dogs, cats, or other primates. In certain embodiments, the subject is an experimental subject, such as a mouse or rat.
The subject may be male/male or female/female. The subject may be an infant, a toddler, a child, a young adult, an adult, or an elderly person. The subject may be a smoker, a former smoker or a non-smoker. The subject may have a personal or family history of cancer. The subject may have a personal or family history of being cancer free. The subject may exhibit one or more symptoms of lung cancer or other lung disorders (e.g., emphysema, COPD). For example, the subject may have a new or persistent cough, an exacerbation of an existing chronic cough, blood in the sputum, persistent bronchitis or recurrent respiratory infections, chest pain, unexplained weight loss and/or fatigue, or dyspnea such as shortness of breath or wheezing. The subject may have a lesion that may be observable by computer-assisted tomography or chest X-ray. The subject may be an individual who has undergone bronchoscopy or who has been identified as a candidate for bronchoscopy (e.g., due to the presence of a detectable lesion or suspicious imaging outcome). In some embodiments, the subject has or has been diagnosed with Chronic Obstructive Pulmonary Disease (COPD). In some embodiments, the subject does not have or has not been diagnosed with COPD. A subject under the care of a physician or other health care provider may be referred to as a "patient".
As used herein, the term "about" refers to plus or minus "about" 10% of the modified subject. Thus, the phrase "about 10, 20, or 30" encompasses 8-11, 18-22, 27-33, respectively.
Informative genes
The expression levels of the genes of the present disclosure have been identified as providing useful information about the lung cancer status of a subject. These genes are referred to herein as "informative genes". Informative-genes include protein-coding genes and non-protein-coding genes. The skilled artisan will appreciate that the expression level of the informative-genes can be determined by assessing the level of the appropriate gene product (e.g., mRNA, miRNA, protein, etc.). Thus, the expression levels of certain mrnas have been identified to provide useful information about the lung cancer status of a subject. These mrnas are referred to herein as "informative mrnas".
Table 11 provides a list of informative-genes that are differentially expressed in cancer. In some embodiments, the informative-genes differentially expressed in lung cancer are selected from: BST1, CD177.1, CD177.2, ATP12A, TSPAN2, GABBR1, MCAM, NOVA1, SDC2, CDR1, CGREF1, CLND22, NKX3-1, EPHX3, LYPD2, MIA, RNF 150. In some embodiments, the informative-genes differentially expressed in lung cancer are selected from: TMEM51, CR1L, PDZKlIP1, mica 2, VWA5A, ACAD8, SAA4, glyattl 2, ETV6, CD177, CEACAM7, QPCT, CASP10, PI3, BST1, MTNR1A, STARD4, CFB, SLC26a8, VNN2, HDAC9, SLC26a4, and LCN 2. In some embodiments, the informative-genes differentially expressed in lung cancer are selected from: CCDC18, FAM72D, NUF2, FBXO28, GPR137B, STIL, DEPDC1, TSPAN2, ASPM, KIF14, KIF20B, RAD51AP1, GAS2L3, SPIC, SMAGP, ATP12A, BRCA2, BORA, SKA3, DLGAP5, CASC5, LRRC28, PYD, TXNL4B, EF 5, SPAG5, ABCAl2, AURKA, SGOL1, BANK1, CENPE, CASP6, MADD 2L1, CCNA2, CCNB1, KIF20A, CENPK, ERAP1, FAM54A, 2, CLDN12, BPGM, PCMTD1, MELK 4, and MST 4. In some embodiments, the informative-genes differentially expressed in lung cancer are selected from: CR1, GOS2, CSF3R, S100Al2, SELL, NCF2, LIPN, ZNF438, NAMPT, CBL, CASP5, CARD16, CARD17, CLEC4A, LRRK2, HMGN2P46, AQP9, BCL2a1, ITGAX, GPR97, CCL4, PSTPIP2, IFI30, FFAR2, EMR3, FPR1, LILRA5, PLEK, MXD1, TNFAIP6, CXCR2, IL1B, CXCR1, SIRPB1, NCF4, IRAK2, pro k2, TLR2, TREM1, SOD2, CREB5, TNFRSF10C, CSGALNACT1, and ASAP 1. In some embodiments, the informative-genes differentially expressed in lung cancer are selected from: PLA2G2A, NFYC, RASSF10, GLB1L3, TRIM3, MCAM, MSRB3, SLITRK5, GAS6, NOVA1, GABRG3, ABCA3, LPO, FSCN2, RASD1, HILS1, SDK2, NTN5, KCNA7, ATOH8, KCNIP3, INHBB, VSTM2L, ZNRF3, PLEKHG4B, GNMT, GABBR1, ARHGEF10, SDC2, CRB2, GAS1, PNPLA7, and RAI 2.
Certain methods disclosed herein relate to determining the expression level of at least one informative-gene in the biological sample. However, in some embodiments, the expression analysis involves determining the expression level of at least 2, at least 3, at least 4, at least 5, at least 6, at least 7, at least 8, at least 9, at least 10, at least 20, at least 30, at least 40, at least 50, at least 60, at least 70, or at least 80 informative-genes in the biological sample. In some embodiments, the expression analysis involves determining the expression level of 1 to 5, 1 to 10, 5 to 15, 10 to 20, 15 to 25, 20 to 30, 25 to 50, 25 to 75, 50 to 100, 50 to 200 or more informative-genes, such as those in table 11, in the biological sample. In some embodiments, the expression analysis involves determining the expression level of at least 1 to 5, 1 to 10, 2 to 10, 5 to 15, 10 to 20, 15 to 25, 20 to 30, 25 to 50, 25 to 75, 50 to 100, 50 to 200 or more informative-genes, such as those in table 11, in the biological sample.
In some embodiments, the number of informative genes used for expression analysis is sufficient to provide a clinically useful level of confidence in the predicted outcome. Such confidence levels (e.g., the effectiveness of the predictive model) can be assessed by a variety of performance parameters, including but not limited to accuracy, sensitivity, specificity, and area under the curve (AUC) of the Receiver Operating Characteristic (ROC) curve. These parameters can be evaluated with different numbers of features (e.g., number of genes, mrnas) to determine the optimal number and set of informative genes. An accuracy, sensitivity or specificity of at least 60%, 70%, 80%, 90% may be useful when used alone or in combination with other information.
Any suitable system or method can be used to determine the expression level of the informative-genes. Gene expression levels can be determined via the use of hybridization-based assays. As used herein, the term "hybridization-based assay" refers to any assay involving nucleic acid hybridization. Hybridization-based assays may or may not involve amplification of nucleic acids. Hybridization-based assays are well known in the art and include, but are not limited to, array-based assays (e.g., oligonucleotide arrays)Microarray), oligonucleotide-conjugated bead assays (e.g., multiplex bead-based)
Assays), molecular inversion probe assays, and quantitative RT-PCR assays. Multiplex systems (such as oligonucleotide arrays or bead-based nucleic acid assay systems) are particularly useful for simultaneously assessing the levels of a plurality of genes. Other suitable methods for determining the level of nucleic acid will be apparent to the skilled artisan.
As used herein, "level" refers to a value indicative of the amount or occurrence of a substance (e.g., mRNA). The level can be an absolute value, e.g., the amount of mRNA in the sample, or a relative value, e.g., the amount of mRNA in the sample relative to the amount of mRNA in a reference sample (control sample). The level may also be a binary value, indicating the presence or absence of a substance. For example, a substance may be identified as being present in a sample when a measurement of the amount of the substance in the sample (e.g., a fluorescence measurement from a PCR reaction or microarray) exceeds a background value. Similarly, a lack of the substance in the sample (or the absence of the substance detected in the sample) may be identified when the measure of the number of molecules in the sample is at or below a background value. It will be appreciated that the level of the substance may be determined directly or indirectly.
For example, additional non-limiting examples of informative mRNAs are disclosed in the following patent applications (the contents of which are hereby incorporated by reference in their entirety for all purposes): U.S. patent publication No. US2007/148650, entitled ISOLATION OF NUCLEIC ACID FROM MOUTH EPITHELIAL CELLS, filed on 12.5.2006; U.S. patent publication No. US2009/311692, entitled ISOLATION OF NUCLEIC ACID FROM MOUTH EPITHELIAL CELLS, filed on 9.1.2009; U.S. application No.12/884,714, entitled ISOLATION OF NUCLEIC ACID FROM MOUTH EPITHELIAL CELLS, filed on 17.9.2010; U.S. patent publication No. US2006/154278, entitled DETECTION METHOD FOR DISORDER OF THE LUNG, filed on 6.12.2005; U.S. patent publication No. US2010/035244, entitled DIAGNOSTIC FOR LUNG DISORDERS USING CLASS PREDICTION, filed on 8.2.2008; U.S. application No.12/869,525, entitled DIAGNOSTIC FOR LUNG DISORDERS USING CLASS PREDICTION, filed on 26.2010; U.S. application No.12/234,368, entitled BIOMARKERS FOR SMOKE EXPOSURE, filed 9/19/2008; U.S. application No.12/905,897 entitled BIOMARKERS FOR SMOKE EXPOSURE filed 10 months 154 2010; U.S. patent application No. US2009/186951, entitled International patent OF NOVEL PATHWAYS FOR DRUG DEVELOPMENT FOR LUNG DISEASE, filed 9/19.2008; U.S. publication No. US2009/061454, entitled DIAGNOSTIC AND PROGNOSTIC METHODS FOR LUNG DISORDERS USE GENE EXPRESSION PROFILES, filed 9/2008; U.S. application No.12/940,840, entitled DIAGNOSTIC AND PROGNOSTIC METHODS FOR THE DISORDERS USING GENE EXPRESSION PROFILES, filed 11/5/2010; U.S. publication No. US2010/055689, entitled Multi METHODS FOR DETECTING Lung discorders, filed 3, 30.2009; and International patent application No. PCT/US13/38449, entitled METHODS FOR improving lubricating CANCER STATUS, filed on 26.4.2013.
cDNA
A cDNA molecule is a non-naturally occurring polynucleotide sequence synthesized from an mRNA molecule by one of ordinary skill in the art. In some embodiments, the cDNA molecules of the present invention are obtained or obtained. The use of the enzyme reverse transcriptase to convert RNA to cDNA creates cDNA, a non-naturally occurring molecule that lacks introns. cDNA-dependent methods necessarily rely on artificial molecules that do not naturally occur in nature, such as protein expression of cDNA molecules or hybridization of cDNA molecules.
In certain aspects, cDNA is generated from a sample using mRNA in a biological sample by reverse transcription of the mRNA using at least one primer; amplifying the cDNA using the polynucleotide as sense and antisense primers to amplify the cDNA therein; and detecting the presence of the amplified cDNA. In a further aspect, the sequence of the amplified cDNA may be determined by any suitable method.
In one embodiment, once mRNA is obtained from a sample, it is converted to complementary DNA (cDNA). cDNA does not exist in vivo and is therefore a non-native molecule. In a further embodiment, the cDNA is then amplified, for example, by Polymerase Chain Reaction (PCR) or other amplification methods known to those of ordinary skill in the art. The product of this amplification reaction (i.e., the amplified cDNA) is necessarily a non-natural product. As mentioned above, cDNA is a non-natural molecule. Second, in the case of PCR, the amplification process is used to create billions of copies of cDNA for each individual cDNA molecule of the starting material. The number of copies generated greatly exceeds the number of copies of the mRNA present in vivo.
In one embodiment, the cDNA is amplified with primers that introduce additional DNA sequences (adaptor sequences) into the fragments (via the use of adaptor-specific primers). Thus, amplification is used to create non-natural double-stranded molecules from non-natural single-stranded cDNA by introducing barcodes, adaptors, and/or reporter sequences onto the cDNA that was already non-natural. In one embodiment, a detectable label (e.g., a fluorophore) is added to the single stranded cDNA molecule during amplification with the adaptor-specific primers. Thus, amplification is also used to create DNA complexes that do not occur in nature, at least because (i) cDNA is not present in vivo, (i) adaptor sequences are added to the ends of cDNA molecules to generate DNA sequences that are not present in vivo, (ii) the error rates associated with amplification further create DNA sequences that are not present in vivo, (iii) the fundamentally different structure of the cDNA molecules compared to those present in nature, and (iv) the chemical addition of detectable labels to the cDNA molecules.
In one embodiment, the synthetic cDNA (e.g., amplified cDNA) is immobilized on a solid surface via hybridization to probes (e.g., via a microarray). In another embodiment, the DNA product is detected via real-time Polymerase Chain Reaction (PCR) via the introduction of a fluorescent probe that hybridizes to the cDNA product. For example, in one embodiment, by quantitative fluorogenic RT-PCR (e.g., using
Probes) to assess biomarker detection. For PCR analysis, methods are known in the art for determining primer sequences for use in the analysis.
In one embodiment, for the synthesis and amplification of cDNA, the 5 'Ampli FINDER RACE kit (manufactured by Clontech) and the 5' -RACE method using PCR (Frohman, M.A.et. al., Proc.Natl.Acad.Sci.USA (1988)85: 8998-. In such a cDNA synthesis process, restriction enzyme sites may be introduced at both ends of the cDNA.
Genome association
As disclosed herein, the expression levels of certain genes have been identified as being associated with (correlated with) certain self-reportable characteristics of a subject. Such genes are referred to herein as "genome-associated genes" or "genome association" and are useful because they provide surrogate markers for subject characteristics that might otherwise be incorrectly and/or inaccurately reported. For example, in some embodiments, a subject may incorrectly assess information such as the age of a package, smoking status, or age (e.g., by providing an underestimate of such information). In such embodiments, the use of a genome-associated gene-based predictive model can reduce or eliminate variability associated with incorrect reporting because it is based on the expression of the genome-associated gene rather than the decision the subject makes and/or the subject's recall of what information to report. The skilled artisan will appreciate that the expression level of such genomically associated genes can be determined by assessing the level of the appropriate gene product (e.g., mRNA, miRNA, protein, etc.). The expression level of the genomically associated genes can be determined in parallel with or independently of informative-genes of lung cancer status (e.g., informative-genes selected from table 11).
In some embodiments, the genomic association reflects the individual's response to environmental risk (e.g., smoking). In some embodiments, the genomic association reflects exposure to risk.
In some embodiments, the sex of the subject is determined based on one or more genome associated genes. In some embodiments, the genome associated gene associated with gender is RPS4Y 1. In some embodiments, the subject is identified as male if the expression of RPS4Y1 is below threshold and as female if the expression of RPS4Y1 is above threshold. In some embodiments, for a gene of interest, the threshold is the relative expression level that accurately distinguishes between males and females.
In some embodiments, the smoking status of the subject (e.g., current or previous) is determined based on one or more genome-associated genes. In some embodiments, the genome-associated gene associated with smoking status is SLC7a11, CLND10, or TKT. In some embodiments, the smoking status of a subject is determined according to the following model: smoking status (also known as Genomic Smoking (GS)) ═ exp (x))/(l + exp (x)), where
TKT, wherein
Are the regression weights of the regression model and the gene symbols represent the relative expression intensities of each respective gene. In some embodiments, the smoker is a subject who has smoked at least 100 cigarettes during life. In some embodiments, the former smoker is a subject who quits or does not smoke for 1 month prior to bronchoscopy.
In some embodiments, the subject's smoking history is determined based on one or more genome-associated genes. In some embodiments, the genome-associated gene associated with smoking history is AKR1C2 or
RUNX1T 1. In some embodiments, the subject's smoking history is determined according to the following model: smoking history (also known as the age of the Genome (GPY)) ═ exp (x))/(l + exp (x)), where
Wherein
Are the regression weights for the model and the gene symbols represent the relative expression intensities for each respective gene.
In some embodiments, the age of the subject is determined based on one or more genome associated genes. In some embodiments, the age-related genomic association gene is CD52, SYT8, TNNT3, ALX1, KLRK1, RASA3, CERS3, ASPA, GRP, APOC1, EPHX3, REEP1, FAM198B, PCDHB4, PCDHB16, FOXD1, SPARC, NKAPL, or GPR 110. In some embodiments, the age of the subject is determined according to the following model:
wherein
Are the regression weights for the model and the gene symbols represent the relative expression intensities for each respective gene.
Biological sample
The methods generally involve obtaining a biological sample from a subject. As used herein, the phrase "obtaining a biological sample" refers to any process for obtaining a biological sample directly or indirectly from a subject. For example, a biological sample may be obtained by obtaining a tissue or fluid sample from a subject (e.g., at a point-of-care facility, a physician's office, a hospital). Alternatively, a biological sample may be obtained by receiving a sample (e.g., at a laboratory facility) from one or more persons obtaining the sample directly from the subject.
The term "biological sample" refers to a sample derived from a subject (e.g., a patient). Typically, the biological sample comprises tissue, cells and/or biomolecules. In some embodiments, the biological sample is obtained on the basis that it is histologically normal (e.g., as determined by endoscopy (e.g., bronchoscopy)). In some embodiments, the biological sample is obtained from a region that is not suspected of containing cancerous cells (e.g., a bronchus or other site or region). In some embodiments, a histological or cytological examination is performed. However, it will be appreciated that histological or cytological examinations may be optional. In some embodiments, the biological sample is a sample of respiratory epithelium. The respiratory epithelium may be of the mouth, nose, pharynx, trachea, bronchi, bronchioles, or alveoli of the subject. The biological sample may comprise epithelium of the bronchi. In some embodiments, the biological sample has no detectable cancer cells, e.g., as determined by standard histological or cytological methods. In some embodiments, a histologically normal sample is obtained for evaluation. Typically, the biological sample is obtained by scraping or brushing (e.g., bronchial brushing). However, it should be appreciated that other procedures may be used, including, for example, brushing, scraping, broncho-alveolar lavage, bronchial biopsy, or transbronchial needle aspiration.
It is to be understood that the biological sample may be processed in any suitable manner to facilitate determination of the expression level. For example, biochemical, mechanical and/or thermal processing methods may be suitably used to isolate biomolecules of interest, such as RNA, from a biological sample. Thus, RNA or other molecules can be isolated from a biological sample by treating the sample using methods well known in the art.
Lung cancer assessment
The methods disclosed herein can involve comparing the expression level of the informative-genes to one or more suitable references. An "appropriate reference" is an expression level (or range of expression levels) of a particular informative-gene that is indicative of a known lung cancer status. Suitable references may be determined empirically by the practitioner of the method, or may be pre-existing values or ranges of values. A suitable reference represents an expression level (or range of expression levels) indicative of lung cancer. For example, a suitable reference can represent the expression level of an informative-gene in a reference (control) biological sample obtained from a subject known to have lung cancer. When an appropriate reference is indicative of lung cancer, a lack of a detectable difference (e.g., a lack of a statistically significant difference) between the expression level determined from a subject in need of characterizing or diagnosing lung cancer and the appropriate reference can be indicative of lung cancer in the subject. When an appropriate reference is indicative of lung cancer, a difference between the expression level determined from a subject in need of characterizing or diagnosing lung cancer and the appropriate reference can indicate that the subject is free of lung cancer.
Alternatively, a suitable reference may be the expression level (or range of expression levels) of a gene indicating that the subject does not have lung cancer. For example, a suitable reference can represent the expression level of a particular informative-gene in a reference (control) biological sample obtained from a subject known to be free of lung cancer. When the suitable reference indicates that the subject does not have lung cancer, a difference between the expression level determined from the subject in need of diagnosis of lung cancer and the suitable reference can indicate lung cancer in the subject. Alternatively, when an appropriate reference indicates that a subject does not have lung cancer, a lack of a detectable difference (e.g., a lack of a statistically significant difference) between the expression level determined from a subject in need of diagnosis of lung cancer and the appropriate reference level can indicate that the subject does not have lung cancer.
In some embodiments, the reference standard provides a threshold level of change such that if the expression level of the gene in the sample is within the threshold level of change (increase or decrease, depending on the particular marker), the subject is identified as not having lung cancer, but if the level is above the threshold, the subject is identified as at risk of having lung cancer.
In some embodiments, the method involves comparing the expression level of the informative-genes to a reference standard representing the expression level of the informative-genes in control subjects identified as not having lung cancer. Such a reference standard can be, for example, the average expression level of an informative-gene in a population of control subjects identified as not having lung cancer.
The magnitude of the difference between the statistically significant expression level and the appropriate reference may vary. For example, a significant difference indicative of lung cancer can be detected when the expression level of an informative-gene in the biological sample is at least 1%, at least 5%, at least 10%, at least 25%, at least 50%, at least 100%, at least 250%, at least 500%, or at least 1000% higher or lower than the appropriate reference for that gene. Similarly, a significant difference can be detected when the expression level of the informative-gene in the biological sample is at least 1.1-fold, 1.2-fold, 1.5-fold, 2-fold, at least 3-fold, at least 4-fold, at least 5-fold, at least 6-fold, at least 7-fold, at least 8-fold, at least 9-fold, at least 10-fold, at least 20-fold, at least 30-fold, at least 40-fold, at least 50-fold, at least 100-fold, or more higher or lower than the appropriate reference for the gene. In some embodiments, at least a 20% to 50% difference in expression between the informative-gene and the appropriate reference is significant. Significant differences can be identified using appropriate statistical tests. Assays for statistical significance are well known in the art and are exemplified in Applied Statistics for Engineers and Scientists by Petrucuccelli, Chen and Nandra 1999 Reprint Ed.
It is understood that, in order to assess the lung cancer status of a subject, a plurality of expression levels may be compared to a plurality of suitable reference levels, e.g., on a gene-by-gene basis. The comparison may be performed as a vector difference. In such cases, multivariate tests (e.g., the Hotelling T2 test) can be used to assess the significance of the observed differences. Such Multivariate assays are well known in the art and are exemplified in Applied multivariable Statistical Analysis by Richard Arnold Johnson and Dean W.Wicher Prentice Hall; 6th edition (April 2,2007).
Classification method
The method may also involve comparing a set of expression levels (referred to as an expression pattern or profile) of informative-genes in a biological sample obtained from the subject to a plurality of reference level sets (referred to as reference patterns), each reference pattern being associated with a known lung cancer status, identifying a reference pattern that most closely resembles the expression pattern, and correlating the known lung cancer status of the reference pattern to the expression pattern, thereby classifying (characterizing) the lung cancer status of the subject.
The method may also involve building or constructing a predictive model, which may also be referred to as a classifier or predictor, that can be used to classify the disease state of the subject. As used herein, a "lung cancer classifier" refers to a predictive model that characterizes the lung cancer status of a subject based on expression levels determined in a biological sample obtained from the subject. Typically, the model is constructed using samples whose classification (lung cancer status) has been determined early. Once the model (classifier) is constructed, it can be applied to expression levels obtained from biological samples of a subject whose lung cancer status is unknown to predict the lung cancer status of the subject. As such, the method may involve applying a lung cancer classifier to the expression level, such that the lung cancer classifier characterizes the lung cancer status of the subject based on the expression level. The subject can be further treated or evaluated based on the predicted lung cancer status, e.g., by a health care provider.
The classification method may involve converting the expression level into a lung cancer risk score that indicates a likelihood that the subject has lung cancer. In some embodiments, such as, for example, when using a linear discriminant classifier, the lung cancer risk score may be obtained as a combination (e.g., sum, product, or other combination) of weighted expression levels, wherein the expression levels are weighted by their relative contributions to an increased likelihood of being predicted to have lung cancer.
It will be appreciated that a variety of predictive models known in the art may be used as a lung cancer classifier. For example, the lung cancer classifier can comprise an algorithm selected from logistic regression, partial least squares, linear discriminant analysis, quadratic discriminant analysis, neural networks, naive bayes, C4.5 decision trees, k-nearest neighbors, random forests, support vector machines, or other suitable methods.
A lung cancer classifier can be trained on a data set comprising expression levels of a plurality of informative-genes in biological samples obtained from a plurality of subjects identified as having lung cancer. For example, a lung cancer classifier can be trained on a data set comprising expression levels of a plurality of informative-genes in biological samples obtained from a plurality of subjects identified as having lung cancer based on histological findings. Typically, the training set will also contain control subjects identified as not having lung cancer. As the skilled artisan will appreciate, a population of subjects of the training data set may intentionally have a variety of characteristics, for example, the characteristics of the population may depend on the characteristics of the subject for which a diagnostic method using the classifier may be useful. For example, the population may consist entirely of males, entirely of females, or both males and females. The population may consist of subjects with a history of cancer, subjects without a history of cancer, or subjects from both categories. The population can include subjects that are smokers, former smokers, and/or non-smokers.
Class prediction power may also be measured to determine the degree of confidence that the model classifies the biological sample. This degree of confidence can be used as an estimate of the likelihood that the subject belongs to the particular class predicted by the model.
Thus, the prediction strength conveys the degree of confidence in the classification of the sample and assesses when the sample cannot be classified. There may be cases where a sample is tested, but it does not belong to, or cannot be reliably assigned to, a particular class. This may be accomplished, for example, by utilizing a threshold or range, where samples having scores above or below the determined threshold or within a particular range are not samples that cannot be classified (e.g., "no calls").
Once the model is constructed, the model can be tested for validity using methods known in the art. One way to test the validity of the model is through cross-validation of data sets. To perform cross-validation, one or a subset of the samples are eliminated and a model is constructed as described above without the eliminated samples, forming a "cross-validation model". The eliminated samples were then classified according to the model as described herein. This process is performed on all or a subset of the initial data set and error rates are determined. The accuracy of the model is then evaluated. Such a model classifies samples to be tested with high accuracy for known classes or classes that have been previously confirmed. Another way to validate the model is to apply the model to a separate data set, such as a new biological sample with an unknown lung cancer status.
As the skilled artisan will appreciate, the dynamics of the model may be evaluated by a variety of parameters, including but not limited to accuracy, sensitivity, and specificity. Methods for computational accuracy, sensitivity and specificity are known in the art and described herein (see, e.g., the examples). The lung cancer classifier can have an accuracy of at least 60%, at least 65%, at least 70%, at least 75%, at least 80%, at least 85%, at least 90%, at least 95%, at least 99%, or more. The lung cancer classifier may have an accuracy in a range of about 60% to 70%, 70% to 80%, 80% to 90%, or 90% to 100%. The lung cancer classifier can have a sensitivity of at least 60%, at least 65%, at least 70%, at least 75%, at least 80%, at least 85%, at least 90%, at least 95%, at least 99%, or more. The lung cancer classifier may have a sensitivity in a range of about 60% to 70%, 70% to 80%, 80% to 90%, or 90% to 100%. The lung cancer classifier can have a specificity of at least 60%, at least 65%, at least 70%, at least 75%, at least 80%, at least 85%, at least 90%, at least 95%, at least 99%, or more. The lung cancer classifier may have a specificity in a range of about 60% to 70%, 70% to 80%, 80% to 90%, or 90% to 100%.
A Negative Predictive Value (NPV) that excludes lung cancer in a population of intended uses may be greater than 40%, 41%, 42%, 43%, 44%, 45%, 46%, 47%, 48%, 49%, 50%, 51%, 52%, 53%, 54%, 55%, 56%, 57%, 58%, 59%, 60%, 61%, 62%, 63%, 64%, 65%, 66%, 67%, 68%, 69%, 70%, 71%, 72%, 73%, 74%, 75%, 76%, 77%, 78%, 79%, 80%, 81%, 82%, 83%, 84%, 85%, 86%, 87%, 88%, 89%, 90%, 91%, 92%, 93%, 94%, 95%, 96%, 97%, 98%, or 99%.
A population of intended uses may have a cancer prevalence at or about 40%, 41%, 42%, 43%, 44%, 45%, 46%, 47%, 48%, 49%, 50%, 51%, 52%, 53%, 54%, 55%, 56%, 57%, 58%, 59%, 60%, 61%, 62%, 63%, 64%, 65%, 66%, 67%, 68%, 69%, 70%, 71%, 72%, 73%, 74%, 75%, 76%, 77%, 78%, 79%, 80%, 81%, 82%, 83%, 84%, 85%, 86%, 87%, 88%, 89%, 90%, 91%, 92%, 93%, 94%, 95%, 96%, 97%, 98%, or 99%.
Clinical treatment/management
In certain aspects, methods are provided for determining a course of treatment for a subject. Typically, the method involves determining the expression level of one or more informative-genes in a biological sample obtained from the subject and determining a course of treatment for the subject based on the expression level. Typically, the course of treatment is determined based on a lung cancer risk score derived from the expression level. The subject may be identified as a candidate for a lung cancer therapy based on a lung cancer risk score indicating that the subject has a relatively high likelihood of having lung cancer. The subject may be identified as a candidate for an invasive lung procedure (e.g., transthoracic needle puncture, mediastinoscopy, or thoracotomy) based on a lung cancer risk score (e.g., greater than 60%, greater than 70%, greater than 80%, greater than 90%) that indicates the subject has a relatively high likelihood of having lung cancer. The subject may be identified as not being a candidate for a lung cancer therapy or an invasive lung procedure based on a lung cancer risk score (e.g., less than 50%, less than 40%, less than 30%, less than 20%) that indicates the subject has a relatively low likelihood of having lung cancer. In some cases, an intermediate risk score is obtained and does not indicate that the subject is in a high risk or low risk category. In some embodiments, shortly after making the risk determination, the healthcare provider may participate in a "stay watch" and repeat the analysis of the biological sample taken at one or more later time points, or take further diagnostic procedures to rule out lung cancer, or make a determination that cancer is present. In one particular example, non-invasive monitoring (such as CT monitoring) is reassigned as non-diagnostic bronchoscopy identifies a subject as at intermediate risk and follows the determination that the patient is at low risk of cancer using the methods herein. In another specific example, a sample determined as described herein may be used. The method may also involve creating a report summarizing the results of the gene expression analysis. Typically, the report will also include a score indicating the risk of lung cancer.
Computer executing method
The methods disclosed herein may be performed in any of numerous ways. For example, certain embodiments may be implemented using hardware, software, or a combination thereof. When implemented in software, the software code can be executed on any suitable processor or collection of processors, whether provided in a single computer or distributed among multiple computers. Such processors may be implemented as integrated circuits, with one or more processors in one integrated circuit assembly. However, the processor may be implemented using any suitable type of circuitry.
Moreover, it should be appreciated that a computer may be embodied in any of a number of forms, such as a rack-mounted computer, a desktop computer, a laptop computer, or a tablet computer. Additionally, a computer may be embodied as a device not generally regarded as a computer but having suitable processing capabilities, including a Personal Digital Assistant (PDA), a smart phone, or any other suitable portable or stationary electronic device.
Also, a computer may have one or more input and output devices. These devices may be used to present, among other things, a user interface. Examples of output devices that can be used to provide a user interface include printers or display screens for visual presentation of output and speakers or other sound-producing devices for audible presentation of output. Examples of input devices that can be used for a user interface include keyboards, and pointing devices, such as mice, touch pads, and digitizing tablets. As another example, a computer may receive input information via speech recognition or in other forms of audio.
Such computers may be interconnected to one or more networks in any suitable form, including as a local area network or a wide area network, such as an enterprise network or the Internet. Such networks may be based on any suitable technology and may operate according to any suitable protocol and may include wireless networks, wired networks, or fiber optic networks.
Also, the various methods or processes outlined herein may be coded as software that is executable on one or more processors that employ any one of a variety of operating systems or platforms. Additionally, such software may be written using any of a number of suitable programming languages and/or programming or scripting tools, and may also be compiled as executable machine language code or intermediate code that is executed on a framework or virtual machine.
In this regard, aspects of the disclosure may be embodied as a computer readable medium (or multiple computer readable media) (e.g., a computer memory, one or more floppy discs, Compact Discs (CDs), compact discs, Digital Video Discs (DVDs)), magnetic tapes, flash memories, circuit configurations in field programmable gate arrays or other semiconductor devices, or other non-transitory tangible computer storage medium) encoded with one or more programs that, when executed on one or more computers or other processors, perform methods that perform the various embodiments of the disclosure discussed above. The computer readable medium may be transportable, such that the program stored thereon can be loaded onto one or more different computers or other processors to perform various aspects of the present disclosure as discussed above. As used herein, the term "non-transitory computer-readable storage medium" encompasses only computer-readable media that can be considered an article of manufacture (i.e., an article of manufacture) or a machine.
The terms "program" or "software" are used herein in a generic sense to refer to any type of computer code or set of computer-executable instructions that can be employed to program a computer or other processor to perform various aspects of the present disclosure as discussed above. Additionally, it should be appreciated that in accordance with one aspect of this embodiment, one or more computer programs that when executed perform methods of the present disclosure need not reside on a single computer or processor, but may be distributed in a modular fashion amongst a number of different computers or processors to perform various aspects of the present disclosure.
As used herein, the term "database" generally refers to a collection of data arranged for ease and speed of searching and retrieval. Moreover, databases typically contain logical and physical data structures. Those skilled in the art will recognize that the methods described herein may be used with any type of database including relational databases, object relational databases, and XML-based databases (where XML stands for "extensible markup language"). For example, gene expression information may be stored and retrieved from a database. Gene expression information may be stored or indexed in a manner that correlates the gene expression information with a variety of other relevant information, such as information related to creating reports or documents that assist physicians in establishing treatment protocols and/or making diagnostic determinations or information that assist in tracking patient samples. Such relevant information may include, for example, patient identification information, ordering physician identification information, information about the ordering physician's office (e.g., address, telephone number), information about the source of the biological sample (e.g., tissue type, date sampled), biological sample processing information, sample quality control information, biological sample storage information, gene annotation information, lung cancer risk classifier information, lung cancer risk factor information, payment information, order date information, and the like.
Computer-executable instructions may be in many forms, such as program modules, executed by one or more computers or other devices. Generally, program modules include routines, programs, objects, components, data structures, etc. that perform particular tasks or implement particular abstract data types. Typically, the functionality of the program modules may be combined or distributed as desired in various embodiments.
In some aspects of the disclosure, a computer-implemented method for processing genomic information is provided. The method generally involves obtaining data representative of the expression level of one or more informative-genes in a biological sample, and determining a likelihood that the subject has lung cancer based at least in part on the expression level. Any of the statistical or classification methods disclosed herein may be incorporated into a computer-implemented method. In some embodiments, the method involves calculating a risk score that indicates a likelihood that the subject has lung cancer. Calculating a risk score may involve determining a combination (e.g., sum, product, or other combination) of weighted expression levels, where the expression levels are weighted by their relative contributions to predicting an increased likelihood of having lung cancer. The computer-implemented method may also involve generating a report summarizing the results of the gene expression analysis, such as by specifying a risk score. Such methods may also involve transmitting the report to the health care provider of the subject.
Affymetrix array
In some aspects, the Affymetrix human gene 1.0ST array (Affymetrix catalog No. 901087) is used to identify mRNA or cDNA in a biological sample. Affymetrix human gene 1.0ST arrays utilize numerous probes disclosed at www.affymetrix.com/site/include/bypass. There are multiple probes corresponding to segments of a particular gene, that is, instead of a 1:1 ratio of one probe per gene, there are multiple probes corresponding to multiple segments of one gene. In one example, the LYPD2 gene is represented by three probe sets in a human Gene 1.0ST array (version 32), probe-based IDs 8153343, 8153344, and 8153345, as disclosed in the Affymetrix human Gene 1.0ST array (HuGene-1_0-ST-v1 Probe set notes exemplary suitable constructs for the array include version 32(09/30/2011), version 33(03/27/2013), version 34(04/07/2014), version 35(04/15/2015), and version 36). Other versions, including future versions, may also be used. Com, including www.affymetrix.com/site/include/bypass. affxproduct ═ hue-1-0-st-v 1. In addition, datasets are available at www.ncbi.nlm.nih.gov/geo/query/acc. cgiac ═ GPL6244 on the NCBI Gene Expression Omnibus website under Platform GPL6244, which details probes and genes that can be used to implement the methods of the present disclosure. These documents, including those relating probe sets and gene signatures, are incorporated herein by reference.
Compositions and kits
In some aspects, compositions and related methods are provided that can be used to determine the expression level of informative-genes. For example, a composition consisting essentially of a nucleic acid probe that specifically hybridizes to an informative-gene or to a nucleic acid having a sequence complementary to an informative-gene is provided. These compositions may also include probes that specifically hybridize to a control gene or to a nucleic acid complementary thereto. These compositions may also include suitable buffers, salts or detection reagents. The nucleic acid probes may be immobilized directly or indirectly to a solid support (e.g., glass, plastic, or silicon chip) or beads (e.g., magnetic beads). Nucleic acid probes can be tailored for use in bead-based nucleic acid detection assays.
In some embodiments, provided are compositions comprising up to 5, up to 10, up to 25, up to 50, up to 100, or up to 200 nucleic acid probes. In some cases, each nucleic acid probe specifically hybridizes to an mRNA selected from table 11 or to a nucleic acid having a sequence complementary to the mRNA. In some embodiments, probes for detecting informative mRNA are also included. In some cases, at least 2, at least 3, at least 4, at least 5, at least 6, at least 7, at least 8, at least 9, at least 10, or at least 20 nucleic acid probes each specifically hybridize to an mRNA selected from table 11 or to a nucleic acid having a sequence complementary to the mRNA. In some embodiments, the composition is prepared for detecting different genes in biochemically separate reactions, or for detecting multiple genes in the same biochemical reaction. In some embodiments, the composition is prepared for performing multiple reactions.
Also provided herein are oligonucleotide (nucleic acid) arrays useful in methods for simultaneously determining the levels of multiple informative-genes. Such arrays may be obtained or produced from commercial sources. Methods for generating nucleic acid arrays are also well known in the art. For example, a nucleic acid array can be constructed by immobilizing to a solid support a plurality of oligonucleotides, polynucleotides, or cdnas that are capable of hybridizing to nucleic acids corresponding to genes or portions thereof. Those skilled In the art can see Current Protocols In Molecular Biology (eds. Ausubel et al John Wiley and # 38; Sons NY,2000) Chapter 22 "Nucleic Acid Arrays" or Liu CG, et al, oligonucleotide microarray for genome-derived microRNA profiling In human and mouse tissues, Proc Nall Acad Sci USA 2004Jun 29; 101(26) 9740-4, which provide non-limiting examples of methods related to nucleic acid array construction and use in detecting nucleic acids of interest. In some embodiments, the array comprises or consists essentially of at least 2, at least 5, at least 10, at least 20, at least 50, at least 60, at least 70, or more informative-gene binding probes. In some embodiments, the array comprises or consists essentially of at most 2, at most 5, at most 10, at most 20, at most 50, at most 60, at most 70, or more informative-gene binding probes. In some embodiments, the array comprises or consists of 1,2, 3, 4, 5, 6, 7,8, 9, or 10 mrnas selected from table 11. In some embodiments, the array comprises or consists of 4, 5, or 6 mrnas selected from table 11. Kits comprising the oligonucleotide arrays are also provided. The kit can include a nucleic acid labeling reagent and instructions for using the array to determine the expression level.
The compositions described herein can be provided as a kit for determining and assessing the expression level of informative-genes. The compositions may be assembled into diagnostic or research kits to facilitate their use in diagnostic or research applications. A kit may include one or more containers containing the components of the disclosure and instructions for use. In particular, such kits may include one or more of the compositions described herein, along with instructions describing the intended use and appropriate use of the compositions. The kit may contain suitable concentrations or amounts of the components for running the various experiments.
The kits can be designed to facilitate use of the methods described herein by a researcher, health care provider, diagnostic laboratory, or other entity, and can take many forms. Each composition of the kit (where applicable) may be provided in liquid form (e.g. as a solution) or in solid form (e.g. as a dry powder). In certain instances, some compositions may be structured or otherwise processable, for example, by the addition of suitable solvents or other materials, which may or may not be provided with the kit. As used herein, "instructions" may define components of instructions and/or promotions, and generally relate to written instructions on or associated with the packaging of the present disclosure. The instructions may also include any oral or electronic instructions provided in any manner that will allow a user to clearly recognize that the instructions are associated with the kit, such as audiovisual (e.g., video tape, DVD, etc.), internet, and/or network-based communication, etc. The written instructions may be in the form prescribed by a governmental agency regulating the manufacture, use or sale of diagnostic or biological products, which may also reflect approval by the agency.
The kit may contain any one or more of the ingredients described herein in one or more containers. For example, in one embodiment, the kit can include instructions for mixing one or more components of the kit and/or separating and mixing the samples and applying to the subject. The kit may include a container holding a medicament described herein. The ingredient may be in the form of a liquid, gel or solid (e.g. powder). The composition can be prepared aseptically and transported refrigerated. Alternatively, they may be contained in vials or other containers for storage. The second container may have other ingredients prepared aseptically.
As used herein, the term "about" or "approximately" in reference to a numerical value is generally considered to include values that fall within a range of 1%, 5%, 10%, 15%, or 20% in either direction (greater or less) unless otherwise indicated or otherwise evident from the context (unless such values would be less than 0% or more than 100% of the possible value).
All references described herein are incorporated by reference for the purposes described herein.
Exemplary embodiments of the present disclosure will be described in more detail by the following examples. These embodiments are illustrative of the present disclosure, and those skilled in the art will recognize that the present disclosure is not limited to the illustrative embodiments.
Examples
Example 1: development of microarray-based predictive models
Introduction to the word
This embodiment describes a method for developing a predictive algorithm. A final optimized model is described, comprising combinations of genes used in the model. The method uses clinical factor genomic association (CFGC) to aid in the selection of cancer-specific signatures.
The goal is to develop and characterize a new cancer prediction model that is effective in predicting lung cancer status after considering gene expression signatures more specifically attributed to clinical factors through derivative genomic associations. Genomic association is defined herein as a gene expression algorithm that predicts specific clinical features, such as subject gender, smoking status, and smoking history.
One goal is to develop a prediction algorithm that satisfies the following specific performance characteristics:
greater than 90% of Negative Predictive Values (NPV) excluding lung cancer in the intended use population, and greater than 85% of NPV in subjects diagnosed with COPD.
Materials and methods
Sample processing and analysis
Clinical specimens were collected from patients scheduled to receive bronchoscopy for suspected lung cancer. Bronchial Epithelial Cells (BECs) were collected from the subject's main stem bronchi using a standard bronchial brush during the scheduled bronchoscopy procedure.
Samples were analyzed on gene expression microarrays using the Gene 1.0ST microarray (Affymetrix). Pairwise correlation analysis was performed on the array data to identify outliers (described herein). A total of 597 samples were retained as the final data set. The data set is then split into training and validation sets of equal size in a randomized fashion.
The prediction algorithm is developed using microarray CEL files. Subjects were first assigned to independent training and validation sets, and gene selection and optimization of the predictive models were performed within the training sets. The model is optimized and locked, and then predictive validated, the cancer status of the pooled samples.
Standardization/batch adjustment
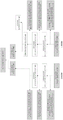
RMA was used to calculate gene expression values from the Gene 1.0ST (Affymetrix) CEL file. Batch effects were corrected using ComBat batch adjustments. All samples were analyzed in 5 separate microarray experiments (i.e., batches). Training and test samples were combined in RMA and ComBat preprocessing. As previously described, subsequent development is limited to the training set. CEL files corresponding to samples with RIN scores less than 4 were excluded, as were samples with mean pair associations less than.955 (see fig. 1).
Genome association
Genome association was established as a gene expression signature that accurately predicts the corresponding clinical features. The genomic associations are combined in a prediction algorithm, with separate genes that predict the cancer state. The following associations of clinical characteristics were developed and evaluated:
sex
Smoking status (current to former)
History of smoking (bag-year; PY)
Age (age)
The genomic association was developed by selecting the top ranked genes that distinguish the clinical features of interest and fitting those genes to the model using logistic regression. The scoring of the clinical profile is based on gene expression of those selected genes.
Both models were developed in parallel to test simultaneously in the validation set. The first model (score 1) is based on the methods described herein and factors the reported age into the prediction algorithm as well as the genomic signature. A second model (score 2) was developed using genomic association of age and then incorporated into the prediction algorithm.
Initial Gene selection
Logistic regression of cancer status (0/1) versus age, gender, smoking status, and package year was used to develop clinical factor models. Genes were selected using residuals from the clinical factor model, and each gene was tested for association with residuals using an empirical bayesian linear model. The first 232 genes were selected based on p-value and fold change from this model. The first 232 genes are listed in table 11.
clustering/Final Gene selection
Gene selection and model fitting are performed in an automated cross-validation approach to minimize bias during the selection process and provide a robust final selection. Gene selection consists of the following steps. Hierarchical clustering was used to divide the genes into 11 clusters. The cluster membership for each gene is identified in column 2 of table 11. For each cluster, a cluster mean is computed using all genes within each cluster. A combination of LASSO and inverse selection was used in a repeated random subset of data to identify six clusters consistently selected with independent predictive association with cancer status. Cross-validation is then used to determine the approximate number of genes within each cluster that will retain the predicted strength of the cluster mean.
Gene titration analysis was performed to determine the increased sensitivity of the model to the number of genes from the selected cluster within the final model. This was included as part of the optimization to determine if the complementary gene could add additional clinical sensitivity to the model.
Software
Analysis was performed using R (version 3.01), including software packages rms, limma, verification, and sva.
Results
Derivation of genome associations
Genes were selected using the entire training set to represent clinical features. These "genome-associated genes" represent clinical factors as accurately as possible based on a minimal set of genes. Genomic Gender (GG) was defined with 100% accuracy using a single gene. The values are set as follows: if RPS4Y1< threshold, GG ═ 1 (male), otherwise GG ═ 0 (female).
For genomic smoking status, genes were screened based on the empirical bayesian t-test. The first gene for p-value was included in the logistic regression model, where smoking status is the dependent variable. The resulting predicted Genomic Smoking (GS) values were derived from this model (using gene symbols to represent relative expression intensities), where,
wherein
Is the regression weight of the genomic regression model, and GS ═ exp (x) (1+ exp (x)).
For the years of genome, genes were screened based on the empirical bayesian t test. Inclusion of p-valued alleles in logistic regression models, where the age of the package<10 is a dependent variable. The resulting predicted genomic annual number (GPY) value is derived from this model, where,
wherein
Is the regression weight of the genome years regression model, and GPY ═ exp (x)/(1+ exp (x)).
For genome age, genes were screened based on an empirical bayesian linear model. The p-value of the first gene was included in a penalized linear regression model (LASSO) where age (in years) is the dependent variable. The resulting predicted Genomic Age (GA) values are derived from this model, where,
wherein
Is the regression weight of the genomic age regression model.
Derivation of cancer genes
The first 232 genes were initially selected, followed by narrowing down the selected genes using clustering analysis as described in the methods section.
Cross-validation is then used to determine the approximate number of genes within each cluster that will retain the predicted strength of the cluster mean. This number was found to be between 2 and 4 genes per cluster. The final gene selection within each cluster was based on the p-value, fold change, and evidence intensity of cancer associations from the literature. The cluster mean is recalculated using the reduced set of genes within each cluster as follows:
mean of CIA ═ values (BST1, CD177.1, CD177.2)
Mean of C1B ═ (ATP12A, TSPAN2)
Mean of C2 ═ C (GABBRI, MCAM, NOVA1, SDC2)
Mean of (CDR1, CGREF1, CLND22, NKX3-1) C3 ═ C
Mean value of C4A ═ e (EPHX3, LYPD2)
C4B ═ mean (MIA, RNF 150).
Description of the final model
To evaluate the final model coefficients, a penalized logistic regression model was used, with age (in years), Genomic Gender (GG), genomic smoking status (GS), genomic group years (GPY), and 6 reduced gene cluster means (labeled CIA, C1B, C2, C3, C4A, C4B) as independent predictors and cancer status (0/1) as dependent variables. Penalty factor (λ), 0 for clinical/genomic association, 10 for each gene expression cluster. The second model was constructed using the same approach but replacing age with Genomic Age (GA) as defined above. The model coefficients are then re-evaluated.
The final classification algorithm is of the form:
xscore 1=W0+W1 x GG+W2 x GS+W3 x GPY+W4x reported age + W5 x C1A+W6 x C1B+W7x C2+W8 x C3+W9 x C4A+W10 x C4B
XScore 2=W0+W1 x GG+W2 x GS+W3 x GPY+W4 x GA+W5 x C1A+W6 x C1B+W7 x C2+W8 x C3+W9 x C4A+W10 x C4B。
The logistic regression score is then converted to a predicted score ranging from 0 to 1 using the following equation:
evaluation of predictive models
A cross-validation approach was used in which the training set samples were randomly split (90:10) into training and test sets, respectively. Clinical accuracy was recorded and the process was repeated 100-fold. The scores of the training set are reported as the average of the total iterations for each sample. Results are reported in ROC curves, AUC, and sensitivity and specificity after defining score thresholds to yield 50% specificity and maximize clinical sensitivity.
Scores for all training set samples were generated and compared to the recorded clinical status. For the ROC curves for score 1 and score 2, all samples are shown in fig. 2 and bronchoscopy negative samples are shown in fig. 3. For AUC, all samples were calculated with a score of 1-0.803 and a score of 2-0.785, and the bronchial negative set was calculated with a score of 1-0.808 and a score of 2-0.778. Table 1 provides a list of informative genes used in the predictive score model. Table 1.1 provides a non-limiting list of probe sequences used to detect expression of such genes.
Table 1: gene lists and functions
Table 1.1: non-limiting examples of Probe sequences for detecting informative genes
Table 2 below provides a summary of the performance characteristics of the two models for bronchoscopy negative subjects in the training set. The number of bronchi negative subjects (N) corresponds to CA + subjects for sensitivity and CA-subjects for specificity.
NPV was calculated assuming a 50% prevalence of cancer combined with the sensitivity and specificity of the observed bronchoscopy and prediction models.
Model performance
The calculation of the sensitivity and specificity of the predictive model (based on scores 1 and 2) was performed using specific score thresholds to distinguish between predictions of CA + and CA-samples. The same threshold (model score 0.65) selected in the training set for both models was used in the validation set. The predictive accuracy of both models was first determined in bronchoscopy negative samples (cases of intended use) and summarized in
The sensitivity of the predictive model is also calculated for several sub-sets of domains within the validation set. The results of these two models are shown in tables 3-9. The sub-categories contained different numbers of samples affecting the confidence interval.
Table 3-sensitivity of prediction model as a function of the block size of the observed lesions-score 1
| Block size
|
N
|
Sens Sens.
|
Sens.
|
PM+BRSens.
|
| <1
|
13
|
100.00%
|
83.30%
|
100.00%
|
| 1 to 2
|
35
|
87.50%
|
50.00%
|
100.00%
|
| 2 to 3
|
41
|
90.60%
|
53,10%
|
96.90%
|
| >3
|
155
|
85.10%
|
79.40%
|
95.00%
|
| Impregnating compound
|
32
|
100.00%
|
100.00%
|
100.00%
|
| Is unknown
|
21
|
100.00%
|
80.00%
|
100.00% |
PM is a prediction model; BR bronchoscopy
Table 4-sensitivity of prediction model as a function of block size of observed lesions-score 2
| Block size
|
N
|
PMs.
|
Senens.
|
|
| BR Sens.
|
PM+BR S
|
|
|
|
| <1
|
13
|
66.70%
|
83.30%
|
100.00%
|
| 1 to 2
|
35
|
87.50%
|
50.00%
|
93.80%
|
| 2 to 3
|
41
|
81.30%
|
53.10%
|
93.80%
|
| >3
|
155
|
83.00%
|
79.40%
|
95.70%
|
| Impregnating compound
|
32
|
90.00%
|
100.00%
|
100.00%
|
| Unknown
|
21
|
100.00%
|
80.00%
|
100.00% |
TABLE 5 sensitivity of the predictive model as a function of localization of observed lesions in the Lung (score 1)
| Block size
|
N
|
PM Sens
|
BR Sens
|
PM+BRSens
|
| Center (C)
|
97
|
84.40%
|
79.20%
|
93.50%
|
| Ambient
|
86
|
90.70%
|
61.10%
|
96.30%
|
| Both of them
|
90
|
90.50%
|
78.40%
|
100.00%
|
| Unknown
|
25
|
86.70%
|
80.00%
|
93.30% |
Table 6-sensitivity of the predictive model as a function of localization of observed lesions in the lung (score 2)
Table 7-sensitivity of predictive model as a function of cancer subtype as determined in pathology (score 1)
| Cancer type
|
N
|
P M Sens.
|
BR Sens.
|
PM+BR Sens.
|
| AC
|
67
|
83.60%
|
70.10%
|
94.00%
|
| SCC
|
72
|
94.40%
|
75.00%
|
95.80%
|
| LC
|
7
|
71.40%
|
85.70%
|
100.00%
|
| NSCLC
|
26
|
92.30%
|
73.10%
|
76.90%
|
| SCLC
|
37
|
89.20%
|
86.50%
|
97.30%
|
| NSCLC/SCLC
|
2
|
50.00%
|
100.00%
|
100,00%
|
| Is unknown
|
86
|
75.00%
|
37.50%
|
100.00% |
Table 8-sensitivity of predictive model as a function of cancer subtype as determined in pathology (score 2)
| Cancer type
|
N
|
PM Sens.
|
BR Sens.
|
PM+BR Sens.
|
| AC
|
67
|
80,60%
|
70.10%
|
94,00%
|
| SCC
|
72
|
87.50%
|
75.00%
|
97.20%
|
| LC
|
7
|
85.70%
|
85.70%
|
100.00%
|
| NSCLC
|
26
|
69.20%
|
73.10%
|
80.80%
|
| SCLC
|
37
|
89.20%
|
86.50%
|
97.30%
|
| NSCLC/SCLC
|
2
|
0.00%
|
100.00%
|
100.00%
|
| Is unknown
|
86
|
62.50%
|
37.50%
|
87.50% |
PM is a prediction model; BR bronchoscopy
TABLE 9 sensitivity of predictive models as a function of cancer stage
Comparison of Performance in training and validation sets
The overall prediction accuracy of the prediction model is compared in the training and validation set to assess the reproducibility of the model in the individual branches. The results are provided in table 10.
TABLE 10 comparison of sensitivity, specificity and AUC for the two models in the training and validation set
No significant differences in sensitivity or specificity were observed between the training and validation sets for either model (p > 0.05). Also, for each model, small differences in AUC between the two branches were not statistically significant (based on p > 0.05). The sensitivity and specificity of the bronchi negative samples were also similar compared to all samples (combined bronchi negative and bronchi positive). There was a relatively small decrease in overall performance between score 1 and score 2, with score 2 showing a 2-4% point decrease in AUC compared to score 1.
Table 11: 232 differentially expressed genes and cluster membership
Example 2: validation of bronchial genome classifier for lung cancer patients undergoing diagnostic bronchoscopy
Introduction to the word
Bronchoscopy is often non-diagnostic in patients with lung lesions suspected of having lung cancer. This often leads to additional invasive testing, although many lesions are benign. We sought to validate a bronchial gene expression classifier that could improve the diagnostic performance of bronchoscopy.
Lesions suspected of lung cancer are often identified in breast imaging. The decision whether to perform surveillance imaging or to require invasive assessment of tissue sampling is complex and requires assessment of the likelihood of malignancy, the ability to biopsy, surgical risk, and patient preference [1 ]. When a biopsy is required, the procedure may include bronchoscopy, transthoracic needle biopsy (TTNB), or Surgical Lung Biopsy (SLB). The choice between these modalities is usually determined by considerations such as lesion size and location, presence of adenosis, risk of the procedure and local expertise. Bronchoscopy is a safe procedure with fewer than 1% pneumothorax complications [2 ]. Approximately 500,000 bronchoscopies are performed annually in the united states [3], of which about half are used for diagnostic examinations of lung cancer. Bronchoscopy, however, is limited by its sensitivity, ranging between 34-88%, depending on the location and size of the lesion [4 ]. Even with newer bronchoscopic guidance techniques, the sensitivity to peripheral lesions is only about 70% [5 ].
Patients with non-diagnostic bronchoscopy often undergo further invasive tests to establish a definitive diagnosis. Given the inherent risks, the complications are about 5%, the 30-day mortality is about 1%, and SLB is not the preferred approach [6 ]. Importantly, SLB is administered at 20-25% in patients who are ultimately diagnosed with benign lesions [7,8 ]. Furthermore, TTNB is associated with significant morbidity, including 15% pneumothorax rate [9], with 6% requiring chest tube drainage [10,11 ]. In view of the deficiencies of invasive procedures, alternative approaches are needed to identify patients with a low likelihood of malignancy suitable for imaging surveillance.
The use of gene expression measurements in clinical specimens to classify biological disease states, including cancer, is well established [12 ]. In the setting of lung cancer, there is a unique pattern of cancer-associated gene expression in cytologically normal epithelia collected from the proximal airways of smokers [13 ]. Recently, we developed a gene expression classifier (manuscript submitted) that distinguishes patients with and without lung cancer among Bronchial Epithelial Cells (BECs) collected from the main stem bronchi via bronchoscopy in current and former smokers. We performed the present study to validate this classifier and to evaluate how this classifier changes the diagnostic performance of bronchoscopy in two prospective multicenter trials for patients undergoing bronchoscopy for suspected lung cancer.
Materials and methods
Study design, population, and protocol
AEGIS 1 and AEGIS 2 were enrolled for current and former smokers suspected of undergoing bronchoscopy for lung cancer, two independent, prospective, multicenter observational studies (NCT01309087 and NCT 00746759). Patients were enrolled at 28 sites in the united states, canada, and ireland. Normal-looking BECs were collected from the main dry bronchi using a cell brush and immersed in RNA preservative. The results of the classifier are not reported to the doctor or patient. Patients were screened prior to bronchoscopy to determine if they met the requirements of the study protocol. Exclusion criteria included subjects <21 years of age, never smokers (defined as smoking <100 cigarettes in life), and patients with a concurrent history of cancer or lung cancer. Patients who were >24 hours on a ventilator immediately prior to bronchoscopy, or who were unable to agree or comply with the study, were excluded. Patients were followed until final diagnosis was established or until 12 months after bronchoscopy. A diagnosis of lung cancer is established at the time of a guided bronchoscopy or by subsequent biopsy using TTNB, SLB, secondary bronchoscopy, or other invasive procedures. The specific bronchoscopy method used and the subsequent surveillance imaging or procedures performed after non-diagnostic bronchoscopy were at the discretion of the attending physician. Patients diagnosed as cancer-free had a specific benign diagnosis or radiographic stability/resolution at 12 months of follow-up. Patients with no definitive cancer diagnosis, specific benign diagnosis or stability/resolution in the 12-month follow-up were excluded from further analysis. The attending physician uses a five-scale (< 10%, 10-39%, 40-60%, 61-85%, and > 85%) to assess the pre-test malignancy Probability (POM) for each patient prior to bronchoscopy. The study protocol was approved by the institutional review board of each participating center, and all patients provided informed consent prior to enrollment.
In the united states, canada, and 28 medical centers in ireland, a total of 855 patients in AEGIS 1 and 502 patients in AEGIS 2 were eligible and enrolled between 2009-1 month and 2012-8 months (fig. 4) (table 12). These sites are a mix of tertiary/academic medicine centers (n-20), community hospitals (n-6), and hospitals of the refuge military authority (n-2).
After enrollment, additional patients were excluded from the study based on the following criteria (see fig. 4). First, a total of 111 patients in AEGIS 1 and 71 patients in AEGIS 2 failed due to the following protocol bias: in AEGIS 1, 24 patients either did not meet study registration criteria at the time of review, collected specimens did not meet admission criteria, or were registered but specimens were not collected. After RNA isolation, an additional 87 samples did not meet the minimum QC criteria, either due to RIN score <4 or RNA yield <1 μ g. In AEGIS 2, there were 3 failed patients, and 68 samples that did not meet the RNA minimum QC standard, since the collected specimens did not meet the incoming acceptance criteria. Second, patients diagnosed with non-primary lung cancer were excluded, including 40 patients in AEGIS 1 and 10 patients in AEGIS 2. In addition, patients with no final diagnosis were also excluded from the study at 12 months of review, including 91 subjects in AEGIS 1 and 71 patients in AEGIS 2. Approximately two thirds (n-106) of these 162 patients from AEGIS 1 and 2 lost follow-up after their initial bronchoscopy, while the remaining one third (n-56) had no definitive diagnosis at 12 months after bronchoscopy. Finally, we excluded 16 patients in AEGIS 1 and 9 patients in AEGIS 2, in which gene expression data failed the assay QC standard (described below under the microarray processing method).
The AEGIS 1 branch has previously been divided into equal training and testing sets in a randomized fashion. A training set (n 299 patients) was used to derive a gene expression classifier consisting of 23 genes plus age, and has been described elsewhere (manuscript submitted). In the training set, the classifier was found to have an AUC of 0.78 (95% CI, 0.71-0.85), a sensitivity of 93%, and a specificity of 57% in patients who did not lead to a diagnosis of lung cancer in bronchoscopy (n ═ 134). Current research focuses on the validation of locked classifiers in two independent validation sets.
The baseline demographic and clinical characteristics of the final AEGIS 1 and AEGIS 2 validation sets are compared in table 1. A separate comparison of patients diagnosed with cancer and benign disease within each branch is provided in table 12.
Table 12-AEGIS 1 and AEGIS 2 characteristics of patients in the test set.
a) Taking the median (and interquartile range; IQR) report. P values were calculated using the Mann-Whitney test.
b) P values were calculated for caucasians versus non-caucasians.
Clinical and demographic data for each patient was collected and recorded on a study Clinical Report Form (CRF). Additional pathology and radiology reports were kept in the medical records of each patient and were available for review. All source files are monitored and entered into a database maintained by the research sponsor. The size and location of the lung lesions are obtained from CT scan reports. Subjects were followed up to 12 months after bronchoscopy to collect data for clinical diagnosis. The diagnosis of lung cancer is based on results from pathology, and copies of pathology reports are collected from the medical center. Specimens leading to clinical diagnosis of cancer are obtained either during bronchoscopy or from subsequent invasiveness when bronchoscopy is non-diagnostic. Data for all clinical protocols performed after non-diagnostic bronchoscopy were collected during the study. The patient was then assessed with non-diagnostic bronchoscopy at the discretion of the attending physician at each study center. In some cases, more than one protocol is required to successfully make a diagnosis after bronchoscopy, but in all cases, protocols leading to a diagnosis of lung cancer are collected. Invasive follow-up procedures are defined as secondary bronchoscopy, TTNB, or Surgical Lung Biopsy (SLB), which may include mediastinoscopy, thoracoscopy, open chest surgery, or Video Assisted Thoracoscopy (VATS).
The records of patients not diagnosed with cancer undergo a decision process to declare the subject cancer-free. The process consisted of a panel of five pulmonologists reviewing the available medical records for each patient. Two pulmonologists from this group examined each case independently and determined that the patient was cancer-free if he/she met one of the following criteria: patient diagnosis is other diagnosis that explains the initial suspected abnormality, and the abnormality determination is stable or the abnormality is resolved. Patients who did not meet these criteria at the end of the 12-month follow-up period had no final diagnosis and were excluded from further analysis of the study.
Patients diagnosed with primary lung cancer were analyzed for histology (table 13) and cancer staging (table 14) data. Data was extracted from the study CRF and confirmed by examination of the complete medical record. Of all cancers, 80% (175/220; 95% CI, 74-84%) in AEGIS 1 and 83% (222/267; 95% CI, 78-87%) in AEGIS 2 are NSCLC. There were 17% (38/220; 95% CI, 13-23%) and 16% (42/26795% CI, 12-21%) SCLC cancers, respectively. Early stages (stages I and 2) were present in 40% of AEGIS 1 (53/139; 95% CI, 32-48%) and 37% of AEGIS 2 (67/199; 95% CI, 30-44%) in NSCLC patients with known cancer staging data.
Table 13-summary of demographic and clinical characteristics of study participants: a comparison of AEGIS 1 versus AEGIS 2 patients was performed across all clinical features. Significant differences are indicated by p <.05, p <. 001. Ethnic p-values were calculated for caucasian versus non-caucasian and histological p-values for lung cancer using NSCLC versus SCLC.
Table 14-staging data for patients diagnosed with primary lung cancer.
Data on each benign diagnosis was extracted from the medical records and summarized in table 15. In both studies, approximately two-thirds of cancer-free subjects had other diagnoses, with the particular other diagnosis for each study being listed in table S4. The diagnosis of patients with abnormalities determined to have resolved or stabilized is based on review of medical records, including follow-up imaging at 12 months post-bronchoscopy, and approximately one-third of cancer-free patients were in this category in both studies.
TABLE 15 additional diagnosis of patients with benign disease
During clinically indicated bronchoscopies, study participants underwent mucobrush-like collection of right or left main bronchi using standard disposable cell brushes rubbed against the bronchial wall. Obtaining two brush samples from each subject; physicians were trained to obtain a brush of epithelial tissue that appeared normal and avoid sampling of tumor tissue or dysplastic cells. All samples were stored in RNA preservatives (RNAProtect; Qiagen) and shipped to a central CLIA certified laboratory for entry and processing. The center was required to store samples at 4 ℃ for up to 14 days and transported below ambient temperature (4-20 ℃) using 2 day transport and insulated transport containers (NanoCool) provided by the sponsor.
Laboratory method
Treating all BEC samples prior to gene expression analysis to isolate and analyze RNA quality and yield; only samples with RNA yields of at least 1. mu.g and RIN scores >4 were run on Gene-ST 1.0 microarrays. All microarray data has been saved as GSE66499 to GEO.
The samples were lysed and RNA was isolated using a column-based method (miRNeasy kit; Qiagen) and manufacturer recommended protocols. Large RNA fractions were analyzed on a spectrophotometer (Nanodrop; ThermoFisher) to determine concentration, purity, and yield. Samples were also analyzed for RNA integrity (Bioanalyzer) and reported as RIN scores. Samples with yield <1 μ g and RIN score <4 were excluded from the study. Due to insufficient RNA quality or quantity, approximately 10% of specimens in AEGIS 1 and approximately 13% of specimens in AEGIS 2 were excluded. The RNA was then stored frozen (-80 ℃) until further processing.
200ng of total RNA was converted to sense strand cDNA using the Ambion WT expression kit (Life technologies catalog No. 4440536), and subsequently labeled with the Affymetrix GeneChip WT end labeling kit (Affymetrix catalog No. 900671). For hybridization, hybridization mixtures were prepared using hybridization, wash and stain kits (Affymetrix cat No. 900720) and added to labeled cDNA targets, applied to human gene 1.0ST arrays (Affymetrix cat No. 901087), and incubated at 45 ℃ for 16 hours. After hybridization, the arrays were washed and stained using standard Affymetrix protocols before they were scanned on an Affymetrix genechip scanner. Data were extracted using the Expression Console software (Affymetrix).
Affymetrix human gene 1.0ST array (Affymetrix catalog No. 901087) utilizes numerous probes disclosed at www.affymetrix.com/site/include/bypass. There are multiple probes corresponding to segments of a particular gene, that is, instead of a 1:1 ratio of one probe per gene, there are multiple probes corresponding to multiple segments of one gene. In one example, the LYPD2 gene is represented by three probe sets in the human Gene 1.0ST array (version 32), Probe sets ID 8153343, 8153344, and 8153345, as disclosed in the Affymetrix human Gene 1.0ST array (HuGene-1-0-ST-v 1 Probe set Note, 9/30/32/2011, 27/2013, and 7/2014, version 34). Information correlating probe sets and nucleic acid sequences can be found at affymetrix.com, including at www.affymetrix.com/site/include/bypass.affxproduct. gene-1_0-st-v 1. Moreover, data sets are available under Platform GPL6244 at the NCBI Gene Expression Omnibus website, which details www.ncbi.nlm.nih.gov/geo/query/acc. cgiac ═ GPL6244 probes and genes that can be utilized in practicing the methods of the present disclosure. These documents (including those relating to probe sets and gene symbols) are incorporated herein by reference.
RMA [22] was used to normalize the microarray data (CEL files) corresponding to the samples in the final dataset for each branch. AEGIS 1 samples were run in a total of 5 batches, and ComBat [23] was used to correct for batch effects. AEGIS 2 samples were all run in one microarray batch. After normalization, outliers were identified as having a whole genome pairwise correlation of less than 0.955 in global gene expression. All microarray data has been saved to GEO under the number GSE 66499.
Normalization and preprocessing of microarray data is described in the supplementary appendix. Subjects enrolled in AEGIS 1 have previously been randomly assigned to independent training and validation sets (fig. 4) and, as previously described, derived and locked on the classifier algorithms strictly within the AEGIS 1 training set. Scores for each sample and all AEGIS 2 samples in the AEGIS 1 validation set were generated using this pre-specified classifier based on the expression of 23 genes and patient age. These scores were divided into test positive and test negative using a pre-defined threshold.
The performance of the classifier was evaluated using Receiver Operating Characteristic (ROC) curves, calculation of the area under the curve (AUC) [14], and estimates of sensitivity, specificity, Negative Predictive Value (NPV), Positive Predictive Value (PPV) and Negative Likelihood Ratio (NLR) defined as (1-sensitivity)/specificity. The Mann-Whitney nonparametric test was used for the analysis of continuous variables and the Fisher's exact test was used to classify variables. All confidence intervals are reported as two-sided binomial 95% confidence intervals (95% CI). Statistical analysis was implemented using R software (version 3.01).
Physicians were asked to evaluate pre-test POMs of all enrolled subjects based on expert opinion and medical records available prior to bronchoscopy using one of the following categories: < 10%, 10-39%, 40-60%, 61-85%, and > 85%. Results fall into the category < 10%, 10-60%, and > 60%. Then, we calculated the actual prevalence of cancer in each POM category to compare the actual prevalence of cancer in the stratified POM levels (table 16). In addition, we found the prevalence of lung cancer after non-diagnostic bronchoscopy to be 3%, 29% and 80% in < 10%, 10-60% and > 60% POM groups, respectively.
Table 16-correlation of POM and cancer prevalence assessed by physicians.
a) POM ═ probability of malignancy; assessed by the attending physician prior to bronchoscopy.
b) The prevalence was calculated as the score of lung cancer diagnosed in each POM category.
The accuracy of the predictions for the bronchial genome classifier stratified by lesion size is summarized in table 2, and the POMs before passing the test are summarized in table 3. For patients diagnosed with stage and histologic stratified lung cancer, the sensitivity of the classifier is also reported in tables S5 and S6. The combination of the classifier and bronchoscopy resulted in a sensitivity of > 90% for all categories.
Table 17-sensitivity according to radiological imaging characteristics, classifier, bronchoscopy, and combination approach. Bronchoscopy sensitivity was determined for lung cancer patients in each category. The sensitivity of the classifier is determined for patients with lung cancer who were not diagnosed during bronchoscopy. The sensitivity of the classifier in combination with bronchoscopy was calculated for all lung cancer patients in each category.
Results
Characteristics of study participants
298 patients from AEGIS 1 served as the first validation set and all 341 patients from AEGIS 2 that met the study criteria served as the second validation set (fig. 4 and table 13). The lung cancer prevalence of AEGIS 1 and AEGIS 2 branches was 74% and 78%, respectively. Patients with lung cancer are older (p <0.001), have higher cumulative tobacco exposure (p <0.001), and are more likely to be current smokers (p 0.07 in AEGIS 1 and 0.03 in AEGIS 2; table 12) than patients without cancer. A summary of the categories of cancer stage and benign diagnosis is shown in tables 15 and 16, respectively.
Performance of bronchoscopy
A total of 639 patients underwent bronchoscopy for suspected lung cancer. Of these, 272 (43%; 95% CI, 39 to 46) were non-diagnostic, including 120 of 487 patients who were ultimately diagnosed with lung cancer (25%; 95% CI, 21 to 29). Bronchoscopy sensitivity to lung cancer was 74% (95% CI, 68 to 79) and 76% (95% CI, 71 to 81) in AEGIS 1 and AEGIS 2, respectively. 98% (267/272) of follow-up protocol data were available in patients with non-diagnostic bronchoscopy. Invasive procedures were performed after non-diagnostic bronchoscopy in 170 of 267 patients (64%, 95% CI, 58 to 69), including 52 of 147 with benign lesions (35%; 95% CI, 24 to 38) and 118 of 120 with cancer (98%; 95% CI, 94 to 99). SLB was performed in 76 patients, 27 of which (36%; 95% CI, 26 through 47) had benign lesions.
Performance of Gene expression classifiers
In AEGIS 1, the classifier alone had an AUC of 0.78 (95% CI, 0.73 to 0.83) and accurately identified 194 of 220 patients with cancer (88% sensitivity; 95% CI, 83 to 92) and 37 of 78 patients without cancer (47% specificity; 95% CI, 37 to 58) (fig. 5). In AEGIS 2, the classifier had an AUC of 0.74 (95% CI, 0.68 to 0.80) and correctly identified 237 of 267 patients with cancer (89% sensitivity; 95% CI, 84 to 92) and 35 of 74 patients without cancer (47% specificity; 95%, 36 to 59). The combination of this classifier with bronchoscopy improved sensitivity to 96% (95% CI, 93 to 98) and 98% (95% CI, 96 to 99) in AEGIS 1 and 2, respectively, compared to 74% and 76% (p <0.001) for bronchoscopy alone, respectively.
In patients with non-diagnostic bronchoscopy, the classifier accurately identified cancer in 49 of 57 patients in AEGIS 1 (86% sensitivity; 95% CI, 74 to 94) and 62 of 67 patients in AEGIS 2 (92% sensitivity; 95% CI, 82 to 97). Since there were no significant differences in classifier AUC between all patients (p 0.32) or between patients in both arms for patients with non-diagnostic bronchoscopy (p 0.61) (fig. 5), we combined both arms for subsequent subgroup analysis. The sensitivity of bronchoscopy alone was lower in lesions <3cm (p <0.001) or located peripherally (p <0.001) (table 17). In contrast, the sensitivity of the classifier alone and in combination with bronchoscopy was consistently higher and had no significant association with the size or location of the lesion (table 17), cancer stage (table 18) or histological subtype (table 19).
Table 18-sensitivity according to cancer stage, classifier and bronchoscopy.
Table 19-sensitivity of classifier and bronchoscopy according to histology.
Accuracy of classifier in patients with moderate cancer probability
We combined physician-assessed probability of malignancy (POM) into the categories of low (< 10%), medium (10-60%), and high (> 60%) POMs (table 3) to compare with guidelines recommendations for assessing lung cancer risk [1 ]. Bronchoscopy is non-diagnostic for cancer in 83% of patients with intermediate pre-test POM (n 101), despite a 41% prevalence of cancer. In this group of patients, the classifier achieved an NPV of 91% (95% CI, 75 to 98) and a PPV of 40% (95% CI, 28 to 54) in those with non-diagnostic bronchoscopy (table 20).
Table 20-performance of POM before bronchoscopy and classifier stratification tests.
(a) There were a total of 639 patients across the POM category shown.
(b) Bronchoscopy was non-diagnostic for 272 of 639 patients (43%; 95% CI, 39 to 46), including 120 of 487 patients diagnosed with lung cancer (25%; 95% CI, 21 to 29).
(c) The classifier accurately predicted 107 of 120 total patients with cancer (89%; 95% CI, 82 to 94). For patients with non-diagnostic bronchoscopy procedures, the sensitivity in each POM category was reported.
(d) The classifier accurately predicted 72 of 152 total patients without cancer (47%; 95% CI, 40 to 55). For patients with non-diagnostic bronchoscopy procedures, specificity in each POM category was reported.
For patients with non-diagnostic bronchoscopy procedures, (e) NPV and (f) PPV were reported.
Although this classifier had a high NPV in patients with non-diagnostic bronchoscopy, there were 13 patients with non-diagnostic bronchoscopy with lung cancer and a negative classifier score (i.e., false negatives). Most (10 of 13 cases) had high (> 60%) POM, with only 3 patients in the 10-60% pre-test POM group.
The NLR of the classifier in combination with bronchoscopy was calculated to determine the range where the post-test probability in pre-test POM would be < 10%. When combined with a classifier, bronchoscopy NLR (0.244; 95% CI, 0.21 to 0.29) improved to 0.056 (95% CI, 0.03 to 0.10). The result was that post-test POM decreased to < 10% for patients with up to 66% pre-test POM when both bronchoscopy and classifier were negative (fig. 6).
Evaluation of the results
This study describes the validation of a bronchial genome classifier that identifies those without lung cancer in patients undergoing bronchoscopy in two separate prospective arms. We found that this gene expression classifier has high sensitivity between lung cancers of different sizes, locations, stages, and cell types in the combinatorial arms. The combination of the classifier and bronchoscopy had 96% and 98% sensitivity in the AEGIS-1 and AEGIS-2 validation branches, respectively. We also report several additional findings, supporting the clinical need of this type of classifier. First, our study confirmed the previously reported observations that non-diagnostic bronchoscopy is common (particularly in patients with POM prior to moderate testing) and leads to further invasive testing, including SLB, often in patients eventually found to be free of lung cancer. Second, bronchoscopy was found to perform poorly in small, peripheral or early stage cancers compared to the high sensitivity of the classifier. Third, the classifier has high NPV in patients with moderate POM and non-diagnostic bronchoscopy. These findings suggest that this classifier has the potential to aid in clinical decision making in patients with moderate POM where lung cancer is 41% prevalent but bronchoscopy is only 41%. Due to the high NPV, negative classifier scores in patients with non-diagnostic bronchoscopy and moderate POM warrant a more conservative diagnostic strategy, via active monitoring of imaging.
While a high NPV for this classifier would help avoid unnecessary invasive procedures in patients with intermediate POMs with classifier negatives, there are a small number of patients with lung cancer in this group; negative gene expression classifier results may delay further invasive testing in these patients. However, this group of patients may undergo active monitoring via imaging, which is standard practice when immediate invasive strategies are not employed [1,15 ]. This would allow identification of lesion growth, triggering additional invasive tests to establish a definitive diagnosis. In contrast to the high NPV observed in patients with moderate POM, the classifier had a moderate PPV of 40% in this setting. As such, a positive result of the classifier does not warrant a change in diagnostic strategy; further testing may need to be based on conventional factors for selecting between invasive and imaging monitoring strategies.
This gene expression classifier was measured in the proximal BEC, not from cells within the lung lesion. The ability of changes in gene expression in the cytologically normal proximal airways to detect the presence of lung cancer within the lung parenchyma stems directly from the "lesion field" paradigm [13 ]. Spira et al have previously shown a unique pattern of altered gene expression in cytologically normal bronchial epithelial cells in current and former smokers with lung cancer [13,16 ]. Furthermore, oncogenic signaling pathways are activated in the proximal airway epithelium in smokers with lung cancer and smokers with premalignant airway damage [17 ]. Recently, Kadara et al [18] demonstrated that genes whose expression was altered in non-small cell lung cancer itself and in the adjacent small airway epithelium were enriched for those altered in the proximal airway epithelium, suggesting that changes in gene expression within the proximal airway partially reflect the altered transcriptome observed in lung tumors.
The procedure is considered "diagnostic" only when bronchoscopy produces a diagnosis of lung cancer. There are a relatively small number of bronchoscopies, potentially diagnosed as a specific benign cause, but most of these patients receive further invasive tests, including patients who are ultimately diagnosed with lung cancer, suggesting that there is still increased concern about lung cancer despite the initial bronchoscopy finding to be benign. Finally, we did not evaluate the accuracy of the models incorporating classifiers combined with clinical variables. Although clinical risk prediction models have been developed for isolated lung nodules [1,20,21], no validated model has been made for selecting patients undergoing diagnostic bronchoscopy (which includes patients with a wide range of findings, including large lesions (i.e., >3cm), infiltrates or other features such as lymphadenopathy). As such, based on the physician's qualitative assessment of lung cancer probability, the majority of patients were selected for bronchoscopy. Importantly, we demonstrate that our classifier performs well in patients with moderate POM as determined by physician evaluation (a process that incorporates available clinical risk factors).
The potential impact of this work is supported by many key strengths in its research design. First, these are two independent prospective validation studies in which classifiers are measured in a setting in which the test will be used clinically (i.e., prior to diagnosis). This is a key step in the transfer of molecular biomarkers from discovery studies to their ultimate clinical application. Second, the large multi-center design enables inclusion of patients undergoing bronchoscopy from different practical settings and geographic locations. Third, our data demonstrates a high prevalence of lung cancer in patients with non-diagnostic bronchoscopy and mid-test POM, and shows that the classifier has 91% NPV in this setting with the greatest uncertainty about cancer status. In this setting, the opportunity to use a classifier with high sensitivity to lung cancer allows for the credible identification of patients without lung cancer, which can be followed by active monitoring, thereby avoiding potentially harmful invasive follow-up tests.
Example 3: derivation of a bronchial genome classifier for lung cancer patients in patients undergoing diagnostic bronchoscopy
Introduction to the word
Lung cancer remains the leading cause of cancer death in the united states, with an estimated 224,000 new diagnoses and 160,000 deaths in 2014, 90% of which were due to smoking [24 ]. Recently, national lung cancer screening trials have shown that low-dose Computed Tomography (CT) screening results in a 20% reduction in relative mortality among high-risk individuals [25 ]. However, the mortality reduction is accompanied by a high proportion (about 96%) of false positive CT results, which in turn raises concerns about over-utilization of invasive diagnostic procedures [26 ].
Patients with suspected lung cancer are often referred to as bronchoscopy, where the primary objective is to take a sample of suspected lung lesions for pathological analysis. It is estimated that 500,000 bronchoscopies are performed annually in the united states [27], of which about half are used to diagnose lung cancer. Bronchoscopy is considered to be safer than other invasive sampling methods, such as transthoracic biopsy (TTNB) or surgical techniques. However, the diagnostic sensitivity of bronchoscopy is sub-optimal, ranging from 34% (for peripheral nodules <2 cm) to 88% (for larger, centrally located lesions) [28 ]. The applicability of bronchoscopy has been extended to more challenging suspicious lesions (i.e., isolated lung nodules often surrounding the lung) using guidance techniques, but bronchoscopy has not substantially improved the overall clinical sensitivity to lung cancer [29,30 ]. When bronchoscopy is non-diagnostic, the physician is often left with ambiguity, whether to perform further invasive diagnostic procedures, associated complications [31,32], or to select imaging monitoring. In current practice, when these invasive procedures are performed, approximately one-third of patients are determined to have benign disease [33], suggesting that these procedures are avoidable. Methods to reduce this ambiguity by substantially improving the diagnostic yield of bronchoscopy can improve patient care.
Cigarette smoke has previously been shown to produce a damaging molecular field in the airway epithelium lining the entire respiratory tract [34 ]. The reversible and irreversible effects of cigarette smoke on bronchial airway transcriptomes have been characterized, and a panel of gene expression alterations in bronchial epithelium has been identified in current and former smokers with lung cancer [35 ]. These cancer-associated gene expression profiles have previously been shown to produce sensitive classifiers for detecting lung cancer when bronchoscopy is non-diagnostic. The high sensitivity of such classifiers (measured in readily available biological specimens during bronchoscopy) results in a very low probability of lung cancer when the test results are negative, and suggests invasive procedures that may enable physicians to confidently conduct active surveillance and reduce risk in subjects without lung cancer.
Materials and methods
Training a pooled patient population
Patients enrolled in the AEGIS test (airway epithelial gene expression in the diagnosis of lung cancer), designed to undergo bronchoscopy as part of their diagnostic work, prospective, observational, branched studies of current and former smokers suspected of having lung cancer (enrolled as NCT01309087 and NCT 00746759). A group of patients from one of the arms ("AEGIS 1") was selected for the sole purpose of training a gene expression classifier. The study was approved by IRB at each participating medical center and all patients signed an informed consent prior to enrollment. All enrolled patients were tracked after bronchoscopy until the final diagnosis was made or 12 months. A cytopathologically diagnosed patient as having primary lung cancer is obtained based on a lung biopsy obtained at or following bronchoscopy, such as TTNB or Surgical Lung Biopsy (SLB) when bronchoscopy does not result in a lung cancer diagnosis. Patients were diagnosed as having benign disease based on review of medical records and follow-up procedures at 12 months after bronchoscopy (described in more detail in appended document 1). Bronchoscopy is considered "diagnostic" when clinical samples collected at the time of the bronchoscopy procedure produce a confirmed diagnosis of lung cancer via cytology or pathology.
Patients enrolled in the NIH registered AEGIS study (NCT01309087 and NCT00746759) were patients suspected of having lung cancer undergoing clinically indicated bronchoscopy, aged at least 21 years and smoked at least 100 cigarettes in their lives. The study excluded patients who had previously been diagnosed with primary lung cancer, had been on a continuous ventilator for >24 hours prior to bronchoscopy, or were unable to agree or comply with the study. Additional patients were excluded prior to training the classifier to exclude patients with malignancies other than primary lung cancer. This includes excluding patients with any history of malignancy, confirmed metastatic cancer to the lung, or finding patients with active non-lung primary cancer after enrollment. Also, patients without a definitive diagnosis of the final are excluded. Finally, those RNA yields (<1 μ g) or quality (RIN <4) are insufficient to be excluded from further analysis after sample processing.
Patients were followed up to 12 months after bronchoscopy and the records were reviewed to confirm or confirm the final clinical diagnosis. The diagnosis of cancer is based on cytopathology of cells/tissues collected during bronchoscopy or in follow-up procedures when bronchoscopy is non-diagnostic. The follow-up procedure that results in the diagnosis consists of secondary bronchoscopy, transthoracic needle aspiration (TTNA), Surgical Lung Biopsy (SLB), or a combination of procedures. The record of patients who were not diagnosed with cancer and who had been tracked for 12 months was made by a panel of five pneumologists for a decision process. This process consists of a review of available medical records, and a patient declares only cancer-free if the patient meets one of the following criteria: the diagnosis has other diagnoses that account for the initial suspected abnormality, the abnormality determination is stable, or the abnormality is eliminated. Patients who did not meet these criteria at the completion of the 12-month follow-up period were marked as "inconclusive" and excluded from training due to the lack of diagnostic "facts".
Sample collection
Physicians at each of the 25 participating medical centers were instructed to collect normal-appearing Bronchial Epithelial Cells (BECs) from the right main stem bronchus (or left side if any abnormalities were observed on the right) during bronchoscopy using a standard bronchoscopy cell brush. After collection, the cell brush was cut immediately after collection and placed in RNA preservative (Qiagen rnaprotection, catalog 76526) and stored at 4 ℃. The specimens were then transported at 4-20 ℃ to a central laboratory for further processing.
Shipping containers were provided to all sites to enable transport of specimens at 4-20 ℃ over a 48 hour period. Each site was asked to send specimens using a 2-day shipping service. After receipt at the central laboratory, the specimens are examined and added to the laboratory information system. The received specimens were stored at 4 ℃ prior to RNA isolation, which was typically performed within 7 days after reception. All storage and transport time records were retained and the cumulative time between specimen collection and RNA isolation was less than 30 days (consistent with manufacturer's recommendations for RNA preservatives).
RNA isolation
BECs were isolated from the cell brush using a vortex mixer, then pelleted and treated with QIAzol lysis reagent (Qiagen). RNA was isolated by phenol/chloroform extraction and purified on a silica membrane spin column (Qiagen miRNeasy kit, cat # 217004) according to the manufacturer's recommendations. RNA was analyzed on a NanoDrop ND-1000 spectrophotometer (Thermo Scientific) to determine concentration and purity, and RNA Integrity (RIN) was measured on a 2100Bioanalyzer (Agilent technologies). Each sample was then stored at-80 ℃ until further processing on the microarray.
Preparation of cDNA
Total RNA was converted to sense strand cDNA and amplified using Ambion WT expression kit (Life Technologies, cat # 4440536) designed for use with Affymetrix microarrays. Starting with 200ng total RNA, single stranded cDNA was prepared via reverse transcription using the T7 promoter primer protocol. The single-stranded cDNA is converted into double-stranded cDNA using DNA polymerase.
Microarray processing
The cDNA obtained from the total RNA was labeled with Affymetrix GeneChip WT end labeling kit (Affymetrix, cat # 900671). The labeled cDNA was hybridized to Gene 1.0ST microarray (Affymetrix, cat. No. 901085) and analyzed on an Affymetrix GeneChip scanner. Individual CEL files for each patient sample were normalized using standard Affymetrix Gene 1.0ST CDF and RMA [38 ].
Total RNA was converted to sense strand cDNA using a commercial kit designed for use with Affymetrix microarrays (Ambion WT; Life Technologies, cat. No. 4440536). Starting with 200ng total RNA, single stranded cDNA was prepared via reverse transcription using the T7 promoter primer protocol. The single-stranded cDNA is converted into double-stranded cDNA using DNA polymerase. The double-stranded cDNA serves as a template for in vitro transcription of the cRNA, which is then purified to remove enzymes, salts, inorganic phosphates, and unincorporated nucleotides. The yield of cRNA was measured using UV absorbance, then 10 μ g of purified cRNA was used to generate labeled sense strand cDNA by reverse transcription using random primers and dUTP/dNTP mix, fragmented, and labeled using GeneChip WT end labeling kit (Affymetrix, cat # 900671). The labeled cDNA was hybridized to Gene 1.0ST microarray (Affymetrix, cat # 901085) using a hybridization, wash and stain kit (Affymetrix, cat # 900720) and incubated at 45 ℃ for 16 hours. After hybridization, the arrays were washed and stained using standard Affymetrix protocols, followed by scanning on an Affymetrix GeneChip scanner and data extraction using Expression Console software (Affymetrix). Thus, the microarrays described herein do not measure the expression of native molecules, but rather the microarrays measure the expression of non-naturally occurring cDNA molecules.
Classifier development
Gene expression classifiers are derived in a multi-step process. Initial modeling consisted of using training data to select genes associated with three clinical covariates (gender, tobacco usage, and smoking history) ("gene expression associations") to identify gene expression associations for these clinical variables. Then, a lung cancer-associated gene is selected, and finally a classifier is determined that predicts the likelihood of lung cancer based on a combination of oncogene, gene expression association, and patient age. All aspects of this classifier development protocol were determined using cross-validation and using only data from training set samples.
Clinical factor Gene expression Association (CFGC)
Covariates, including gender (male/female), smoking status (current/previous), and age (<10/>10), of lung cancer in this study population were modeled to identify gene expression associations for clinical factors. Empirical bayesian t-tests were used to identify genes whose expression was significantly correlated with each clinical factor. Next, genes are selected in a sparse manner [36] that can be used to predict the value of each clinical factor. Finally, the predictive values associated with gene expression from gender (GG), smoking status (GS), and bag-years (GPY) were calculated for each patient and used to select genes with lung cancer-associated gene expression and a lung cancer classifier described below.
Selection of Lung cancer genes
Using training data, CFGC, and patient age as predictors, a logistic regression model with lung cancer status (1 ═ cancer positive and 0 ═ cancer negative) as dependent variables was fitted. Next, an empirical bayesian linear model was fitted using the gene expression values as independent variables and the logistic regression model residuals as dependent variables. This was used to select the genes that most directly correlate with disease status without relying on clinical covariates. The first lung cancer-associated genes from this analysis were grouped using hierarchical clustering. Genes were selected in an iterative manner to maximize AUC using cross-validation to assess prediction accuracy. The goal is to select clusters that cumulatively provide the best classifier performance, and the specific genes that best represent each cluster. Gene titration analysis was also performed to determine the number of genes per cluster that provided the best performance. For the selected clusters, the equal genes are averaged, yielding a cluster mean estimate for each patient/cluster combination. Functional analysis of genes within each cancer cluster was performed using DAVID [37] to identify biological terms that describe cancer-associated genes in the classifier.
Lung cancer classifier
A lung cancer classifier was developed using lung cancer status as output variables and cancer gene expression estimates, patient age, and gender (GG), smoking status (GS), and age-on-bag (GPY) CFGC as predictors. Fitting the model using a penalized logistic regression model; the penalty factor (λ) was 0 for the clinical/gene expression correlation and 10 for each gene expression cluster estimate. The resulting score is on a scale of 0 to 1. A score threshold for predicting lung cancer status was established to achieve approximately 90% sensitivity for patients with non-diagnostic bronchoscopy. The evaluation of the benefit of the gene expression classifier in predicting lung cancer compared to clinical factors alone is performed by generating a "clinical model" of the predicted lung cancer status in a logistic regression model that includes age, gender, smoking status, and age-in-package (clinical determination). Differences in the performance of predicting lung cancer status between the complete gene expression classifier and the clinical factor classifier were assessed by comparing the AUC of each model in the training set.
Analysis of independent test sets
Data from a previous study [35] was used as a separate test set to evaluate the performance of the lock classifiers derived in this study. In this study, BECs were collected at bronchoscopy from patients suspected of having undergone bronchoscopy for lung cancer and RNA was analyzed on a microarray (Affymetrix HG-U133A). The CEL file from this study (n ═ 163) was re-normalized using Robust Multiple Average (RMA) in Bioconductor R package (version 1.28.1) to generate gene level expression values. This process used the Entrez Gene specific Probe set Chip Definition File (CDF) [39] in place of the standard U133ACDF supplied by Affymetrix to facilitate cross-platform analysis. Analysis was performed using an R-environment for statistical operations (version 2.9.2).
The classifier was applied to patients in the test set with two modifications to account for differences in the microarray platform. First, HG-U133A RMA expression values were adjusted by gene-by-gene constants that shifted the mean of the expression levels of each gene in the test set to that observed in the training set. Second, for classifier genes (LYPD2 and RNF150) for which the corresponding HG-U133A probe set did not exist, the mean expression values of the genes in the training set were used for all test set samples.
Statistical method
Classifier accuracy was evaluated using a standard measure of prediction accuracy: area under the curve (AUC), sensitivity, specificity, NPV and PPV. The performance of predictive classifiers generated using these approaches was evaluated using a 10% sample extraction set, using cross-validation in a training set [40 ]. These performance estimates are used to guide the development of classifier discovery procedures. The final model is set up, after which a one-time analysis of the test set is performed. The Fisher's exact test was used to calculate the statistical significance of all categorical variables and the t-test was used for the continuous variables.
Results
Study population
Our gene expression classifier was derived using a collection of 299 patients from AEGIS 1 (consisting of 223 patients diagnosed with lung cancer and 76 patients diagnosed with benign disease) (table 1). The characteristics of the independent test sets have been previously described and are summarized here. Although the study design is similar to that described herein, there are some differences in the study population. Patients in the training set were older on average (p <0.001) compared to the test set (although there were no significant differences in age for patients diagnosed with lung cancer (p ═ 0.959)). The training set is also composed of fewer current smokers (p ═ 0.050); and a lower proportion of patients with <3cm lesions (p < 0.001). In addition, the prevalence of lung cancer is higher in the training set (75% versus 48%; p < 0.001).
Table 21-clinical and demographic characteristics of patients used to train the classifier.
Derivation of classifiers and evaluation of Performance
For most genes on the array, gene expression correlated with current smoking status (6477 genes, p < 0.001; the first 10 genes reported in table 22). Based on cross-validation, three top-ranked genes (SLC7a11, TKT, and CLND10) were selected to serve as logistic regression-based smoking status classifiers. This smoking status classifier had an AUC of 0.93 within the training set. Another CFGC is derived for the smoking history independent of smoking status and is based on cumulative smoke exposure measured in pack-years. The smoking history (<10PY vs >10PY) was significantly correlated with the expression of 531 genes (p < 0.001; the first 10 genes reported in Table 23). Two top genes were selected to serve as logistic regression-based smoking history classifiers (RUNX1T1, AKR1C2) with an AUC of 0.78 within the training set. Gender was significantly associated with 339 genes (p < 0.001; the first 10 genes reported in table 24). The top ranked gene (RPS4Y1) is the perfect classifier for gender within the training set (AUC 1).
Table 22: first-class differentially expressed genes associated with smoking status
Table 23: first-class differentially expressed genes associated with smoking history
Table 24: sex-related differentially expressed genes of head
As described in the methods, we identified genes whose expression was significantly correlated with the residual from the CFGC model for lung cancer. A total of 232 cancer-associated genes (table 25) met the significance criteria (T score > 2.7). Pairwise associations of 232 genes were examined, followed by hierarchical clustering to identify genes with similar expression patterns, and the genes were divided into 11 clusters (fig. 7). Since genes are associated within each cluster, we assume that the mean of a small set of genes within each cluster can be used to represent the cluster in a sparse manner. We optimized the classifier, using cross-validation to evaluate AUC. We selected genes to represent the cluster of genes whose expression is most strongly associated with lung cancer and determined that inclusion of clusters 1,2, 4,7, 9 and 10 gave the best AUC. We also determined that there was no improvement in the performance of the test over 2-4 genes per cluster. In cross-validation, AUC is 0.80 (95% CI0.75-0.84) for all patients in the training set (n 299); for the subset of patients with non-diagnostic bronchoscopy (n-134), the performance was similar (AUC-0.81; 95% CI 0.74-0.87).
Table 25: genes associated with cancer included in classifier
A final lung cancer classifier is then determined over the entire training set using the completed classifier discovery procedure. The classifier consisted of six cancer gene cluster combinations (represented by a total of 17 genes) as predictors, patient age, and gene expression associations (GG, GS, GPY) (table 26). Dichotomous classification was performed using a score threshold of 0.65 (patients with score >/═ 0.65 were predicted to be cancer positive and patients with a score <0.65 were predicted to be cancer negative). The classifier had 93% sensitivity and 57% specificity in the training set and had no difference in AUC for the classifier for the entire training set (0.78; 95% CI, 0.73-0.82) compared to the subset of patients whose bronchoscopy was non-diagnostic for lung cancer (AUC 0.78; 95% CI 0.71-0.85) (see fig. 9).
TABLE 26-description of Gene expression classifiersa
a) If RPS4Y1<7.5, the genomic gender was defined as GG ═ 1 (female), otherwise 0 (male). Deriving a predicted Genomic Smoking (GS) value, wherein x-40.8579-0.4462 SLC7A11-2.1298 CLND10-1.8256 TKT, and genomic smoking GS-e TKTx/(1+ex). Deriving a predicted genome-year (GPY) value, wherein x ═ -5.1429+2.1891 × RUNX1T1-0.9506 × AKR1C2, and genome-year GPY ═ exp (x)/(1+ exp (x)). The generalized equation for the prediction classifier is: score of ey/(1+ey) Wherein y is b0+Σ(bi*xi) Wherein b is0Is intercept, biIs a coefficient, and xiIs a feature (as shown).
b) Features include patient age (as reported), GG, GS, GPY, and ca (i), lung cancer gene cluster (shown in fig. 7) as described in the methods.
In the training set, the performance of the gene expression classifier was significantly better (AUC 0.78; 95% CI, 0.73-0.82) (p <0.001) compared to the model using clinical factors alone (AUC 0.72; 95% CI, 0.67-0.77). Functional analysis of 17 cancer genes was summarized separately (table 27). Associated with cancer, 9 genes are down-regulated, and 8 are up-regulated.
Table 27: biological characterization of classifier genes.
Verification in independent test sets
In patients with non-diagnostic bronchoscopy in the independent test set (n 123), the AUC of the classifier was 0.81 (95% CI, 0.73-0.88) (fig. 8), which is similar to the performance in patients with non-diagnostic bronchoscopy in the training set (AUC 0.78; 95% 0.71-0.85; p 0.495). Sensitivity was 92%, specificity was 55%, NPV was 94% (95% CI, 83-99%) (see Table 28). Interestingly, we did not observe any effect of cancer histology or stage (table 29) or lesion size (table 30) on classifier sensitivity with respect to cancer. Furthermore, in the test set, the classifier had an AUC of 0.79 in current smokers and 0.82 in previous smokers, suggesting that smoking status had no significant effect on classifier performance (p 0.710). The combination of the gene expression classifier and bronchoscopy increased sensitivity from 51% to 95% (p <0.001) when compared to bronchoscopy alone.
Table 28-performance of bronchoscopy, classifier, and combination procedures in the test set.
a) Patients diagnosed with cancer CA + and benign disease CA-
b) The performance of the classifier was evaluated in patients (n 123) where bronchoscopy did not lead to cancer finding.
Table 29-bronchoscopy, classifier, and sensitivity of the combined procedure to patients with lung cancer in the test set.
Of 163 patients suspected of having lung cancer undergoing a diagnostic bronchoscopy procedure, 78 were diagnosed with cancer. At bronchoscopy (a), lung cancer diagnosis was made in 40 patients (51%; 95% CI, 40-62%), and the classifier correctly predicted 34 of them (b) (89%; 95% CI, 75-96%) in the remaining lung cancer patients who did not make diagnosis at bronchoscopy. The classifier in combination with bronchoscopy yielded a detection of 74 out of 78 patients with lung cancer (95%, 95% CI, 87-98%) (c). The sensitivity of bronchoscopy, classifier, and combination procedure to lung cancer by subtype and stage is also shown.
Table 30-bronchoscopy, classifier, and sensitivity of the combined procedure in the test set stratified by size of suspicious lesions.
Including patients diagnosed with lung cancer and patients with benign disease.
Table 26 lists a number of gene expression classifiers of interest. The following table, table 31, provides the gene IDs available at NCBI, providing descriptive support for gene expression classifiers. The gene classifier CD177 is described in table 31 by two names, CD177.1 and CD 177.2. 1 and 2 marker identification two different probe sets were used in an array to detect differential expression of genes represented by the gene classifier. FIG. 10A discloses 19 probes for hybridization to CD177, indicating CD 177.1. FIG. 10B discloses 4 probes for hybridization to CD177, indicating CD 177.2.
Table 31-NCBI gene ID number corresponding to gene expression classifier.
| Gene classifier
|
Gene ID number
|
Gene classifier
|
Gene ID number
|
| RPS4Y1
|
6192
|
MCAM
|
4162
|
| SLC7A11
|
23657
|
NOVA1
|
4857
|
| CLDN10
|
9071
|
SDC1
|
6382
|
| TKT
|
7086
|
CDR1
|
1038
|
| AKR1C2
|
1646
|
CGREF1
|
10669
|
| BST1
|
683
|
CLDN22
|
53842
|
| CD177.1
|
57126 (see FIG. 10A)
|
NKX3-1
|
4824
|
| CD177.2
|
57126 (see FIG. 10B)
|
EPHX3
|
79852
|
| ATP12A
|
479
|
LYPD2
|
137797
|
| TSPAN2
|
10100
|
MIA
|
8190
|
| GABBR1
|
2550
|
RNF150
|
57484
|
| RUNX1T1
|
862
|
|
|
Evaluation of the results
Work has demonstrated the presence of persistent gene expression changes in normal epithelial cells from bronchial airways associated with exposure to cigarette smoke and the presence of lung cancer in current and previous smokers [32,41,42,43 ]. These cancer-related differences can be used to derive classifiers that can accurately detect lung cancer in these relatively non-invasively collected biological specimens obtained during bronchoscopy [35 ]. In current practice, it is challenging to rule out lung cancer when bronchoscopy does not lead to finding malignancy, and the false negative rate can range from 20-70% [28 ]. Current guidelines suggest that patients at increased risk of disease should undergo more invasive follow-up diagnostic procedures [28], with an increased risk of complications [31 ]. However, due to uncertainty, these procedures are often performed in patients found to have benign disease [33 ]. Therefore, our goal is to derive gene expression classifiers from the proximal airways during bronchoscopy to improve overall sensitivity, minimize ambiguity when bronchoscopy is non-diagnostic, and reduce the need for unnecessary invasive procedures.
In this study, we utilized a branch from a larger multicenter study of current and previous smokers undergoing bronchoscopy for suspected lung cancer to derive a gene expression classifier for lung cancer. The classifier is a multivariate logistic regression model with high sensitivity and high NPV. Importantly, we have validated the performance of the classifier in an independent branch, using data from previously published studies of airway samples collected from smokers undergoing bronchoscopy for suspected lung cancer. Of the test set with a specificity of 55%, the sensitivity in patients with bronchoscopy that were non-diagnostic was 92%. The NPV in the test set was 94%, compared to 69% for bronchoscopy alone, suggesting that the classifier can help physicians reliably identify patients who are unlikely to have lung cancer after non-diagnostic bronchoscopy.
The function of differentially expressed genes in the airway epithelium that was seen as normal in current and previous smokers with lung cancer provides a fundamental biological understanding of the site of damage. Among the suppressed genes, there are a number involved in immune responses, including CD177 and BST1, suggesting an impaired immune response in the airways of smokers with lung cancer. The gene TSPAN2, whose expression is suppressed by p53 knock-down and is associated with poor prognosis in lung adenocarcinoma [44], is also expressed at lower levels in patients with cancer. Also, EPHX3 (a gene [45] involved in xenobiotic metabolism, carcinogen processing in tobacco smoke, and carcinogenesis in other epithelial cancers) was down-regulated. Among classifier genes upregulated in lung cancer, NOVA1 and CDR1 are mainly expressed in neurons, but are also expressed in tumors, and are associated with paraneoplastic antibodies (para-neoplastic antibodies) in several malignancies, including small cell lung cancer [46,47,48,49,50 ]. Furthermore, MCAM, which is upregulated in lung cancer, is expressed in basal bronchial epithelial cells [51 ]. MCAM is also strongly and transiently upregulated in the tracheal epithelium during repair [52], is required for tracheal epithelial regeneration [53], and is upregulated in the bronchial epithelium of patients with COPD [54] and asthma [55 ]. A variety of classifier genes that regulate cell growth and proliferation are upregulated in patients with lung cancer, including SDC2 and NKX3-1, and the cell cycle arrest mediator CGREF 1. Finally, the CFGC genes selected for prediction of smoking status (SLC7a11, CLDN10, TKT) and smoking history (RUNX1T1, AKR1C2) in our classifier have been previously reported to be altered by smoke exposure, confirming the robust impact of smoking on airway epithelial biology [11,18,33 ].
Our discovery approach expanded early work on gene expression-based lung cancer diagnosis [35], mainly by explicit modeling of clinical covariates as a component of predictive models before selecting features with lung cancer-related expression. It is known that the response to environmental hazards and other clinical factors can vary substantially from individual to individual. Therefore, our approach is to use gene expression to capture the patient-level physiological response to environmental hazards (e.g., cumulative smoke exposure) because this response may be more reflective of disease risk than the actually reported values [57 ]. Another component of our approach is the selection of genes whose expression is associated with cancer after consideration of modeled clinical factors. We hypothesize that this approach would help ensure that information captured by the likelihood of a cancer being associated with a gene with cancer-associated gene expression is independent of information regarding cancer capture by modeled clinical factors. Another important aspect of our classifier discovery approach is our approach to identify patterns of independent cancer-related gene expression by clustering and then modeling cancer as additive effects of each cancer-related gene expression module. This is in contrast to selecting only genes that globally rank top according to their association with cancer, which could potentially lead to the selection of a whole set of genes reflecting a single cancer-related molecular process. Previous studies deriving gene expression classifiers in apparently normal airway epithelial cells to predict lung cancer risk have described high sensitivity and similar results for NPV when bronchoscopy is non-diagnostic [35 ]. Although this classifier has no genes in common compared to the classifiers described herein, we believe that our new classifier represents a similar mechanism of action in view of the strong performance in the independent test set. However, the differences in the specific genes selected may be due to differences in the feature selection process.
We have used cells from the proximal airway to derive a gene expression classifier for lung cancer that can be used in conjunction with bronchoscopy for suspected lung cancer. We have verified the performance of this classifier in a separate set of tests. The classifier adds substantial sensitivity to the bronchoscopy procedure, resulting in high NPV. By identifying patients at low risk with lung cancer, this classifier can be used to help make decisions when bronchoscopy is non-diagnostic.
Having thus described several aspects of at least one embodiment of this disclosure, it is to be appreciated various alterations, modifications, and improvements will readily occur to those skilled in the art. Such alterations, modifications, and improvements are intended to be part of this disclosure, and are intended to be within the spirit and scope of the disclosure. Accordingly, the foregoing description and drawings are by way of example only, and the disclosure is described in detail by the appended claims.
Use of ordinal terms such as "first," "second," "third," etc., in the claims to modify a claim element does not by itself connote any priority, precedence, or order of one claim element over another or the temporal order in which acts of a method are performed, but are used merely as labels to distinguish one claim element having a certain name from another element having a same name (but for use of the ordinal term) to distinguish the claim elements.
Introduction by introduction
All references, articles, publications, patents, patent publications, and patent applications cited herein are hereby incorporated by reference in their entirety for all purposes.
Reference to the literature
1.Gould,M.K.,Donington,J.,Lynch,W.R.,et al.Evaluation of individuals with pulmonary nodules:When is it lung cancer?:Diagnosis and management of lung cancer:American College of Chest Physicians evidence-based clinical practice guidelines.CHEST Journal 2013;143(5_suppl):e93S-e120S.
2.Tukey,M.H.,&Wiener,R.S..Population-based estimates of transbronchial lung biopsy utilization and complications.Respiratory medicine 2012;106(11):1559-1565.
3.Ernst A,Silvestri G,Johnstone D.Interventional Pulmonary Procedures:Guidelines from the American College of Chest Physicians.Chest 2003;123;1693-1717
4.Rivera MP,Mehta AC,Wahidi MM.Establishing the Diagnosis of Lung Cancer:Diagnosis and Management of Lung Cancer,3rd ed:American College of Chest Physicians Evidence-Based Clinical Practice Guidelines.Chest 2013;143:e142S-65S.
5.Memoli,J.S.W.,Nietert,P.J.,&Silvestri,G.A.Meta-analysis of guided bronchoscopy for the evaluation of the pulmonary nodule.CHEST Journal 2012;142(2):385-393.
6.Ost,D.,Fein,A.M.,&Feinsilver,S.H.(2003).The solitary pulmonary nodule.New England Journal of Medicine,348(25),2535-2542.
7.Grogan,E.L.,Weinstein,J.J.,Deppen,S.A.,et al.Thoracic operations for pulmonary nodules are frequently not futile in patients with benign disease.Journal of thoracic oncology:official publication of the International Association for the Study of Lung Cancer 2011,6(10):1720.
8.Detterbeck,F.C.,Mazzone,P.J.,Naidich,D.P.,&Bach,P.B.Screening for lung cancer:diagnosis and management of lung cancer:American College of Chest Physicians evidence-based clinical practice guidelines.CHEST Journal 2013;143(5_suppl):e78S-e92S.
9.Wiener,R.S.,Wiener,D.C.,&Gould,M.K.Risks of Transthoracic Needle Biopsy:How HighClinical pulmonary medicine 2013;20(1):29.
10.Covey,A.M.,Gandhi,R.,Brody,L.A.,Getrajdman,G.,Thaler,H.T.,&Brown,K.T.Factors associated with pneumothorax and pneumothorax requiring treatment after percutaneous lung biopsy in 443 consecutive patients.Journal of vascular and interventional radiology 2004;15(5):479-483.
11.Geraghty,P.R.,Kee,S.T.,McFarlane,G.,Razavi,M.K.,Sze,D.Y.,&Dake,M.D.CT-guided Transthoracic Needle Aspiration Biopsy of Pulmonary Nodules:Needle Size and Pneumothorax Rate 1.Radiology 2003;229(2):475-481.
12.Golub,T.R.,Slonim,D.K.,Tamayo,P.,et al.Molecular classification of cancer:class discovery and class prediction by gene expression monitoring.Science 1999;286(5439):531-537.
13.Spira A,Beane JE,Shah V,et al.Airway epithelial gene expression in the diagnostic evaluation of smokers with suspect lung cancer.Nature medicine 2007;13:361-6.
14.Hanley JA,McNeil BJ.The meaning and use of the area under a receiver operating characteristic(ROC)curve.Radiology 1982;143:29-36.
15.MacMahon,H.,Austin,J.H.,Gamsu,G.,et al.Guidelines for management of small pulmonary nodules detected on CT scans:a statement from the Fleischner Society 1.Radiology 2005,237(2):395-400..
16.Beane,J.,Sebastiani,P.,Whitfield,T.H.,et al.Aprediction model for lung cancer diagnosis that integrates genomic and clinical features.Cancer Prevention Research 2008;1(1):56-64.
17.Gustafson,A.M.,Soldi,R.,Anderlind,C.,et al.Airway PI3K pathway activation is an early and reversible event in lung cancer development.Science translational medicine 2010;2(26):26ra25-26ra25.
18.Kadara,H.,Fujimoto,J.,Yoo,S.Y.,Maki,et al.Transcriptomic architecture of the adjacent airway field cancerization in non–small cell lung cancer.Journal of the National Cancer Institute 2014;106(3):dju004.
19.Alexander,E.K.,Kennedy,G.C.,Baloch,et al.Preoperative diagnosis of benign thyroid nodules with indeterminate cytology.New England Journal of Medicine 2012,367(8):705-715.
20.McWilliams A,Tammemagi MC,Mayo JR,et al.Probability of cancer in pulmonary nodules detected on first screening CT.N Engl J Med 2013;369:910-9.
21.Ost DE,Gould MK.Decision making in patients with pulmonary nodules.American journal of respiratory and critical care medicine 2012;185:363-72.
22.Irizarry,R.A.,Bolstad,B.M.,Collin,F.,Cope,L.M.,Hobbs,B.,&Speed,T.P.(2003).Summaries of Affymetrix GeneChip probe level data.Nucleic acids research,31(4),e15-e15.
23.Johnson WE,Li C,Rabinovic A.Adjusting batch effects in microarray expression data using empirical Bayes methods.Biostatistics 2007;8:118–127.
24.Howlader N,Noone AM,Krapcho M,et al.SEER stat fact sheets:lung and bronchus.Available online:http://seer.cancer.gov/statfacts/html/lungb.html.
25.The National Lung Screening Trial Research Team.Reduced Lung-Cancer Mortality with Low-Dose Computed Tomographic Screening.N Engl J Med 2011;365:395-409
26.Tanoue LT,Tanner NT,Gould MK,Silvestri GA.Lung Cancer Screening.Am J Respir Crit Care Med.published online 04 Nov 2014
27.Ernst A,Silvestri G,Johnstone D.Interventional Pulmonary Procedures:Guidelines from the American College of Chest Physicians.Chest 2003;123;1693-1717
28.Rivera,M.P.,Mehta,A.C.,&Wahidi,M.M.(2013).Establishing the Diagnosis of Lung Cancer Diagnosis and Management of Lung Cancer,3rd ed:American College of Chest Physicians Evidence-Based Clinical Practice Guidelines.CHEST Supplement.Chest,143,e143S.
29.Silvestri,G.A.,Feller-Kopman,D.,Chen,A.,Wahidi,M.,Yasufuku,K.,&Ernst,A.(2012).Latest Advances in Advanced Diagnostic and Therapeutic Pulmonary Procedures Update on Pulmonary Procedures.CHEST Journal,142(6),1636-1644.
30.Gildea,T.R.,Mazzone,P.J.,Karnak,D.,Meziane,M.,&Mehta,A.C.(2006).Electromagnetic navigation diagnostic bronchoscopy:a prospective study.American journal of respiratory and critical care medicine,174(9),982-989.
31.Wiener,R.S.,Schwartz,L.M.,Woloshin,S.,&Welch,H.G.(2011).Population-based risk for complications after transthoracic needle lung biopsy of a pulmonary nodule:an analysis of discharge records.Annals of internal medicine,155(3),137-144.
32.Fontaine-Delaruelle,C.,Ferretti,G.,Gamondes,D.,Pradat,E.,Souquet,P.J.,&Couraud,S.(2014).Is transthoracic core needle biopsy under CT scan a good deal for benign diseases'diagnosis?.European Respiratory Journal,44(Suppl 58),P679.
33.Smith MA,Battafarano RJ,Meyers BF,Zoole JB,Cooper JD,Patterson GA.Prevalence of benign disease in patients undergoing resection for suspected lung cancer.The Annals of thoracic surgery 2006;81:1824-1828;discussion 1828-1829
34.Beane,J.,Sebastiani,P.,Liu,G.,Brody,J.S.,Lenburg,M.E.,&Spira,A.(2007).Reversible and permanent effects of tobacco smoke exposure on airway epithelial gene expression.Genome Biol,8(9),R201.
35.Spira A,Beane JE,Shah V,Steiling K,Liu G,Schembri F,Gilman S,Dumas YM,Calner P,Sebastiani P,Sridhar S,Beamis J,Lamb C,Anderson T,Gerry N,Keane J,Lenburg ME,Brody J.Airway epithelial gene expression in the diagnostic evaluation of smokers with suspect lung cancer.Nature Medicine 2007;13(3):361-6
36.Tibshirani,R.(1996).Regression shrinkage and selection via the lasso.Journal of the Royal Statistical Society.Series B(Methodological),267-288.
37.Da Wei Huang,B.T.S.,&Lempicki,R.A.(2008).Systematic and integrative analysis of large gene lists using DAVID bioinformatics resources.Nature protocols,4(1),44-57.
38.Irizarry,R.A.,Hobbs,B.,Collin,F.,Beazer-Barclay,Y.D.,Antonellis,K.J.,Scherf,U.,&Speed,T.P.(2003).Exploration,normalization,and summaries of high density oligonucleotide array probe level data.Biostatistics,4(2),249-264.
39.Dai,M.,Wang,P.,Boyd,A.D.,Kostov,G.,Athey,B.,Jones,E.G.,et al.,(2005).Evolving gene/transcript definitions significantly alter the interpretation of GeneChip data.Nucleic acids research,33(20),e175-e175.
40.Golub,T.R.,Slonim,D.K.,Tamayo,P.,Huard,C.,Gaasenbeek,M.,Mesirov,J.P.,et al.,(1999).Molecular classification of cancer:class discovery and class prediction by gene expression monitoring.Science,286(5439),531-537.
41.Kadara,H.,Fujimoto,J.,Yoo,S.Y.,Maki,Y.,Gower,A.C.,Kabbout,M.,et al.,(2014).Transcriptomic Architecture of the Adjacent Airway Field Cancerization in Non–Small cell lung cancer.Journal of the National Cancer Institute,106(3)
42.Steiling,K.,Ryan,J.,Brody,J.S.,&Spira,A.(2008).The field of tissue injury in the lung and airway.Cancer prevention research,1(6),396-403.
43.Bossé,Y.,Postma,D.S.,Sin,D.D.,Lamontagne,M.,Couture,C.,Gaudreault,N.,et al.,(2012).Molecular signature of smoking in human lung tissues.Cancer research,72(15),3753-3763.
44.Otsubo,C.,Otomo,R.,Miyazaki,M.,Matsushima-Hibiya,Y.,Kohno,T.,Iwakawa,R.,et al.,(2014).TSPAN2 Is Involved in Cell Invasion and Motility during Lung Cancer Progression.Cell reports,7(2),527-538.
45.
B.,Thorsen,K.,Lamy,P.,Wojdacz,T.K.,Hansen,L.L.,Birkenkamp-
K.,et al.,(2011).Identification and validation of highly frequent CpG island hypermethylation in colorectal adenomas and carcinomas.International journal of cancer,129(12),2855-2866.
46.Knudsen,A.,Monstad,S.E.,
A.,
P.E.,Salvesen,H.B.,Drivsholm,L.,et al.,(2006).Ri antibodies in patients with breast,ovarian or small cell lung cancer determined by a sensitive immunoprecipitation technique.Cancer Immunology,Immunotherapy,55(10),1280-1284.
47.Buckanovich,R.J.,Posner,J.B.,&Darnell,R.B.(1993).Nova,the paraneoplastic Ri antigen,is homologous to an RNA-binding protein and is specifically expressed in the developing motor system.Neuron,11(4),657-672.
48.Salemi,M.,Fraggetta,F.,Galia,A.,Pepe,P.,Cimino,L.,Condorelli,R.A.,&Calogero,A.E.(2013).Cerebellar degeneration-related autoantigen 1(CDR1)gene expression in prostate cancer cell lines.The International journal of biological markers,30;29(3):e288-90
49.Tanaka,M.,Tanaka,K.,Onodera,O.,&Tsuji,S.(1995).Trial to establish an animal model of paraneoplastic cerebellar degeneration with anti-Yo antibody:1.Mouse strains bearing different MHC molecules produce antibodies on immunization with recombinant Yo protein,but do not cause Purkinje cell loss.Clinical neurology and neurosurgery,97(1),95-100.
50.Furneaux,H.M.,Rosenblum,M.K.,Dalmau,J.,Wong,E.,Woodruff,P.,Graus,F.,&Posner,J.B.(1990).Selective expression of Purkinje-cell antigens in tumor tissue from patients with paraneoplastic cerebellar degeneration.New England Journal of Medicine,322(26),1844-1851.
51.Shih,I.M.,Nesbit,M.,Herlyn,M.,&Kurman,R.J.(1998).A new Mel-CAM(CD146)-specific monoclonal antibody,MN-4,on paraffin-embedded tissue.Modern pathology:an official journal of the United States and Canadian Academy of Pathology,Inc,11(11),1098-1106.
52.Tsukamoto,Y.,Taira,E.,Miki,N.,&Sasaki,F.(2001).The role of gicerin,a novel cell adhesion molecule,in development,regeneration and neoplasia.Histol Histopathol.2001;16(2):563-71.
53.Tsukamoto,Y.,Taira,E.,Kotani,T.,Yamate,J.,Wada,S.,Takaha,N.,et al.,(1996).Involvement of gicerin,a cell adhesion molecule,in tracheal development and regeneration.Cell Growth Differ.7(12),1761-1767.
54.Schulz,C.,Petrig,V.,Wolf,K.,
K.,
M.,Becker,B.,&Pfeifer,M.(2003).Upregulation of MCAM in primary bronchial epithelial cells from patients with COPD.Eur Respir J.2003;22(3):450-6.
55.Simon,G.C.,Martin,R.J.,Smith,S.,Thaikoottathil,J.,Bowler,R.P.,Barenkamp,S.J.,&Chu,H.W.(2011).Up-regulation of MUC18 in airway epithelial cells by IL-13:implications in bacterial adherence.Am J Resp Cell Mol Biol,44(5),606-613.
56.Penning,T.M.,&Lerman,C.(2008).Genomics of smoking exposure and cessation:lessons for cancer prevention and treatment.Cancer Prevention Research,1(2),80-83.
57.Lampe,J.W.,Stepaniants,S.B.,Mao,M.,Radich,J.P.,Dai,H.,Linsley,P.S.,et al.,(2004).Signatures of environmental exposures using peripheral leukocyte gene expression:tobacco smoke.Cancer Epidemiology Biomarkers&Prevention,13(3),445-453.
Sequence listing
<110> D.H.Whitney
M. Elasshoff
<120> method for evaluating lung cancer status
<130> VRCT-008/02US
<150> US 62/024,456
<151> 2014-07-14
<150> US 62/160,403
<151> 2015-05-12
<160> 46
<170> PatentIn version 3.5
<210> 1
<211> 25
<212> DNA
<213> Artificial sequence
<220>
<223> TSPAN2 Probe sequences
<400> 1
tcaacattaa gaagtcttaa ttcag 25
<210> 2
<211> 25
<212> DNA
<213> Artificial sequence
<220>
<223> MCAM Probe sequences
<400> 2
gctttaatcc ccatgaagga cagtg 25
<210> 3
<211> 25
<212> DNA
<213> Artificial sequence
<220>
<223> ATP12A Probe sequence
<400> 3
gcggtggaga taccggcggc ggcgc 25
<210> 4
<211> 25
<212> DNA
<213> Artificial sequence
<220>
<223> NOVA1 Probe sequence
<400> 4
gacgaaattc agacatggag catca 25
<210> 5
<211> 25
<212> DNA
<213> Artificial sequence
<220>
<223> MIA Probe sequences
<400> 5
atgacaccaa ggcacaccag ggacc 25
<210> 6
<211> 25
<212> DNA
<213> Artificial sequence
<220>
<223> CD177.1 Probe sequences
<400> 6
gacccgtctg tggctggtaa tctct 25
<210> 7
<211> 25
<212> DNA
<213> Artificial sequence
<220>
<223> EPHX3 Probe sequence
<400> 7
gctccactgg aagagaggta taccc 25
<210> 8
<211> 25
<212> DNA
<213> Artificial sequence
<220>
<223> CD177.2 Probe sequences
<400> 8
ttcctgtgtc ccattgagca ggttg 25
<210> 9
<211> 25
<212> DNA
<213> Artificial sequence
<220>
<223> CGREF1
<400> 9
tagggtacag cacttaacgc aatct 25
<210> 10
<211> 25
<212> DNA
<213> Artificial sequence
<220>
<223> BST1 Probe sequences
<400> 10
tgtttgccgt ttcccgttcc agaca 25
<210> 11
<211> 25
<212> DNA
<213> Artificial sequence
<220>
<223> RNF150 Probe sequence
<400> 11
tggttaatcc aagccgcagc ctggt 25
<210> 12
<211> 25
<212> DNA
<213> Artificial sequence
<220>
<223> CLDN22 Probe sequence
<400> 12
ggtgtttctc gtctccagtt cttga 25
<210> 13
<211> 25
<212> DNA
<213> Artificial sequence
<220>
<223> GABBR1 Probe sequence
<400> 13
tacggagcca ttacctgggc agtgc 25
<210> 14
<211> 25
<212> DNA
<213> Artificial sequence
<220>
<223> SDC2 Probe sequences
<400> 14
tgagcctgct tctccgggct cccct 25
<210> 15
<211> 25
<212> DNA
<213> Artificial sequence
<220>
<223> NKX3-1 Probe sequence
<400> 15
tttgtgctgg ctagtactcc ggtcg 25
<210> 16
<211> 25
<212> DNA
<213> Artificial sequence
<220>
<223> LYPD2 Probe sequence
<400> 16
ttcttcaagg cattcggggc tgggc 25
<210> 17
<211> 25
<212> DNA
<213> Artificial sequence
<220>
<223> CDR1
<400> 17
aacaactccg ggtcttccag cgact 25
<210> 18
<211> 25
<212> DNA
<213> Artificial sequence
<220>
<223> RPS4Y1 Probe sequence
<400> 18
taaaccgcag gaagtcagat gagtg 25
<210> 19
<211> 25
<212> DNA
<213> Artificial sequence
<220>
<223> SLC7A11
<400> 19
ggttgaagca actagaagcg tgaca 25
<210> 20
<211> 25
<212> DNA
<213> Artificial sequence
<220>
<223> CLDN10 Probe sequence
<400> 20
gacagcgttt catgctcgga tggcc 25
<210> 21
<211> 25
<212> DNA
<213> Artificial sequence
<220>
<223> TKT Probe sequence
<400> 21
ggtttattct ctccagacgg tcagg 25
<210> 22
<211> 25
<212> DNA
<213> Artificial sequence
<220>
<223> RUNX1T1 Probe sequence
<400> 22
taacagggag gaggtcaaat ctatc 25
<210> 23
<211> 25
<212> DNA
<213> Artificial sequence
<220>
<223> AKR1C2 Probe sequence
<400> 23
tagctgtagc ttactgaagt cgcca 25
<210> 24
<211> 25
<212> DNA
<213> Artificial sequence
<220>
<223> CD177.1 Probe sequences
<400> 24
gacgtgaacc agaccaatga agggc 25
<210> 25
<211> 25
<212> DNA
<213> Artificial sequence
<220>
<223> CD177.1 Probe sequences
<400> 25
tcccataggg caagtccgga tgctc 25
<210> 26
<211> 25
<212> DNA
<213> Artificial sequence
<220>
<223> CD177.1 Probe sequences
<400> 26
agcaggaagg gcaaaccact cccca 25
<210> 27
<211> 25
<212> DNA
<213> Artificial sequence
<220>
<223> CD177.1 Probe sequences
<400> 27
ccaagtgaga gactccaggc cctca 25
<210> 28
<211> 25
<212> DNA
<213> Artificial sequence
<220>
<223> CD177.1 Probe sequences
<400> 28
aggaggctgc acatcacgct tctca 25
<210> 29
<211> 25
<212> DNA
<213> Artificial sequence
<220>
<223> CD177.1 Probe sequences
<400> 29
ggaggctgca catcacgctt ctcac 25
<210> 30
<211> 25
<212> DNA
<213> Artificial sequence
<220>
<223> CD177.1 Probe sequences
<400> 30
acaagaagct ggaaggttgg gccac 25
<210> 31
<211> 25
<212> DNA
<213> Artificial sequence
<220>
<223> CD177.1 Probe sequences
<400> 31
aatgctcatt ttggtggaca gccca 25
<210> 32
<211> 25
<212> DNA
<213> Artificial sequence
<220>
<223> CD177.1 Probe sequences
<400> 32
ctacatctag gagcagcagc gtctc 25
<210> 33
<211> 25
<212> DNA
<213> Artificial sequence
<220>
<223> CD177.1 Probe sequences
<400> 33
agcagcgtct cctgacacac ctgcc 25
<210> 34
<211> 25
<212> DNA
<213> Artificial sequence
<220>
<223> CD177.1 Probe sequences
<400> 34
tcttgagcca agtttccgtg tgtca 25
<210> 35
<211> 25
<212> DNA
<213> Artificial sequence
<220>
<223> CD177.1 Probe sequences
<400> 35
tccgtgtgtc ataatggtgg tcccc 25
<210> 36
<211> 25
<212> DNA
<213> Artificial sequence
<220>
<223> CD177.1 Probe sequences
<400> 36
gttaacgagg ttgttgcaga agtcc 25
<210> 37
<211> 25
<212> DNA
<213> Artificial sequence
<220>
<223> CD177.1 Probe sequences
<400> 37
ttggagagca ccaggctcac ttggg 25
<210> 38
<211> 25
<212> DNA
<213> Artificial sequence
<220>
<223> CD177.1 Probe sequences
<400> 38
tctcaatgag catcaacgtg tcctg 25
<210> 39
<211> 25
<212> DNA
<213> Artificial sequence
<220>
<223> CD177.1 Probe sequences
<400> 39
gcaggtcgga caccttccac acatg 25
<210> 40
<211> 25
<212> DNA
<213> Artificial sequence
<220>
<223> CD177.1 Probe sequences
<400> 40
agggccagca gtaataccgc gctca 25
<210> 41
<211> 25
<212> DNA
<213> Artificial sequence
<220>
<223> CD177.1 Probe sequences
<400> 41
gggccagcag taataccgcg ctcat 25
<210> 42
<211> 25
<212> DNA
<213> Artificial sequence
<220>
<223> CD177.1 Probe sequences
<400> 42
gacccgtctg tggctggtaa tctct 25
<210> 43
<211> 25
<212> DNA
<213> Artificial sequence
<220>
<223> CD177.2 Probe sequences
<400> 43
ttcctgtgtc ccattgagca ggttg 25
<210> 44
<211> 25
<212> DNA
<213> Artificial sequence
<220>
<223> CD177.2 Probe sequences
<400> 44
tcccattgag caggttgcaa actgg 25
<210> 45
<211> 25
<212> DNA
<213> Artificial sequence
<220>
<223> CD177.2 Probe sequences
<400> 45
cctgaggagg ccatcataac agtgt 25
<210> 46
<211> 25
<212> DNA
<213> Artificial sequence
<220>
<223> CD177.2 Probe sequences
<400> 46
aggccatcat aacagtgtgt ggtcc 25