8000 EXA Use stem plot for ElasticNet and Lasso coefficients by mathurinm · Pull Request #13435 · scikit-learn/scikit-learn · GitHub
[go: up one dir, main page]

Skip to content

EXA Use stem plot for ElasticNet and Lasso coefficients #13435

New issue

Have a question about this project? Sign up for a free GitHub account to open an issue and contact its maintainers and the community.

By clicking “Sign up for GitHub”, you agree to our terms of service and privacy statement. We’ll occasionally send you account related emails.

Already on GitHub? Sign in to your account

Merged
merged 8 commits into from
Mar 16, 2019

Conversation

mathurinm
Copy link
Contributor

What does this implement/fix? Explain your changes.

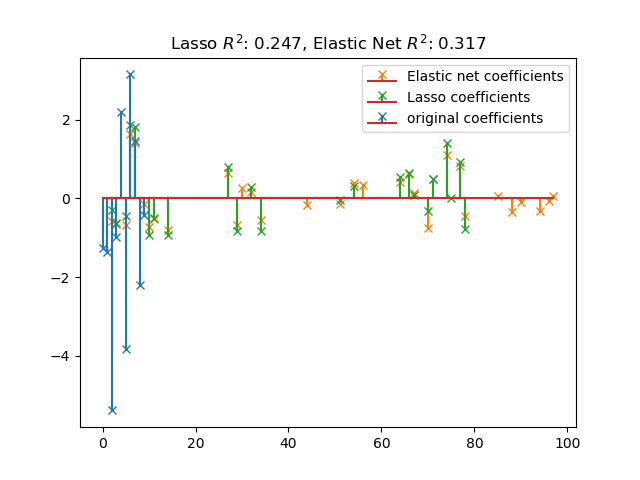
Current plot in Lasso/Elastic net example uses lines and is somehow difficult to read.

To me, it makes little sense to use lines to plot coefficients, since there is no "order" or proximity between feature indices. Using a stem plot, and plotting only non-zero values, is clearer IMO.
I have also used math formatting for R^2 and fewer significant digits in the legend.

Current plot:
image

Proposed:
image

Any other comments?

A notable drawback is that it makes the code a little bit more complicated

@jnothman
Copy link
Member

How do bars compare?

@mathurinm
Copy link
Contributor Author

@jnothman not so good I think:
image

I must use a small width to avoid overlapping bewteen bars, which makes the bars really thin

code:

width = 0.3
plt.bar(np.arange(n_features) - width, enet.coef_, width=width,
        label='Elastic net coefficients')
plt.bar(np.arange(n_features), lasso.coef_, width=width,
        label='Lasso coefficients')
plt.bar(np.arange(n_features) + width, coef, width=width,
        label='original coefficients')

@jnothman
Copy link
Member
jnothman commented Mar 13, 2019 via email

@mathurinm
Copy link
Contributor Author

removed dashed lines, used X as markers for all 3 models

Setting coefs[10:] = 0
instead of

inds = np.arange(n_features)
coefs[inds[10:]] = 0

yields (also, notice the performance drop, due to randomness I think)
image

Copy link
Contributor
@albertcthomas albertcthomas left a comment

Choose a reason for hiding this comment

The reason will be displayed to describe this comment to others. Learn more.

I also prefer the stem plot version. How about setting n_features to 100 instead of 200 so that the new plot is a bit less cluttered on the left? With 100 features:
stem_plot

@mathurinm
Copy link
Contributor Author

I like the idea @albertcthomas. I have also used deterministic coefs with alternated signs, which improve the plot imo:
image

Co-Authored-By: mathurinm <mathurinm@users.noreply.github.com>
@mathurinm
Copy link
Contributor Author

using old color codes 'r', 'g' and 'b' may be good enough while keeping the code simple:
image

@jnothman
Copy link
Member
jnothman commented Mar 14, 2019 via email

@mathurinm
Copy link
Contributor Author

So, you think the blue/orange/green figure (w. current code) is better ?

@albertcthomas
Copy link
Contributor

As it needs to be compatible with matplotlib 1.5.1 I am fine with the code as it is. This is how they set the colors in the source code of the plt.stem example in matplotlib 1.5.1, see here.

@jnothman do you know why we use matplotlib 1.5.1 in the min doc dependencies?

@jnothman
Copy link
Member

Well maybe we can change the min doc dependencies, but it certainly feels like Mpl2 hasn't been around so long!

@albertcthomas
Copy link
Contributor
albertcthomas commented Mar 14, 2019

Mpl2 hasn't been around so long

seems like a good reason :)

@qinhanmin2014
Copy link
Member

@jnothman do you know why we use matplotlib 1.5.1 in the min doc dependencies?

The minimal version of matplotlib for Ubuntu 16.04 is 1.5.1, see https://packages.ubuntu.com/xenial/python3-matplotlib

@qinhanmin2014
Copy link
Member

The minimal version of matplotlib for Ubuntu 16.04 is 1.5.1, see https://packages.ubuntu.com/xenial/python3-matplotlib

also see #12184

Copy link
Contributor
@albertcthomas albertcthomas left a comment

Choose a reason for hiding this comment

The reason will be displayed to describe this comment to others. Learn more.

Otherwise LGTM! Thanks @mathurinm

@albertcthomas
Copy link
Contributor

Thanks for the info @qinhanmin2014, that's good to know.

@mathurinm mathurinm changed the title ENH: use stem plot for ElasticNet and Lasso coefficients [MRG] ENH: use stem plot for ElasticNet and Lasso coefficients Mar 15, 2019
Copy link
Member
@qinhanmin2014 qinhanmin2014 left a comment

Choose a reason for hiding this comment

The reason will be displayed to describe this comment to others. Learn more.

LGTM, thanks @mathurinm

@qinhanmin2014 qinhanmin2014 changed the title [MRG] ENH: use stem plot for ElasticNet and Lasso coefficients EXA Use stem plot for ElasticNet and Lasso coefficients Mar 15, 2019
@jnothman jnothman merged commit ffc63c6 into scikit-learn:master Mar 16, 2019
@jnothman
Copy link
Member

Thanks @mathurinm!

xhluca pushed a commit to xhluca/scikit-learn that referenced this pull request Apr 28, 2019
koenvandevelde pushed a commit to koenvandevelde/scikit-learn that referenced this pull request Jul 12, 2019
@mathurinm mathurinm deleted the example_coefs_enet branch April 23, 2020 20:31
Sign up for free to join this conversation on GitHub. Already have an account? Sign in to comment
6AC8
Labels
None yet
Projects
None yet
Development

Successfully merging this pull request may close these issues.

4 participants
0