With sales of about 60 billion U.S. dollars, Nestlé SA was the
. Nestlé only produces non-alcoholic beverages. What is considered a non-alcoholic beverage partially depends on jurisdiction. Different countries having different limits of alcohol a product can contain and still be considered non-alcoholic. Many juices, for instance, contain some trace amounts of alcohol. In general, though, when people speak non-alcoholic beverages, they are referring to drink categories such as bottled water, soft drinks, and juices. Drinks not intended to produce the effects of alcohol.
Market size
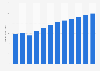
As many industries did, the non-alcoholic beverage market saw a decline in 2020 due to the COVID-19 pandemic. However,
global revenue grew steadily again after the end of the crisis, reaching around 1.6 trillion U.S. dollars in 2024. There is also a continuous growth forecast for the global non-alcoholic beverage market for the following years. The United States represents the largest
market in the world, with 500 million U.S. dollars in revenue.
Trade
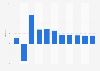
Switzerland was the
leading exporter of non-alcoholic beverages in 2023, shipping 1.6 billion U.S. dollars worth. Thailand, which only ranked fifth behind Switzerland in export value, was the leading
exporter in terms of volume. The country exported 811 million liters worth of non-alcoholic beverages in 2023. Not surprisingly, as the largest single market for non-alcoholic beverages, the United States was also the biggest
importer in the world, with imports valued at 1.2 billion U.S. dollars.
Consumption
Water is, by far, the
most consumed non-alcoholic beverage in the world. In 2023, over 506 billion liters of packaged water were consumed worldwide. In some parts of the world, packaged water is a necessity as the local water supply is not safe to drink. Even in parts of the world where local water is treated, many people drink bottled water for convenience or because they prefer the taste. It's not the water itself, but the minerals dissolved within it that impart the flavor. The United States had the highest
per capita consumption of non-alcoholic drinks, with Mexico only slightly behind. Much of Mexico's consumption comes from bottled water, as it is the
highest per capita consumer in the world.
This text provides general information. Statista assumes no
liability for the information given being complete or correct.
Due to varying update cycles, statistics can display more up-to-date
data than referenced in the text.