

J. Manuf. Mater. Process., Volume 4, Issue 4 (December 2020) – 28 articles
Cover Story (view full-size image):
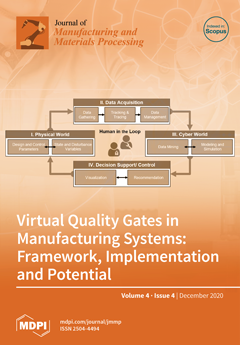
Manufacturing companies are exposed to increased complexity and competition. To stay competitive, companies need to minimize the total cost of quality while ensuring high transparency about process–product relationships within the manufacturing system. In this context, the development of technologies such as advanced analytics and cyber-physical production systems offers a promising approach. This paper discusses and defines essential elements of virtual quality gates in the context of manufacturing systems. To support the planning and implementation of virtual quality gates, a morphological box is developed which can be used to identify and derive an individual approach for a virtual quality gate based on the specific characteristics and requirements of the respective manufacturing system. Moreover, the framework is exemplified by three case studies from various industries, and resulting potentials
[...] Read more.
- Issues are regarded as officially published after their release is announced to the table of contents alert mailing list.
- You may sign up for e-mail alerts to receive table of contents of newly released issues.
- PDF is the official format for papers published in both, html and pdf forms. To view the papers in pdf format, click on the "PDF Full-text" link, and use the free Adobe Reader to open them.
Previous Issue
Next Issue