[go: up one dir, main page]

Next Issue
Volume 16, February-2
Previous Issue
Volume 16, January-2
 
 
polymers-logo

Journal Browser

Journal Browser

Polymers, Volume 16, Issue 3 (February-1 2024) – 141 articles

Cover Story (view full-size image): 
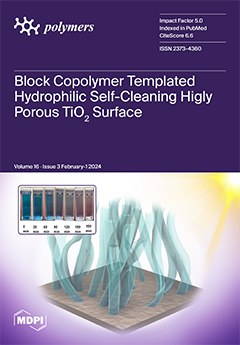
Titanium dioxide is a highly attractive material due to its self-cleaning ability that can be utilized in solar panels as an anti-reflective coating and anti-bacterial surface. These surfaces self-clean by decomposing organic contaminants and washing them away under UV irradiation. With a high surface-to-volume ratio, the performances of the TiO2 coatings can be enhanced. In this study, highly porous TiO2 coatings that revealed excellent photocatalytic degradation performance and stability were synthesized by swelling-assisted sequential infiltration synthesis (SIS) of a block copolymer template. View this paper
  • Issues are regarded as officially published after their release is announced to the table of contents alert mailing list.
  • You may sign up for e-mail alerts to receive table of contents of newly released issues.
  • PDF is the official format for papers published in both, html and pdf forms. To view the papers in pdf format, click on the "PDF Full-text" link, and use the free Adobe Reader to open them.
Order results
Result details
Section
Select all
Export citation of selected articles as:
22 pages, 4386 KiB  
Article
Synthesis, Characterization, and Evaluation of the Adsorption Behavior of Cellulose-Graft-Poly(Acrylonitrile-co-Acrylic Acid) and Cellulose-Graft-Poly(Acrylonitrile-co-Styrene) towards Ni(II) and Cu(II) Heavy Metals
by Amany S. El-Khouly and Yoshiaki Takahashi
Polymers 2024, 16(3), 445; https://doi.org/10.3390/polym16030445 - 5 Feb 2024
Cited by 2 | Viewed by 979
Abstract
In this study, the synthesis and characterization of grafted cellulose fiber with binary monomers mixture obtained using a KMnO4/citric acid redox initiator were investigated. Acrylonitrile (AN) was graft copolymerized with acrylic acid (AA) and styrene (Sty) at different monomer ratios with [...] Read more.
In this study, the synthesis and characterization of grafted cellulose fiber with binary monomers mixture obtained using a KMnO4/citric acid redox initiator were investigated. Acrylonitrile (AN) was graft copolymerized with acrylic acid (AA) and styrene (Sty) at different monomer ratios with evaluating percent graft yield (GY%). Cell-g-P(AN-co-AA) and Cell-g-P(AN-co-Sty) were characterized by SEM, FT-IR, 13C CP MAS NMR, TGA, and XRD. An AN monomer was used as principle-acceptor monomer, and GY% increases with AN ratio up to 60% of total monomers mixture volume. The adsorption behaviors of Cell-g-P(AN-co-AA) and Cell-g-P(AN-co-Sty) were studied for the adsorption of Ni(II) and Cu(II) metal ions from aqueous solution. Optimal adsorption conditions were determined, including 8 h contact time, temperature of 30 °C, and pH 5.5. Cell-g-P(AN-co-AA) showed maximum adsorption capacity of 435.07 mg/g and 375.48 mg/g for Ni(II) and Cu(II), respectively, whereas Cell-g-P(AN-co-Sty) showed a maximum adsorption capacity of 379.2 mg/g and 349.68 mg/g for Ni(II) and Cu(II), respectively. Additionally, adsorption equilibrium isotherms were studied, and the results were consistent with the Langmuir model. The Langmuir model’s high determinant coefficient (R2) predicted monolayer sorption of metal ions. Consequently, Cell-g-P(AN-co-AA) and Cell-g-P(AN-co-Sty) prepared by a KMnO4/citric acid initiator were found to be efficient adsorbents for heavy metals from wastewater as an affordable and adequate alternative. Full article
Show Figures

Figure 1

Figure 1
<p>(<b>a</b>) Percent graft yield (GY%) of AN + AA binary mixture onto cellulose, monomer concentration = 10 v%, time = 60 min, [KMnO<sub>4</sub>] = 0.05 mol/L, M:L ratio = 1:100, temperature = 70 °C, [citric acid] = 0.02 mol/L. (<b>b</b>) Percent graft yield (GY%) of AN + Sty binary mixture onto cellulose, monomer concentration = 10 v%, time = 60 min, [KMnO<sub>4</sub>] = 0.05 mol/L, M:L ratio = 1:100, temperature = 70 °C, [citric acid] = 0.02 mol/L.</p>
Full article ">Figure 2
<p>SEM images of (<b>a</b>) pure cellulose, (<b>b</b>) cell-g-PAN, (<b>c</b>) Cell-g-P(AN-co-AA), and (<b>d</b>) Cell-g-P(AN-co-Sty).</p>
Full article ">Figure 3
<p>(<b>a</b>) FT-IR Spectra of pure cellulose and its grafted samples with monomer mixtures. (<b>b</b>) FT-IR of grafted cellulose with monomer mixtures after adsorption of Ni(II) and Cu(II) metal ions.</p>
Full article ">Figure 3 Cont.
<p>(<b>a</b>) FT-IR Spectra of pure cellulose and its grafted samples with monomer mixtures. (<b>b</b>) FT-IR of grafted cellulose with monomer mixtures after adsorption of Ni(II) and Cu(II) metal ions.</p>
Full article ">Figure 4
<p><sup>13</sup>C CP MAS NMR spectra of pure cellulose, cellulose-graft-polyacrylonitrile, and its binary monomer mixtures with AA and Sty.</p>
Full article ">Figure 5
<p>TG graphs of pure cellulose and grafted cellulose with various monomers mixtures.</p>
Full article ">Figure 6
<p>X-ray diffraction of pure cellulose and grafted cellulose with monomer mixture of 60:40 ratio of AN/vinyl monomer.</p>
Full article ">Figure 7
<p>(<b>a</b>) Effect of pH on the amount uptake by different adsorbents. (<b>b</b>) Effect of contact time on the amount uptake by different adsorbents.</p>
Full article ">Figure 8
<p>Effect of temperature on the adsorption ratio of different adsorbent cellulose samples at pH = 5.5, time = 8 h, metal ion concentration = 600 mg/L, volume = 50 mL, adsorbent amount = 0.05 g.</p>
Full article ">Figure 9
<p>Effect of the metal ion concentration (<b>a</b>) Ni(II), (<b>b</b>) Cu(II) on the adsorption efficiency of cellulose graft copolymer derivatives at contact time = 8 h., pH = 5.5, T = 30 °C, adsorbent amount = 0.05 g, V = 50 mL.</p>
Full article ">Figure 10
<p>Langmuir (<b>a</b>) and Freundlich (<b>b</b>) isotherm models for the adsorption of Ni(II) and Cu(II) at contact time = 8 h, pH = 5.5, T = 30 °C, adsorbent amount = 0.05 g, and V = 50 mL.</p>
Full article ">Figure 10 Cont.
<p>Langmuir (<b>a</b>) and Freundlich (<b>b</b>) isotherm models for the adsorption of Ni(II) and Cu(II) at contact time = 8 h, pH = 5.5, T = 30 °C, adsorbent amount = 0.05 g, and V = 50 mL.</p>
Full article ">
17 pages, 7043 KiB  
Article
The Influence of the Flexibility of a Polymeric Adhesive Layer on the Mechanical Response of a Composite Reinforced Concrete Slab and a Reinforced Concrete Beam Girder
by Paweł Szeptyński, Jan Grzegorz Pochopień, Dorota Jasińska and Arkadiusz Kwiecień
Polymers 2024, 16(3), 444; https://doi.org/10.3390/polym16030444 - 5 Feb 2024
Cited by 1 | Viewed by 1215
Abstract
This study addresses the challenges of modeling flexible connections in composite structures employing a polymeric adhesive layer. These types of connections provide a more uniform stress distribution compared to conventional rigid connectors. However, they lack standardized design rules and still require much research [...] Read more.
This study addresses the challenges of modeling flexible connections in composite structures employing a polymeric adhesive layer. These types of connections provide a more uniform stress distribution compared to conventional rigid connectors. However, they lack standardized design rules and still require much research to sufficiently comprehend their properties. The novelty of this research lies in proposing an analytical solution to address these issues. Its aim is to investigate the influence of the stiffness of the polymer adhesive on the girder’s deflection and on the maximum stresses in both the adhesive and concrete. The analyzed composite structure consists of a reinforced concrete (RC) slab and an RC beam connected with a layer of flexible polyurethane (FPU) adhesive. Analytical and numerical approaches for the description of the mechanical response of a composite bridge girder are presented. Another objective is to validate the analytical design formulas using 3D nonlinear numerical analysis, both in the case of uncracked and cracked concrete. Seven types of FPUs are tested in the uniaxial tension test, each examined at five strain rates. The obtained data is used to predict the mechanical response of the considered girder using finite element analysis (FEA) as well as with a simplified one-dimensional composite beam theory. Fair agreement is found between the FEA results and theoretical predictions. A comparison of the results obtained for these two models is performed, and the similarities and discrepancies are highlighted and discussed. Full article
(This article belongs to the Special Issue Polymer Composites for Structural Strengthening)
Show Figures

Figure 1

Figure 1
<p>Strain distribution in composite cross-sections, depending on the type of connection.</p>
Full article ">Figure 2
<p>Geometry of specimen type 1A according to ISO 527 standard.</p>
Full article ">Figure 3
<p>Tensile test experimental setup. (<b>Left</b>): before the specimen deformation, (<b>Right</b>): after the specimen deformation.</p>
Full article ">Figure 4
<p>The characteristics of the polyurethanes for the strain rate 100%/min—mean values.</p>
Full article ">Figure 5
<p>The characteristics of the polyurethane PM and its dependence on the strain rates—mean values.</p>
Full article ">Figure 6
<p>Cross-section of the composite girder.</p>
Full article ">Figure 7
<p>Side view of reinforcement in the composite girder (the explanation of the numbers is presented in <a href="#polymers-16-00444-f006" class="html-fig">Figure 6</a>).</p>
Full article ">Figure 8
<p>Distributions of deflection <math display="inline"><semantics> <mrow> <mi>w</mi> <mfenced> <mi>x</mi> </mfenced> </mrow> </semantics></math>, horizontal displacements <math display="inline"><semantics> <mrow> <msub> <mi>u</mi> <mn>1</mn> </msub> <mfenced> <mi>x</mi> </mfenced> </mrow> </semantics></math> and <math display="inline"><semantics> <mrow> <msub> <mi>u</mi> <mn>2</mn> </msub> <mfenced> <mi>x</mi> </mfenced> </mrow> </semantics></math>, extremal tensile and compressive stress in concrete <math display="inline"><semantics> <mrow> <msub> <mi>σ</mi> <mrow> <mi>m</mi> <mi>a</mi> <mi>x</mi> </mrow> </msub> <mfenced> <mi>x</mi> </mfenced> </mrow> </semantics></math> and <math display="inline"><semantics> <mrow> <msub> <mi>σ</mi> <mrow> <mi>m</mi> <mi>i</mi> <mi>n</mi> </mrow> </msub> <mfenced> <mi>x</mi> </mfenced> </mrow> </semantics></math>, and shear stress in adhesive layer <math display="inline"><semantics> <mrow> <mi>τ</mi> <mfenced> <mi>x</mi> </mfenced> </mrow> </semantics></math>.</p>
Full article ">Figure 9
<p>FEM model of the composite girder (the red color marks the FPU adhesive layer).</p>
Full article ">Figure 10
<p>Maximum deflection in the middle of the span.</p>
Full article ">Figure 11
<p>Maximal shear stress in the adhesive layer in the support zone.</p>
Full article ">Figure 12
<p>Maximal distortional strain in the adhesive layer in the support zone.</p>
Full article ">Figure 13
<p>Maximal stress in the mid-span in the bottom fibers of the top plate.</p>
Full article ">Figure 14
<p>Minimal compressive stress in the mid-span in the top fibers of the top plate.</p>
Full article ">Figure 15
<p>Maximal tensile stress in the mid-span in the bottom fibers of the bottom beam.</p>
Full article ">Figure 16
<p>Minimal compressive stress in the mid-span in the top fibers of the bottom beam.</p>
Full article ">
34 pages, 2277 KiB  
Review
Wastewater Treatment Using Membrane Bioreactor Technologies: Removal of Phenolic Contaminants from Oil and Coal Refineries and Pharmaceutical Industries
by Mohd Jahir Khan, Agung Wibowo, Zoheb Karim, Pattaraporn Posoknistakul, Babasaheb M. Matsagar, Kevin C.-W. Wu and Chularat Sakdaronnarong
Polymers 2024, 16(3), 443; https://doi.org/10.3390/polym16030443 - 5 Feb 2024
Cited by 3 | Viewed by 3100
Abstract
Huge amounts of noxious chemicals from coal and petrochemical refineries and pharmaceutical industries are released into water bodies. These chemicals are highly toxic and cause adverse effects on both aquatic and terrestrial life. The removal of hazardous contaminants from industrial effluents is expensive [...] Read more.
Huge amounts of noxious chemicals from coal and petrochemical refineries and pharmaceutical industries are released into water bodies. These chemicals are highly toxic and cause adverse effects on both aquatic and terrestrial life. The removal of hazardous contaminants from industrial effluents is expensive and environmentally driven. The majority of the technologies applied nowadays for the removal of phenols and other contaminants are based on physio-chemical processes such as solvent extraction, chemical precipitation, and adsorption. The removal efficiency of toxic chemicals, especially phenols, is low with these technologies when the concentrations are very low. Furthermore, the major drawbacks of these technologies are the high operation costs and inadequate selectivity. To overcome these limitations, researchers are applying biological and membrane technologies together, which are gaining more attention because of their ease of use, high selectivity, and effectiveness. In the present review, the microbial degradation of phenolics in combination with intensified membrane bioreactors (MBRs) has been discussed. Important factors, including the origin and mode of phenols’ biodegradation as well as the characteristics of the membrane bioreactors for the optimal removal of phenolic contaminants from industrial effluents are considered. The modifications of MBRs for the removal of phenols from various wastewater sources have also been addressed in this review article. The economic analysis on the cost and benefits of MBR technology compared with conventional wastewater treatments is discussed extensively. Full article
(This article belongs to the Section Biomacromolecules, Biobased and Biodegradable Polymers)
Show Figures

Graphical abstract

Graphical abstract
Full article ">Figure 1
<p>Ortho and meta pathways of aerobic biodegradation of phenol and its derivatives in microorganisms [<a href="#B116-polymers-16-00443" class="html-bibr">116</a>]. Copyright 2016, Elsevier. Note: Texts with black color are degrading substances and those with blue colors are enzymes.</p>
Full article ">Figure 2
<p>Anaerobic biodegradation pathway of phenol and <span class="html-italic">p</span>-cresol in bacteria [<a href="#B117-polymers-16-00443" class="html-bibr">117</a>]. Copyright 2015, Elsevier. Phenyl phosphate synthase (PPS); <span class="html-italic">p</span>-cresol methyl hydroxylase (CMH); phenyl phosphate carboxylase (PPC); aldehyde dehydrogenase (ADH); 4-hydroxybenzoate-CoA ligase (HBCL); and 4-hydroxybenzoyl-CoA reductase (HBCR). Note: Texts with black color are degrading substances and those with blue colors are enzymes.</p>
Full article ">Figure 3
<p>An integrated (internal) MBR system [<a href="#B134-polymers-16-00443" class="html-bibr">134</a>]. Copyright 2018, Elsevier.</p>
Full article ">Figure 4
<p>A recirculated (external) MBR system [<a href="#B134-polymers-16-00443" class="html-bibr">134</a>]. Copyright 2018, Elsevier.</p>
Full article ">Figure 5
<p>A single-fiber immobilized cell, capillary membrane bioreactor system [<a href="#B177-polymers-16-00443" class="html-bibr">177</a>]. Copyright 2006, Elsevier.</p>
Full article ">Figure 6
<p>(<b>a</b>) EMBR and (<b>b</b>) principle of EMBR adopted from [<a href="#B180-polymers-16-00443" class="html-bibr">180</a>]. Copyright 2020, Elsevier.</p>
Full article ">Figure 7
<p>Flow diagram of an HFMBR system [<a href="#B184-polymers-16-00443" class="html-bibr">184</a>]. Copyright 2021, Elsevier.</p>
Full article ">Figure 8
<p>Flow diagram of a MBBR [<a href="#B165-polymers-16-00443" class="html-bibr">165</a>]. Copyright 2014, Springer Nature.</p>
Full article ">
18 pages, 5223 KiB  
Review
Rheology of Highly Filled Polymer Compositions—Limits of Filling, Structure, and Transport Phenomena
by Alexander Ya. Malkin, Valery G. Kulichikhin, Svetlana Yu. Khashirova, Igor D. Simonov-Emelyanov and Anton V. Mityukov
Polymers 2024, 16(3), 442; https://doi.org/10.3390/polym16030442 - 5 Feb 2024
Cited by 5 | Viewed by 1239
Abstract
The current state of the rheology of various polymeric and other materials containing a high concentration of spherical solid filler is considered. The physics of the critical points on the concentration scale are discussed in detail. These points determine the features of the [...] Read more.
The current state of the rheology of various polymeric and other materials containing a high concentration of spherical solid filler is considered. The physics of the critical points on the concentration scale are discussed in detail. These points determine the features of the rheological behavior of the highly filled materials corresponding to transitions from a liquid to a yielding medium, elastic–plastic state, and finally to an elastic solid-like state of suspensions. Theoretical and experimental data are summarized, showing the limits of the most dense packing of solid particles, which is of key importance for applications and obtaining high-quality products. The results of model and fine structural studies of physical phenomena that occur when approaching the point of filling the volume, including the occurrence of instabilities, are considered. The occurrence of heterogeneity in the form of individual clusters is also described. These heterogeneous objects begin to move as a whole that leads to the appearance of discontinuities in the suspension volume or wall slip. Understanding these phenomena is a key for particle technology and multiphase processing. Full article
(This article belongs to the Section Polymer Composites and Nanocomposites)
Show Figures

Graphical abstract

Graphical abstract
Full article ">Figure 1
<p>Filling the volume by controlling the particle size distribution of the bidispersed phase: mono-(<b>a</b>), bi-(<b>b</b>), and ternary (<b>c</b>) distributions.</p>
Full article ">Figure 2
<p>Evolution of the elastic (storage) modulus in increasing the concentration of a solid phase.</p>
Full article ">Figure 3
<p>Empty spaces (shown as red ovals) when the volume is randomly filled using spherical particles.</p>
Full article ">Figure 4
<p>Microphotograph of a 60% suspension of aluminum powder (scanning electron microscope JSM-6510 LV, JEOL, Akishima, Japan).</p>
Full article ">Figure 5
<p>Dependence of the apparent viscosity on shear rate for concentrated suspensions of rigid particles.</p>
Full article ">Figure 6
<p>The transition from CST to DST when increasing the concentration of a disperse phase CaCO<sub>3</sub> in poly(ethylene glycol) [<a href="#B51-polymers-16-00442" class="html-bibr">51</a>] (with permission).</p>
Full article ">Figure 7
<p>Self-oscillations in shearing the 56 mass. % suspension of <span class="html-italic">α</span>-FeOOH (Goethite) in transformer oil at a constant given global shear rate [<a href="#B53-polymers-16-00442" class="html-bibr">53</a>].</p>
Full article ">Figure 8
<p>Photo of suspension flowing in the channel with a height of 1.0 mm (<b>a</b>) and the corresponding velocity profile (<b>b</b>). The shaded field is the area near the wall, the dotted line is the average flow velocity. The experiments have been performed using app. 40 vol. % suspension of <span class="html-italic">α</span>-FeOOH in water [<a href="#B78-polymers-16-00442" class="html-bibr">78</a>].</p>
Full article ">Figure 9
<p>The shear-induced formation of a central low-concentrated layer (transition from the homogeneous suspension (<b>1</b>) to a stratified structure (<b>2</b>) Different colors correspond to various concentrations—blue 48%, red 58% [<a href="#B47-polymers-16-00442" class="html-bibr">47</a>] (with permission).</p>
Full article ">Figure 10
<p>Slip of clusters in highly concentrated suspensions. Red arrows show the direction if shift.</p>
Full article ">Figure 11
<p>Development of deformation over time for 55% suspension at different given shear stresses (torques) measured on a rotational rheometer. Stresses (in Pa) are shown at the curves [<a href="#B99-polymers-16-00442" class="html-bibr">99</a>].</p>
Full article ">Figure 12
<p>Durability of the adhesion strength of the suspension/surface contact. Concentration of the suspensions and the type of surface are shown at the curves [<a href="#B99-polymers-16-00442" class="html-bibr">99</a>].</p>
Full article ">Figure 13
<p>Diagram of the rheological states of suspensions dependent on concentration and applied stress. Comments—in the text.</p>
Full article ">
16 pages, 8385 KiB  
Article
Kinetic Study of the Diels–Alder Reaction between Maleimide and Furan-Containing Polystyrene Using Infrared Spectroscopy
by Tongtong Wang, Dali Gao, Hua Yin, Jiawei Zhao, Xingguo Wang and Hui Niu
Polymers 2024, 16(3), 441; https://doi.org/10.3390/polym16030441 - 5 Feb 2024
Viewed by 1546
Abstract
The Diels–Alder (D–A) reaction between furan and maleimide is a thermally reversible reaction that has become a vital chemical technique for designing polymer structures and functions. The kinetics of this reaction, particularly in polymer bulk states, have significant practical implications. In this study, [...] Read more.
The Diels–Alder (D–A) reaction between furan and maleimide is a thermally reversible reaction that has become a vital chemical technique for designing polymer structures and functions. The kinetics of this reaction, particularly in polymer bulk states, have significant practical implications. In this study, we investigated the feasibility of utilizing infrared spectroscopy to measure the D–A reaction kinetics in bulk-state polymer. Specifically, we synthesized furan-functionalized polystyrene and added a maleimide small-molecule compound to form a D–A adduct. The intensity of the characteristic absorption peak of the D–A adduct was quantitatively measured by infrared spectroscopy, and the dependence of conversion of the D–A reaction on time was obtained at different temperatures. Subsequently, the D–A reaction apparent kinetic coefficient kapp and the Arrhenius activation energy Ea,D–A were calculated. These results were compared with those determined from 1H-NMR in the polymer solution states. Full article
(This article belongs to the Section Polymer Analysis and Characterization)
Show Figures

Figure 1

Figure 1
<p>Furan/maleimide systems designed in this work.</p>
Full article ">Figure 2
<p>FTIR spectra of PSF, Ma, and PSF-Ma.</p>
Full article ">Figure 3
<p>FTIR spectra of (<b>A</b>) the heating procedure of PSF-Ma from 30 °C to 150 °C, (<b>B</b>) the cooling procedure of PSF-Ma from 150 °C to 30 °C, (<b>C</b>) holding the temperature at 150 °C for 30 min, and (<b>D</b>) holding the temperature at 70 °C for 60 min.</p>
Full article ">Figure 4
<p>Dependence of conversion x on reaction time in PSF/Ma system derived from FTIR results at 40 °C, 50 °C, 60 °C, 70 °C, 80 °C, and 90 °C, respectively.</p>
Full article ">Figure 5
<p>Fitting the conversion data to (<b>A</b>) first-order, (<b>B</b>) second-order, and (<b>C</b>) third-order reaction kinetics to determine the apparent kinetic coefficient <span class="html-italic">k</span><sub>app</sub> of D–A reaction between PSF and Ma at 40 °C, 50 °C, 60 °C, 70 °C, and 80 °C based on the FTIR results.</p>
Full article ">Figure 6
<p>Fitting the Arrhenius plot to (<b>A</b>) first-order, (<b>B</b>) second-order, and (<b>C</b>) third-order reaction to determine the <span class="html-italic">E</span><sub>a,D–A</sub> and <span class="html-italic">k</span><sub>0,D–A</sub> of the D–A reaction between PSF and Ma based on the FTIR results.</p>
Full article ">Figure 7
<p><sup>1</sup>H-NMR spectra of PSF, Ma, and PSF-Ma. (* solvent: C<sub>2</sub>D<sub>2</sub>Cl<sub>4</sub>).</p>
Full article ">Figure 8
<p><sup>1</sup>H-NMR spectra of PSF-Ma at variable temperatures. (* solvent: C<sub>2</sub>D<sub>2</sub>Cl<sub>4</sub>).</p>
Full article ">Figure 9
<p>Dependence of conversion x on reaction time in PSF/Ma system derived from <sup>1</sup>H-NMR results at 40 °C, 50 °C, 60 °C, 70 °C, and 80 °C, respectively.</p>
Full article ">Figure 10
<p>Fitting the conversion data to (<b>A</b>) first-order, (<b>B</b>) second-order, and (<b>C</b>) third-order reaction kinetics to determine the apparent kinetic coefficient <span class="html-italic">k</span><sub>app</sub> of D–A reaction between PSF and Ma at 40 °C, 50 °C, 60 °C, 70 °C, and 80 °C based on the <sup>1</sup>H-NMR results.</p>
Full article ">Figure 11
<p>FTIR spectra of PSF, Mb, and PSF-Mb.</p>
Full article ">Figure 12
<p>FTIR spectra of (<b>A</b>) the heating procedure of PSF-Mb from 30 °C to 150 °C and (<b>B</b>) the cooling procedure of PSF-Mb from 150 °C to 30 °C.</p>
Full article ">Figure 13
<p>Dependence of conversion x on reaction time in PSF/Mb system derived from FTIR results at 40 °C, 50 °C, 60 °C, 70 °C, 80 °C, and 90 °C, respectively.</p>
Full article ">Figure 14
<p><sup>1</sup>H-NMR spectra of PSF, Mb, and PSF-Mb. (* solvent: C<sub>2</sub>D<sub>2</sub>Cl<sub>4</sub>).</p>
Full article ">Figure 15
<p><sup>1</sup>H-NMR spectra of PSF-Mb at variable temperatures. (* solvent: C<sub>2</sub>D<sub>2</sub>Cl<sub>4</sub>).</p>
Full article ">Figure 16
<p>Dependence of conversion x on reaction time in PSF/Mb system derived from <sup>1</sup>H-NMR results at 40 °C, 50 °C, 60 °C, 70 °C, and 80 °C, respectively.</p>
Full article ">Scheme 1
<p>Synthesis route of furan-functionalized polystyrene PFS.</p>
Full article ">Scheme 2
<p>Reversible Diels–Alder reaction between PSF and Ma.</p>
Full article ">Scheme 3
<p>Reversible Diels–Alder reaction between PSF and Mb.</p>
Full article ">
32 pages, 7045 KiB  
Review
Recent Developments in Polyurea Research for Enhanced Impact Penetration Resistance and Blast Mitigation
by Yifan Wang, Lailong Ding, Jiayu Lin, Xishun Qiu, Chao Wu, Changhao Liu, Yicheng Tian, Rui Zhang, Weibo Huang and Mingliang Ma
Polymers 2024, 16(3), 440; https://doi.org/10.3390/polym16030440 - 5 Feb 2024
Cited by 2 | Viewed by 2509
Abstract
Polyurea has gained significant attention in recent years as a functional polymer material, specifically regarding blast and impact protection. The molecular structure of polyurea is characterized by the rapid reaction between isocyanate and the terminal amine component, and forms an elastomeric copolymer that [...] Read more.
Polyurea has gained significant attention in recent years as a functional polymer material, specifically regarding blast and impact protection. The molecular structure of polyurea is characterized by the rapid reaction between isocyanate and the terminal amine component, and forms an elastomeric copolymer that enhances substrate protection against blast impact and fragmentation penetration. At the nanoscale, a phase-separated microstructure emerges, with dispersed hard segment microregions within a continuous matrix of soft segments. This unique microstructure contributes to the remarkable mechanical properties of polyurea. To maximize these properties, it is crucial to analyze the molecular structure and explore methods like formulation optimization and the incorporation of reinforcing materials or fibers. Current research efforts in polyurea applications for protective purposes primarily concentrate on construction, infrastructure, military, transportation and industrial products and facilities. Future research directions should encompass deliberate formulation design and modification, systematic exploration of factors influencing protective performance across various applications and the integration of numerical simulations and experiments to reveal the protective mechanisms of polyurea. This paper provides an extensive literature review that specifically examines the utilization of polyurea for blast and impact protection. It encompasses discussions on material optimization, protective mechanisms and its applications in blast and impact protection. Full article
(This article belongs to the Section Polymer Applications)
Show Figures

Figure 1

Figure 1
<p>Synthesis and schematic representation of PUR1000 [<a href="#B32-polymers-16-00440" class="html-bibr">32</a>]. Reproduced with permission from [Ting Li, et al.], [A multi-scale investigation on effects of hydrogen bonding on microstructure and macro−properties in a polyurea.]; published by [Polymer], [2018].</p>
Full article ">Figure 2
<p>(<b>a</b>) Temperature−dependent FTIR spectra and (<b>b</b>) the corresponding percentage of different carbonyl groups of PUR1000 from 25 °C to 225 °C [<a href="#B32-polymers-16-00440" class="html-bibr">32</a>]. Reproduced with permission from [Ting Li, et al.], [A multi-scale investigation on effects of hydrogen bonding on microstructure and macro−properties in a polyurea.]; published by [Polymer], [2018].</p>
Full article ">Figure 3
<p>Results of (<b>a</b>) quasi-static compression tests; and (<b>b</b>) quasi-static tensile tests [<a href="#B34-polymers-16-00440" class="html-bibr">34</a>]. Reproduced with permission from [Zhang, L., et al.], [Effect of polyurea coating with different mechanical properties on blast resistance of aluminum alloy circular tube structures: Experiments vs numerical simulations.]; published by [Thin-Walled Struct.], [2023].</p>
Full article ">Figure 4
<p>Split Hopkinson pressure bar (SHPB) results of polyurea at different strain rates, (<b>a</b>) strain rates in the range of 1000/s−3000/s, (<b>b</b>) strain rates in the range of 4000/s−6000/s [<a href="#B34-polymers-16-00440" class="html-bibr">34</a>]. Reproduced with permission from [Zhang, L., et al.], [Effect of polyurea coating with different mechanical properties on blast resistance of aluminum alloy circular tube structures: Experiments vs numerical simulations.]; published by [Thin−Walled Struct.], [2023].</p>
Full article ">Figure 5
<p>Stress wave propagation in PCS plates. (<b>a</b>) Rear−side sprayed, (<b>b</b>) impact−side sprayed and (<b>c</b>) both−side sprayed plates with shock wave propagation effect, (<b>d</b>) reasons for the enhanced steel plate damage effect of PCS plates with thinner polyurea coatings on the impact side [<a href="#B64-polymers-16-00440" class="html-bibr">64</a>]. Reproduced with permission from [Wu, G., et al.], [Damage response of polyurea−coated steel plates under combined blast and fragments loading.]; published by [J. Constr. Steel. Res.], [2022].</p>
Full article ">Figure 6
<p>Uncoated concrete specimen after explosion test deformation diagram: (<b>a</b>) blast face; (<b>b</b>) back−blast face; (<b>c</b>) side face; and (<b>d</b>) crack area of the side face [<a href="#B41-polymers-16-00440" class="html-bibr">41</a>]. Reproduced with permission from [Huang, W., et al.], [Study of Blast Mitigation Performance and Fracture Mechanism of Polyurea under Contact Explosion.]; published by [Polymers], [2022].</p>
Full article ">Figure 7
<p>T26 polyurea−coated concrete specimen after explosion test deformation diagram: (<b>a</b>) blast face; (<b>b</b>) back−blast face and cross-sectional view of back−blast face, and the backside was divided into three areas 1, 2 and 3 according to the deformation; (<b>c</b>) damage area of the blast−face coating; and (<b>d</b>) detail of coating damage [<a href="#B41-polymers-16-00440" class="html-bibr">41</a>]. Reproduced with permission from [Huang, W., et al.], [Study of Blast Mitigation Performance and Fracture Mechanism of Polyurea under Contact Explosion.]; published by [Polymers], [2022].</p>
Full article ">Figure 8
<p>Construction of polyurea reinforced CBMU walls: (<b>a</b>) bare clay brick wall substrate; (<b>b</b>) foundation; (<b>c</b>) masonry wall with cement mortar; and (<b>d</b>,<b>e</b>) polyurea coating reinforcement [<a href="#B84-polymers-16-00440" class="html-bibr">84</a>]. Reproduced with permission from [Wu, G., et al.], [Blast response of clay brick masonry unit walls unreinforced and reinforced with polyurea elastomer.]; published by [Def. Technol.], [2022].</p>
Full article ">Figure 9
<p>Plain RC plate specimen (<b>top</b>), PU−reinforced RC plate specimen (<b>middle</b>) and PU−WGF−reinforced RC plate specimen (<b>bottom</b>) after testing: before (<b>left</b>), after (<b>middle</b>) and cross−sectional view (<b>right</b>) [<a href="#B91-polymers-16-00440" class="html-bibr">91</a>]. Reproduced with permission from [Shi, S.Q., et al.], [Behavior of polyurea−woven glass fiber mesh composite reinforced RC slabs under contact explosion.]; published by [Int. J. Impact Eng.], [2019].</p>
Full article ">Figure 10
<p>(<b>a</b>,<b>b</b>) Inspiration, (<b>c</b>) fabrication and (<b>d</b>–<b>g</b>) morphology of bioinspired CCS/polyurea dual-phase architecture [<a href="#B118-polymers-16-00440" class="html-bibr">118</a>]. Reproduced with permission from [Zhang, X., et al.], [3D-printed bioinspired Al2O3/polyurea dual-phase architecture with high robustness, energy absorption, and cyclic life.]; published by [Chem. Eng. J.], [2023].</p>
Full article ">Figure 11
<p>Damage statuses and propagations: (<b>a</b>) bare pier and (<b>b</b>) polyurea−retrofitted pier [<a href="#B128-polymers-16-00440" class="html-bibr">128</a>]. Reproduced with permission from [Chen, F., et al.], [Multi−Hazard−Resistant Behavior of CFRP− and Polyurea−Retrofitted Reinforced Concrete Two−Column Piers under Combined Collision−Blast Loading.]; published by [Materials], [2023].</p>
Full article ">
17 pages, 4313 KiB  
Article
Catalysis of Silver and Bismuth in Various Epoxy Resins
by Hayun Jeong and Keon-Soo Jang
Polymers 2024, 16(3), 439; https://doi.org/10.3390/polym16030439 - 5 Feb 2024
Viewed by 1254
Abstract
Epoxy resins find extensive utility across diverse applications owing to their exceptional adhesion capabilities and robust mechanical and thermal characteristics. However, the demanding reaction conditions, including extended reaction times and elevated reaction temperature requirements, pose significant challenges when using epoxy resins, particularly in [...] Read more.
Epoxy resins find extensive utility across diverse applications owing to their exceptional adhesion capabilities and robust mechanical and thermal characteristics. However, the demanding reaction conditions, including extended reaction times and elevated reaction temperature requirements, pose significant challenges when using epoxy resins, particularly in advanced applications seeking superior material properties. To surmount these limitations, the conventional approach involves incorporating organic catalysts. Within the ambit of this investigation, we explored the catalytic potential of metallic powders, specifically bismuth (Bi) and silver (Ag), in epoxy resins laden with various curing agents, such as diacids, anhydrides, and amines. Metallic powders exhibited efficacious catalytic activity in epoxy–diacid and epoxy–anhydride systems. In contrast, their influence on epoxy–amine systems was rendered negligible, attributed to the absence of requisite carboxylate functional groups. Additionally, the catalytic performance of Bi and Ag are different, with Bi displaying superior efficiency owing to the presence of inherent metal oxide layers on its powder surfaces. Remarkably, the thermal and mechanical properties of uncatalyzed, fully cured epoxy resins closely paralleled those of their catalyzed counterparts. These findings accentuate the potential of Bi and Ag metal catalysts, particularly in epoxy–diacid and epoxy–anhydride systems, spanning a spectrum of epoxy-based applications. In summary, this investigation elucidates the catalytic capabilities of Bi and Ag metal powders, underscoring their ability to enhance the curing rate of epoxy resin systems involving diacids and anhydrides but not amines. This research points toward a promising trajectory for multifarious epoxy-related applications. Full article
(This article belongs to the Special Issue Advanced Epoxy-Based Materials IV)
Show Figures

Figure 1

Figure 1
<p>Chemical structures of materials used in this study.</p>
Full article ">Figure 2
<p>Exothermic reaction peaks exhibited by pristine epoxy binder and hardener-embedded epoxy resins containing Bi (<b>a</b>) and Ag (<b>b</b>) metal powders with different concentrations of 0, 1, and 20 vol%.</p>
Full article ">Figure 3
<p>Exothermic reaction peaks for homopolymerization and heteropolymerization of epoxy resins containing Bi and Ag metal powders with different concentrations: (<b>a</b>) GA, (<b>b</b>) AA, (<b>c</b>) MAn, (<b>d</b>) AAn, (<b>e</b>) DDS, and (<b>f</b>) D230.</p>
Full article ">Figure 3 Cont.
<p>Exothermic reaction peaks for homopolymerization and heteropolymerization of epoxy resins containing Bi and Ag metal powders with different concentrations: (<b>a</b>) GA, (<b>b</b>) AA, (<b>c</b>) MAn, (<b>d</b>) AAn, (<b>e</b>) DDS, and (<b>f</b>) D230.</p>
Full article ">Figure 4
<p>DSC scans of completely cured epoxy resins containing Bi (<b>a</b>,<b>c</b>,<b>e</b>) and Ag (<b>b</b>,<b>d</b>,<b>f</b>) metal powders with different metal concentrations: (<b>a</b>,<b>b</b>) GA, (<b>c</b>,<b>d</b>) AAn, and (<b>e</b>,<b>f</b>) D230.</p>
Full article ">Figure 5
<p>TGA graphs of pristine and Bi-embedded uncured epoxy resins with different curing agents: (<b>a</b>) AA, (<b>b</b>) MAn, and (<b>c</b>) DDS.</p>
Full article ">Figure 6
<p>Complex viscosity of pristine and Bi-embedded epoxy resins with different curing agents: (<b>a</b>) AA, (<b>b</b>) MAn, and (<b>c</b>) DDS.</p>
Full article ">Figure 7
<p>SEM images of fractured surfaces of pristine and Bi-embedded epoxy–anhydride (E-MAn) systems: (<b>a</b>) without metal, (<b>b</b>) 5 vol% Ag, (<b>c</b>) 20 vol% Ag, (<b>d</b>) 5 vol% Bi, and (<b>e</b>) 20 vol% Bi.</p>
Full article ">Figure 8
<p>SEM-EDS images of fractured surfaces of pristine and Bi-embedded epoxy–anhydride (E-MAn) systems: (<b>a</b>) without metal, (<b>b</b>) 20 vol% Ag, and (<b>c</b>) 20 vol% Bi.</p>
Full article ">Figure 9
<p>Mechanical properties of pristine and Bi-embedded epoxy–anhydride (E-MAn) systems: (<b>a</b>) tensile strength, (<b>b</b>) modulus, (<b>c</b>) elongation at break, and (<b>d</b>) toughness.</p>
Full article ">Figure 10
<p>DMA results of E-MAn with different Bi loadings: (<b>a</b>) storage modulus; (<b>b</b>) Tan δ.</p>
Full article ">
15 pages, 10959 KiB  
Article
MD-DFT Calculations on Dissociative Absorption Configurations of FOX-7 on (001)- and (101)-Oriented Crystalline Parylene Protective Membranes
by Weihui Luo, Liang Bian, Faqin Dong, Jianan Nie and Jingjie Yang
Polymers 2024, 16(3), 438; https://doi.org/10.3390/polym16030438 - 5 Feb 2024
Viewed by 951
Abstract
Crystalline poly-para-xylylene (parylene) has the potential for use as a protective membrane to delay the nucleation of explosives by separating the explosives and their decomposition products to decrease the explosive sensitivity. Here, molecular dynamics (MD) and density functional theory (DFT) techniques were used [...] Read more.
Crystalline poly-para-xylylene (parylene) has the potential for use as a protective membrane to delay the nucleation of explosives by separating the explosives and their decomposition products to decrease the explosive sensitivity. Here, molecular dynamics (MD) and density functional theory (DFT) techniques were used to calculate the dissociative adsorption configurations of 1,1-diamino-2,2-dinitroethylene (FOX-7) on (001)- and (101)-oriented crystalline parylene membranes. Based on the results of the calculations, this work demonstrates that the -NO2–π electrostatic interactions are the dominant passivation mechanism of FOX-7 on these oriented surfaces. FOX-7 can dissociatively adsorb on oriented parylene membranes due to the interactions between the LUMO of the toluene (or methyl) groups on parylene and the HOMO of the -NO2 (or -NH2) groups on FOX-7. The formation of a new intermolecular H-bond with the ONO group leads to FOX-7 decomposition via intramolecular C-NO2 bond fission and nitro-to-nitrite rearrangement. The most likely adsorption configurations are described in terms of the decomposition products, surface active groups of parylene, binding behaviors, and N charge transfer. Importantly, the (001)-oriented parylene AF8 membrane is promising for use as a protective membrane to passivate the high-energy -NO2 bonds during the dissociative adsorption of FOX-7. This study offers a new perspective on the development of protective membranes for explosives. Full article
(This article belongs to the Section Polymer Physics and Theory)
Show Figures

Figure 1

Figure 1
<p>Chain polymerization configurations (<b>a</b>), chemical formulas (<b>b</b>), potential energy and crystalline models (<b>c</b>) of parylene membranes. The color code is the following: grey, C; green, Cl; blue, F and white H. Blue area of parylene chains, low energy area; and yellow area, high energy area.</p>
Full article ">Figure 2
<p>Illustrations of frontier orbitals (Highest Occupied Molecular Orbital: HOMO; Lowest Unoccupied Molecular Orbital: LUMO) of FOX-7, (101)- and (001)-oriented parylene F surfaces. The color code is the following: grey, C; green, Cl; blue, F and white H. Blue area of parylene chains, low energy area; and yellow area, high energy area.</p>
Full article ">Figure 3
<p>Surface potential energies (eV) of parylene membranes and FOX-7.</p>
Full article ">Figure 4
<p>(<b>I1</b>–<b>I4</b>) Possible adsorption configurations of FOX-7 molecules on the (101)-oriented parylene membranes. (<b>II1</b>–<b>II4</b>) Possible adsorption configurations of FOX-7 molecules on the (001)-oriented parylene membranes.</p>
Full article ">Figure 5
<p>(<b>a</b>,<b>c</b>) The -NO<sub>2</sub> groups on FOX-7 bind to the groups in parylene; (<b>b</b>,<b>d</b>) The corresponding energy differences (ΔE) between the adsorption models and single systems.</p>
Full article ">Figure 6
<p>Illustrations of frontier orbitals of FOX-7 on (101)- and (001)-oriented parylene F membranes. (<b>I1</b>–<b>I4</b>) Possible adsorption configurations of FOX-7 molecules on the (101)-oriented parylene membranes. (<b>II1</b>–<b>II4</b>) Possible adsorption configurations of FOX-7 molecules on the (001)-oriented parylene membranes.</p>
Full article ">Figure 7
<p>Binding energies (eV) of various probable configurations of FOX-7 adsorbed on (101)- and (001)-oriented parylene membranes. In the figure, “M” refers to the methyl group, “T” refers to the toluene group, and “O” and “H” refer to the -NO<sub>2</sub> and -NH<sub>2</sub> functional groups of FOX-7, respectively.</p>
Full article ">Figure 8
<p>Mulliken charges of total N atoms of FOX-7 on (101)- and (001)-oriented parylene membranes.</p>
Full article ">Figure 9
<p>The most probable absorption configurations of (NH<sub>2</sub>)(NO<sub>2</sub>)C=C(NH<sub>2</sub>)O and A-(NH<sub>2</sub>)(NO<sub>2</sub>)C=C(NH<sub>2</sub>)OH on (101)- and (001)-oriented parylene membranes. In the figure, “A” refers to active adsorption sites of parylene surfaces. (<b>a1</b>,<b>a1′</b>) (NH<sub>2</sub>)(NO<sub>2</sub>)C=C(NH<sub>2</sub>)O; (<b>a2</b>,<b>a2′</b>) A-(NH<sub>2</sub>)(NO<sub>2</sub>)C=C(NH<sub>2</sub>)OH.</p>
Full article ">Figure 10
<p>The most probable absorption configurations of NH(NH<sub>2</sub>)C=CO, A-NH(NH<sub>2</sub>)C=CO, and (NH<sub>2</sub>)2C=CO on (101)- and (001)-oriented parylene membranes. (<b>b1</b>,<b>b1′</b>) NH(NH<sub>2</sub>)C=CO; (<b>b2</b>,<b>b2′</b>) A-NH(NH<sub>2</sub>)C=CO; (b3, b3′) (NH<sub>2</sub>)2C=CO.</p>
Full article ">Figure 11
<p>The most probable absorption configurations of HON=O and O=NO-A (FOX-7) on (101)- and (001)-oriented parylene membranes. (<b>c1</b>,<b>c1</b>′) HON=O; (<b>c2</b>,<b>c2′</b>) O=NO-A.</p>
Full article ">Figure 12
<p>Illustrations of frontier orbitals of FOX-7’s decomposition products on (101)- and (001)-oriented parylene F membranes. (<b>a<sub>2</sub></b>,<b>a<sub>2</sub>′</b>) A-(NH<sub>2</sub>)(NO<sub>2</sub>)C=C(NH<sub>2</sub>)OH; (<b>b<sub>1</sub>′</b>) NH(NH<sub>2</sub>)C=CO; (<b>b<sub>2</sub></b>,<b>b<sub>2</sub>′</b>) A-NH(NH<sub>2</sub>)C=CO; (<b>c<sub>1</sub></b>,<b>c<sub>1</sub>′</b>) HON=O; (<b>c<sub>2</sub></b>,<b>c<sub>2</sub>′</b>) O=NO-A.</p>
Full article ">Figure 13
<p>Binding energies (eV) of various probable configurations of FOX-7’s decomposition products adsorbed on (101)- and (001)-oriented parylene membranes. (<b>a</b>–<b>c</b>) reflect the adsorption models of parylene-(NH<sub>2</sub>)(NO<sub>2</sub>)C=C(NH<sub>2</sub>)OH, parylene-NH(NH<sub>2</sub>)C=CO, and O=NO-parylene, respectively. In the figure, “V” refers to the adsorption behavior of both -NO–π and -NH–π interactions of FOX-7’s decomposition products being bound by parylene toluene groups through intramolecular H-bond breakage, “M” refers to methyl-ON-(or -NH-) adsorption, and “T” refers to toluene-ON-(or -NH-) adsorption.</p>
Full article ">
12 pages, 2179 KiB  
Article
Machine Learning Backpropagation Prediction and Analysis of the Thermal Degradation of Poly (Vinyl Alcohol)
by Abdulrazak Jinadu Otaru, Zaid Abdulhamid Alhulaybi and Ibrahim Dubdub
Polymers 2024, 16(3), 437; https://doi.org/10.3390/polym16030437 - 5 Feb 2024
Cited by 2 | Viewed by 1834
Abstract
Thermogravimetric analysis (TGA) is crucial for describing polymer materials’ thermal behavior as a result of temperature changes. While available TGA data substantiated in the literature significantly focus attention on TGA performed at higher heating rates, this study focuses on the machine learning backpropagation [...] Read more.
Thermogravimetric analysis (TGA) is crucial for describing polymer materials’ thermal behavior as a result of temperature changes. While available TGA data substantiated in the literature significantly focus attention on TGA performed at higher heating rates, this study focuses on the machine learning backpropagation analysis of the thermal degradation of poly (vinyl alcohol), or PVA, at low heating rates, typically 2, 5 and 10 K/min, at temperatures between 25 and 600 °C. Initial TGA analysis showed that a consistent increase in heating rate resulted in an increase in degradation temperature as the resulting thermograms shifted toward a temperature maxima. At degradation temperatures between 205 and 405 °C, significant depths in the characterization of weight losses were reached, which may be attributed to the decomposition and loss of material content. Artificial neural network backpropagation of machine learning algorithms were used for developing mathematical descriptions of the percentage weight loss (output) by these PVA materials as a function of the heating rate (input 1) and degradation temperature (input 2) used in TGA analysis. For all low heating rates, modelling predictions were observably correlated with experiments with a 99.2% correlation coefficient and were used to interpolate TGA data at 3.5 and 7.5 K/min, indicating trends strongly supported by experimental TGA data as well as literature research. Thus, this approach could provide a useful tool for predicting the thermograms of PVA materials at low heating rates and contribute to the development of more advanced PVA/polymer materials for home and industrial applications. Full article
(This article belongs to the Collection Thermal Characterization of Polymers and Polymer Composites)
Show Figures

Figure 1

Figure 1
<p>Characteristic thermograms showing typical plots of actual weight percentages [wt%] against degradation temperature [°C] for (<b>a</b>) raw experimental data for different low heating rates of 2.0, 5.0 and 10.0 K/min, (<b>b</b>) selected experimental data for temperatures of 25 to 600 °C at 10 °C difference and (<b>c</b>) percentage weight losses at a 2 K/min heating rate.</p>
Full article ">Figure 2
<p>Machine learning backpropagation network analysis framework showing typical input, hidden and output neurons.</p>
Full article ">Figure 3
<p>Experimental and DNN modelling data of PVA weight percentages against degradation temperature [°C] for heating rates of (<b>a</b>) 2 K/min; (<b>b</b>) 5 K/min; (<b>c</b>) 10 K/min; (<b>d</b>) 2, 5, and 10 K/min; (<b>e</b>) 2, 5, and 10 K/min at a temperature of 205–405 °C; and (<b>f</b>) including interpolated and extrapolated data for heating rates between 3.5, 7.5 and 20 K/min.</p>
Full article ">Figure 3 Cont.
<p>Experimental and DNN modelling data of PVA weight percentages against degradation temperature [°C] for heating rates of (<b>a</b>) 2 K/min; (<b>b</b>) 5 K/min; (<b>c</b>) 10 K/min; (<b>d</b>) 2, 5, and 10 K/min; (<b>e</b>) 2, 5, and 10 K/min at a temperature of 205–405 °C; and (<b>f</b>) including interpolated and extrapolated data for heating rates between 3.5, 7.5 and 20 K/min.</p>
Full article ">
15 pages, 3906 KiB  
Article
Effect of Prestrain on Payne Effect and Hysteresis Loss of Carbon-Black-Filled Rubber Vulcanizates: Measurements and Modeling
by Boyuan Yin, Xinyue Jiao, Haibo Wen, Yan Li and Ming Li
Polymers 2024, 16(3), 436; https://doi.org/10.3390/polym16030436 - 4 Feb 2024
Cited by 1 | Viewed by 1087
Abstract
The performance of a viscoelastic damper is governed by the mechanical properties of the viscoelastic material, which are sensitive to prestrain. Among viscoelastic materials, carbon black (CB)-filled rubber vulcanizate is commonly used in structural applications. In this paper, the prestrain-dependent Payne effect and [...] Read more.
The performance of a viscoelastic damper is governed by the mechanical properties of the viscoelastic material, which are sensitive to prestrain. Among viscoelastic materials, carbon black (CB)-filled rubber vulcanizate is commonly used in structural applications. In this paper, the prestrain-dependent Payne effect and hysteresis loss of CB-filled rubber vulcanizates are investigated through experimental and theoretical analysis. Based on the experimental results, the classic quantitative models proposed by Kraus, Huber–Vilgis, and Maier–Göritz are used to describe the Payne effect. The results show that the Maier–Göritz model is most suitable to describe the Payne effect, especially for the loss modulus. After calculating the area of the hysteresis loops, hysteresis loss curves at various dynamic strain amplitudes are parallel to each other. Through application of the time–strain superposition principle, the hysteresis loss at any arbitrary prestrain can be predicted. Thus, the aim of this paper is to provide guidance for researchers in choosing an accurate model for future investigations of the prestrain-dependent Payne effect. An accelerated characterization method is useful for the prediction of the hysteresis loss of rubber products using small amounts of experimental data, which can provide manufacturers with more attractive and lower cost opportunities for testing the mechanical properties of rubber products. Full article
(This article belongs to the Special Issue Time-Dependent Mechanical Behavior of Polymers and Polymer Composites)
Show Figures

Figure 1

Figure 1
<p>Hysteresis loss calculation for a cyclic loading curve.</p>
Full article ">Figure 2
<p>Storage modulus vs. strain amplitude at various prestrains.</p>
Full article ">Figure 3
<p>Loss modulus vs. strain amplitude at various prestrains.</p>
Full article ">Figure 4
<p>Experimental data and the Kraus model fitting results.</p>
Full article ">Figure 5
<p>Experimental data and the Maier–Göritz model fitting results.</p>
Full article ">Figure 6
<p>Variation of parameter <math display="inline"><semantics> <mrow> <msubsup> <mi>E</mi> <mi>i</mi> <mo>′</mo> </msubsup> </mrow> </semantics></math> with prestrain.</p>
Full article ">Figure 7
<p>Variation of parameter <span class="html-italic">c</span> with prestrain.</p>
Full article ">Figure 8
<p>Hysteresis loops for various prestrains: (<b>a</b>) 1%; (<b>b</b>) 2%; (<b>c</b>) 3%; (<b>d</b>) 4%; (<b>e</b>) 5%; (<b>f</b>) 6%.</p>
Full article ">Figure 8 Cont.
<p>Hysteresis loops for various prestrains: (<b>a</b>) 1%; (<b>b</b>) 2%; (<b>c</b>) 3%; (<b>d</b>) 4%; (<b>e</b>) 5%; (<b>f</b>) 6%.</p>
Full article ">Figure 9
<p>Hysteresis loops at various prestrains and two given strain amplitudes: (<b>a</b>) 0.6%; (<b>b</b>) 1%.</p>
Full article ">Figure 10
<p>Relationship between stiffness and dynamic strain amplitudes under various prestrains.</p>
Full article ">Figure 11
<p>Variation of parameter <math display="inline"><semantics> <mrow> <msubsup> <mi>E</mi> <mi>i</mi> <mo>″</mo> </msubsup> </mrow> </semantics></math> with prestrain.</p>
Full article ">Figure 12
<p>Hysteresis loss for various prestrains.</p>
Full article ">Figure 13
<p>Superimposed curve of hysteresis loss.</p>
Full article ">Figure 14
<p>Experimentally determined shift factors vs. prestrain, fit to the WLF equation.</p>
Full article ">
18 pages, 2438 KiB  
Article
On Cyclic-Fatigue Crack Growth in Carbon-Fibre-Reinforced Epoxy–Polymer Composites
by Silvain Michel, Neal Murphy, Anthony J. Kinloch and Rhys Jones
Polymers 2024, 16(3), 435; https://doi.org/10.3390/polym16030435 - 4 Feb 2024
Cited by 3 | Viewed by 991
Abstract
The growth of cracks between plies, i.e., delamination, in continuous fibre polymer matrix composites under cyclic-fatigue loading in operational aircraft structures has always been a very important factor, which has the potential to significantly decrease the service life of such structures. Whilst current [...] Read more.
The growth of cracks between plies, i.e., delamination, in continuous fibre polymer matrix composites under cyclic-fatigue loading in operational aircraft structures has always been a very important factor, which has the potential to significantly decrease the service life of such structures. Whilst current designs are based on a ‘no growth’ design philosophy, delamination growth can nevertheless arise in operational aircraft and compromise structural integrity. To this end, the present paper outlines experimental and data reduction procedures for continuous fibre polymer matrix composites, based on a linear elastic fracture mechanics approach, which are capable of (a) determining and computing the fatigue crack growth (FCG) rate, da/dN, curve; (b) providing two different methods for determining the mandated worst-case FCG rate curve; and (c) calculating the fatigue threshold limit, below which no significant FCG occurs. Two data reduction procedures are proposed, which are based upon the Hartman-Schijve approach and a novel simple-scaling approach. These two different methodologies provide similar worst-case curves, and both provide an upper bound for all the experimental data. The calculated FCG threshold values as determined from both methodologies are also in very good agreement. Full article
(This article belongs to the Special Issue Research Progress on Mechanical Behavior of Polymers)
Show Figures

Figure 1

Figure 1
<p>Sketch of the double cantilever beam (DCB) continuous carbon-fibre epoxy polymer matrix composite test specimen. Showing the initial, starter-crack, delamination of length, <span class="html-italic">a<sub>o</sub></span>, in the DCB specimen, which was introduced to a pre-crack length of <span class="html-italic">a<sub>p</sub></span> before measurements were taken for the cyclic-fatigue test.</p>
Full article ">Figure 2
<p>Values of logarithmic <span class="html-italic">da</span>/<span class="html-italic">dN</span> versus logarithmic <math display="inline"><semantics> <mrow> <mo>∆</mo> <msqrt> <mi>G</mi> </msqrt> </mrow> </semantics></math> from the tests performed at Empa for the carbon-fibre epoxy polymer composite. Values are given in the legend for the pre-crack extension length, <span class="html-italic">a<sub>p</sub>-a<sub>o</sub></span>, prior to the start of measurements from the DCB fatigue test. (Also shown are the computed relationships from using Equation (2) with the values of <math display="inline"><semantics> <mrow> <mo>∆</mo> <msqrt> <msub> <mrow> <mi>G</mi> </mrow> <mrow> <mi>t</mi> <mi>h</mi> <mi>r</mi> </mrow> </msub> </msqrt> </mrow> </semantics></math> and <span class="html-italic">A</span> as determined from fitting the experimental results to give the Hartman-Schijve linear, master relationship, as shown later in <a href="#polymers-16-00435-f005" class="html-fig">Figure 5</a>).</p>
Full article ">Figure 3
<p>Values of logarithmic <span class="html-italic">da</span>/<span class="html-italic">dN</span> versus logarithmic <math display="inline"><semantics> <mrow> <mo>∆</mo> <msqrt> <mi>G</mi> </msqrt> </mrow> </semantics></math> from the tests performed at UCD for the carbon-fibre epoxy polymer composite. Values are given in the legend for the pre-crack extension length, <span class="html-italic">a<sub>p</sub>-a<sub>o</sub></span>, prior to the start of measurements from the DCB fatigue test. (Also shown are the computed relationships from using Equation (2) with the values of <math display="inline"><semantics> <mrow> <mo>∆</mo> <msqrt> <msub> <mrow> <mi>G</mi> </mrow> <mrow> <mi>t</mi> <mi>h</mi> <mi>r</mi> </mrow> </msub> </msqrt> </mrow> </semantics></math> and <span class="html-italic">A</span> as determined from fitting the experimental results to give the Hartman-Schijve linear, master relationship, as shown later in <a href="#polymers-16-00435-f005" class="html-fig">Figure 5</a>).</p>
Full article ">Figure 4
<p>Values of logarithmic <span class="html-italic">da</span>/<span class="html-italic">dN</span> versus logarithmic <math display="inline"><semantics> <mrow> <mo>∆</mo> <msqrt> <mi>G</mi> </msqrt> </mrow> </semantics></math> from the tests performed at Empa compared to those performed at UCD for the carbon-fibre epoxy polymer composite. Values are given in the legend for the pre-crack extension length, <span class="html-italic">a<sub>p</sub>-a<sub>o</sub></span>, prior to the start of measurements from the DCB fatigue test.</p>
Full article ">Figure 5
<p>The linear, master relationship obtained for all the Empa and UCD tests for the carbon-fibre epoxy polymer composite as calculated using the Hartman-Schijve (H-S) methodology, i.e., Equation (2).</p>
Full article ">Figure 6
<p>Values of logarithmic <span class="html-italic">da</span>/<span class="html-italic">dN</span> versus logarithmic <math display="inline"><semantics> <mrow> <mo>∆</mo> <msqrt> <mi>G</mi> </msqrt> </mrow> </semantics></math> from the tests performed at Empa and UCD for the carbon-fibre epoxy polymer composite. Values are given in the legend for the pre-crack extension length, <span class="html-italic">a<sub>p</sub></span>-<span class="html-italic">a<sub>o</sub></span>, prior to the start of measurements from the DCB fatigue test. The worst-case, upper-bound curve for the FCG rate calculated from the Hartman–Schijve methodology (see Equation (2)) is shown in blue, which uses the ‘mean-3<span class="html-italic">σ</span>’ values for <math display="inline"><semantics> <mrow> <mo>∆</mo> <msqrt> <msub> <mrow> <mi>G</mi> </mrow> <mrow> <mi>t</mi> <mi>h</mi> <mi>r</mi> </mrow> </msub> </msqrt> </mrow> </semantics></math> and <span class="html-italic">A</span> (= <math display="inline"><semantics> <mrow> <msub> <mrow> <mi>G</mi> </mrow> <mrow> <mi>c</mi> <mi>o</mi> </mrow> </msub> </mrow> </semantics></math>) (see <a href="#polymers-16-00435-t001" class="html-table">Table 1</a>). The data points from the simple-scaling methodology (see Equation (5)) are also shown with a best-fit line drawn through them. (See text for explanation of ‘Curve AB’, shown as black dots).</p>
Full article ">Figure 7
<p>The logarithmic <span class="html-italic">da</span>/<span class="html-italic">dN</span> versus logarithmic <math display="inline"><semantics> <mrow> <mo>∆</mo> <msqrt> <mi>G</mi> </msqrt> <mo>/</mo> <mo>∆</mo> <msqrt> <msub> <mrow> <mi>G</mi> </mrow> <mrow> <mi>d</mi> <mi>a</mi> <mo>/</mo> <mi>d</mi> <mi>N</mi> </mrow> </msub> </msqrt> <mo> </mo> </mrow> </semantics></math>normalised curves for the Empa and UCD test data. The values of <math display="inline"><semantics> <mrow> <mo>∆</mo> <msqrt> <msub> <mrow> <mi>G</mi> </mrow> <mrow> <mi>d</mi> <mi>a</mi> <mo>/</mo> <mi>d</mi> <mi>N</mi> </mrow> </msub> </msqrt> </mrow> </semantics></math> used for each test are the values of <math display="inline"><semantics> <mrow> <mo>∆</mo> <msqrt> <mi>G</mi> </msqrt> </mrow> </semantics></math> corresponding to a FCG rate of <span class="html-italic">da</span>/<span class="html-italic">dN</span> = 10<sup>−8</sup> m/cycle as determined from <a href="#polymers-16-00435-f002" class="html-fig">Figure 2</a> and <a href="#polymers-16-00435-f003" class="html-fig">Figure 3</a> for the Empa and UCD experimental data, respectively. (Values are given in the legend for the pre-crack extension length, <span class="html-italic">a<sub>p</sub>-a<sub>o</sub></span>, prior to the start of measurements from the DCB fatigue test).</p>
Full article ">
19 pages, 4735 KiB  
Article
Preparation of PLGA Microspheres Using the Non-Toxic Glycofurol as Polymer Solvent by a Modified Phase Inversion Methodology
by Douglas Sobel, Barath Ramasubramanian, Puja Sawhney and Keerat Parmar
Polymers 2024, 16(3), 434; https://doi.org/10.3390/polym16030434 - 4 Feb 2024
Viewed by 1017
Abstract
Poly(D,L-lactide-co-glycolide is a biodegradable copolymer that can release pharmaceuticals. These pharmaceuticals can provide local therapy and also avert the clinical issues that occur when a drug must be given continuously and/or automatically. However, the drawbacks of using poly(D,L-lactide-co-glycolide include the kinetics and duration [...] Read more.
Poly(D,L-lactide-co-glycolide is a biodegradable copolymer that can release pharmaceuticals. These pharmaceuticals can provide local therapy and also avert the clinical issues that occur when a drug must be given continuously and/or automatically. However, the drawbacks of using poly(D,L-lactide-co-glycolide include the kinetics and duration of time of poly(D,L-lactide-co-glycolide drug release, the denaturing of the drug loaded drug, and the potential clinical side effects. These drawbacks are mainly caused by the volatile organic solvents needed to prepare poly(D,L-lactide-co-glycolide spheres. Using the non-toxic solvent glycofurol solvent instead of volatile organic solvents to construct poly(D,L-lactide-co-glycolide microspheres may deter the issues of using volatile organic solvents. Up to now, preparation of such glycofurol spheres has previously met with limited success. We constructed dexamethasone laden poly(D,L-lactide-co-glycolide microspheres utilizing glycofurol as the solvent within a modified phase inversion methodology. These prepared microspheres have a higher drug load and a lower rate of water diffusion. This prolongs drug release compared to dichloromethane constructed spheres. The glycofurol-generated spheres are also not toxic to target cells as is the case for dichloromethane-constructed spheres. Further, glycofurol-constructed spheres do not denature the dexamethasone molecule and have kinetics of drug release that are more clinically advantageous, including a lower drug burst and a prolonged drug release. Full article
Show Figures

Figure 1

Figure 1
<p>PLGA droplet generator apparatus.</p>
Full article ">Figure 2
<p>Calibration curve for glycofurol assay.</p>
Full article ">Figure 3
<p>(<b>A</b>) Light photomicrograph of glycofurol-constructed spheres prepared with 20% PLGA and 20% DEX; (<b>B</b>) size distribution of spheres determined by software image measurements (ImageJ).</p>
Full article ">Figure 4
<p>% Water diffusion into PLGA spheres constructed with either GPI method and DCM as a solvent with a PLGA concentration of 20% and drug concentration of 20%. ** <span class="html-italic">p</span> &lt; 0.005 vs. DCM spheres.</p>
Full article ">Figure 5
<p>HPLC chromatogram of (<b>A</b>) PLGA without DEX, (<b>B</b>) only DEX at a concentration of 2 µg mL<sup>−1</sup>, (<b>C</b>) DEX-loaded PLGA spheres at 1 week, (<b>D</b>) DEX-loaded PLGA spheres at 5 weeks.</p>
Full article ">Figure 6
<p>Alamar Blue assay to determine cytotoxicity of PLGA spheres made from DCM and GPI method on splenocytes (<b>A</b>) and fibroblast (<b>B</b>). * indicates <span class="html-italic">p</span> &lt; 0.05, ** indicates <span class="html-italic">p</span> &lt; 0.01 compared to control (cells with no PLGA spheres).</p>
Full article ">Figure 7
<p>Accumulated drug release (%) over time from PLGA microspheres constructed with either 20% or 5% PLGA and 20% DEX by GPI method. * <span class="html-italic">p</span> &lt; 0.05; ** <span class="html-italic">p</span> &lt; 0.0001 vs. 5% PLGA.</p>
Full article ">Figure 8
<p>Accumulated drug release (%) over time from PLGA microspheres made from a 20% PLGA solution constructed with a drug load of 20% and 1% DEX with GPI method. * <span class="html-italic">p</span> &lt; 0.02 compared to 1% DEX microspheres.</p>
Full article ">Figure 9
<p>Accumulated DEX release (% ±SD) from 20% DEX and 20% PLGA spheres made from GPI method and DCM method. * indicates <span class="html-italic">p</span> &lt; 0.05 vs. DCM, ** indicates <span class="html-italic">p</span> &lt; 0.001 vs. DCM.</p>
Full article ">Figure 10
<p>Accumulated drug release (mean (±SD)%) over time from PLGA microspheres constructed with 20% PLGA and 20% Sudan 111 prepared using either DCM emulsion/evaporation method, glycofurol extraction method (GEM), or GPI methodology. The mean diameter (SD) of spheres prepared by DCM, GEM, and GPI methods were 369.14 (25.32) μm, 313.24 (41.25) μm, and 357.45 (34.85) μm, respectively. ** <span class="html-italic">p</span> &lt; 0.0001 compared to DCM extraction method and GEM.</p>
Full article ">
12 pages, 3665 KiB  
Article
Water-Based Generators with Cellulose Acetate: Uncovering the Mechanisms of Power Generation
by Seung-Hwan Lee, Hyun-Woo Lee, So Hyun Baek, Jeungjai Yun, Yongbum Kwon, Yoseb Song, Bum Sung Kim, Yong-Ho Choa and Da-Woon Jeong
Polymers 2024, 16(3), 433; https://doi.org/10.3390/polym16030433 - 4 Feb 2024
Cited by 3 | Viewed by 1542
Abstract
Power generation technologies based on water movement and evaporation use water, which covers more than 70% of the Earth’s surface and can also generate power from moisture in the air. Studies are conducted to diversify materials to increase power generation performance and validate [...] Read more.
Power generation technologies based on water movement and evaporation use water, which covers more than 70% of the Earth’s surface and can also generate power from moisture in the air. Studies are conducted to diversify materials to increase power generation performance and validate energy generation mechanisms. In this study, a water-based generator was fabricated by coating cellulose acetate with carbon black. To optimize the generator, Fourier-transform infrared spectroscopy, specific surface area, zeta potential, particle size, and electrical performance analyses were conducted. The developed generator is a cylindrical generator with a diameter of 7.5 mm and length of 20 mm, which can generate a voltage of 0.15 V and current of 82 μA. Additionally, we analyzed the power generation performance using three factors (physical properties, cation effect, and evaporation environment) and proposed an energy generation mechanism. Furthermore, we developed an eco-friendly and low-cost generator using natural fibers with a simple manufacturing process. The proposed generator can contribute to the identification of energy generation mechanisms and is expected to be used as an alternative energy source in the future. Full article
(This article belongs to the Special Issue Advances in Natural Fiber Polymer Composites)
Show Figures

Figure 1

Figure 1
<p>Process sequence real images of rare cellulose acetate column (CAC) sampling: coating solution preparation, coating method, and drying process.</p>
Full article ">Figure 2
<p>Experimental setup for measuring cellulose acetate column generator (CACG) performance in a temperature- and humidity-controlled acrylic box.</p>
Full article ">Figure 3
<p>(<b>a</b>) Chemical structure of cellulose acetate and (<b>b</b>) cetyltrimethylammonium bromide. (<b>c</b>) Fourier-transform infrared spectra of CAC, carbon black (BC), and CACG. (<b>d</b>) N<sub>2</sub> adsorption isotherms of the CAC, CACG, and CB. (<b>e</b>) Zeta potential results of coating solution. (<b>f</b>) Intensity distribution results of coating solution.</p>
Full article ">Figure 4
<p>(<b>a</b>) SEM image of cellulose acetate column generator. (<b>b</b>) EDS mapping for each element (C, O, Br, and N) of the cellulose acetate column generator. (<b>c</b>) SEM images of the cellulose acetate column generator by location (left, middle 1, 2, right).</p>
Full article ">Figure 5
<p>Schematic of the energy generation mechanism of water-powered generator. (Yellow arrow, Direction of electron movement).</p>
Full article ">Figure 6
<p>CACG performances (<span class="html-italic">V</span><sub>oc</sub>, <span class="html-italic">I</span><sub>sc</sub>) and resistance based on physical properties. (<b>a</b>) Same length: 20 mm; diameter: 5 and 7.5 mm. (<b>b</b>) Same diameter: 7.5 mm; length: 10, 20, 30, 40, and 50 mm.</p>
Full article ">Figure 7
<p>CACG performance (<span class="html-italic">V</span><sub>oc</sub>, <span class="html-italic">I</span><sub>sc</sub>) based on cation effect (length: 20 mm; diameter: 7.5 mm). (<b>a</b>) Injection solutions consist of DI water and NaCl; (<b>b</b>) performance depending on the amount of NaCl in the injection solution.</p>
Full article ">Figure 8
<p>CACG performance (<span class="html-italic">V</span><sub>oc</sub>, <span class="html-italic">I</span><sub>sc</sub>) based on cation effect (length: 20 mm, diameter: 7.5 mm). (<b>a</b>) Measurement of performance changes due to relative humidity (30%, 50%, and 80%). (<b>b</b>) Series and parallel connections of the CACG.</p>
Full article ">
19 pages, 3552 KiB  
Article
Thermally Conductive and Electrically Insulating Polymer-Based Composites Heat Sinks Fabricated by Fusion Deposition Modeling
by Simone Bagatella, Annacarla Cereti, Francesco Manarini, Marco Cavallaro, Raffaella Suriano and Marinella Levi
Polymers 2024, 16(3), 432; https://doi.org/10.3390/polym16030432 - 4 Feb 2024
Cited by 1 | Viewed by 1283
Abstract
This study explores the potential of novel boron nitride (BN) microplatelet composites with combined thermal conduction and electrical insulation properties. These composites are manufactured through Fusion Deposition Modeling (FDM), and their application for thermal management in electronic devices is demonstrated. The primary focus [...] Read more.
This study explores the potential of novel boron nitride (BN) microplatelet composites with combined thermal conduction and electrical insulation properties. These composites are manufactured through Fusion Deposition Modeling (FDM), and their application for thermal management in electronic devices is demonstrated. The primary focus of this work is, therefore, the investigation of the thermoplastic composite properties to show the 3D printing of lightweight polymeric heat sinks with remarkable thermal performance. By comparing various microfillers, including BN and MgO particles, their effects on material properties and alignment within the polymer matrix during filament fabrication and FDM processing are analyzed. The characterization includes the evaluation of morphology, thermal conductivity, and mechanical and electrical properties. Particularly, a composite with 32 wt% of BN microplatelets shows an in-plane thermal conductivity of 1.97 W m−1 K−1, offering electrical insulation and excellent printability. To assess practical applications, lightweight pin fin heat sinks using these composites are designed and 3D printed. Their thermal performance is evaluated via thermography under different heating conditions. The findings are very promising for an efficient and cost-effective fabrication of thermal devices, which can be obtained through extrusion-based Additive Manufacturing (AM), such as FDM, and exploited as enhanced thermal management solutions in electronic devices. Full article
Show Figures

Graphical abstract

Graphical abstract
Full article ">Figure 1
<p>Diffractograms of 3D-printed PA–32BN (<b>a</b>) and PA–32BN–MgO (<b>b</b>) highlighting the peaks associated with the crystalline planes of BN and MgO.</p>
Full article ">Figure 2
<p>Cross-section images by Scanning Electron Microscopy of 3D-printed PA–32BN at magnification 150× (<b>a</b>) and 2500× (<b>c</b>); PA–32BN–MgO at magnification 75× (<b>b</b>) and 1500× (<b>d</b>). Modified images with colors to highlight fillers in PA–32BN (<b>e</b>) and PA–32BN–MgO (<b>f</b>).</p>
Full article ">Figure 3
<p>Thermal properties of PA–32BN and PA–32BN–MgO analyzed through TGA (<b>a</b>,<b>b</b>) and DSC (<b>c</b>,<b>d</b>).</p>
Full article ">Figure 4
<p>Schematic illustration of the dog-bone-shaped specimens for tensile tests, fabricated by FDM with three different raster orientations to the applied force: oblique (±45°), vertical, and horizontal (from left to right).</p>
Full article ">Figure 5
<p>Technical drawing of the pin fin heat sink (<b>a</b>), 3D CAD model (<b>b</b>), and the 3D-printed FDM-manufactured version (<b>c</b>,<b>d</b>).</p>
Full article ">Figure 6
<p>(<b>a</b>) Thermograms of PA–32BN pin fin heat sink heated by a conductive system after 5 s, 105 s, and 605 s. (<b>b</b>) Temperature profiles as a function of the pin height of pin fin heat sinks heated by a conductive system, comparing plain polymer, PA–32BN, and PA–32BN–MgO at various times. (<b>c</b>) Temperature profiles as a function of time at 16mm height on pin fin heat sinks heated by a conductive system, comparing plain polymer, PA–32BN, and PA–32BN–MgO.</p>
Full article ">Figure 7
<p>Thermograms from both top (<b>a</b>) and frontal (<b>b</b>) viewpoints of PA–32BN pin fin heat sink heated by an irradiation system, showing highlighted temperature profile curves. (<b>c</b>) Temperature profiles along the diameter of the heat sinks made of plain polymer, PA–32BN, and PA–32BN–MgO at 600 s, extrapolated from the top viewpoint. (<b>d</b>) Temperature profiles along the pin height of pin fin heat sinks heated by an irradiation system, comparing plain polymer, PA–32BN, and PA–32BN–MgO at various times, extrapolated from the frontal viewpoint.</p>
Full article ">
18 pages, 7018 KiB  
Article
Comprehensive Analysis of Rheological, Mechanical, and Thermal Properties in Poly(lactic acid)/Oxidized Graphite Composites: Exploring the Effect of Heat Treatment on Elastic Modulus
by Mónica Elvira Mendoza-Duarte and Alejandro Vega-Rios
Polymers 2024, 16(3), 431; https://doi.org/10.3390/polym16030431 - 4 Feb 2024
Cited by 2 | Viewed by 1087
Abstract
This study is focused on investigating the rheological and mechanical properties of highly oxidized graphite (GrO) incorporated into a poly (lactic acid) (PLA) matrix composite. Furthermore, the samples were annealed at 110 °C for 30 min to study whether GrO concentration has an [...] Read more.
This study is focused on investigating the rheological and mechanical properties of highly oxidized graphite (GrO) incorporated into a poly (lactic acid) (PLA) matrix composite. Furthermore, the samples were annealed at 110 °C for 30 min to study whether GrO concentration has an effect on the elastic modulus (E’) after treatment. The incorporation of GrO into PLA was carried out by employing an internal mixing chamber at 190 °C. Six formulations were prepared with GrO concentrations of 0, 0.1, 0.5, 1, 1.5, and 3 wt%. The thermal stability, thermomechanical behavior, and crystallinity of the composites were evaluated utilizing thermogravimetric analysis (TGA), dynamic mechanical analysis (DMA), and differential scanning calorimetry DSC, respectively. The thermal stability (according to Tmax) of the PLA/GrO composites did not change substantially compared with PLA. According to DSC, the crystallinity increased until the GrO concentration reached 1 wt% and afterward decreased. Regarding the heat treatment of the PLA/GrO composites, the E’ increased (by two orders of magnitude) at 80 °C with the maximum value achieved at 1 wt% GrO compared with the non-heat-treated composites. Full article
(This article belongs to the Special Issue Study of the Mechanical and Rheological Behavior of Polymer Materials)
Show Figures

Figure 1

Figure 1
<p>Complex viscosity of neat PLA and PLA/GrO composites (PLA/0.1 GrO, PLA/0.5 GrO, PLA/1GrO, PLA/1.5 GrO, PLA/3GrO).</p>
Full article ">Figure 2
<p>G′ as a function of γ of neat PLA and PLA/GrO composites (PLA/0.1 GrO, PLA/0.5 GrO, PLA/1GrO, PLA/1.5 GrO, PLA/3GrO). The arrow indicates the direction in which the concentration of GrO increases.</p>
Full article ">Figure 3
<p>Normalized (G′/G′<sub>0</sub>) vs. γ for neat PLA and PLA/GO composites.</p>
Full article ">Figure 4
<p>(<b>a</b>) G′ and (<b>b</b>) G″ of neat PLA and PLA/GO composites.</p>
Full article ">Figure 5
<p>C<sub>1</sub>(s) XPS spectra of (<b>a</b>) GrO and (<b>b</b>) GrOmb (GrO treated under melt-blended conditions).</p>
Full article ">Figure 6
<p>(<b>a</b>) E′ of neat PLA and PLA/GO composites as a function of temperature without heat treatment; (<b>b</b>) E′ of neat PLA and PLA/GO composites as a function of temperature with heat treatment; (<b>c</b>) comparison of E′ at 40 °C; (<b>d</b>) comparison of E′ at 80 °C.</p>
Full article ">Figure 7
<p>(<b>a</b>) Time sweep curve of neat PLA and PLA/GO composites at 110 °C; (<b>b</b>) evaluation of thermomechanical properties of neat PLA and PLA/GrO composites from 25 °C to 140 °C. (<b>c</b>) Heat treatment of neat PLA and PLA/GrO composites using DMA at 110 °C for 30 min. (<b>d</b>) DMA heating chamber.</p>
Full article ">Figure 8
<p>Transmission electron microscopy micrographs: (<b>a</b>) PLA/0.1GrO; (<b>b</b>) PLA/1GrO; (<b>c</b>) PLA/3GrO; (<b>d</b>) PLA/3GrO.</p>
Full article ">
14 pages, 4495 KiB  
Article
Polybenzoxazine-Based Nitrogen-Containing Porous Carbon and Their Composites with NiCo Bimetallic Oxides for Supercapacitor Applications
by Thirukumaran Periyasamy, Shakila Parveen Asrafali, Seong-Cheol Kim, Deivasigamani Ranjith Kumar and Jaewoong Lee
Polymers 2024, 16(3), 430; https://doi.org/10.3390/polym16030430 - 3 Feb 2024
Cited by 1 | Viewed by 1019
Abstract
Supercapacitors (SCs) are considered as emerging energy storage devices that bridge the gap between electrolytic capacitors and rechargeable batteries. However, due to their low energy density, their real-time usage is restricted. Hence, to enhance the energy density of SCs, we prepared hetero-atom-doped carbon [...] Read more.
Supercapacitors (SCs) are considered as emerging energy storage devices that bridge the gap between electrolytic capacitors and rechargeable batteries. However, due to their low energy density, their real-time usage is restricted. Hence, to enhance the energy density of SCs, we prepared hetero-atom-doped carbon along with bimetallic oxides at different calcination temperatures, viz., HC/NiCo@600, HC/NiCo@700, HC/NiCo@800 and HC/NiCo@900. The material produced at 800 °C (HC/NiCo@800) exhibits a hierarchical 3D flower-like morphology. The electrochemical measurement of the prepared materials was performed in a three-electrode system showing an enhanced specific capacitance for HC/NiCo@600 (Cs = 1515 F g−1) in 1 M KOH, at a current density of 1 A g−1, among others. An asymmetric SC device was also fabricated using HC/NiCo@800 as anode and HC as cathode (HC/NiCo@600//HC). The fabricated device had the ability to operate at a high voltage window (~1.6 V), exhibiting a specific capacitance of 142 F g−1 at a current density of 1 A g−1; power density of 743.11 W kg−1 and energy density of 49.93 Wh kg−1. Altogether, a simple strategy of hetero-atom doping and bimetallic inclusion into the carbon framework enhances the energy density of SCs. Full article
(This article belongs to the Special Issue Electrochemistry of Conducting Polymers)
Show Figures

Figure 1

Figure 1
<p>SEM images of (<b>a</b>) HC; (<b>b</b>–<b>e</b>) HC/NiCo at different calcination temperatures (600–900 °C); and (<b>f</b>) EDX spectrum of HC/NiCo@800.</p>
Full article ">Figure 2
<p>(<b>a</b>,<b>b</b>) HR-TEM images of HC/NiCo@800 along with (<b>c</b>) SAED pattern and (<b>d</b>–<b>i</b>) elemental mapping.</p>
Full article ">Figure 3
<p>CV graphs of (<b>a</b>) HC/NiCo@600; (<b>b</b>) HC/NiCo@700; (<b>c</b>) HC/NiCo@800 and (<b>d</b>) HC/NiCo@900.</p>
Full article ">Figure 4
<p>(<b>a</b>) CV graphs of HC/NiCo; (<b>b</b>) GCD graphs of HC/NiCo; (<b>c</b>) specific capacity of HC/NiCo; and (<b>d</b>) EIS spectra of HC/NiCo.</p>
Full article ">Figure 5
<p>(<b>a</b>) GCD; (<b>b</b>) specific capacitance; (<b>c</b>) cyclic stability; and (<b>d</b>) EIS spectra of HC/NiCo@800.</p>
Full article ">Figure 6
<p>(<b>a</b>) CV; (<b>b</b>) GCD; (<b>c</b>) specific capacity; (<b>d</b>) cyclic stability; (<b>e</b>) EIS spectra; and (<b>f</b>) Ragone plot of HC/NiCo@800//HC.</p>
Full article ">Scheme 1
<p>Schematic diagram of the preparation of HC/NiCo at different temperatures.</p>
Full article ">
19 pages, 5987 KiB  
Article
Exploring Functional Polymers in the Synthesis of Luminescent ZnO Quantum Dots for the Detection of Cr6+, Fe2+, and Cu2+
by Leire San José, Nastasiya Yuriychuk, Olga García, Mar López-González and Isabel Quijada-Garrido
Polymers 2024, 16(3), 429; https://doi.org/10.3390/polym16030429 - 3 Feb 2024
Viewed by 1282
Abstract
The main aim of this work is to demonstrate that well-defined methacrylate-based copolymers with oligoethylene glycol side chains and functional groups such as thiol and glycidyl, obtained by photo-initiated reversible addition-fragmentation chain transfer (RAFT) in ethanol, are highly suitable as templates in the [...] Read more.
The main aim of this work is to demonstrate that well-defined methacrylate-based copolymers with oligoethylene glycol side chains and functional groups such as thiol and glycidyl, obtained by photo-initiated reversible addition-fragmentation chain transfer (RAFT) in ethanol, are highly suitable as templates in the synthesis and protection of ZnO quantum dots (ZnO QDs) with remarkable photoluminescent properties. While the affinity of thiol groups to metallic surfaces is well established, their interaction with metal oxides has received less scrutiny. Furthermore, under basic conditions, glycidyl groups could react with hydroxyl groups on the surface of ZnO, representing another strategy for hybrid synthesis. The size and crystalline morphology of the resulting hybrids were assessed using DLS, TEM, and XRD, indicating that both polymers, even with a low proportion of functional groups (5% mol) are appropriate as templates and ligands for ZnO QDs synthesis. Notably, thiol-containing polymers yield hybrids with ZnO featuring excellent quantum yield (up to 52%), while polymers with glycidyl groups require combination with the organosilane aminopropyl triethoxysilane (APTES) to achieve optimal results. In both cases, these hybrids exhibited robust stability in both ethanol and aqueous environments. Beyond fundamental research, due to the remarkable photoluminescent properties and affordability, these hybrid ZnO QDs are expected to have potential applications in biotechnology and green science; in particular, in this study, we examined their use in the detection of environmental contaminants like Fe2+, Cr6+, and Cu2+. Specifically, the limit of detection achieved at 1.13 µM for the highly toxic Cr6+ underscores the significant sensing capabilities of the hybrids. Full article
(This article belongs to the Special Issue Advances in Hybrid Polymers)
Show Figures

Figure 1

Figure 1
<p>(<b>a</b>) <sup>1</sup>H-NMR (<b>b</b>) FTIR and (<b>c</b>) SEC traces, corresponding to representative copolymers of oligoethylene glycol methacrylate (PEGMEMA = EG, MEO<sub>3</sub>MA = TEG, or MEO<sub>2</sub>MA = DEG) and AcSEMA (AcS). (<b>d</b>) <sup>1</sup>H-NMR, (<b>e</b>) FTIR, and (<b>f</b>) SEC traces, corresponding to representative copolymers of oligoethylene glycol methacrylate (PEGMEMA = EG, MEO<sub>3</sub>MA = TEG, or MEO<sub>2</sub>MA = DEG) and GlyMA (GM).</p>
Full article ">Figure 2
<p>(<b>a</b>) Absorption and emission spectra (after excitation at 365 nm) corresponding to a sample synthesized in the presence of thiolated polymer (EG<sub>95</sub>-AcS<sub>5</sub>-2); (<b>b</b>) hydrodynamic diameter determined by Number (%) corresponding to ZnO QDs functionalized with copolymers bearing thiol or glycidyl groups; (<b>c</b>) TEM image corresponding to the ZnO@EG<sub>95</sub>-AcS<sub>5</sub>-2 hybrid, the distance between the lattice planes are indicated in the Figure; (<b>d</b>) XRD of some representative ZnO@polymer hybrids.</p>
Full article ">Figure 3
<p>Representative TEM images of ZnO QDs with AcSEMA copolymer coating: (<b>a</b>) ZnO@EG<sub>90</sub>-AcS<sub>10</sub>-2; (<b>b</b>) ZnO@EG<sub>95</sub>-AcS<sub>5</sub>-2; (<b>c</b>) ZnO@EG<sub>97.5</sub>-AcS<sub>2.5</sub>-2; (<b>d</b>) ZnO@TEG<sub>95</sub>-AcS<sub>5</sub>-2; (<b>e</b>) ZnO@EG<sub>10</sub>-DEG<sub>85</sub>-AcS<sub>5</sub>-2; (<b>f</b>) ZnO@DEG<sub>95</sub>-AcS<sub>5</sub>-2. Insert show particle size histograms corresponding to the samples indicated in the Figure.</p>
Full article ">Figure 4
<p>Comparative ATR-FTIR spectra analysis between (<b>a</b>) ZnO@-EG<sub>90</sub>-AcS<sub>10</sub>-2 QDs and the pristine EG<sub>90</sub>-AcS<sub>10</sub> copolymer, and (<b>b</b>) ATR-FTIR spectra corresponding to ZnO@EG<sub>90</sub>-GM<sub>10</sub>-2 and ZnO@AP-EG<sub>90</sub>-GM<sub>10</sub>-2 QDs compared to the pristine EG<sub>90</sub>-GM<sub>10</sub> copolymer.</p>
Full article ">Figure 5
<p>Fluorescence Quantum Yield (Φ<sub>F</sub>) of ZnO QDs in ethanol (<b>a</b>) comparing the use of copolymers of PEGMEMA (EG) with glycidyl groups with and without APTES; (<b>b</b>) comparing EG, DEG, and TEG in copolymers with glycidyl groups.</p>
Full article ">Figure 6
<p>Fluorescence Quantum Yield (Φ<sub>F</sub>) of ZnO QDs in ethanol as a function of (<b>a</b>) AcSEMA mol (%) in the p(PEGMEMA-co-AcSEMA) copolymers; (<b>b</b>) thiol (µmol) content in the precursor solution; (<b>c</b>) Number molecular weight distribution (M<sub>n</sub>) for p(PEGMEMA-co-AcSEMA) (EG-AcS) and p(MEO<sub>2</sub>MA-co-AcSEMA) (DEG-AcS) copolymers with 5 mol % of AcSEMA; and (<b>d</b>) type of ethylene glycol based comonomer: PEGMEMA (EG), MEO<sub>3</sub>MA (TEG), and MEO<sub>2</sub>MA (DEG).</p>
Full article ">Figure 7
<p>Evolution of the integrated fluorescence emission as a function of storage time for ZnO hybrids diluted 1:10 in ethanol and water synthesized in presence of (<b>a</b>) 2 µmol or (<b>b</b>) 4 µmol of GlyMA in the EG<sub>95</sub>-GM<sub>5</sub> copolymer. Impact of APTES in combination with (<b>c</b>) 2 µmol and (<b>d</b>) 4 µmol of GlyMA in the EG<sub>95</sub>-GM<sub>5</sub> copolymer.</p>
Full article ">Figure 8
<p>Evolution of the integrated fluorescence emission as a function of time for ZnO hybrids diluted 1:10 in ethanol and water synthesized in presence of (<b>a</b>) 1 µmol, (<b>b</b>) 2 µmol, (<b>c</b>) 4 µmol, and (<b>d</b>) 8 µmol of AcSEMA in the EG<sub>95</sub>-AcS<sub>5</sub> thiolated copolymer.</p>
Full article ">Figure 9
<p>(<b>a</b>) Fluorescence intensity of ZnO@EG<sub>95</sub>-AcS<sub>5</sub>-2 QDs in the presence of aqueous solutions of several cations (Li<sup>+</sup>, Mg<sup>2+</sup>, K<sup>+</sup>, Ca<sup>2+</sup>, Cr<sup>6+</sup>, Mn<sup>2+</sup>, Fe<sup>2+</sup>, Fe<sup>3+</sup>, Co<sup>2+</sup>, Ni<sup>2+</sup>, Cu<sup>2+</sup>, Cd<sup>2+</sup>, Hg<sup>2+</sup>, and Pb<sup>2+</sup>) in a concentration of 100 μM, and (<b>b</b>) the ratio between initial integrated emission (F<sub>0</sub>) of the ZnO@EG<sub>95</sub>-AcS<sub>5</sub>-2 QDs and integrated emission (F) in the presence of 100 μM of the indicated metals.</p>
Full article ">Figure 10
<p>Decrease in fluorescence emission of ZnO@EG<sub>95</sub>-AcS<sub>5</sub>-2 as a function of metal concentration (5–100 μM) and in the insert the corresponding Stern–Volmer plot: (<b>a</b>) Cr<sup>6+</sup>; (<b>b</b>) Fe<sup>2+</sup>, and (<b>c</b>) Cu<sup>2+</sup>.</p>
Full article ">Figure 11
<p>(<b>a</b>) Ratio between initial integrated emission (F<sub>0</sub>) of the ZnO@EG<sub>95</sub>-AcS<sub>5</sub>-2 QDs and integrated emission (F) in the presence of 17.5 μM of the indicated metals. (<b>b</b>) Stern–Volmer plot corresponding to the fluorescence emission quenching of ZnO@EG<sub>95</sub>-AcS<sub>5</sub>-2 in the concentration range of 1 to 17.5 μM.</p>
Full article ">Scheme 1
<p>Synthesis of functional statistical copolymers by Photo-RAFT using CDTPA RAFT agent and TPOL photoinitiator in ethanol medium under 365 nm UV light. (<b>a</b>) Copolymers with thioacetate groups are used alone as templates for the synthesis of ZnO QDs, whereas (<b>b</b>) copolymers with epoxy groups are combined with APTES. Under the basic medium of the reaction, the thioacetate releases a thiol group with avidity for the ZnO QD surface and the epoxy group reacts with the amine of the silane on the ZnO QD surface.</p>
Full article ">
13 pages, 4925 KiB  
Article
Reinforcement of Cement Nanocomposites through Optimization of Mixing Ratio between Carbon Nanotube and Polymer Dispersing Agent
by Seok Hwan An, Ki Yun Kim and Jea Uk Lee
Polymers 2024, 16(3), 428; https://doi.org/10.3390/polym16030428 - 3 Feb 2024
Cited by 1 | Viewed by 997
Abstract
Carbon nanotubes (CNTs), known for their exceptional mechanical, thermal, and electrical properties, are being explored as cement nanofillers in the construction field. However, due to the limited water dispersion of CNTs, polymer dispersing agents like polycarboxylate ether (PCE) and sulfonated naphthalene formaldehyde (SNF) [...] Read more.
Carbon nanotubes (CNTs), known for their exceptional mechanical, thermal, and electrical properties, are being explored as cement nanofillers in the construction field. However, due to the limited water dispersion of CNTs, polymer dispersing agents like polycarboxylate ether (PCE) and sulfonated naphthalene formaldehyde (SNF) are essential for uniform dispersion. In a previous study, PCE and SNF, common cement superplasticizers, effectively dispersed CNTs in cement nanocomposites. However, uncertainties remained regarding the extent to which all dispersing agents interacted efficiently with CNTs. Therefore, this research quantitatively assessed CNT interaction with dispersing agents through dispersion and centrifugation. Approximately 37% of PCE and 50% of SNF persisted compared to CNT after centrifugation. The resulting cement nanocomposites, with optimized mixing ratios, exhibited enhanced compressive strength of about 14% for CNT/PCE (78.13 MPa) and 12.3% for CNT/SNF (76.97 MPa) compared to plain cement (68.52 MPa). XRD results linked strength reinforcement to increased cement hydrate from optimized CNT dispersion. FE-SEM analysis revealed that CNTs were positioned within the pores of the cement. These optimized cement nanocomposites hold promise for improved safety in the construction industry. Full article
(This article belongs to the Special Issue Functional Hybrid Polymeric Composites)
Show Figures

Figure 1

Figure 1
<p>Schematic representation of the entire experimental procedure.</p>
Full article ">Figure 2
<p>TGA graphs of (<b>a</b>) CNT/PCE and (<b>b</b>) CNT/SNF after the first (C1) and second centrifuge (C2) processes.</p>
Full article ">Figure 3
<p>OM images of (<b>a</b>) CNT/PCE and (<b>b</b>) CNT/SNF dispersion.</p>
Full article ">Figure 4
<p>Particle size distribution graphs of (<b>a</b>) CNT/PCE and (<b>b</b>) CNT/SNF.</p>
Full article ">Figure 5
<p>FE-TEM images of CNTs in (<b>a</b>) CNT/PCE and (<b>b</b>) CNT/SNF dispersions.</p>
Full article ">Figure 6
<p>Contact angle between CNT dispersion and plain cement substrate with (<b>a</b>) PCE and (<b>b</b>) SNF dispersing agents.</p>
Full article ">Figure 7
<p>Compressive strength results of cement nanocomposites according to mixing ratio of CNT to dispersing agent (<b>a</b>) PCE and (<b>b</b>) SNF.</p>
Full article ">Figure 8
<p>XRD analysis of cement nanocomposites with (<b>a</b>) CNT/PCE and (<b>b</b>) CNT/SNF and enhancement of C-S-H and portlandite peaks of cement nanocomposites with (<b>c</b>) CNT/PCE and (<b>d</b>) CNT/SNF C1 and C2 dispersion in comparison to those of the CNT:PCE 1:2 and CNT:SNF 1:2.</p>
Full article ">Figure 9
<p>FE-SEM images of cement nanocomposites of (<b>a</b>) CNT/PCE and (<b>b</b>) CNT/SNF.</p>
Full article ">
18 pages, 14694 KiB  
Article
Nanostructured Poly-l-lactide and Polyglycerol Adipate Carriers for the Encapsulation of Usnic Acid: A Promising Approach for Hepatoprotection
by Benedetta Brugnoli, Greta Perna, Sara Alfano, Antonella Piozzi, Luciano Galantini, Eleni Axioti, Vincenzo Taresco, Alessia Mariano, Anna Scotto d’Abusco, Stefano Vecchio Ciprioti and Iolanda Francolini
Polymers 2024, 16(3), 427; https://doi.org/10.3390/polym16030427 - 3 Feb 2024
Cited by 1 | Viewed by 1295
Abstract
The present study investigates the utilization of nanoparticles based on poly-l-lactide (PLLA) and polyglycerol adipate (PGA), alone and blended, for the encapsulation of usnic acid (UA), a potent natural compound with various therapeutic properties including antimicrobial and anticancer activities. The development of these [...] Read more.
The present study investigates the utilization of nanoparticles based on poly-l-lactide (PLLA) and polyglycerol adipate (PGA), alone and blended, for the encapsulation of usnic acid (UA), a potent natural compound with various therapeutic properties including antimicrobial and anticancer activities. The development of these carriers offers an innovative approach to overcome the challenges associated with usnic acid’s limited aqueous solubility, bioavailability, and hepatotoxicity. The nanosystems were characterized according to their physicochemical properties (among others, size, zeta potential, thermal properties), apparent aqueous solubility, and in vitro cytotoxicity. Interestingly, the nanocarrier obtained with the PLLA-PGA 50/50 weight ratio blend showed both the lowest size and the highest UA apparent solubility as well as the ability to decrease UA cytotoxicity towards human hepatocytes (HepG2 cells). This research opens new avenues for the effective utilization of these highly degradable and biocompatible PLLA-PGA blends as nanocarriers for reducing the cytotoxicity of usnic acid. Full article
(This article belongs to the Special Issue Polymeric Materials for Drug Delivery II)
Show Figures

Graphical abstract

Graphical abstract
Full article ">Figure 1
<p>Scheme of PGA polymerization and <sup>1</sup>H-NMR of PGA.</p>
Full article ">Figure 2
<p>FTIR-ATR (<b>A</b>) and DSC curves (<b>B</b>) of PLLA, PGA, and PLLA-PGA blend.</p>
Full article ">Figure 3
<p>DLS curves of PLLA, PGA, and PLLA-PGA blend (<b>A</b>); stability of the nanoparticles determined by monitoring particle size at 1 week (<b>B</b>).</p>
Full article ">Figure 4
<p>Evolution in size of PLLA, PGA, and PLLA-PGA nanoparticles over time after the addition of lipase (10 mg/mL).</p>
Full article ">Figure 5
<p>DLS curves of UA-loaded nanoparticles at a 20x UA concentration (<b>A</b>); stability of the UA-loaded nanoparticles at 1 week (<b>B</b>); UA apparent solubility as determined via UV–vis spectroscopy (<b>C</b>); and DSC curves of free UA and UA-loaded nanoparticles at a 20x UA concentration (<b>D</b>). In the inset of panel D, a magnification of the thermogram from 50 to 210 °C is reported to show the peaks of crystallization of PLLA and UA.</p>
Full article ">Figure 6
<p>Usnic acid release over time from PLLA-20X, PGA-20X, and PLLA-PGA20X nanoparticles.</p>
Full article ">Figure 7
<p>Cell viability is assessed using the MTS assay. The viability of the HepG2 cells treated with 90, 60, 30, 15, 7.5, and 3.75 µg/mL of UA is evaluated after 24, 48, and 72 h of treatment. The cell viability of the samples is normalized to that of the untreated cells, which is reported to be 100% and represented by a horizontal black line. The results are expressed as the mean ± standard deviation of the data obtained by means of three different experiments. Statistical significance is * <span class="html-italic">p</span> &lt; 0.05 vs. untreated cells.</p>
Full article ">Figure 8
<p>Cell viability is assessed via the MTS assay. The viability of the HepG2 cells treated with PLLA-UA20X, PGA-UA20X, and PLLA-PGA-UA10X, 20X, and 40X containing 30, 15, and 7.5 µg/mL of UA is evaluated after 24, 48, and 72 h of treatment. The cell viability of the samples is normalized to that of the untreated cells, which is reported to be 100% and represented by a horizontal black line. The results are expressed as the mean ± standard deviation of the data obtained by means of three different experiments.</p>
Full article ">Figure 9
<p>HepG2 cytoskeleton morphology analyses after treatment with UA and UA embedded in polymeric nanoparticles. The cells are treated with UA (30 μg/mL) and PLLA-UA20X, PGA-UA20X, and PLLA-PGA-UA20x containing 30 μg/mL UA for 24 h (<b>A</b>) and 72 h (<b>B</b>) and then analyzed via an immunofluorescence assay using Phalloidin Alexa Fluor 488 to highlight the actin filaments. The nuclei are stained with DAPI (original magnification 20x, scale bar = 50 μm).</p>
Full article ">Figure 10
<p>HepG2 cytoskeleton morphology analyses after treatment with UA and UA embedded in polymeric nanoparticles. The cells are treated with UA (30 μg/mL) and PLLA-UA20X, PGA-UA20X, and PLLA-PGA-UA20x containing 30 μg/mL UA for 24 h (<b>A</b>) and 72 h (<b>B</b>) and then analyzed via an immunofluorescence assay using Phalloidin Alexa Fluor 488 to highlight the actin filaments. The nuclei are stained with DAPI (original magnification 63x, scale bar = 50 μm).</p>
Full article ">
21 pages, 4881 KiB  
Article
A Theoretical Investigation of the Polyaddition of an AB2+A2+B4 Monomer Mixture
by Sergei V. Karpov, Artem Iakunkov, Dmitry A. Chernyaev, Vladimir G. Kurbatov, Georgiy V. Malkov and Elmira R. Badamshina
Polymers 2024, 16(3), 426; https://doi.org/10.3390/polym16030426 - 3 Feb 2024
Viewed by 808
Abstract
Hyperbranched polymers (HBPs) are widely applied nowadays as functional materials for biomedicine needs, nonlinear optics, organic semiconductors, etc. One of the effective and promising ways to synthesize HBPs is a polyaddition of AB2+A2+B4 monomers that is generated in [...] Read more.
Hyperbranched polymers (HBPs) are widely applied nowadays as functional materials for biomedicine needs, nonlinear optics, organic semiconductors, etc. One of the effective and promising ways to synthesize HBPs is a polyaddition of AB2+A2+B4 monomers that is generated in the A2+CB2, AA′+B3, A2+B′B2, and A2+C2+B3 systems or using other approaches. It is clear that all the foundational features of HBPs that are manufactured by a polyaddition reaction are defined by the component composition of the monomer mixture. For this reason, we have designed a structural kinetic model of AB2+A2+B4 monomer mixture polyaddition which makes it possible to predict the impact of the monomer mixture’s composition on the molecular weight characteristics of hyperbranched polymers (number average (DPn) and weight average (DPw) degree of polymerization), as well as the degree of branching (DB) and gel point (pg). The suggested model also considers the possibility of a positive or negative substitution effect during polyaddition. The change in the macromolecule parameters of HBPs formed by polyaddition of AB2+A2+B4 monomers is described as an infinite system of kinetic equations. The solution for the equation system was found using the method of generating functions. The impact of both the component’s composition and the substitution effect during the polyaddition of AB2+A2+B4 monomers on structural and molecular weight HBP characteristics was investigated. The suggested model is fairly versatile; it makes it possible to describe every possible case of polyaddition with various monomer combinations, such as A2+AB2, AB2+B4, AB2, or A2+B4. The influence of each monomer type on the main characteristics of hyperbranched polymers that are obtained by the polyaddition of AB2+A2+B4 monomers has been investigated. Based on the results obtained, an empirical formula was proposed to estimate the pg = pA during the polyaddition of an AB2+A2+B4 monomer mixture: pg = pA = (−0.53([B]0/[A]0)1/2 + 0.78)υAB2 + (1/3)1/2([B]0/[A]0)1/2, where (1/3)1/2([B]0/[A]0)1/2 is the Flory equation for the A2+B4 polyaddition, [A]0 and [B]0 are the A and B group concentration from A2 and B4, respectively, and υAB2 is the mole fraction of the AB2 monomer in the mixture. The equation obtained allows us to accurately predict the pg value, with an AB2 monomer content of up to 80%. Full article
(This article belongs to the Special Issue Computational and Experimental Approaches in Polymeric Materials)
Show Figures

Figure 1

Figure 1
<p>Structural units in the AB2+A2+B4 system, where ba/ab is the product of interaction between A and B groups.</p>
Full article ">Figure 2
<p>Plot of p<sub>g</sub> as a function of [A]<sub>0</sub>/[B]<sub>0</sub> for A<sub>2</sub>+B<sub>4</sub> system. Solid line depicts the data obtained through Equation (1), and dots represent the data calculated by the offered approach ([AB<sub>2</sub>]<sub>0</sub> = 0).</p>
Full article ">Figure 3
<p>Plot of DB as a function of p<sub>B</sub> (<b>a</b>); plot of PDI as a function of p<sub>A</sub> (<b>b</b>) in the AB<sub>2</sub> monomer-based system ([AB<sub>2</sub>]<sub>0</sub> = 1, [A<sub>2</sub>]<sub>0</sub> = [B<sub>4</sub>]<sub>0</sub> = 0).</p>
Full article ">Figure 4
<p>Plot of DP<sub>w</sub> as a function of p<sub>B</sub>, where the dashed line represents the [AB<sub>2</sub>]<sub>0</sub>/[A<sub>2</sub>]<sub>0</sub>/[B<sub>4</sub>]<sub>0</sub> = 2/1/1 ([A<sub>2</sub>]<sub>0</sub>/[CB<sub>2</sub>]<sub>0</sub> = 1) case, and [AB<sub>2</sub>]<sub>0</sub>/[A<sub>2</sub>]<sub>0</sub>/[B<sub>4</sub>]<sub>0</sub> = 4/4/1 ([A<sub>2</sub>]<sub>0</sub>/[CB<sub>2</sub>]<sub>0</sub> = 3/2) is for the solid line.</p>
Full article ">Figure 5
<p>Plot of DP<sub>w</sub> vs. p<sub>A</sub> when (1) [AB<sub>2</sub>]<sub>0</sub>/[A<sub>2</sub>]<sub>0</sub>/[B<sub>4</sub>]<sub>0</sub> = 1/0.025/0.097, or (2) [AB<sub>2</sub>]<sub>0</sub>/[A<sub>2</sub>]<sub>0</sub>/[B<sub>4</sub>]<sub>0</sub> = 1/0.036/0.083. Dashed lines correspond to the p<sub>A</sub> values of 0.94 and 0.99.</p>
Full article ">Figure 6
<p>Plot of p<sub>g</sub> as a function of υA<sub>2</sub>, where (1) [AB<sub>2</sub>]<sub>0</sub>/[B<sub>4</sub>]<sub>0</sub> = 0 (a curve derived from Flory equation); (2) [AB<sub>2</sub>]<sub>0</sub>/[B<sub>4</sub>]<sub>0</sub> = 0.5; (3) [AB<sub>2</sub>]<sub>0</sub>/[B<sub>4</sub>]<sub>0</sub> = 2; and (4) [AB<sub>2</sub>]<sub>0</sub>/[B<sub>4</sub>]<sub>0</sub> = 4.</p>
Full article ">Figure 7
<p>Plot of specific number of branches per macromolecule (D/N) at p<sub>g</sub> vs. υA<sub>2</sub> when (1) [AB<sub>2</sub>]<sub>0</sub>/[B<sub>4</sub>]<sub>0</sub> = 0 (Flory curve); (2) [AB<sub>2</sub>]<sub>0</sub>/[B<sub>4</sub>]<sub>0</sub> = 0.5; (3) [AB<sub>2</sub>]<sub>0</sub>/[B<sub>4</sub>]<sub>0</sub> = 2; and (4) [AB<sub>2</sub>]<sub>0</sub>/[B<sub>4</sub>]<sub>0</sub> = 4. Dashed lines correspond to the points where p<sub>g</sub> ≤ 1.</p>
Full article ">Figure 8
<p>Plot of DP<sub>n</sub> at p<sub>g</sub> as a function of υA<sub>2</sub>: (1) [AB<sub>2</sub>]<sub>0</sub>/[B<sub>4</sub>]<sub>0</sub> = 0 (Flory curve); (2) [AB<sub>2</sub>]<sub>0</sub>/[B<sub>4</sub>]<sub>0</sub> = 0.5; (3) [AB<sub>2</sub>]<sub>0</sub>/[B<sub>4</sub>]<sub>0</sub> = 2; and (4) [AB<sub>2</sub>]<sub>0</sub>/[B<sub>4</sub>]<sub>0</sub> = 4. Dashed lines correspond to the points where p<sub>g</sub> ≤ 1.</p>
Full article ">Figure 9
<p>Plot of DB at p<sub>g</sub> as a function of υA<sub>2</sub>: (1) [AB<sub>2</sub>]<sub>0</sub>/[B<sub>4</sub>]<sub>0</sub> = 0; (2) [AB<sub>2</sub>]<sub>0</sub>/[B<sub>4</sub>]<sub>0</sub> = 0.5; (3) [AB<sub>2</sub>]<sub>0</sub>/[B<sub>4</sub>]<sub>0</sub> = 2; and (4) [AB<sub>2</sub>]<sub>0</sub>/[B<sub>4</sub>]<sub>0</sub> = 4. Dashed lines correspond to the points where p<sub>g</sub> ≤ 1.</p>
Full article ">Figure 10
<p>Graph of p<sub>g</sub> as a function of υB<sub>4</sub>, when (1) [AB<sub>2</sub>]<sub>0</sub>/[A<sub>2</sub>]<sub>0</sub> = 0 (Flory curve); (2) [AB<sub>2</sub>]<sub>0</sub>/[A<sub>2</sub>]<sub>0</sub> = 1/4; (3) [AB<sub>2</sub>]<sub>0</sub>/[A<sub>2</sub>]<sub>0</sub> = 2/3; and (4) [AB<sub>2</sub>]<sub>0</sub>/[A<sub>2</sub>]<sub>0</sub> = 2.</p>
Full article ">Figure 11
<p>Plot of DP<sub>n</sub>—1 and DB—2 vs. υB<sub>4</sub>, with [AB<sub>2</sub>]<sub>0</sub>/[A<sub>2</sub>]<sub>0</sub> = 2/3, and conversion is equal to p<sub>g</sub>. Dashed line corresponds to the point where p<sub>g</sub> ≤ 1.</p>
Full article ">Figure 12
<p>Plot of p<sub>g</sub> vs. υAB<sub>2</sub> at (1)—[A<sub>2</sub>]<sub>0</sub>/[B<sub>4</sub>]<sub>0</sub> = 3; (2) [A<sub>2</sub>]<sub>0</sub>/[B<sub>4</sub>]<sub>0</sub> = 5; and (3) [A<sub>2</sub>]<sub>0</sub>/[B<sub>4</sub>]<sub>0</sub> = 10.</p>
Full article ">Figure 13
<p>Plot of DP<sub>n</sub>—1 and DB—2 vs. υAB<sub>2</sub> with [A<sub>2</sub>]<sub>0</sub>/[B<sub>4</sub>]<sub>0</sub> = 3; conversion is equal p<sub>g</sub>. Dashed line corresponds to the point where p<sub>g</sub> ≤ 1.</p>
Full article ">Figure 14
<p>Plot of p<sub>g</sub> = p<sub>A</sub> as a function of υAB<sub>2</sub> at [A<sub>2</sub>]<sub>0</sub>/[B<sub>4</sub>]<sub>0</sub> ratio equal to (1) 1; (2) 3/2; (3) 2; (4) 3; (5) 5; and (6) 10.</p>
Full article ">Figure 15
<p>Plot of p<sub>g</sub> vs. υA<sub>2</sub> and <span class="html-italic">k</span><sub>2</sub>/<span class="html-italic">k</span><sub>1</sub> if [AB<sub>2</sub>]<sub>0</sub>/[B<sub>4</sub>]<sub>0</sub> = 2.</p>
Full article ">Scheme 1
<p>Synthesis of HBP by polyaddition of the monomer types A<sub>2</sub>+B<sub>3</sub> [<a href="#B23-polymers-16-00426" class="html-bibr">23</a>,<a href="#B24-polymers-16-00426" class="html-bibr">24</a>,<a href="#B25-polymers-16-00426" class="html-bibr">25</a>], A<sub>2</sub>+B<sub>4</sub> [<a href="#B26-polymers-16-00426" class="html-bibr">26</a>,<a href="#B27-polymers-16-00426" class="html-bibr">27</a>,<a href="#B28-polymers-16-00426" class="html-bibr">28</a>], A<sub>2</sub>+CB<sub>2</sub> [<a href="#B29-polymers-16-00426" class="html-bibr">29</a>,<a href="#B30-polymers-16-00426" class="html-bibr">30</a>,<a href="#B31-polymers-16-00426" class="html-bibr">31</a>], and A<sub>2</sub>+B′B<sub>2</sub> [<a href="#B32-polymers-16-00426" class="html-bibr">32</a>,<a href="#B33-polymers-16-00426" class="html-bibr">33</a>,<a href="#B34-polymers-16-00426" class="html-bibr">34</a>].</p>
Full article ">Scheme 2
<p>Synthesis of HBP by polyaddition of the monomers of AB<sub>2</sub>+A<sub>2</sub>+B<sub>4</sub> type [<a href="#B36-polymers-16-00426" class="html-bibr">36</a>,<a href="#B37-polymers-16-00426" class="html-bibr">37</a>], where ba is the product of interaction between A and B groups, cd is the product of interaction between C and D groups.</p>
Full article ">Scheme 3
<p>Positive and negative substitution effects during the polyaddition of the AB<sub>2</sub>+A<sub>2</sub>+B<sub>4</sub> monomer mixture, where ba is the product of interaction between A and B groups.</p>
Full article ">
0 pages, 11234 KiB  
Article
Analysis of the Rotation Bending Test Method and Characterization of Unidirectional Carbon Fiber-Reinforced Polycarbonate Tapes at Processing Temperatures
by Daniel Laresser, Matei-Constantin Miron, Milan Kracalik, Felix Baudach and Zoltán Major
Polymers 2024, 16(3), 425; https://doi.org/10.3390/polym16030425 - 2 Feb 2024
Cited by 1 | Viewed by 919
Abstract
Bending is one of the dominant material deformation mechanisms that occurs during the forming process of unidirectional (UD) thermoplastic tapes. Experimental characterization of the bending behavior at processing temperatures is crucial to obtaining close-to-reality data sets for process analysis or material modeling for [...] Read more.
Bending is one of the dominant material deformation mechanisms that occurs during the forming process of unidirectional (UD) thermoplastic tapes. Experimental characterization of the bending behavior at processing temperatures is crucial to obtaining close-to-reality data sets for process analysis or material modeling for process simulation. The main purpose of this study is to characterize to a high degree of accuracy the temperature-dependent bending behavior of single and multi-ply specimens of carbon fiber-reinforced polycarbonate (PC/CF) UD tapes at processing temperatures, which implies a molten state of the thermoplastic matrix. The application of the rotation bending test using a customized fixture may come with systematic deviations in the measured moment that result from a pivot offset or an effective clearance that is unknown under realistic test conditions. The present research analyzes these effects with analytical methods, experimental investigations, and simulations using a finite element model. In this context, a compensation method for the toe-in effect is evaluated. With this approach, we were able to obtain reliable data and characterize the bending resistance within the desired processing window. The data reveal a major drop in bending resistance between 200 °C and 250 °C and a less significant decrease between 250 °C and 300 °C. Analysis of the thickness-normalized bending resistances indicates a non-linear relationship between specimen thickness and measured moment but an increasing shear-dominated characteristic at higher temperatures. Full article
(This article belongs to the Section Polymer Analysis and Characterization)
Show Figures

Figure 1

Figure 1
<p>Principle of the rotation bending test: (<b>a</b>) initial and (<b>b</b>) deflected configuration.</p>
Full article ">Figure 2
<p>Non-linear dependence of (<b>a</b>) the curvature <span class="html-italic">ϰ</span> and (<b>b</b>) the lateral movement Δ<span class="html-italic">s</span> with increasing rotation angle, considering a constant arm length <span class="html-italic">L</span> = 12 mm.</p>
Full article ">Figure 3
<p>(<b>a</b>) Contact conditions between specimen and fixture and (<b>b</b>) simplified mechanical assumption.</p>
Full article ">Figure 4
<p>(<b>a</b>) Contact areas between specimen and fixture and (<b>b</b>) origin of friction effect.</p>
Full article ">Figure 5
<p>Illustration of the specimen ends positioned in the fixture: (<b>a</b>) theoretical initial situation and (<b>b</b>) effect of the effective gap <math display="inline"> <semantics> <mrow> <mover accent="true"> <mrow> <mi>c</mi> </mrow> <mo>¯</mo> </mover> </mrow> </semantics> </math> in the start phase of a test.</p>
Full article ">Figure 6
<p>(<b>a</b>) Clamping situation leading to the pivot offset <span class="html-italic">k</span> and (<b>b</b>) consequence on the circular path of the rotating fixture side (circular path for <span class="html-italic">k</span> = 0 in blue, and for <span class="html-italic">k</span> &gt; 0 in red).</p>
Full article ">Figure 7
<p>Rotation bending test: (<b>a</b>) rendering of the fixture concept; (<b>b</b>) disassembled state of the manufactured fixture showing the individual parts; (<b>c</b>) experimental set-up; and (<b>d</b>) detailed view of the installed fixture.</p>
Full article ">Figure 8
<p>Sequence of operations for performing the rotation bending test.</p>
Full article ">Figure 9
<p>Illustration of the finite element model of the rotation bending set-up: (<b>a</b>) model set-up in ABAQUS/CAE and (<b>b</b>) representative solution.</p>
Full article ">Figure 10
<p>Comparison of the results between experiment, idealized analytical approach, and FE model.</p>
Full article ">Figure 11
<p>(<b>a</b>) Experimental and (<b>b</b>) simulation results on the brass specimen with respect to the influence of the effective clearance <math display="inline"> <semantics> <mrow> <mover accent="true"> <mrow> <mi>c</mi> </mrow> <mo>¯</mo> </mover> </mrow> </semantics> </math>.</p>
Full article ">Figure 12
<p>(<b>a</b>) Experimental and (<b>b</b>) simulation results with respect to the influence of <math display="inline"> <semantics> <mrow> <mover accent="true"> <mrow> <mi>c</mi> </mrow> <mo>¯</mo> </mover> </mrow> </semantics> </math> on PC/CF specimen at 250 °C.</p>
Full article ">Figure 13
<p>Toe region compensation applied to PC/CF experimental data at 250 °C and different <math display="inline"> <semantics> <mrow> <mover accent="true"> <mrow> <mi>c</mi> </mrow> <mo>¯</mo> </mover> </mrow> </semantics> </math>: (<b>a</b>) raw experimental data set highlighting the shift of an individual measurement curve and (<b>b</b>) compensated data set.</p>
Full article ">Figure 14
<p>Toe region compensation applied to PC/CF simulation data with different <math display="inline"> <semantics> <mrow> <mover accent="true"> <mrow> <mi>c</mi> </mrow> <mo>¯</mo> </mover> </mrow> </semantics> </math>: (<b>a</b>) simulation data set and (<b>b</b>) compensated data set.</p>
Full article ">Figure 15
<p>Influence of the pivot offset <span class="html-italic">k</span> in the curvature <span class="html-italic">ϰ</span>: (<b>a</b>) simplified analytical solution and (<b>b</b>) simulation result.</p>
Full article ">Figure 16
<p>Rotation bending results for PC/CF thermoplastic UD tape single-ply specimen [0]<sub>1</sub>: (<b>a</b>) tested temperature range, and (<b>b</b>) domain of processing temperature range.</p>
Full article ">Figure 17
<p>Rotation bending results for PC/CF thermoplastic UD tape multi-ply specimen [0]<sub>6</sub>: (<b>a</b>) tested temperature range and (<b>b</b>) enlarged domain of 200 °C and 250 °C.</p>
Full article ">Figure 18
<p>PC/CF multi-ply specimens from different camera angles, before (<b>left</b>) and after (<b>right</b>) testing.</p>
Full article ">Figure 19
<p>Temperature-dependent deformation resistance of a single tape.</p>
Full article ">Figure 20
<p>Comparison of the deflection resistances of PC/CF at different temperatures between 15° and 40° deflection angle: (<b>a</b>) single-ply specimens and (<b>b</b>) multi-ply specimens.</p>
Full article ">Figure 21
<p>Deflection resistances normalized to the specimen thickness.</p>
Full article ">
15 pages, 4566 KiB  
Article
Expansion Injection Molding Process Using Clamping Force for Melt Compression
by Joon Hyoung Park and Sun Kyoung Kim
Polymers 2024, 16(3), 424; https://doi.org/10.3390/polym16030424 - 2 Feb 2024
Viewed by 1220
Abstract
Melt expansion followed by compression has been utilized for high-speed filling. In general, this technology was developed for a machine level. Recently, mold-level technology has been tried. In this study, an expansion injection molding process was examined, which included compressing a polymer melt [...] Read more.
Melt expansion followed by compression has been utilized for high-speed filling. In general, this technology was developed for a machine level. Recently, mold-level technology has been tried. In this study, an expansion injection molding process was examined, which included compressing a polymer melt through cylinder action facilitated by the movement of the platen, followed by the expansion of the polymer melt into a mold cavity. A mold system including temperature control and valve actions, similar to hot runner systems, was designed and built. The test results show good filling when the injection pressure was high. Simulations were also carried out, highlighting consistent pressure and filling trends, while revealing limitations tied to the characteristics of the state model. This research indicates promise for expansion injection molding through platen compression but emphasizes the need for the seamless integration of valve action with the injection molding machine for large-scale production. Full article
(This article belongs to the Special Issue Recent Advances in Injection Molding of Polymers)
Show Figures

Figure 1

Figure 1
<p>Structure of the mold.</p>
Full article ">Figure 2
<p>Sequence of the movement of valve pins, platen, and cylinders: (<b>a</b>) Aligning the upper pin to open the cylinder inlet; (<b>b</b>) Aligning the upper pin to close the cylinder; (<b>c</b>) Initiating piston upward movement for compression; (<b>d</b>) Aligning the lower pin to open the cylinder outlet.</p>
Full article ">Figure 3
<p>Fabricated mold parts: (<b>a</b>) ring; (<b>b</b>) piston; (<b>c</b>) cavity plate; (<b>d</b>) valve gate pin.</p>
Full article ">Figure 3 Cont.
<p>Fabricated mold parts: (<b>a</b>) ring; (<b>b</b>) piston; (<b>c</b>) cavity plate; (<b>d</b>) valve gate pin.</p>
Full article ">Figure 4
<p>The exploded view of the manufactured mold.</p>
Full article ">Figure 5
<p>The geometry and mesh for the simulation in MoldFlow.</p>
Full article ">Figure 6
<p>Molded articles alongside compression conditions: (<b>a</b>) EIM1; (<b>b</b>) EIM2; (<b>c</b>) EIM4; (<b>d</b>) EIM5; (<b>e</b>) IM.</p>
Full article ">Figure 7
<p>Measured radius distribution along with the initial melt pressure for all EIM cases (from EIM1 to EIM5).</p>
Full article ">Figure 8
<p>Feasible and isothermal expansion paths for EIM1 and EIM5.</p>
Full article ">Figure 9
<p>Radial thickness distribution of the molded article for EIM4, EIM5, and IM.</p>
Full article ">Figure 10
<p>The simulated fill fraction along with time.</p>
Full article ">Figure 11
<p>Simulated flow front for EIM5.</p>
Full article ">Figure 12
<p>Measured and simulated pressure in the cylinder over time for EIM5.</p>
Full article ">Figure 13
<p>Simulated flow rate at the gate for EIM5.</p>
Full article ">Figure A1
<p>Design of the piston with heating coil. A heating wire is wound to control the temperature. All dimensions are in mm.</p>
Full article ">Figure A2
<p>Assembled mold system with hydraulic valve drivers. The injection nozzle is connected to plate 1. The cylinder cavity is formed by plate 2 and the piston. A load cell is connected to the cylinder cavity using a rod parallel to the plates as shown in the figure. The cylinder and nozzle valves, which are pneumatically operated, are placed in plates 2 and 4, respectively. Because the piston assembly is retained in plate 3, the distance between plates 2 and 3 controls the volume. The part cavity is formed by plate 4 and plate 5. The ejection plates 7 and 8 are secured between plates 5 and 6, assisted by spacer block 6.</p>
Full article ">Figure A3
<p>Hot runner controller employed in this work for control of the cylinder temperature (CW662, Yudo, Hwaseong, Republic of Korea).</p>
Full article ">
28 pages, 3612 KiB  
Review
Nanocellulose Composite Films in Food Packaging Materials: A Review
by Yanting Xu, Zhenzeng Wu, Ao Li, Nairong Chen, Jiuping Rao and Qinzhi Zeng
Polymers 2024, 16(3), 423; https://doi.org/10.3390/polym16030423 - 2 Feb 2024
Cited by 7 | Viewed by 4518
Abstract
Owing to the environmental pollution caused by petroleum-based packaging materials, there is an imminent need to develop novel food packaging materials. Nanocellulose, which is a one-dimensional structure, has excellent physical and chemical properties, such as renewability, degradability, sound mechanical properties, and good biocompatibility, [...] Read more.
Owing to the environmental pollution caused by petroleum-based packaging materials, there is an imminent need to develop novel food packaging materials. Nanocellulose, which is a one-dimensional structure, has excellent physical and chemical properties, such as renewability, degradability, sound mechanical properties, and good biocompatibility, indicating promising applications in modern industry, particularly in food packaging. This article introduces nanocellulose, followed by its extraction methods and the preparation of relevant composite films. Meanwhile, the performances of nanocellulose composite films in improving the mechanical, barrier (oxygen, water vapor, ultraviolet) and thermal properties of food packaging materials and the development of biodegradable or edible packaging materials in the food industry are elaborated. In addition, the excellent performances of nanocellulose composites for the packaging and preservation of various food categories are outlined. This study provides a theoretical framework for the development and utilization of nanocellulose composite films in the food packaging industry. Full article
(This article belongs to the Section Polymer Membranes and Films)
Show Figures

Figure 1

Figure 1
<p>Schematic illustration of nanocellulose preparation from plants(adapted from [<a href="#B12-polymers-16-00423" class="html-bibr">12</a>].with permission of ELSEVIER).</p>
Full article ">Figure 2
<p>Some carbon sources used as culture medium materials to prepare bacterial cellulose.</p>
Full article ">Figure 3
<p>Usage of nanocellulose composite films in food packaging.</p>
Full article ">Figure 4
<p>Preparation methods of nanocellulose composite films: (<b>a</b>) solvent casting method, (<b>b</b>) layer-by-layer assembly, (<b>c</b>) electrospinning, (<b>d</b>) melt process, (<b>e</b>) coating (adapted from [<a href="#B48-polymers-16-00423" class="html-bibr">48</a>] with permission of Talyor &amp; Francis).</p>
Full article ">Figure 5
<p>Schematic diagram of oxygen permeation process in films.</p>
Full article ">Figure 6
<p>(<b>a</b>) Gas diffusion path of CNF; (<b>b</b>) gas diffusion path of CNCs through composite films (adapted from [<a href="#B73-polymers-16-00423" class="html-bibr">73</a>] with permission of ELSEVIER).</p>
Full article ">Figure 7
<p>(<b>a</b>) Preparation of TOCN UV-blocking films; (<b>b</b>) performance changes in thermally treated TOCN films; (<b>c</b>) contact angles of water droplets (adapted from [<a href="#B85-polymers-16-00423" class="html-bibr">85</a>] with the permission of ELSEVIER).</p>
Full article ">Figure 8
<p>Schematic illustration of polymer biodegradation process (adapted from [<a href="#B107-polymers-16-00423" class="html-bibr">107</a>] with the permission of ELSEVIER).</p>
Full article ">
16 pages, 5436 KiB  
Article
Nanocomposites Based on Thermoplastic Acrylic Resin with the Addition of Chemically Modified Multi-Walled Carbon Nanotubes
by Szymon Demski, Dariusz Brząkalski, Maciej Gubernat, Kamil Dydek, Paweł Czaja, Konrad Żochowski, Paulina Kozera, Zuzanna Krawczyk, Bogna Sztorch, Robert Edward Przekop, Michał Marczak, Hermann Ehrlich and Anna Boczkowska
Polymers 2024, 16(3), 422; https://doi.org/10.3390/polym16030422 - 2 Feb 2024
Cited by 1 | Viewed by 1341
Abstract
The main goal of this work was an improvement in the mechanical and electrical properties of acrylic resin-based nanocomposites filled with chemically modified carbon nanotubes. For this purpose, the surface functionalization of multi-walled carbon nanotubes (MWCNTs) was carried out by means of aryl [...] Read more.
The main goal of this work was an improvement in the mechanical and electrical properties of acrylic resin-based nanocomposites filled with chemically modified carbon nanotubes. For this purpose, the surface functionalization of multi-walled carbon nanotubes (MWCNTs) was carried out by means of aryl groups grafting via the diazotization reaction with selected aniline derivatives, and then nanocomposites based on ELIUM® resin were fabricated. FT-IR analysis confirmed the effectiveness of the carried-out chemical surface modification of MWCNTs as new bands on FT-IR spectra appeared in the measurements. TEM observations showed that carbon nanotube fragmentation did not occur during the modifications. According to the results from Raman spectroscopy, the least defective carbon nanotube structure was obtained for aniline modification. Transmission light microscopy analysis showed that the neat MWCNTs agglomerate strongly, while the proposed modifications improved their dispersion significantly. Viscosity tests confirmed, that as the nanofiller concentration increases, the viscosity of the mixture increases. The mixture with the highest dispersion of nanoparticles exhibited the most viscous behaviour. Finally, an enhancement in impact resistance and electrical conductivity was obtained for nanocomposites containing modified MWCNTs. Full article
Show Figures

Figure 1

Figure 1
<p>Reaction scheme for grafting MWCNTs with the selected aniline derivatives as performed in this work.</p>
Full article ">Figure 2
<p>FT-IR spectrum of the MWCNTs treated by aryl grafting with aniline derivatives compared to the neat MWCNTs.</p>
Full article ">Figure 3
<p>Reaction pathway of anthranilic acid deazotization–decarboxylation leading to benzyne formation and the grafting thereof on the surface of MWCNTs.</p>
Full article ">Figure 4
<p>TEM images of (<b>a</b>) MWCNT neat, (<b>b</b>) MWCNT-AN, (<b>c</b>) MWCNT-NAN, and (<b>d</b>) MWCNT-ABA.</p>
Full article ">Figure 5
<p>High-resolution TEM images of (<b>a</b>) MWCNT neat, (<b>b</b>) MWCNT-AN, (<b>c</b>) MWCNT-NAN, and (<b>d</b>) MWCNT-ABA.</p>
Full article ">Figure 6
<p>Raman spectra of MWCNT neat, MWCNT-AN, MWCNT-NAN, and MWCNT-ABA.</p>
Full article ">Figure 7
<p>Microscope observations of he prepared mixtures, (<b>a</b>) ELIUM + 0.02 wt%MWCNT neat, (<b>b</b>) ELIUM + 0.10 wt%MWCNT neat, (<b>c</b>) ELIUM + 0.15 wt%MWCNT neat, (<b>d</b>) ELIUM + 0.02 wt%MWCNT-AN, (<b>e</b>) ELIUM + 0.10 wt%MWCNT-AN, (<b>f</b>) ELIUM + 0.15 wt%MWCNT-AN, (<b>g</b>) ELIUM + 0.02 wt%MWCNT-NAN, (<b>h</b>) ELIUM + 0.10 wt%MWCNT-NAN, (<b>i</b>) ELIUM + 0.15 wt%MWCN(T-NAN, (<b>j</b>) ELIUM + 0.02 wt%MWCNT-ABA, (<b>k</b>) ELIUM + 0.10 wt%MWCNT-ABA, and (<b>l</b>) ELIUM + 0.15 wt%MWCNT-ABA.</p>
Full article ">Figure 8
<p>Viscosity results.</p>
Full article ">Figure 9
<p>Impact resistance of the fabricated nanocomposites.</p>
Full article ">Figure 10
<p>Electrical conductivity of the fabricated nanocomposites.</p>
Full article ">
16 pages, 10920 KiB  
Article
Investigation of Hybrid Electrodes of Polyaniline and Reduced Graphene Oxide with Bio-Waste-Derived Activated Carbon for Supercapacitor Applications
by Imen Benchikh, Abdelrahman Osama Ezzat, Lilia Sabantina, Youcef Benmimoun and Abdelghani Benyoucef
Polymers 2024, 16(3), 421; https://doi.org/10.3390/polym16030421 - 2 Feb 2024
Cited by 5 | Viewed by 1301
Abstract
Graphene-based materials have been widely studied in the field of supercapacitors. However, their electrochemical properties and applications are still restricted by the susceptibility of graphene-based materials to curling and agglomeration during production. This study introduces a facile method for synthesizing reduced graphene oxide [...] Read more.
Graphene-based materials have been widely studied in the field of supercapacitors. However, their electrochemical properties and applications are still restricted by the susceptibility of graphene-based materials to curling and agglomeration during production. This study introduces a facile method for synthesizing reduced graphene oxide (rGO) nanosheets and activated carbon based on olive stones (OS) with polyaniline (PAni) surface decoration for the development of supercapacitors. Several advanced techniques were used to examine the structural properties of the samples. The obtained PAni@OS−rGO (1:1) electrode exhibits a high electrochemical capacity of 582.6 F·g−1 at a current density of 0.1 A·g−1, and an energy density of 26.82 Wh·kg−1; thus, it demonstrates potential for efficacious energy storage. In addition, this electrode material exhibits remarkable cycling stability, retaining over 90.07% capacitance loss after 3000 cycles, indicating a promising long cycle life. Overall, this research highlights the potential of biomass-derived OS in the presence of PAni and rGO to advance the development of high-performance supercapacitors. Full article
(This article belongs to the Special Issue Polymer Based Electronic Devices and Sensors III)
Show Figures

Figure 1

Figure 1
<p>FTIR spectra of samples.</p>
Full article ">Figure 2
<p>XRD patterns of samples.</p>
Full article ">Figure 3
<p>Survey scans for (<b>a</b>) OS−rGO; (<b>b</b>) PAni@OS−rGO (1:1); and (<b>c</b>) PAni@OS−rGO (2:1).</p>
Full article ">Figure 4
<p>High-resolution C1s spectra for (<b>a</b>) OS−rGO; (<b>b</b>) PAni@OS−rGO (1:1); and (<b>c</b>) PAni@OS−rGO (2:1).</p>
Full article ">Figure 5
<p>High-resolution N1s spectra for (<b>a</b>) PAni@OS−rGO (1:1) and (<b>b</b>) PAni@OS−rGO (2:1).</p>
Full article ">Figure 6
<p>(<b>a</b>) TGA curves and (<b>b</b>) nitrogen adsorption isotherms of materials.</p>
Full article ">Figure 7
<p>(<b>a</b>) UV–visible spectra and (<b>b</b>) Tauc plots for samples.</p>
Full article ">Figure 8
<p>(<b>a</b>) CVs at 10 mV·s<sup>−1</sup> of electrodes; (<b>b</b>) GCD of electrode materials created at 0.1 A·g<sup>−1</sup>; (<b>c</b>) CV curves of PAni@OS−rGO (1:1); and (<b>d</b>) CV curves of PAni@OS−rGO (2:1) at various scan rates.</p>
Full article ">Figure 9
<p>(<b>a</b>) GCD of PAni@OS−rGO (1:1); (<b>b</b>) GCD of PAni@OS−rGO (2:1) at scan rate of 10 mV·s<sup>−1</sup> and different current densities; (<b>c</b>) Ragone plots for electrodes at various current densities; and (<b>d</b>) rate performance test for 3000 consecutive cycles at 0.5 A·g<sup>−1</sup>.</p>
Full article ">Figure 9 Cont.
<p>(<b>a</b>) GCD of PAni@OS−rGO (1:1); (<b>b</b>) GCD of PAni@OS−rGO (2:1) at scan rate of 10 mV·s<sup>−1</sup> and different current densities; (<b>c</b>) Ragone plots for electrodes at various current densities; and (<b>d</b>) rate performance test for 3000 consecutive cycles at 0.5 A·g<sup>−1</sup>.</p>
Full article ">Figure 10
<p>(<b>a</b>) Variations in specific capacitances of electrodes at various current densities; and (<b>b</b>) Nyquist plots for electrode materials (inset: model of Randles equivalent circuit).</p>
Full article ">Scheme 1
<p>The proposed preparation pathway of OS.</p>
Full article ">Scheme 2
<p>The proposed preparation pathway of OS−rGO material.</p>
Full article ">
21 pages, 9868 KiB  
Article
Strain Rate and Temperature Influence on Micromechanisms of Plastic Deformation of Polyethylenes Investigated by Positron Annihilation Lifetime Spectroscopy
by Cezary Makarewicz, Marta Safandowska, Rafal Idczak, Slawomir Kolodziej and Artur Rozanski
Polymers 2024, 16(3), 420; https://doi.org/10.3390/polym16030420 - 2 Feb 2024
Viewed by 1006
Abstract
Plastic deformation of low/high density polyethylene (LDPE/HDPE) was analyzed in this work using positron annihilation lifetime spectroscopy (PALS). It was shown that in undeformed LDPE, both the mean ortho-positronium lifetime (τ3) and its dispersion (σ3), corresponding to the average [...] Read more.
Plastic deformation of low/high density polyethylene (LDPE/HDPE) was analyzed in this work using positron annihilation lifetime spectroscopy (PALS). It was shown that in undeformed LDPE, both the mean ortho-positronium lifetime (τ3) and its dispersion (σ3), corresponding to the average size and size distribution of the free-volume pores of the amorphous component, respectively, were clearly higher than in HDPE. This effect was induced by a lower and less uniform molecular packing of the amorphous regions in LDPE. During the deformation of LDPE, an increase in the τ3 value was observed within the local strains of 0–0.25. This effect was mainly stimulated by a positive relative increase in interlamellar distances due to the deformation of lamellar crystals oriented perpendicular (increased by 31.8%) and parallel (decreased by 10.1%) to the deformation directions. At the same time, the dimension of free-volume pores became more uniform, which was manifested by a decrease in the σ3 value. No significant effect of temperature or strain rate on the τ3 and σ3 values was observed during LDPE deformation. In turn, in the case of HDPE, with an increase in the strain rate/or a decrease in temperature, an intensification of the cavitation phenomenon could be observed with a simultaneous decrease in the τ3 value. This effect was caused by the lack of annihilation of ortho-positonium (o-Ps) along the longer axis of the highly anisotropic/ellipsoidal cavities. Therefore, this dimension was not detectable by the PALS technique. At the same time, the increase in the dimension of the shorter axis of the cavities was effectively limited by the thickness of amorphous layers. As the strain rate increased or the temperature decreased, the σ3 value during HDPE deformation increased. This change was correlated with the initiation and intensification of the cavitation phenomenon. Based on the mechanical response of samples with a similar yield stress, it was also proven that the susceptibility of the amorphous regions of LDPE to the formation of cavities is lower than in the case of amorphous component of HDPE. Full article
(This article belongs to the Section Polymer Physics and Theory)
Show Figures

Graphical abstract

Graphical abstract
Full article ">Figure 1
<p>Technical (<b>a</b>) and real (<b>b</b>) visualization of the frame system; 3D visualization of frames system holding deformed samples during PALS measurement (<b>c</b>); location of frames with samples between PALS detectors (<b>d</b>) [<a href="#B49-polymers-16-00420" class="html-bibr">49</a>].</p>
Full article ">Figure 2
<p>Engineering strain–engineering stress curves for HDPE and LDPE (temperature of 20 °C, strain rate of 3.3 × 10<sup>−3</sup> s<sup>−1</sup>). Evolution of SAXS pattern for LDPE with the increase in the local strain value (LS). Direction of deformation: vertical.</p>
Full article ">Figure 3
<p>Dependence between volume strain and local strains for analyzed low-density polyethylene. The SAXS patterns for samples deformed to the local strains of 0.25 at −30 °C/3.3 × 10<sup>−2</sup>s<sup>−1</sup> and at 20 °C/3.3 × 10<sup>−3</sup>s<sup>−1</sup>. Direction of deformation: vertical.</p>
Full article ">Figure 4
<p>Mean ortho-positronium lifetime (τ<sub>3</sub>) (<b>a</b>) and dispersion of ortho-positronium lifetime (σ<sub>3</sub>) (<b>b</b>) for low-density polyethylene as a function of LS. The dashed lines represent the value for the undeformed sample. Normalized size distributions of free-volume pores of the amorphous phase of non-deformed LDPE and of samples deformed to selected local strains: as collected (<b>c</b>) and after subtraction of the distribution for the non-deformed sample (<b>d</b>). Deformation conditions were as follows: strain rate of 3.3 × 10<sup>−3</sup> s<sup>−1</sup>/temperature of 20 °C and strain rate of 3.3 × 10<sup>−2</sup> s<sup>−1</sup>/temperature of −30 °C.</p>
Full article ">Figure 5
<p>Engineering strain–engineering stress (<b>a</b>) and true strain–true stress (<b>b</b>) curves of HDPE as a function of strain rate at a constant temperature of 20 °C.</p>
Full article ">Figure 6
<p>Dependence between volume strain and LS for HDPE as a function of strain rates, and the SAXS patterns for samples deformed to the LS of 0.25. Direction of deformation: vertical.</p>
Full article ">Figure 7
<p>Mean ortho-positronium lifetime (τ<sub>3</sub>) (<b>a</b>) and dispersion of ortho-positronium lifetime (σ<sub>3</sub>) (<b>b</b>) for HDPE at a local strain of 0.25 as a function of strain rate. The dashed lines represent the value for undeformed samples. Normalized size distributions of free-volume pores in the amorphous phase of non-deformed HDPE and samples deformed with different strain rate values at a LS of 0.25: as collected (<b>c</b>) and after subtraction of the distribution for the non-deformed sample (<b>d</b>).</p>
Full article ">Figure 8
<p>Engineering strain–engineering stress (<b>a</b>) and true strain–true stress (<b>b</b>) curves of LDPE as a function of strain rate at a constant temperature of 20 °C.</p>
Full article ">Figure 9
<p>Engineering strain–engineering stress (<b>a</b>) and true strain–true stress (<b>b</b>) curves of HDPE as a function of temperature, at a constant strain rate of 3.3 × 10<sup>−3</sup> s<sup>−1</sup>.</p>
Full article ">Figure 10
<p>Dependence between volume strain and local strains for HDPE as a function of temperature. The SAXS patterns for samples deformed to a LS of 0.17 (−30 °C) and 0.25 (20 °C and 70 °C). Direction of deformation: vertical.</p>
Full article ">Figure 11
<p>Mean ortho-positronium lifetime (τ<sub>3</sub>) (<b>a</b>) and dispersion of ortho-positronium lifetime (σ<sub>3</sub>) (<b>b</b>) for HDPE at a LS of 0.17 (−30 °C) and a LS of 0.25 (20 °C and 70 °C). The dashed lines represent the value for undeformed samples. Normalized size distributions of free-volume pores of the amorphous phase of non-deformed HDPE and samples deformed at different temperature values: as collected (<b>c</b>) and after subtraction of the distribution for the non-deformed sample (<b>d</b>).</p>
Full article ">Figure 12
<p>Engineering strain–engineering stress (<b>a</b>) and true strain–true stress (<b>b</b>) curves of LDPE as a function of temperature, at a constant strain rate of 3.3 × 10<sup>−3</sup> s<sup>−1</sup>.</p>
Full article ">Figure 13
<p>Engineering strain–engineering stress and true strain–true stress curves of LDPE deformed at −30 °C with a strain rate of 3.3 × 10<sup>−2</sup> s<sup>−1</sup>.</p>
Full article ">
18 pages, 3678 KiB  
Article
Toward Producing Biopolyethylene/Babassu Fiber Biocomposites with Improved Mechanical and Thermomechanical Properties
by Eduardo da Silva Barbosa Ferreira, Fabiano Santana da Silva, Carlos Bruno Barreto Luna, Anna Raffaela de Matos Costa, Fernanda Menezes de Sousa, Laura Hecker de Carvalho, Renate Maria Ramos Wellen and Edcleide Maria Araújo
Polymers 2024, 16(3), 419; https://doi.org/10.3390/polym16030419 - 2 Feb 2024
Cited by 3 | Viewed by 1214
Abstract
The development of polymeric biocomposites containing natural fibers has grown over the years due to the properties achieved and its eco-friendly nature. Thus, biocomposites involving a polymer from a renewable source (Biopolyethylene (BioPE)) and babassu fibers (BFs), compatibilized with polyethylene grafted with maleic [...] Read more.
The development of polymeric biocomposites containing natural fibers has grown over the years due to the properties achieved and its eco-friendly nature. Thus, biocomposites involving a polymer from a renewable source (Biopolyethylene (BioPE)) and babassu fibers (BFs), compatibilized with polyethylene grafted with maleic anhydride (MA) and acrylic acid (AA) (PE-g-MA and PE-g-AA, respectively) were obtained using melt mixing and injection molded into tensile, impact, and HDT specimens. Babassu fiber was characterized with Fourier transform infrared spectroscopy (FTIR), thermogravimetry (TGA), and scanning electron microscopy (SEM). The biocomposites were characterized using torque rheometry, TGA, tensile strength, impact strength, thermomechanical properties, Shore D hardness, and SEM. The data indicate that the torque during the processing of compatibilized biocomposites was higher than that of BioPE/BF biocomposites, which was taken as an indication of a possible reaction between the functional groups. Compatibilization led to a substantial improvement in the elastic modulus, tensile strength, HDT, and VST and a decrease in Shore D hardness. These results were justified with SEM micrographs, which showed babassu fibers better adhered to the surface of the biopolyethylene matrix, as well as an encapsulation of these fibers. The system investigated is environmentally sustainable, and the results are promising for the technology of polymeric composites. Full article
(This article belongs to the Special Issue Biopolymers and Bio-Based Polymer Composites)
Show Figures

Figure 1

Figure 1
<p>Production scheme of the BioPE/BF biocomposites and the compatibilized biocomposites.</p>
Full article ">Figure 2
<p>FTIR spectra of babassu fiber.</p>
Full article ">Figure 3
<p>TGA curve of babassu fiber.</p>
Full article ">Figure 4
<p>SEM images of babassu fiber at 200× (<b>A</b>), 500× (<b>B</b>), and 1000× (<b>C</b>).</p>
Full article ">Figure 5
<p>Rheometric curves of BioPE, BioPE/BF, and the compatibilized biocomposites.</p>
Full article ">Figure 6
<p>TGA curves of BioPE, BioPE/BF, and the compatibilized biocomposites.</p>
Full article ">Figure 7
<p>Stress–strain curves (<b>A</b>), tensile strength results (<b>B</b>), and elastic modulus (<b>C</b>) of the systems studied.</p>
Full article ">Figure 8
<p>Impact strength of BioPE and the biocomposites.</p>
Full article ">Figure 9
<p>HDT of BioPE, the BioPE/BF biocomposites, and the compatibilized biocomposites.</p>
Full article ">Figure 10
<p>VST of BioPE, the BioPE/BF biocomposites, and the compatibilized biocomposites.</p>
Full article ">Figure 11
<p>Shore D hardness of BioPE, the BioPE/BF biocomposites, and the compatibilized biocomposites.</p>
Full article ">Figure 12
<p>Fracture surface obtained with SEM of BioPE/BF (<b>A</b>,<b>B</b>), BioPE/BF/PE-g-MA (10%) (<b>C</b>,<b>D</b>), BioPE/BF/PE-g-MA (20%) (<b>E</b>,<b>F</b>), BioPE/BF/PE-g-AA (10%) (<b>G</b>,<b>H</b>), and BioPE/BF/PE-g-AA (20%) (<b>I</b>,<b>J</b>) at 100× and 500× magnification.</p>
Full article ">
13 pages, 4497 KiB  
Article
Fabrication of Fish Scale-Based Gelatin Methacryloyl for 3D Bioprinting Application
by Kitipong Pasanaphong, Danai Pukasamsombut, Sani Boonyagul, Sukanya Pengpanich, Tulyapruek Tawonsawatruk, Danuphat Wilairatanarporn, Kittisak Jantanasakulwong, Pornchai Rachtanapun, Ruedee Hemstapat, Sutee Wangtueai and Nuttapol Tanadchangsaeng
Polymers 2024, 16(3), 418; https://doi.org/10.3390/polym16030418 - 1 Feb 2024
Viewed by 1669
Abstract
Gelatin methacryloyl (GelMA) is an ideal bioink that is commonly used in bioprinting. GelMA is primarily acquired from mammalian sources; however, the required amount makes the market price extremely high. Since garbage overflow is currently a global issue, we hypothesized that fish scales [...] Read more.
Gelatin methacryloyl (GelMA) is an ideal bioink that is commonly used in bioprinting. GelMA is primarily acquired from mammalian sources; however, the required amount makes the market price extremely high. Since garbage overflow is currently a global issue, we hypothesized that fish scales left over from the seafood industry could be used to synthesize GelMA. Clinically, the utilization of fish products is more advantageous than those derived from mammals as they lower the possibility of disease transmission from mammals to humans and are permissible for practitioners of all major religions. In this study, we used gelatin extracted from fish scales and conventional GelMA synthesis methods to synthesize GelMA, then tested it at different concentrations in order to evaluated and compared the mechanical properties and cell responses. The fish scale GelMA had a printing accuracy of 97%, a swelling ratio of 482%, and a compressive strength of about 85 kPa at a 10% w/v GelMA concentration. Keratinocyte cells (HaCaT cells) were bioprinted with the GelMA bioink to assess cell viability and proliferation. After 72 h of culture, the number of cells increased by almost three-fold compared to 24 h, as indicated by many fluorescent cell nuclei. Based on this finding, it is possible to use fish scale GelMA bioink as a scaffold to support and enhance cell viability and proliferation. Therefore, we conclude that fish scale-based GelMA has the potential to be used as an alternative biomaterial for a wide range of biomedical applications. Full article
(This article belongs to the Special Issue 3D Printing of Polymer-Based Composite Materials)
Show Figures

Figure 1

Figure 1
<p>(<b>a</b>) The bioprinter used in this study. (<b>b</b>) Multilayer grid scaffold pattern top view and (<b>c</b>) side view designed by Cellink HeartWare Repetier-Host program for bioprinting of Cellink Inkredible bioprinter.</p>
Full article ">Figure 2
<p><sup>1</sup>H NMR spectra of the fish scale gelatin and GelMA.</p>
Full article ">Figure 3
<p>Demonstrated scaffolds from GelMa fish scales using 3D bioprinting technique: (<b>a</b>) 10% GelMA and (<b>b</b>) 15% GelMA.</p>
Full article ">Figure 4
<p>The size of the printed lines (<b>a</b>) and the printing accuracy of 10% GelMA and 15% GelMA (<b>b</b>) (n = 3, *** is significant difference, and NS is non-significant).</p>
Full article ">Figure 5
<p>Stress–strain curve of the 10% GelMA hydrogel.</p>
Full article ">Figure 6
<p>The swelling ratio of the fish scale GelMA (n = 3, *** is significant difference, and NS is non-significant).</p>
Full article ">Figure 7
<p>The cell viability of embedded HaCaT cells in fish scale GelMA scaffold compared to the control HaCaT cells at the cultivation time of 24 and 72 h (n = 3, *** is significant difference, and NS is non-significant).</p>
Full article ">Figure 8
<p>The survival of HaCaT cells inside the GelMA bioink scaffolds after incubation times of 24 h (<b>a</b>) and 72 h (<b>b</b>).</p>
Full article ">Figure 9
<p>Laser-scanning confocal microscope images of HaCaT cells embedded in GelMA bioink scaffolds after an incubation time of 72 h. (<b>a</b>) Bright-field photograph of fluorescent DAPI-stained cells and (<b>b</b>) dark-field photograph of fluorescent DAPI-stained cells.</p>
Full article ">
19 pages, 1252 KiB  
Article
A Systematic Investigation on the Effect of Carbon Nanotubes and Carbon Black on the Mechanical and Flame Retardancy Properties of Polyolefin Blends
by Eid M. Alosime and Ahmed A. Basfar
Polymers 2024, 16(3), 417; https://doi.org/10.3390/polym16030417 - 1 Feb 2024
Cited by 2 | Viewed by 975
Abstract
Due to high filler loading, clean, commercial, thermoplastic, flame-retardant materials are mechanically unstable when insulating wires and cables. In this study, composite formulations of linear low-density polyethylene (LLDPE)/ethylene–vinyl acetate (EVA) containing a flame retardant, such as magnesium hydroxide (MH; formula: Mg(OH)2) [...] Read more.
Due to high filler loading, clean, commercial, thermoplastic, flame-retardant materials are mechanically unstable when insulating wires and cables. In this study, composite formulations of linear low-density polyethylene (LLDPE)/ethylene–vinyl acetate (EVA) containing a flame retardant, such as magnesium hydroxide (MH; formula: Mg(OH)2) and huntite hydromagnesite (HH; formula: Mg3Ca(CO3)4, Mg5(CO3)4(OH)2·3H2O), were prepared. The influence of carbon nanotubes (CNTs) and carbon black (CB) on the mechanical properties and flame retardancy of LLDPE/EVA was studied. Three types of CNTs were examined for their compatibility with other materials in clean thermoplastic flame-retardant compositions. The CNTs had the following diameters: 10–15 nm, 40–60 nm, and 60–80 nm. Optimum mechanical flame retardancy and electrical properties were achieved by adding CNTs with an outer diameter of 40–60 nm and a length of fewer than 20 nm. Large-sized CNTs result in poor mechanical characteristics, while smaller-sized CNTs improve the mechanical properties of the composites. CB enhances flame retardancy but deteriorates mechanical properties, particularly elongation at break, in clean, black, thermoplastic, flame-retardant compositions. Obtaining satisfactory compositions that meet both properties, especially formulations passing the V-0 of the UL 94 test with a minimum tensile strength of 9.5 MPa and an elongation at break of 125%, is challenging. When LLDPE was partially substituted with EVA, the limiting oxygen index (LOI) increased. The amount of filler in the formulations determined how it affected flammability. This study also included a reliable method for producing clean, black, thermoplastic, flame-retardant insulating material for wire and cable without sacrificing mechanical properties. Full article
(This article belongs to the Special Issue Flame Retardant and Mechanical Properties of Polymer Materials)
Show Figures

Figure 1

Figure 1
<p>Elongation at break (%) of EVA/120 phr MH (Magnifin A-H10A) formulations as a function of CNT or CB content.</p>
Full article ">Figure 2
<p>Tensile strength (MPa) of EVA/120 phr MH (Magnifin A-H10A) formulations as a function of CNT or CB content.</p>
Full article ">Figure 3
<p>LOI (%) of EVA/120 phr MH (Magnifin A-H10A) formulations as a function of CNT or CB content.</p>
Full article ">Figure 4
<p>Elongation at break (%) of EVA/120 phr MH (KISUMA 5B) formulations as a function of CNT or CB content.</p>
Full article ">Figure 5
<p>Tensile strength of EVA/120 phr MH (KISUMA 5B) formulations as a function of CNT or CB content.</p>
Full article ">Figure 6
<p>LOI (%) of EVA/120 phr MH (KISUMA 5B) formulations as a function of CNT or CB content.</p>
Full article ">Figure 7
<p>Elongation at break (%) of EVA/120 phr HH (Ultracarb LH15X) formulations as a function of CNT or CB content.</p>
Full article ">Figure 8
<p>Tensile strength of EVA/120 phr HH (Ultracarb LH15X) formulations as a function of CNT or CB content.</p>
Full article ">Figure 9
<p>LOI (%) of EVA/120 phr Ultracarb LH15X formulations as a function of CNT or CB content.</p>
Full article ">Figure 10
<p>Elongation at break (%) of EVA/LLDPE/120 phr (Magnifin A-H10A) formulations as a function of CNT or CB content.</p>
Full article ">Figure 11
<p>Tensile strength of EVA/LLDPE/120 phr (Magnifin A-H10A) formulations as a function of CNT or CB content.</p>
Full article ">Figure 12
<p>LOI (%) of EVA/LLDPE/120 phr (Magnifin A-H10A) formulations as a function of CNT or CB content.</p>
Full article ">
14 pages, 2673 KiB  
Article
Temperature-Responsive Separation Membrane with High Antifouling Performance for Efficient Separation
by Tong Ji, Yuan Ji, Xiangli Meng and Qi Wang
Polymers 2024, 16(3), 416; https://doi.org/10.3390/polym16030416 - 1 Feb 2024
Viewed by 1119
Abstract
Temperature-responsive separation membranes can significantly change their permeability and separation properties in response to changes in their surrounding temperature, improving efficiency and reducing membrane costs. This study focuses on the modification of polyvinylidene fluoride (PVDF) membranes with amphiphilic temperature-responsive copolymer and inorganic nanoparticles. [...] Read more.
Temperature-responsive separation membranes can significantly change their permeability and separation properties in response to changes in their surrounding temperature, improving efficiency and reducing membrane costs. This study focuses on the modification of polyvinylidene fluoride (PVDF) membranes with amphiphilic temperature-responsive copolymer and inorganic nanoparticles. We prepared an amphiphilic temperature-responsive copolymer in which the hydrophilic poly(N-isopropyl acrylamide) (PNIPAAm) was side-linked to a hydrophobic polyvinylidene fluoride (PVDF) skeleton. Subsequently, PVDF-g-PNIPAAm polymer and graphene oxide (GO) were blended with PVDF to prepare temperature-responsive separation membranes. The results showed that temperature-responsive polymers with different NIPAAm grafting ratios were successfully prepared by adjusting the material ratio of NIPAAm to PVDF. PVDF-g-PNIPAAm was blended with PVDF with different grafting ratios to obtain separate membranes with different temperature responses. GO and PVDF-g-PNIPAAm formed a relatively stable hydrogen bond network, which improved the internal structure and antifouling performance of the membrane without affecting the temperature response, thus extending the service life of the membrane. Full article
(This article belongs to the Special Issue Carbon/Polymer Composite Materials)
Show Figures

Figure 1

Figure 1
<p>Reaction mechanism, <sup>1</sup>H NMR spectra, and TG curves of copolymer synthesis: (<b>a</b>) reaction mechanism; (<b>b</b>) the full <sup>1</sup>H NMR spectrum of the copolymer; (<b>c</b>,<b>d</b>) the local spectrum of copolymer <sup>1</sup>H NMR; (<b>e</b>) TG curves of the copolymer.</p>
Full article ">Figure 2
<p>Comprehensive performance of PVDF/PVDF-g-PNIPAAm membranes: (<b>a</b>) water flux; (<b>b</b>) rejection rate; (<b>c</b>) antifouling performance FRR; (<b>d</b>) mechanical properties; (<b>e</b>) porosity; (<b>f</b>) water contact angle.</p>
Full article ">Figure 3
<p>SEM photographs of the membranes: (<b>a1</b>–<b>f1</b>) the upper surfaces of pure PVDF membranes, PVDF/PVDF-g-PNIPAAm membranes, 0.25 wt%, 0.50 wt%, 0.75 wt%, 1.00 wt% GO content PVDF/PVDF-g-PNIPAAm/GO membranes; (<b>a2</b>–<b>f2</b>) the cross-section of the pure PVDF membranes, PVDF/PVDF-g-PNIPAAm membranes, 0.25 wt%, 0.50 wt%, 0.75 wt%, 1.00 wt% GO content PVDF/PVDF-g-PNIPAAm/GO membranes.</p>
Full article ">Figure 4
<p>Porosity and hydrophilicity of PVDF/PVDF-g-PNIPAAm/GO membrane: (<b>a</b>) porosity; (<b>b</b>) hydrophilicity.</p>
Full article ">Figure 5
<p>Comprehensive performance of PVDF/PVDF-g-PNIPAAm/GO membranes: (<b>a</b>) water flux; (<b>b</b>) rejection rate; (<b>c</b>) antifouling performance FRR; (<b>d</b>) mechanical properties.</p>
Full article ">Scheme 1
<p>(<b>a</b>) Schematic diagram of PVDF/PVDF-g-PNIPAAm/GO membrane formation; (<b>b</b>) schematic illustration of temperature response behavior.</p>
Full article ">
Previous Issue
Back to TopTop