[go: up one dir, main page]

Next Issue
Volume 16, February-1
Previous Issue
Volume 16, January-1
 
 
polymers-logo

Journal Browser

Journal Browser

Polymers, Volume 16, Issue 2 (January-2 2024) – 139 articles

Cover Story (view full-size image): 
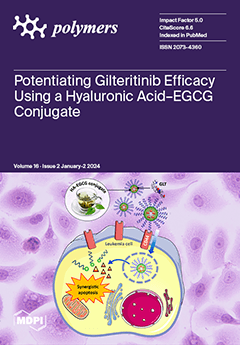
The FLT3 inhibitor gilteritinib has recently been approved, but it still suffers from limited efficacy and relatively high nonresponse rates. This article reports the potentiation of gilteritinib efficacy using nanocomplexation with a hyaluronic acid–EGCG conjugate. The nanocomplex efficiently internalized into FLT3-mutated leukemic cells and eradicated them in a synergistic manner by elevating the levels of reactive oxygen species and caspase-3/7 activities. This study may provide a useful strategy to design nanomedicines carrying FLT3 inhibitors for effective leukemia therapy. View this paper
  • Issues are regarded as officially published after their release is announced to the table of contents alert mailing list.
  • You may sign up for e-mail alerts to receive table of contents of newly released issues.
  • PDF is the official format for papers published in both, html and pdf forms. To view the papers in pdf format, click on the "PDF Full-text" link, and use the free Adobe Reader to open them.
Order results
Result details
Section
Select all
Export citation of selected articles as:
24 pages, 9841 KiB  
Article
Preparation and Characterization of High-Density Polyethylene with Alternating Lamellar Stems Using Molecular Dynamics Simulations
by Mohammed Althaf Hussain, Takashi Yamamoto, Syed Farooq Adil and Shigeru Yao
Polymers 2024, 16(2), 304; https://doi.org/10.3390/polym16020304 - 22 Jan 2024
Cited by 2 | Viewed by 1308
Abstract
Mechanical recycling is the most efficient way to reduce plastic pollution due to its ability to maintain the intrinsic properties of plastics as well as provide economic benefits involved in other types of recycling. On the other hand, molecular dynamics (MD) simulations provide [...] Read more.
Mechanical recycling is the most efficient way to reduce plastic pollution due to its ability to maintain the intrinsic properties of plastics as well as provide economic benefits involved in other types of recycling. On the other hand, molecular dynamics (MD) simulations provide key insights into structural deformation, lamellar crystalline axis (c-axis) orientations, and reorganization, which are essential for understanding plastic behavior during structural deformations. To simulate the influence of structural deformations in high-density polyethylene (HDPE) during mechanical recycling while paying attention to obtaining an alternate lamellar orientation, the authors examine a specific way of preparing stacked lamella-oriented HDPE united atom (UA) models, starting from a single 1000 UA (C1000) chain of crystalline conformations and then packing such chain conformations into 2-chain, 10-chain, 15-chain, and 20-chain semi-crystalline models. The 2-chain, 10-chain, and 15-chain models yielded HDPE microstructures with the desired alternating lamellar orientations and entangled amorphous segments. On the other hand, the 20-chain model displayed multi-nucleus crystal growth instead of the lamellar-stack orientation. Structural characterization using a one-dimensional density profile and local order parameter {P2(r)} analyses demonstrated lamellar-stack orientation formation. All semi-crystalline models displayed the total density (ρ) and degree of crystallinity (χ) range of 0.90–0.94 g/cm−3 and ≥42–45%, respectively. A notable stress yield (σ_yield) ≈ 100–120 MPa and a superior elongation at break (ε_break) ~250% was observed under uniaxial strain deformation along the lamellar-stack orientation. Similarly, during the MD simulations, the microstructure phase change represented the average number of entanglements per chain (<Z>). From the present study, it can be recommended that the 10-chain alternate lamellar-stack orientation model is the most reliable miniature model for HDPE that can mimic industrially relevant plastic behavior in various conditions. Full article
(This article belongs to the Special Issue Advanced Recycling of Plastic Waste: An Approach for Circular Economy)
Show Figures

Figure 1

Figure 1
<p>The pictorial representation of lamellar stacked model creation using the Material Studio 2022 (version 22.1.0.3462, Accelrys, San Diego, CA, USA): (<b>A</b>) the random chain created from the EMC tool; (<b>B</b>,<b>C</b>) shows the lamellae formation with folds; (<b>D</b>) two independent chains are kept in a stacked orientation; and (<b>E</b>) is the stacked structures relaxed form; (<b>F</b>) the NVT melting to 500 K and its NPT relaxation form is shown in (<b>G</b>) after 1 ns MD, respectively. Two independent HDPE chains’ lamellar stacked model (rectangular crystals) with folds and tails is used as an input data file in LAMMPS. The blue and brown colors represent independent C<sub>1000</sub> HDPE chains.</p>
Full article ">Figure 2
<p>The creation of the other three models from the rectangular crystal (RC) form is illustrated. The RC model is melted at 500 K using NVT for 1 ns to obtain the RA model. At the same time, the cubic crystal (CC) and cubic amorphous (CA) models are created just by expanding the RC and RA box sizes in the x and y directions, respectively. The blue and brown colors represent each chain.</p>
Full article ">Figure 3
<p>The LAMMPS input data files for extended 10-chain, 15-chain, and 20-chain models are using the 2C<sub>1000</sub> RC model building <a href="#app1-polymers-16-00304" class="html-app">Scheme S1</a> in Material Studio.</p>
Full article ">Figure 4
<p>All equilibrated RC, RA, CC, and CA models and their densities (<span class="html-italic">ρ</span>) are shown as equilibrated structures at 450 K and 1 atm for 10 ns time length. Each color represents a C<sub>1000</sub> chain. Mean average values of potential energy (PE) in red lines, temperature (T) in black lines, and density (<math display="inline"><semantics> <mrow> <mi>ρ</mi> </mrow> </semantics></math>) in orange lines are computed for the equilibration of 2C<sub>1000</sub> rectangular and cubic box models. The blue dots in respective figures represent the actual potential energy, temperature, and densities at respective simulation times.</p>
Full article ">Figure 5
<p>The total density evolution over time in the isothermal cooling at 300 K of RC, RA, CC, and CA models for 1 <math display="inline"><semantics> <mrow> <mi mathvariant="sans-serif">μ</mi> <mi mathvariant="normal">s</mi> </mrow> </semantics></math>. A one-dimensional density profile is computed in the <span class="html-italic">Z</span>-axis direction for RC and RA and all-axis densities for CC and CA. The ordered and random regions in the box represent the crystalline and amorphous states of the HDPE, respectively. The blue and brown colors represent each chain.</p>
Full article ">Figure 6
<p>Schematic representation of the crystalline and amorphous regions of (<b>A</b>) 2C<sub>1000</sub> (RC, RA, CC, and CA) models and RC model’s degree of crystallinity evolution in the isothermal crystallization at 300 K. (<b>B</b>) The formation of three-layer lamellar stems is being illustrated for the RC model in isothermal cooling at 300 K. The cyan and blue colors represent the crystalline and amorphous regions, respectively.</p>
Full article ">Figure 7
<p>The potential energy, temperature, and density parameters stabilization in the NPT equilibration for 10 ns is shown for 10-, 15-, and 20-chain models at 450 K and 1 atm. The blue dots in all the figures are the potential energy, temperature, and densities obtained during the MD simulations. Whereas the lines with red, black and orange are the moving averages of the same, respectively. Each color in the figures represents an independent chain in the model.</p>
Full article ">Figure 8
<p>Potential energy decomposition into the various components for 10-, 15-, and 20-chain models at 450 K for the equilibration step to ensure the stabilization of the microstructure.</p>
Full article ">Figure 9
<p>Semi-crystalline extended models: 10C<sub>1000</sub>, 15C<sub>1000</sub>, and 20C<sub>1000</sub>. The unwrapped box/open box models indicate the formation of the crystal network’s bridge, loop, and tails. Each color in the figures represents an independent chain in the model.</p>
Full article ">Figure 10
<p>(<b>A</b>) Density evolution for 10-, 15-, and 20-chain models is shown during the isothermal crystallization at 300 K and 1 atm. Additionally, the Z-directional densities in the case of 10 chains (<b>B</b>) and 15 chains (<b>C</b>) and Y-directional in 20-chain models (<b>D</b>) are shown. The ordered and random regions in the box represent the crystalline and amorphous states of the HDPE, respectively. Each chain represents an individual chain in the model.</p>
Full article ">Figure 11
<p>(<b>A</b>) The degree of crystallinity evolution in the isothermal cooling at 300 K for 10-chain, 15-chain, and 20-chain models. (<b>B</b>) Representation of crystalline (cyan color) and amorphous regions (blue color) of the final trajectory file (500 ns).</p>
Full article ">Figure 12
<p>The uniaxial deformation (tensile test; stress–strain curve) to a strain rate of 10<sup>10</sup> s<sup>−1</sup> is performed at 300 K and 1 atm pressure for the extended models. Models 10C<sub>1000</sub> and 15C<sub>1000</sub> are deformed in the Z-direction, while Y-direction deformation is performed in the case of the 20C<sub>1000</sub> model. All the deformations are performed along the alternate lamellar orientation axis. As the trajectory frequency is recorded at 1 ps time intervals, the mean average lines, in some cases, starting stress points are not visible. However, the starting stresses exist at low-frequency trajectory recordings (0.1 ps). Each color represents an independent polymer chain in the simulation box.</p>
Full article ">
15 pages, 4187 KiB  
Article
Synthesis and Characterization of DOPO-Containing Poly(2,6-dimethyl-1,4-phenylene oxide)s by Oxidative Coupling Polymerization
by Cheng-Hao Lu, Chi Chang, Yu-Chen Huang, Jun-Xiang You and Mong Liang
Polymers 2024, 16(2), 303; https://doi.org/10.3390/polym16020303 - 22 Jan 2024
Viewed by 1150
Abstract
A set of polyphenylene oxides incorporating DOPO (9,10-dihydro-9-oxa-10-phosphaphenanthrene-10-oxide) functionality, denoted as DOPO−R−PPO, was synthesized by copolymerization of 2,6-dimethylphenol (2,6-DMP) with various DOPO-substituted tetramethyl bisphenol monomers. In the initial step, a Friedel–Crafts acylation reaction was employed to react 2,6-DMP with different acyl chlorides, leading [...] Read more.
A set of polyphenylene oxides incorporating DOPO (9,10-dihydro-9-oxa-10-phosphaphenanthrene-10-oxide) functionality, denoted as DOPO−R−PPO, was synthesized by copolymerization of 2,6-dimethylphenol (2,6-DMP) with various DOPO-substituted tetramethyl bisphenol monomers. In the initial step, a Friedel–Crafts acylation reaction was employed to react 2,6-DMP with different acyl chlorides, leading to the formation of ketone derivatives substituted with 2,6-dimethylphenyl groups. Subsequently, the ketones, along with DOPO and 2,6-DMP, underwent a condensation reaction to yield a series of DOPO-substituted bisphenol derivatives. Finally, polymerizations of 2,6-dimethylphenol with these DOPO-substituted bisphenols were carried out in organic solvents using copper(I) bromide/N-butyldimethylamine catalysts (CuBr/DMBA) under a continuous flow of oxygen, yielding telechelic PPO oligomers with DOPO moieties incorporated into the polymer backbone. The chemical structures of the synthesized compounds were characterized using various analytical techniques, including Fourier transform infrared spectroscopy (FTIR), proton nuclear magnetic resonance (1H NMR), phosphorus nuclear magnetic resonance (31P NMR), differential scanning calorimetry (DSC), and thermogravimetric analysis (TGA). When compared to conventional poly(2,6-dimethyl-1,4-phenylene oxide)s with a similar molecular weight range, all DOPO−PPOs exhibited higher glass transition temperatures, enhanced thermal degradability, and increased char yield formation at 800 °C without compromising solubility in organic solvents. Full article
Show Figures

Graphical abstract

Graphical abstract
Full article ">Figure 1
<p>Representative <sup>1</sup>H NMR spectra of DOPO−R−diol (R = Me).</p>
Full article ">Figure 2
<p>FTIR spectrum of DOPO−Me−diol.</p>
Full article ">Figure 3
<p><sup>1</sup>H NMR spectrum of DOPO−Me−PPO.</p>
Full article ">Figure 4
<p><sup>1</sup>H NMR spectrum of DOPO−C<sub>11</sub>−PPO in CDCl<sub>3</sub>.</p>
Full article ">Figure 5
<p>Gel permeation chromatograms of DOPO−R−PPO.</p>
Full article ">Figure 6
<p>DSC heating curves of DOPO−R−PPOs.</p>
Full article ">Figure 7
<p>TGA and DTG of DOPO−Me−PPO: (<b>a</b>) in N<sub>2</sub>; (<b>b</b>) in air.</p>
Full article ">Scheme 1
<p>Preparation of the DOPO-incorporated poly(phenylene oxide)s.</p>
Full article ">
13 pages, 3793 KiB  
Article
Properties of Heat-Treated Wood Fiber–Polylactic Acid Composite Filaments and 3D-Printed Parts Using Fused Filament Fabrication
by Yu-Chen Chien and Teng-Chun Yang
Polymers 2024, 16(2), 302; https://doi.org/10.3390/polym16020302 - 22 Jan 2024
Cited by 1 | Viewed by 1063
Abstract
Wood fibers (WFs) were treated at a fixed heat temperature (180 °C) for 2−6 h and added to a polylactic acid (PLA) matrix to produce wood−PLA composite (WPC) filaments. Additionally, the effects of the heat-treated WFs on the physicomechanical properties and impact strength [...] Read more.
Wood fibers (WFs) were treated at a fixed heat temperature (180 °C) for 2−6 h and added to a polylactic acid (PLA) matrix to produce wood−PLA composite (WPC) filaments. Additionally, the effects of the heat-treated WFs on the physicomechanical properties and impact strength of the WPC filaments and 3D-printed WPC parts using fused filament fabrication (FFF) were examined. The results revealed that heat-treated WFs caused an increase in crystallinity and a significant reduction in the number of pores on the failure cross section of the WPC filament, resulting in a higher tensile modulus and lower elongation at break. Additionally, the printed WPC parts with heat-treated WFs had higher tensile strength and lower water absorption compared to untreated WPC parts. However, most of the mechanical properties and impact strength of 3D-printed WPC parts were not significantly influenced by adding heat-treated WFs. As described above, at the fixed fiber addition amount, adding heat-treated WFs improved the dimensional stability of the WPC parts and it enabled a high retention ratio of mechanical properties and impact strength of the WPC parts. Full article
Show Figures

Figure 1

Figure 1
<p>Schematic diagram of the manufacturing of WPC filaments and 3D printing of WPC parts.</p>
Full article ">Figure 2
<p>Appearances of an impact tester and an unnotched impact sample.</p>
Full article ">Figure 3
<p>(<b>a</b>–<b>d</b>) Surface morphology and (<b>e</b>–<b>g</b>) failure cross-sectional surfaces of WPC filaments with different heat-treated WFs. (<b>a</b>,<b>e</b>): WPC<sub>FNT</sub>; (<b>b</b>,<b>f</b>): WPC<sub>FT2</sub>; (<b>c</b>,<b>g</b>): WPC<sub>FT4</sub>; (<b>d</b>,<b>h</b>): WPC<sub>FT6</sub>.</p>
Full article ">Figure 4
<p>Heat flow of WPC filaments with different heat-treated WFs.</p>
Full article ">Figure 5
<p>Surface appearances of 3D-printed WPC parts with different heat-treated WFs.</p>
Full article ">
17 pages, 3516 KiB  
Article
Water-Soluble Star Polymer as a Potential Photoactivated Nanotool for Lysozyme Degradation
by Lidia Mezzina, Angelo Nicosia, Laura Barone, Fabiana Vento and Placido Giuseppe Mineo
Polymers 2024, 16(2), 301; https://doi.org/10.3390/polym16020301 - 22 Jan 2024
Viewed by 1005
Abstract
The development of nanotools for chemical sensing and macromolecular modifications is a new challenge in the biomedical field, with emphasis on artificial peptidases designed to cleave peptide bonds at specific sites. In this landscape, metal porphyrins are attractive due to their ability to [...] Read more.
The development of nanotools for chemical sensing and macromolecular modifications is a new challenge in the biomedical field, with emphasis on artificial peptidases designed to cleave peptide bonds at specific sites. In this landscape, metal porphyrins are attractive due to their ability to form stable complexes with amino acids and to generate reactive oxygen species when irradiated by light of appropriate wavelengths. The issues of hydrophobic behavior and aggregation in aqueous environments of porphyrins can be solved by using its PEGylated derivatives. This work proposes the design of an artificial photo-protease agent based on a PEGylated mercury porphyrin, able to form a stable complex with l-Tryptophan, an amino acid present also in the lysozyme structure (a well-known protein model). The sensing and photodegradation features of PEGylated mercury porphyrin were exploited to detect and degrade both l-Trp and lysozyme using ROS, generated under green (532 nm) and red (650 nm) light lasers. The obtained system (Star3600_Hg) and its behavior as a photo-protease agent were studied by means of several spectroscopies (UV-Vis, fluorescence and circular dichroism), and MALDI-TOF mass spectrometry, showing the cleavage of lysozyme and the appearance of several short-chain residues. The approach of this study paves the way for potential applications in theranostics and targeted bio-medical therapies. Full article
(This article belongs to the Section Polymer Chemistry)
Show Figures

Figure 1

Figure 1
<p>MALDI-TOF mass spectra of Star3600_2H (<b>a</b>) and Star3600_Hg (<b>b</b>).</p>
Full article ">Figure 2
<p>UV-Vis (continuous lines) and fluorescence (dashed lines) spectra of water solutions of Star3600_2H (red lines, λ<sub>exc</sub> = 430 nm), Star3600_Zn (green lines, λ<sub>exc</sub> = 435 nm) and Star3600_Hg (blue lines, λ<sub>exc</sub> = 440 nm. Spectrum magnified ×25).</p>
Full article ">Figure 3
<p>(<b>a</b>) Singlet oxygen production mechanism scheme and (<b>b</b>) RNO degradation mechanism mediated by the <sup>1</sup>O<sub>2</sub>–imidazole system.</p>
Full article ">Figure 4
<p><b>Upper</b>: circular dichroism spectra of aqueous solutions of pristine Star3600_Hg (black line) and of Star3600_Er (green), Star3600_Rh (cyan), Star3600_Sn (magenta), Star3600_Zn (blue) and Star3600_Hg (red line) when mixed with <span class="html-small-caps">l</span>-Trp (molar ratio 1:100). <b>Bottom</b>: relative UV-Vis spectra in the Soret band region.</p>
Full article ">Figure 5
<p>UV-vis (continuous lines) and fluorescence (dashed lines) spectra of aqueous solutions of Star3600_Hg (black line) and a mixture of Star3600_Hg and <span class="html-small-caps">l</span>-Trp in molar ratio 1:100 freshly prepared (red line) and after 10 and 120 min (blue and green lines, respectively).</p>
Full article ">Figure 6
<p>RNO degradation mechanism mediated by the <sup>1</sup>O<sub>2</sub>–<span class="html-small-caps">l</span>-Trp system.</p>
Full article ">Figure 7
<p>UV-vis spectra of the mixture of 5 µM aqueous solution of Star3600_Hg and <span class="html-small-caps">l</span>-TRP (ratio 1:100) when exposed to a red laser (650 nm) irradiation.</p>
Full article ">Figure 8
<p>UV-Vis (continuous lines) and fluorescence (dashed lines) spectra (λ<sub>exc</sub> = 440 nm) of Star3600_Hg/LSZ complex. The black line is an aqueous solution (5 µM) of Star3600_Hg, and red and green lines are the aqueous solution mixture of Star3600_Hg with LSZ (molar ratio 1:1) freshly prepared and after 2 days, respectively.</p>
Full article ">Figure 9
<p>Fluorescence spectra (λ<sub>exc</sub> = 290 nm) of the aqueous solution of Star3600_Hg and LSZ mixture (both 5 µM) under (<b>a</b>) green (532 nm) and (<b>b</b>) red (650 nm) laser irradiation.</p>
Full article ">Figure 10
<p>(<b>a</b>) CD spectra of aqueous solutions of LSZ (blue line), Star3600_Hg and LSZ (both 5 µM) mixture freshly prepared (black line), and after 40 (green dash dot line) and 80 (green solid line) minutes under green laser irradiation; (<b>b</b>) magnification of the range 400–490 nm and (<b>c</b>) the related UV-vis spectra.</p>
Full article ">Figure 11
<p>MALDI-TOF mass spectra of pristine lysozyme (black line) and Star3600_Hg-LSZ solution after 80 min of laser irradiation (magenta line). The symbols are explained in <a href="#polymers-16-00301-t003" class="html-table">Table 3</a>.</p>
Full article ">Figure 12
<p>Aminoacidic sequence of lysozyme. W indicates <span class="html-small-caps">l</span>-Trp residues.</p>
Full article ">Figure 13
<p>Schematic representation of the Star 3600_Hg photo-induced proteolysis mechanism.</p>
Full article ">Scheme 1
<p>Exemplificative scheme of the synthesis of Star3600_Me.</p>
Full article ">
13 pages, 2415 KiB  
Article
Estimation of Digital Porosity of Electrospun Veils by Image Analysis
by Guadalupe Cuahuizo-Huitzil, Octavio Olivares-Xometl, Paulina Arellanes-Lozada, José Oscar Laguna Cortés, Janette Arriola Morales, Claudia Santacruz-Vázquez and Verónica Santacruz-Vázquez
Polymers 2024, 16(2), 300; https://doi.org/10.3390/polym16020300 - 22 Jan 2024
Viewed by 1117
Abstract
The present work reports on an empirical mathematical expression for predicting the digital porosity (DP) of electrospun nanofiber veils, employing emulsions of poly(vinyl alcohol) (PVOH) and olive and orange oils. The electrospun nanofibers were analyzed by scanning electron microscopy (SEM), observing orientation and [...] Read more.
The present work reports on an empirical mathematical expression for predicting the digital porosity (DP) of electrospun nanofiber veils, employing emulsions of poly(vinyl alcohol) (PVOH) and olive and orange oils. The electrospun nanofibers were analyzed by scanning electron microscopy (SEM), observing orientation and digital porosity (DP) in the electrospun veils. To determine the DP of the veils, the SEM micrographs were transformed into a binary system, and then the threshold was established, and the nanofiber solid surfaces were emphasized. The relationship between the experimental results and those obtained with the empirical mathematical expression displayed a correlation coefficient (R2) of 0.97 by employing threshold II. The mathematical expression took into account experimental variables such as the nanofiber humidity and emulsion conductivity prior to electrospinning, in addition to the corresponding operation conditions. The results produced with the proposed expression showed that the prediction of the DP of the electrospun veils was feasible with the considered thresholds. Full article
Show Figures

Figure 1

Figure 1
<p>Micrograph of PVOH 10% <span class="html-italic">w</span>/<span class="html-italic">w</span> with different thresholds.</p>
Full article ">Figure 2
<p>Micrographs of the employed systems: (<b>a</b>) PVOH 8% (<b>b</b>) PVOH 10% (<b>c</b>) PVOH 10%/OO 4%, (<b>d</b>) PVOH 10%/OO 8%, (<b>e</b>) PVOH 10%/OO 12%, (<b>f</b>) PVOH 10%/OEO 5% and (<b>g</b>) PVOH 10%/OEO 7.5%.</p>
Full article ">Figure 3
<p>Predicted and experimental DP values for the electrospun veils, Threshold I.</p>
Full article ">Figure 4
<p>Predicted and experimental DP values for the electrospun veils, Threshold II.</p>
Full article ">Figure 5
<p>Predicted and experimental DP values for the electrospun veils, Threshold III.</p>
Full article ">
17 pages, 6929 KiB  
Article
Application of Polymeric CO2 Thickener Polymer-Viscosity-Enhance in Extraction of Low-Permeability Tight Sandstone
by Hong Fu, Kaoping Song, Yiqi Pan, Hanxuan Song, Senyao Meng, Mingxi Liu, Runfei Bao, Hongda Hao, Longxin Wang and Xindong Fu
Polymers 2024, 16(2), 299; https://doi.org/10.3390/polym16020299 - 22 Jan 2024
Viewed by 1051
Abstract
The conventional production technique employed for low-permeability tight reservoirs exhibits limited productivity. To solve the problem, an acetate-type supercritical carbon dioxide (scCO2) thickener, PVE, which contains a large number of microporous structures, was prepared using the atom transfer radical polymerization (ATRP) [...] Read more.
The conventional production technique employed for low-permeability tight reservoirs exhibits limited productivity. To solve the problem, an acetate-type supercritical carbon dioxide (scCO2) thickener, PVE, which contains a large number of microporous structures, was prepared using the atom transfer radical polymerization (ATRP) method. The product exhibited an ability to decrease the minimum miscibility pressure of scCO2 during a solubility test and demonstrated a favorable extraction efficiency in a low-permeability tight core displacement test. At 15 MPa and 70 °C, PVE-scCO2 at a concentration of 0.2% exhibits effective oil recovery rates of 5.61% for the 0.25 mD core and 2.65% for the 5 mD core. The result demonstrates that the incorporation of the thickener PVE can effectively mitigate gas channeling, further improve oil displacement efficiency, and inflict minimal damage to crude oil. The mechanism of thickening was analyzed through molecular simulation. The calculated trend of thickening exhibited excellent agreement with the experimental measurement rule. The simulation results demonstrate that the contact area between the polymer and CO2 increases in direct proportion to both the number of thickener molecules and the viscosity of the system. The study presents an effective strategy for mitigating gas channeling during scCO2 flooding and has a wide application prospect. Full article
(This article belongs to the Section Polymer Applications)
Show Figures

Figure 1

Figure 1
<p>The diagram of the PVE synthesis device.</p>
Full article ">Figure 2
<p>SEM of sandstone sample.</p>
Full article ">Figure 3
<p>The FT-IR spectra (<b>a</b>) and NMR spectra (<b>b</b>) of PVE.</p>
Full article ">Figure 4
<p>The SEM of the PVE sample powder.</p>
Full article ">Figure 5
<p>TG and DSC of PVE.</p>
Full article ">Figure 6
<p>The process of miscibility and dissolution of PVE in scCO<sub>2</sub>.</p>
Full article ">Figure 7
<p>The temperature-dependent shear viscosity curve of the system under various pressures.</p>
Full article ">Figure 8
<p>The curve of experimental results for scCO<sub>2</sub> injection displacement.</p>
Full article ">Figure 9
<p>Variation trend of Kro and Krg curves before and after the introduction of PVE.</p>
Full article ">Figure 10
<p>PVE molecule.</p>
Full article ">Figure 11
<p>Change in energy balance in PVE-scCO<sub>2</sub> system.</p>
Full article ">Figure 12
<p>The molecular distribution in each system before and after reaching equilibrium.</p>
Full article ">Figure 13
<p>The total contact area of the CO<sub>2</sub>-PVE system in each individual system under various conditions.</p>
Full article ">Figure 14
<p>The viscosity changes of each system compared under various conditions.</p>
Full article ">
21 pages, 5724 KiB  
Review
Thermodynamics of the Glassy Polymer State: Equilibrium and Non-Equilibrium Aspects
by Costas Panayiotou
Polymers 2024, 16(2), 298; https://doi.org/10.3390/polym16020298 - 22 Jan 2024
Viewed by 1142
Abstract
This work examines, first, the non-equilibrium character of the glassy state of polymer systems and its significance in the development of novel materials for important technological applications. Subsequently, it summarizes the essentials of the generalized lattice fluid approach for the description of this [...] Read more.
This work examines, first, the non-equilibrium character of the glassy state of polymer systems and its significance in the development of novel materials for important technological applications. Subsequently, it summarizes the essentials of the generalized lattice fluid approach for the description of this highly complex non-equilibrium behavior with an approximate and simple, yet analytically powerful formalism. The working equations are derived in a straightforward and consistent manner by clearly defining the universal and specific variables needed to describe the discussed properties. The role of the non-random distribution of molecular species and free volume in the glassy system is also examined, as is the role of strong specific interactions, such as hydrogen-bonding networks. This work also reports examples of applications in a variety of representative systems, including glass densification, retrograde vitrification, increase in glass-transition temperature in hydrogen-bonded polymer mixtures, and hysteresis phenomena in sorption–desorption from glassy polymer matrices. Full article
Show Figures

Figure 1

Figure 1
<p>Experimental PVT data for poly(vinyl acetate) (PVAc) at the glass transition region [<a href="#B6-polymers-16-00298" class="html-bibr">6</a>]. The straight lines are drawn to show the change in slope at the glass transition and the definition of Tg at the intersection. The thick green line passing through the intersections shows the variation in Tg with pressure.</p>
Full article ">Figure 2
<p>Schematic illustration of the role of formation history on the density of the final glassy state. States I and C are obtained from the same isobars (same constant pressure, atmospheric) at different cooling rates. State G, shown at the same final temperature <span class="html-italic">T</span><sub>1</sub>, is obtained by first pressurizing the melt to a high pressure, P<sub>2</sub>, and then cooling isobarically to temperature <span class="html-italic">T</span><sub>1</sub>, at which point isothermal depressurization takes place until atmospheric pressure is reached.</p>
Full article ">Figure 3
<p>The four types of T<sub>g</sub> behavior as a function of pressure, as predicted by the LF model. Reprinted with permission from ref. [<a href="#B13-polymers-16-00298" class="html-bibr">13</a>].</p>
Full article ">Figure 4
<p>Glass transition temperatures of a SVPh60/PIBMA mixture. Filled rectangles represent experimental data [<a href="#B20-polymers-16-00298" class="html-bibr">20</a>]. The equation of the solid line was calculated from the LFHB model. The dashed line represents the non-hydrogen bonding LF contribution to T<sub>g</sub>. Reproduced with permission from reference [<a href="#B20-polymers-16-00298" class="html-bibr">20</a>].</p>
Full article ">Figure 5
<p>Experimental [<a href="#B37-polymers-16-00298" class="html-bibr">37</a>] (symbols) and calculated (lines) gas solubilities of CO<sub>2</sub> in unconditioned (<b>a</b>) and conditioned (<b>b</b>) PC at 35 °C, obtained by considering the excess volume to be known. Reproduced, with permission, from reference [<a href="#B36-polymers-16-00298" class="html-bibr">36</a>].</p>
Full article ">Figure 6
<p>Experimental [<a href="#B37-polymers-16-00298" class="html-bibr">37</a>] (symbols) and calculated (lines) gas solubilities on unconditioned and conditioned PC samples, considering volume changes to be known (<b>a</b>) and volume changes in the same sample calculated by considering gas solubilities to be known (<b>b</b>). Reproduced with permission from [<a href="#B36-polymers-16-00298" class="html-bibr">36</a>].</p>
Full article ">Figure 7
<p>NRHB model fitting of PVT data [<a href="#B40-polymers-16-00298" class="html-bibr">40</a>] to obtain the scaling constants for PC.</p>
Full article ">Figure 8
<p>Changes in PC-CO<sub>2</sub> volume during sorption and desorption at 35 °C, ρ<sub>2</sub> = 1.200 g/cm<sup>3</sup> or V<sub>0</sub> = 0.8333 cm<sup>3</sup>/g [<a href="#B38-polymers-16-00298" class="html-bibr">38</a>].</p>
Full article ">Figure 9
<p>Comparison of CO<sub>2</sub> sorption/desorption data [<a href="#B38-polymers-16-00298" class="html-bibr">38</a>] in PC at 35 °C with NE-LFHB (solid lines) (correlation of only sorption data with ξ = 1.1533) and NETGP-NRHB (dashed lines) (correlation of only sorption data with ξ = 1.1444). In both models, the values of the mixture volume are taken from <a href="#polymers-16-00298-f008" class="html-fig">Figure 8</a>.</p>
Full article ">Figure 10
<p>Comparison of H<sub>2</sub>O sorption data [<a href="#B43-polymers-16-00298" class="html-bibr">43</a>] in 6FDA_6FpDA at 30 °C by NE-LFHB (correlation of sorption data with ξ = 0.8211 and G<sub>12</sub> = −12,773 J mol<sup>−1</sup>) and NETGP-NRHB (correlation of sorption data with ξ = 0.869 and G<sub>12</sub> = −12,100 J mol<sup>−1</sup>).</p>
Full article ">Figure 11
<p>The swelling constant as a function of pressure in the CO<sub>2</sub>-PC system, as obtained from Equation (51) and the experimental ΔV/V<sub>0</sub> data [<a href="#B37-polymers-16-00298" class="html-bibr">37</a>] at 35 °C. The line is obtained from the correlated ΔV/V<sub>0</sub> data.</p>
Full article ">
17 pages, 4451 KiB  
Article
Enhanced Mechanical and Thermal Properties of Polyimide Films Using Hydrophobic Fumed Silica Fillers
by Jongin Yeob, Sung Woo Hong, Won-Gun Koh and In Park
Polymers 2024, 16(2), 297; https://doi.org/10.3390/polym16020297 - 22 Jan 2024
Cited by 1 | Viewed by 1344
Abstract
Polyimide (PI) composite films with enhanced mechanical properties were prepared by incorporating modified fumed silica (FS) particles while preserving their optical and thermal characteristics. The PI matrix was synthesized using a fluorinated diamine, a fluorinated dianhydride, and a rigid biphenyl dianhydride via chemical [...] Read more.
Polyimide (PI) composite films with enhanced mechanical properties were prepared by incorporating modified fumed silica (FS) particles while preserving their optical and thermal characteristics. The PI matrix was synthesized using a fluorinated diamine, a fluorinated dianhydride, and a rigid biphenyl dianhydride via chemical imidization. Commercially available FS particles, including unmodified FS particles (0-FS) and particles modified with dimethyl (2-FS), trimethyl (3-FS), octyl (8-FS), octamethylcyclotetrasiloxane (D4-FS), and polydimethylsiloxane (PDMS-FS) were used. Scanning electron microscope images and nitrogen adsorption–desorption isotherms revealed well-defined porous structures in the FS particles. The water contact angles on the composite films increased compared to those of the pristine PI films, indicating improved water resistance. The PI/0-FS films exhibited a typical trade-off relationship between tensile modulus and elongation at break, as observed in conventional composites. Owing to the poor compatibility and agglomeration of the PDMS-FS particles, the PI/PDMS-FS composite films exhibited poor mechanical performance and diminished optical characteristics. Although the longer-chained FS particles (8- and D4-FS) improved the tensile modulus of the PI film by up to 12%, a reduction of more than 20% in toughness was observed. The PI composite films containing the methylated FS particles (2- and 3-FS) outperformed 8- and D4-FS in terms of mechanical properties, with PI/3-FS films showing an over 10% increased tensile modulus (from 4.07 to 4.42 GPa) and 15% improved toughness (from 6.97 to 8.04 MJ/m3) at 7 wt. % silica loading. Except for the PI/PDMS-FS composites, all composite film samples exhibited more than 86% transmittance at 550 nm. Regarding thermal properties, the glass transition temperature (Tg) and thermal stability remained stable for most composite films. In addition, PI/3-FS films demonstrated enhanced dimensional stability with lower coefficients of thermal expansion (from 47.3 to 34.5 ppm/°C). Overall, this study highlights the potential of incorporating specific modified FS particles to tailor the mechanical, optical, and thermal properties of PI composite films. Full article
Show Figures

Graphical abstract

Graphical abstract
Full article ">Figure 1
<p>Chemical structures of the FS surfaces for the unmodified FS samples and the modified FS samples.</p>
Full article ">Figure 2
<p>Preparation process of PI oligomer powder from PAA solution in DMAc through chemical imidization and purification using water and ethanol.</p>
Full article ">Figure 3
<p>SEM images of FS particles: (<b>A</b>) 0-FS, (<b>B</b>) 2-FS, (<b>C</b>) 3-FS, (<b>D</b>) 8-FS, (<b>E</b>) D4-FS, and (<b>F</b>) PDMS-FS (the scale bar on the bottom right is 100 nm).</p>
Full article ">Figure 4
<p>FT-IR spectra of the FS materials in the range of (<b>A</b>) 450–4000 cm<sup>−1</sup> and (<b>B</b>) 2600–3500 cm<sup>−1</sup> to clearly show the –CH<sub>2</sub> and –CH<sub>3</sub> stretching bands.</p>
Full article ">Figure 5
<p>TGA curves of the FS particles.</p>
Full article ">Figure 6
<p>FT-IR spectra of the PAA powder, the PI oligomer powder, and the pristine PI film.</p>
Full article ">Figure 7
<p>Digital photo images of the water droplets on (<b>A</b>) the pristine PI and the PI/FS composite films containing (<b>B</b>) 0-, (<b>C</b>) 2-, (<b>D</b>) 3-, (<b>E</b>) 8-, (<b>F</b>) D4- and (<b>G</b>) PDMS-FS-7.</p>
Full article ">Figure 8
<p>Tensile properties of the pristine PI and the PI/FS composite films. Tensile moduli (blue), tensile strength (black), elongations at brake (red), and toughness (orange) of the PI composite films containing (<b>A</b>) 0-, (<b>B</b>) 2-, (<b>C</b>) 3-, (<b>D</b>) 8-, (<b>E</b>) D4-, and (<b>F</b>) PDMS-FS as a function of FS loadings.</p>
Full article ">Figure 9
<p>UV-vis spectra of the pristine PI and PI/FS composite films: (<b>A</b>) 0-, (<b>B</b>) 2-, (<b>C</b>) 3-, (<b>D</b>) 8-, (<b>E</b>) D4-, and (<b>F</b>) PDMS-FS.</p>
Full article ">Figure 10
<p>Optical images of the pristine and PI/FS composite films.</p>
Full article ">
11 pages, 2135 KiB  
Article
Bottlebrush Elastomers with Crystallizable Side Chains: Monolayer-like Structure of Backbones Segregated in Intercrystalline Regions
by Evgeniia A. Nikitina, Erfan Dashtimoghadam, Sergei S. Sheiko and Dimitri A. Ivanov
Polymers 2024, 16(2), 296; https://doi.org/10.3390/polym16020296 - 22 Jan 2024
Cited by 1 | Viewed by 1044
Abstract
Bottlebrush (BB) elastomers with water-soluble side chains and tissue-mimetic mechanical properties are promising for biomedical applications like tissue implants and drug depots. This work investigates the microstructure and phase transitions of BB elastomers with crystallizable polyethylene oxide (PEO) side chains by real-time synchrotron [...] Read more.
Bottlebrush (BB) elastomers with water-soluble side chains and tissue-mimetic mechanical properties are promising for biomedical applications like tissue implants and drug depots. This work investigates the microstructure and phase transitions of BB elastomers with crystallizable polyethylene oxide (PEO) side chains by real-time synchrotron X-ray scattering. In the melt, the elastomers exhibit the characteristic BB peak corresponding to the backbone-to-backbone correlation. This peak is a distinct feature of BB systems and is observable in small- or medium-angle X-ray scattering curves. In the systems studied, the position of the BB peak ranges from 3.6 to 4.8 nm in BB elastomers. This variation is associated with the degree of polymerization of the polyethylene oxide (PEO) side chains, which ranges from 19 to 40. Upon crystallization of the side chains, the intensity of the peak decays linearly with crystallinity and eventually vanishes due to BB packing disordering within intercrystalline amorphous gaps. This behavior of the bottlebrush peak differs from an earlier study of BBs with poly(ε-caprolactone) side chains, explained by stronger backbone confinement in the case of PEO, a high-crystallinity polymer. Microstructural models based on 1D SAXS correlation function analysis suggest crystalline lamellae of PEO side chains separated by amorphous gaps of monolayer-like BB backbones. Full article
(This article belongs to the Section Polymer Chemistry)
Show Figures

Figure 1

Figure 1
<p>(<b>A</b>) SAXS curves of PGX_2k_200 (blue), PGX_2k_400 (pink), PGX_950_200 (purple), PGX_950_400 (green), and PGX_950_800 (orange) measured at −40 °C. Inset: Bottlebrush peak ex hibits low-q shift upon increasing side chain length from PGX_950_200 (<math display="inline"><semantics> <mrow> <msub> <mrow> <mi>n</mi> </mrow> <mrow> <mi>s</mi> <mi>c</mi> </mrow> </msub> <mo>=</mo> <mn>19</mn> </mrow> </semantics></math>, purple) to PGX_2k_400 (<math display="inline"><semantics> <mrow> <msub> <mrow> <mi>n</mi> </mrow> <mrow> <mi>s</mi> <mi>c</mi> </mrow> </msub> <mo>=</mo> <mn>40</mn> </mrow> </semantics></math>, pink) in the melt state. (<b>B</b>) WAXS curves plotted using the same color code as in panel A. For simplicity, the (032) peak indicates a superposition of overlapping <math display="inline"><semantics> <mrow> <mfenced separators="|"> <mrow> <mn>13</mn> <mover accent="true"> <mrow> <mn>2</mn> </mrow> <mo>¯</mo> </mover> </mrow> </mfenced> <mo>,</mo> <mo> </mo> <mfenced separators="|"> <mrow> <mn>112</mn> </mrow> </mfenced> <mo>,</mo> <mo> </mo> <mfenced separators="|"> <mrow> <mn>21</mn> <mover accent="true"> <mrow> <mn>2</mn> </mrow> <mo>¯</mo> </mover> </mrow> </mfenced> <mo>,</mo> <mfenced separators="|"> <mrow> <mn>12</mn> <mover accent="true"> <mrow> <mn>4</mn> </mrow> <mo>¯</mo> </mover> </mrow> </mfenced> <mo>,</mo> <mo> </mo> <mfenced separators="|"> <mrow> <mn>20</mn> <mover accent="true"> <mrow> <mn>4</mn> </mrow> <mo>¯</mo> </mover> </mrow> </mfenced> <mo>,</mo> </mrow> </semantics></math> and (004) reflections.</p>
Full article ">Figure 2
<p>(<b>A</b>) Selected SAXS curves recorded during cooling from 80 °C to −40 °C at a rate of 12 K/min for sample PGX_2k_400; inset: bottlebrush peaks of the corresponding curves after background subtraction. (<b>B</b>) Corresponding WAXS curves with the temperature color code identical for panels A and B. (<b>C</b>) Evolution of WAXS crystallinity and amplitude of the bottlebrush peak during the cooling ramp. (<b>D</b>) Correlation of the amplitude of the bottlebrush peak and crystallinity for the cooling ramp (blue symbols) and for the subsequent heating ramp to 80 °C at the same rate (red symbols).</p>
Full article ">Figure 3
<p>(<b>A</b>) Selected SAXS curves recorded during isothermal melt crystallization of sample PGX_950_200 at 24 °C; the time scale is given in color code. (<b>B</b>) Corresponding WAXS curves with the same color code. (<b>C</b>) Time evolution of the WAXS crystallinity index, amplitude of the bottlebrush peak, and SAXS invariant. (<b>D</b>) Dependence of d<sub>1</sub>-amplitude on the WAXS crystallinity index.</p>
Full article ">Figure 4
<p>Schematics of the backbone and side-chain arrangement in the molten and semicrystalline states of brush elastomers with <math display="inline"><semantics> <mrow> <msub> <mrow> <mi>n</mi> </mrow> <mrow> <mi>s</mi> <mi>c</mi> </mrow> </msub> </mrow> </semantics></math> = 40 (<b>A</b>) and <math display="inline"><semantics> <mrow> <msub> <mrow> <mi>n</mi> </mrow> <mrow> <mi>s</mi> <mi>c</mi> </mrow> </msub> </mrow> </semantics></math> = 19 (<b>B</b>).</p>
Full article ">Scheme 1
<p>Synthesis of the BB elastomers from a PEO macromonomer using either a PEO crosslinker with Mn~6000 or a PBA-based crosslinker.</p>
Full article ">
11 pages, 3447 KiB  
Article
Flat-Silk-Cocoon-Based Wearable Flexible Piezoresistive Sensor and Its Performance
by Zulan Liu, Mengyao Cai, Rui Jia, Xiang Xu, Mengting Xu, Guotao Cheng, Lan Cheng and Fangyin Dai
Polymers 2024, 16(2), 295; https://doi.org/10.3390/polym16020295 - 22 Jan 2024
Cited by 2 | Viewed by 1191
Abstract
Flexible sensors are becoming the focus of research because they are very vital for intelligent products, real-time data monitoring, and recording. The flat silk cocoon (FSC), as a special form of cocoon, has all the advantages of silk, which is an excellent biomass [...] Read more.
Flexible sensors are becoming the focus of research because they are very vital for intelligent products, real-time data monitoring, and recording. The flat silk cocoon (FSC), as a special form of cocoon, has all the advantages of silk, which is an excellent biomass carbon-based material and a good choice for preparing flexible sensors. In this work, a flexible piezoresistive sensor was successfully prepared by encapsulating carbonized flat silk cocoons (CFSCs) using an elastic matrix polydimethylsiloxane (PDMS). The sensing performance of the material is 0.01 kPa−1, and the monitoring range can reach 680.57 kPa. It is proved that the sensor can detect human motion and has excellent durability (>800 cycles). In addition, a sensor array for a keyboard based on CFSCs was explored. The sensor has a low production cost and a simple preparation process, and it is sustainable and environmentally friendly. Thus, it may have potential applications in wearable devices and human–computer interactions. Full article
(This article belongs to the Special Issue Smart Polymeric Materials for Soft Electronics)
Show Figures

Figure 1

Figure 1
<p>The fabrication scheme of flexible piezoresistive sensor.</p>
Full article ">Figure 2
<p>(<b>a</b>) Photographs of different forms of FSCs before and after carbonization; (<b>b</b>) photograph of a multilayer FSC and CFSC carbonized at 1000 °C; (<b>c</b>) SEM images of pristine FSC and CFSCs under different carbonization temperatures.</p>
Full article ">Figure 3
<p>(<b>a</b>) The ATR-IR spectra of FSC and CFSCs under different carbonization temperatures; (<b>b</b>) Raman spectra of FSC and CFSCs under different carbonization temperatures; (<b>c</b>) XPS survey spectra of FSC and CFSCs under different carbonization temperatures; (<b>d</b>–<b>h</b>) high-resolution C 1s profiles of FSC and CFSCs under different carbonization temperatures: (<b>d</b>) FSC; (<b>e</b>) CFSC-800 °C; (<b>f</b>) CFSC-900 °C; (<b>g</b>) CFSC-1000 °C; (<b>h</b>) CFSC-1000 °C twice.</p>
Full article ">Figure 4
<p>(<b>a</b>–<b>c</b>) Bending and torsion of flexible piezoresistive sensors; (<b>d</b>) the sensitivity of CFSC under different carbonization temperatures; (<b>e</b>) the I-t curves of the sensor using CFSC-1000 °C under serial pressures; (<b>f</b>) the excellent stability of the sensor after 800 pressure cycling tests under 40 kPa; (<b>g</b>–<b>i</b>) the signal responses from human movement: (<b>g</b>) finger pressing; (<b>h</b>) finger bending; (<b>i</b>) wrist bending.</p>
Full article ">Figure 5
<p>(<b>a</b>) A 4 × 4 sensor array and D–C–B–F–J–K–L–H sequential pressure load run diagram; (<b>b</b>) signal response of the sensor array during a continuous sequence of pressure loads following the D–C–B–F–J–K–L–H pattern; (<b>c</b>–<b>e</b>) relative current change intensity obtained by the sensor array at different positions; (<b>f</b>) response current when different pressure loads are applied to point D.</p>
Full article ">Figure 6
<p>(<b>a</b>) Porosity analysis of the FSC and CFSCs under different carbonization temperatures according to SEM images; (<b>b</b>) the porosity of FSC and CFSCs under different carbonization temperatures; (<b>c</b>) schematic diagram of the electrical signal test system; (<b>d</b>) schematic model of the piezoresistive mechanism of CFSC-based multilayer pressure sensors.</p>
Full article ">
34 pages, 8372 KiB  
Review
Biopolymeric Nanocomposites for Wastewater Remediation: An Overview on Recent Progress and Challenges
by Annu, Mona Mittal, Smriti Tripathi and Dong Kil Shin
Polymers 2024, 16(2), 294; https://doi.org/10.3390/polym16020294 - 21 Jan 2024
Cited by 5 | Viewed by 3356
Abstract
Essential for human development, water is increasingly polluted by diverse anthropogenic activities, containing contaminants like organic dyes, acids, antibiotics, inorganic salts, and heavy metals. Conventional methods fall short, prompting the exploration of advanced, cost-effective remediation. Recent research focuses on sustainable adsorption, with nano-modifications [...] Read more.
Essential for human development, water is increasingly polluted by diverse anthropogenic activities, containing contaminants like organic dyes, acids, antibiotics, inorganic salts, and heavy metals. Conventional methods fall short, prompting the exploration of advanced, cost-effective remediation. Recent research focuses on sustainable adsorption, with nano-modifications enhancing adsorbent efficacy against persistent waterborne pollutants. This review delves into recent advancements (2020–2023) in sustainable biopolymeric nanocomposites, spotlighting the applications of biopolymers like chitosan in wastewater remediation, particularly as adsorbents and filtration membranes along with their mechanism. The advantages and drawbacks of various biopolymers have also been discussed along with their modification in synthesizing biopolymeric nanocomposites by combining the benefits of biodegradable polymers and nanomaterials for enhanced physiochemical and mechanical properties for their application in wastewater treatment. The important functions of biopolymeric nanocomposites by adsorbing, removing, and selectively targeting contaminants, contributing to the purification and sustainable management of water resources, have also been elaborated on. Furthermore, it outlines the reusability and current challenges for the further exploration of biopolymers in this burgeoning field for environmental applications. Full article
Show Figures

Figure 1

Figure 1
<p>General illustration of polluted water and technologies available. (<b>A</b>) Global scarcity of water and pollution caused by (<b>B</b>) different pollutants, and (<b>C</b>) different stages of technologies for wastewater treatment [<a href="#B39-polymers-16-00294" class="html-bibr">39</a>].</p>
Full article ">Figure 2
<p>Representation of various synthesis methods of polymer nanocomposites.</p>
Full article ">Figure 3
<p>Properties of biopolymeric nanocomposites.</p>
Full article ">Figure 4
<p>A schematic representing the capability of different membranes for treating wastewater [<a href="#B145-polymers-16-00294" class="html-bibr">145</a>].</p>
Full article ">Figure 5
<p>Schematic representation of conventional treatment of contaminated water with adsorption (<b>left</b>) and with ultrafiltration membranes (<b>right</b>) by using iron oxyhydroxide chitosan beads (IICBs) as the biopolymeric-chitosan-based bionanocomposite [<a href="#B153-polymers-16-00294" class="html-bibr">153</a>].</p>
Full article ">Figure 6
<p>Schematic representation of oil–water separation by using alginate-GO-based nanocomposite membranes [<a href="#B154-polymers-16-00294" class="html-bibr">154</a>].</p>
Full article ">Figure 7
<p>Mechanistic approach of membrane separation and rejection [<a href="#B58-polymers-16-00294" class="html-bibr">58</a>] of inorganic salt, heavy metal ions, and organic dyes [<a href="#B155-polymers-16-00294" class="html-bibr">155</a>].</p>
Full article ">Figure 8
<p>Pictorial representation of a thin-film composite nanofiltration membrane composed of chitosan hydrogel covalent organic framework interlayered with tannic acid-Fe<sup>3+</sup> to remove norfloxacin, ciprofloxacin, and ofloxacin antibiotics from water [<a href="#B156-polymers-16-00294" class="html-bibr">156</a>].</p>
Full article ">Figure 9
<p>Schematic illustration of formation of low-molecular-weight chitosan (LMWCS)-Cu/Al with nitrogen-doped carbon microspheres, with hydrothermal method, as an excellent high-performance adsorbent for oxytetracycline antibiotic removal [<a href="#B177-polymers-16-00294" class="html-bibr">177</a>].</p>
Full article ">Figure 10
<p>Schematic illustration of the preparation of semi-carbonized plant fiber (Spf) and chemical fiber (Scf) using dodecyl dimethyl betaine (BS) and chitosan (CS) as modifiers to enhance Sfs. Sodium alginate (SA) served as the composite modifier to further modify BS-Sf and CS-Sf (dodecyl dimethyl betaine and chitosan-modified semi-carbonized fibers), resulting in the preparation of BS/SA-Sf and CS/SA-Sf (sodium-alginate-composite-modified BS-Sf and CS-Sf) to remove Zn(II), Pb(II), and Cd(II) heavy metal ions from polluted water [<a href="#B178-polymers-16-00294" class="html-bibr">178</a>].</p>
Full article ">Figure 11
<p>Schematic illustration of mechanism of removal of As (III) by using binary-doped Fe-Mn with chitosan-GO granular adsorbent [<a href="#B179-polymers-16-00294" class="html-bibr">179</a>].</p>
Full article ">Figure 12
<p>Schematic illustration of silica-doped chitosan with zeolite imidazolate framework (ZIF-8) composite microsphere for Pb<sup>2+</sup> and Cu<sup>2+</sup> heavy metal ion removal with significant antibacterial activity [<a href="#B183-polymers-16-00294" class="html-bibr">183</a>].</p>
Full article ">Figure 13
<p>Reusability of biopolymeric nanocomposites: (<b>a</b>) chitosan-Fe<sub>3</sub>O<sub>4</sub> nanocomposite for photocatalytic ability and (<b>b</b>) photodegradation of methylene blue dye for 120 min UV irradiation [<a href="#B203-polymers-16-00294" class="html-bibr">203</a>], and chitosan-based ternary nanocomposite with TiO<sub>2</sub> and Ag nanoparticles on cellulose fabric (<b>c</b>) for removal of Cu (II) ions and (<b>d</b>) for photodegradation of methyl orange and methylene blue dye [<a href="#B204-polymers-16-00294" class="html-bibr">204</a>].</p>
Full article ">
12 pages, 2830 KiB  
Article
Differences in the Residual Behavior of a Bumetrizole-Type Ultraviolet Light Absorber during the Degradation of Various Polymers
by Hisayuki Nakatani, Taishi Uchiyama, Suguru Motokucho, Anh Thi Ngoc Dao, Hee-Jin Kim, Mitsuharu Yagi and Yusaku Kyozuka
Polymers 2024, 16(2), 293; https://doi.org/10.3390/polym16020293 - 21 Jan 2024
Cited by 1 | Viewed by 1186
Abstract
The alteration of an ultraviolet light absorber (UVA: UV-326) in polymers (PP, HDPE, LDPE, PLA, and PS) over time during degradation was studied using an enhanced degradation method (EDM) involving sulfate ion radicals in seawater. The EDM was employed to homogeneously degrade the [...] Read more.
The alteration of an ultraviolet light absorber (UVA: UV-326) in polymers (PP, HDPE, LDPE, PLA, and PS) over time during degradation was studied using an enhanced degradation method (EDM) involving sulfate ion radicals in seawater. The EDM was employed to homogeneously degrade the entire polymer samples containing the UVA. The PP and PS samples containing 5-phr (phr: per hundred resin) UVA films underwent rapid whitening, characterized by the formation of numerous grooves or crushed particles. Notably, the UVA loss rate in PS, with the higher glass transition temperature (Tg), was considerably slower. The behavior of crystalline polymers, with the exception of PS, was analogous in terms of the change in UVA loss rate over the course of degradation. The significant increase in the initial loss rate observed during EDM degradation was due to microplasticization. A similar increase in microplasticization rate occurred with PS; however, the intermolecular interaction between UVA and PS did not result in as pronounced an increase in loss rate as observed in other polymers. Importantly, the chemical structure of UVA remained unaltered during EDM degradation. These findings revealed that the primary cause of UVA loss was leaching from the polymer matrix. Full article
(This article belongs to the Special Issue Degradation and Recycling of Polymer Materials)
Show Figures

Graphical abstract

Graphical abstract
Full article ">Figure 1
<p>Schematic scheme of simultaneous and uniform degradation progression in polymer matrix using EDM.</p>
Full article ">Figure 2
<p>Color change of PP containing 5-phr UVA film using sulfate ion radicals in pure water and in seawater (EDM).</p>
Full article ">Figure 3
<p>Color change of PS containing 5-phr UVA film using sulfate ion radicals in pure water and in seawater (EDM).</p>
Full article ">Figure 4
<p>Degradation time dependence of UVA residual amount in various polymer samples using sulfate ion radical in seawater (EDM).</p>
Full article ">Figure 5
<p>Degradation time dependence of UVA loss rates in various polymer samples using sulfate ion radical in seawater (EDM).</p>
Full article ">Figure 6
<p>Schematical of UVA (UV-326) destabilization by autoxidation.</p>
Full article ">Figure 7
<p>FTIR spectra of 0 and 15 days degraded PP samples by EDM at around hydroperoxide group.</p>
Full article ">Figure 8
<p>Degradation time dependence of carbonyl index (CI) in PP sample degraded by EDM.</p>
Full article ">
16 pages, 7428 KiB  
Article
Durable Surface Modification of Low-Density Polyethylene/Nano-Silica Composite Films with Bacterial Antifouling and Liquid-Repelling Properties for Food Hygiene and Safety
by Sang Ha Song, Michael Bae and Jun Kyun Oh
Polymers 2024, 16(2), 292; https://doi.org/10.3390/polym16020292 - 21 Jan 2024
Viewed by 1468
Abstract
The growing prevalence of antimicrobial resistance in bacterial strains has increased the demand for preventing biological deterioration on the surfaces of films used in applications involving food contact materials (FCMs). Herein, we prepared superhydrophobic film surfaces using a casting process that involved the [...] Read more.
The growing prevalence of antimicrobial resistance in bacterial strains has increased the demand for preventing biological deterioration on the surfaces of films used in applications involving food contact materials (FCMs). Herein, we prepared superhydrophobic film surfaces using a casting process that involved the combination of low-density polyethylene (LDPE) with solutions containing surface energy-reducing silica (SRS). The bacterial antifouling properties of the modified film surfaces were evaluated using Escherichia coli O157:H7 and Staphylococcus epidermidis via the dip-inoculation technique. The reduction in bacterial populations on the LDPE film embedded with SRS was confirmed to be more than 2 log-units, which equates to over 99%, when compared to the bare LDPE film. Additionally, the modified film demonstrated liquid-repelling properties against food-related contaminants, such as blood, beverages, and sauces. Moreover, the modified film demonstrated enhanced durability and robustness compared to one of the prevalent industry methods, dip-coating. We anticipate that the developed LDPE/nano-silica composite film represents a promising advancement in the multidisciplinary aspects of food hygiene and safety within the food industry, particularly concerning FCMs. Full article
(This article belongs to the Special Issue Advances in Functional Polymer Coatings and Surfaces)
Show Figures

Figure 1

Figure 1
<p>Schematic representation of (<b>a</b>) SRS preparation and (<b>b</b>) SRS-embedded LDPE film fabrication.</p>
Full article ">Figure 2
<p>SEM micrographs of (<b>a</b>) top view of bare LDPE film, (<b>b</b>) cross-sectional view of bare LDPE film, (<b>c</b>) top view of SRS-embedded LDPE film, and (<b>d</b>) cross-sectional view of SRS-embedded LDPE film. All images were captured at a magnification of ×10,000, and insert images were captured at a magnification of ×30,000.</p>
Full article ">Figure 3
<p>AFM micrographs of (<b>a</b>,<b>b</b>) bare LDPE films and (<b>c</b>,<b>d</b>) SRS-embedded LDPE films.</p>
Full article ">Figure 4
<p>(<b>a</b>) FTIR spectra of bare LDPE film (red line) and SRS-embedded LDPE film (black line). (<b>b</b>) The water contact angles from the bare LDPE films, SRS-coated LDPE films, and SRS-embedded LDPE films, along with their respective micrographs.</p>
Full article ">Figure 5
<p>Results of bacterial antifouling tests of bare LDPE films and SRS-embedded LDPE films against (<b>a</b>) <span class="html-italic">E. coli</span> O157:H7 and (<b>b</b>) <span class="html-italic">S. epidermidis</span>. Statistical significance is indicated by an asterisk, with <span class="html-italic">p</span> &lt; 0.05.</p>
Full article ">Figure 6
<p>Liquid-repelling properties of (<b>a</b>–<b>c</b>) bare LDPE films and (<b>d</b>–<b>f</b>) SRS-embedded LDPE films. The tilting angle of each film was 3.5°. Sheep blood, milk, and coffee were used as food-related contaminants. The red arrows denote the direction of transport for the contaminants.</p>
Full article ">Figure 7
<p>Self-cleaning ability of bare LDPE films and SRS-embedded LDPE films against high-viscosity contaminants, (<b>a</b>–<b>d</b>) ketchup and (<b>e</b>–<b>h</b>) mustard.</p>
Full article ">Figure 8
<p>The water contact angles of SRS-coated LDPE films (black line) and SRS-embedded LDPE films (red line) measured under ultrasonication for up to 60 min.</p>
Full article ">Figure 9
<p>(<b>a</b>) Schematic illustration of surface abrasion resistance test conducted using sandpaper, and (<b>b</b>) the water contact angles of SRS-coated LDPE films and SRS-embedded LDPE films before and after abrasion.</p>
Full article ">Figure 10
<p>Chemical leaching test in (<b>a</b>) DI water and (<b>b</b>) 2% hydrogen peroxide solution for durations of 1 day (red line), 1 week (blue line), and 2 weeks (green line) with a detection limit as low as 1 ppm. The black line represents the silane compound terminated with fluorine.</p>
Full article ">
12 pages, 2351 KiB  
Article
Statistical Analysis of the Role of Cavity Flexibility in Thermostability of Proteins
by So Yeon Hong, Jihyun Yoon, Young Joo An, Siseon Lee, Haeng-Geun Cha, Ashutosh Pandey, Young Je Yoo and Jeong Chan Joo
Polymers 2024, 16(2), 291; https://doi.org/10.3390/polym16020291 - 21 Jan 2024
Viewed by 1363
Abstract
Conventional statistical investigations have primarily focused on the comparison of the simple one-dimensional characteristics of protein cavities, such as number, surface area, and volume. These studies have failed to discern the crucial distinctions in cavity properties between thermophilic and mesophilic proteins that contribute [...] Read more.
Conventional statistical investigations have primarily focused on the comparison of the simple one-dimensional characteristics of protein cavities, such as number, surface area, and volume. These studies have failed to discern the crucial distinctions in cavity properties between thermophilic and mesophilic proteins that contribute to protein thermostability. In this study, the significance of cavity properties, i.e., flexibility and location, in protein thermostability was investigated by comparing structural differences between homologous thermophilic and mesophilic proteins. Three dimensions of protein structure were categorized into three regions (core, boundary, and surface) and a comparative analysis of cavity properties using this structural index was conducted. The statistical analysis revealed that cavity flexibility is closely related to protein thermostability. The core cavities of thermophilic proteins were less flexible than those of mesophilic proteins (averaged B’ factor values, −0.6484 and −0.5111), which might be less deleterious to protein thermostability. Thermophilic proteins exhibited fewer cavities in the boundary and surface regions. Notably, cavities in mesophilic proteins, across all regions, exhibited greater flexibility than those in thermophilic proteins (>95% probability). The increased flexibility of cavities in the boundary and surface regions of mesophilic proteins, as opposed to thermophilic proteins, may compromise stability. Recent protein engineering investigations involving mesophilic xylanase and protease showed results consistent with the findings of this study, suggesting that the manipulation of flexible cavities in the surface region can enhance thermostability. Consequently, our findings suggest that a rational or computational approach to the design of flexible cavities in surface or boundary regions could serve as an effective strategy to enhance the thermostability of mesophilic proteins. Full article
Show Figures

Figure 1

Figure 1
<p>Scheme of statistical analysis of cavity properties in this study.</p>
Full article ">Figure 2
<p>Simplified scheme for cavity location in the three-dimensional structure. Cavities in surface (1), boundary (2), and core (3) are shown in red, blue, and yellow, respectively. The blue cavity is positioned along all three areas.</p>
Full article ">Figure 3
<p>Comparison of cavity number and volume in thermophilic and mesophilic proteins. (<b>a</b>) Distribution of cavity number according to the protein size. (<b>b</b>) Distribution of cavity volume.</p>
Full article ">Figure 4
<p>Averaged B′ factor of core cavities of thermophilic and mesophilic proteins. The open circle indicates the normalized B factor of all amino acids of 40 proteins. T and M indicate averaged B′ factor of core cavities of thermophilic and mesophilic proteins (−0.6484 and −0.5111), respectively.</p>
Full article ">
13 pages, 3358 KiB  
Article
Structure-Based Evaluation of Hybrid Lipid–Polymer Nanoparticles: The Role of the Polymeric Guest
by Maria Chountoulesi, Natassa Pippa, Aleksander Forys, Barbara Trzebicka and Stergios Pispas
Polymers 2024, 16(2), 290; https://doi.org/10.3390/polym16020290 - 20 Jan 2024
Cited by 1 | Viewed by 1486
Abstract
The combination of phospholipids and block-copolymers yields advanced hybrid nanoparticles through the self-assembly process in an aqueous environment. The physicochemical features of the lipid/polymer components, like the lipid–polymer molar ratio, the macromolecular architecture of the block copolymer, the main transition temperature of the [...] Read more.
The combination of phospholipids and block-copolymers yields advanced hybrid nanoparticles through the self-assembly process in an aqueous environment. The physicochemical features of the lipid/polymer components, like the lipid–polymer molar ratio, the macromolecular architecture of the block copolymer, the main transition temperature of the phospholipid, as well as the formulation and preparation protocol parameters, are some of the most crucial parameters for the formation of hybrid lipid/polymer vesicles and for the differentiation of their morphology. The morphology, along with other physicochemical nanoparticle characteristics are strictly correlated with the nanoparticle’s later biological behavior after being administered, affecting interactions with cells, biodistribution, uptake, toxicity, drug release, etc. In the present study, a structural evaluation of hybrid lipid–polymer nanoparticles based on cryo-TEM studies was undertaken. Different kinds of hybrid lipid–polymer nanoparticles were designed and developed using phospholipids and block copolymers with different preparation protocols. The structures obtained ranged from spherical vesicles to rod-shaped structures, worm-like micelles, and irregular morphologies. The obtained morphologies were correlated with the formulation and preparation parameters and especially the type of lipid, the polymeric guest, and their ratio. Full article
(This article belongs to the Special Issue Polymers in Pharmaceutical Technology II)
Show Figures

Figure 1

Figure 1
<p>The chemical structures of (<b>a</b>) POEGA-PLA and (<b>b</b>) PLMA-b-PDMAEMA.</p>
Full article ">Figure 2
<p>Cryo-TEM images of (<b>a</b>) DPPC:POEGMA-PLA (9:0.2 weight ratio) and (<b>b</b>) HSPC:POEGMA-PLA (9:0.2 weight ratio) polymer–lipid hybrid nanoparticles. The images for all systems were taken at the same point in time, immediately after preparation for comparison reasons.</p>
Full article ">Figure 3
<p>Histograms of (<b>a</b>) DPPC:POEGMA-PLA 9:0.2 and (<b>b</b>) HSPC:POEGMA-PLA 9:0.2 polymer–lipid hybrid nanoparticles.</p>
Full article ">Figure 4
<p>Cryo-TEM images of DSPC:DAP:PLMA-b-PDMAEMA polymer–lipid hybrid nanoparticles: (<b>a</b>) 1:0.7:0.03 and (<b>b</b>) 1:1:0.03 wt ratios. The images for all systems were taken at the same point in time, immediately after preparation for comparison reasons.</p>
Full article ">Figure 5
<p>Histograms of DSPC:DAP:PLMA-b-PDMAEMA polymer–lipid hybrid nanoparticles: (<b>a</b>) 1:0.7:0.03 and (<b>b</b>) 1:1:0.03 wt ratios.</p>
Full article ">Figure 6
<p>Cryo-TEM images of (<b>a</b>) DMPC:PDMAEMA-b-PLMA 95:5 and (<b>b</b>) DPPC:PDMAEMA-b-PLMA 95:5 polymer–lipid hybrid nanoparticles. The images for all systems were taken at the same point in time, immediately after preparation for comparison reasons.</p>
Full article ">Figure 7
<p>Histograms of (<b>a</b>) DMPC:PDMAEMA-b-PLMA 95:5 and (<b>b</b>) DPPC:PDMAEMA-b-PLMA 95:5 polymer–lipid hybrid nanoparticles.</p>
Full article ">Figure 8
<p>Cryo-TEM images of DDA:TDB:PLMA-b-PDMAEMA polymer–lipid hybrid nanoparticles at (<b>a</b>) 1:0.2:1 and (<b>b</b>,<b>c</b>) 1:0.2:2.5 wt ratios. The images for all systems were taken at the same point in time, immediately after preparation for comparison reasons.</p>
Full article ">
14 pages, 8788 KiB  
Article
Evaluation of Starch–Garlic Husk Polymeric Composites through Mechanical, Thermal, and Thermo-Mechanical Tests
by Cynthia Graciela Flores-Hernández, Juventino López-Barroso, Beatriz Adriana Salazar-Cruz, Verónica Saucedo-Rivalcoba, Armando Almendarez-Camarillo and José Luis Rivera-Armenta
Polymers 2024, 16(2), 289; https://doi.org/10.3390/polym16020289 - 20 Jan 2024
Viewed by 1274
Abstract
The present work evaluates the influence of different properties of composite materials from natural sources. Films were prepared using the evaporative casting technique from corn starch reinforced with a waste material such as garlic husk (GH), using glycerin as a plasticizer. The results [...] Read more.
The present work evaluates the influence of different properties of composite materials from natural sources. Films were prepared using the evaporative casting technique from corn starch reinforced with a waste material such as garlic husk (GH), using glycerin as a plasticizer. The results of the syntheses carried out demonstrated the synergy between these materials. In the morphological analysis, the compatibility and adequate dispersion of the reinforcer in the matrix were confirmed. Using Fourier transform infrared spectroscopy (FTIR), the interaction and formation of bonds between the matrix and the reinforcer were confirmed by the presence of some signals such as S-S and C-S. Similarly, thermogravimetric analysis (TGA) revealed that even at low concentrations, GH can slightly increase the decomposition temperature. Finally, from the results of dynamic mechanical analysis (DMA), it was possible to identify that the storage modulus increases significantly, up to 115%, compared to pure starch, especially at low concentrations of the reinforcer. Full article
(This article belongs to the Special Issue Lignocellulosic Polymer Composites)
Show Figures

Figure 1

Figure 1
<p>Physical appearance of starch–garlic husk composites. (<b>A</b>) Starch, (<b>B</b>) SG02, (<b>C</b>) SG04, (<b>D</b>) SG06, (<b>E</b>) SG08, and (<b>F</b>) SG10.</p>
Full article ">Figure 2
<p>SEM micrographs of starch–garlic husk composites. (<b>a</b>) Starch, (<b>b</b>) SG02, (<b>c</b>) SG06, and (<b>d</b>) SG10.</p>
Full article ">Figure 3
<p>FTIR spectra for starch–garlic husk composites, with 2–10 wt% of particles.</p>
Full article ">Figure 4
<p>TGA thermograms for starch–garlic husk composites, with 2–10 wt % of particles.</p>
Full article ">Figure 5
<p>DTG thermograms for starch–GH composites, with 2–10 wt % of particles.</p>
Full article ">Figure 6
<p>DMA thermogram of storage modulus starch–GH composites, with 2–10 wt % of particles.</p>
Full article ">Figure 7
<p>DMA thermogram of Tan δ starch–GH composites, with 2–10 wt % of particles.</p>
Full article ">Figure 8
<p>Stress–strain curves for starch–GH composites, with 2–10 wt % of particles.</p>
Full article ">
22 pages, 16713 KiB  
Article
Electrically Conductive Natural Rubber Composite Films Reinforced with Graphite Platelets
by Veerapat Kitsawat, Saranrat Siri and Muenduen Phisalaphong
Polymers 2024, 16(2), 288; https://doi.org/10.3390/polym16020288 - 20 Jan 2024
Viewed by 1786
Abstract
Green natural rubber (NR) composites reinforced with synthetic graphite platelets, using alginate as a thickening and dispersing agent, were successfully developed to improve mechanical properties, chemical resistance, and electrical conductivity. The fabrication was performed using a latex aqueous microdispersion process. The research demonstrated [...] Read more.
Green natural rubber (NR) composites reinforced with synthetic graphite platelets, using alginate as a thickening and dispersing agent, were successfully developed to improve mechanical properties, chemical resistance, and electrical conductivity. The fabrication was performed using a latex aqueous microdispersion process. The research demonstrated the effective incorporation of graphite platelets into the NR matrix up to 60 parts per hundred rubbers (phr) without causing agglomeration or phase separation. Graphite incorporation significantly improved the mechanical strength of the composite films. NR with 60 phr of graphite exhibited the highest Young’s modulus of 12.3 MPa, roughly 100 times that of the neat NR film. The reinforcement also strongly improved the hydrophilicity of the composite films, resulting in a higher initial water absorption rate compared to the neat NR film. Moreover, the incorporation of graphite significantly improved the chemical resistance of the composite films against nonpolar solvents, such as toluene. The composite films exhibited biodegradability at about 21% to 30% after 90 days in soil. The electrical conductivity of the composite films was considerably enhanced up to 2.18 × 10⁻⁴ S/cm at a graphite loading of 60 phr. According to the improved properties, the developed composites have potential applications in electronic substrates. Full article
(This article belongs to the Special Issue Advances in Functional Rubber and Elastomer Composites II)
Show Figures

Figure 1

Figure 1
<p>The illustrative schematic diagram for the fabrication of NR-G-ALG composite films.</p>
Full article ">Figure 2
<p>FTIR spectra of NR, G, NR-ALG, and NR-G-ALG composite films.</p>
Full article ">Figure 3
<p>FE-SEM images of graphite (G) platelets.</p>
Full article ">Figure 4
<p>FE-SEM images of the surface morphologies and cross-sections of NR and NR-G-ALG at various loadings of 20 to 60 phr.</p>
Full article ">Figure 5
<p>XRD diffractograms of (<b>a</b>) G (<b>b</b>) NR, NR-ALG, and NR-G-ALG composite films.</p>
Full article ">Figure 6
<p>Mechanical properties of NR and NR-G-ALG composite films: (<b>a</b>) tensile strength, (<b>b</b>) Young’s modulus, and (<b>c</b>) elongation at break.</p>
Full article ">Figure 7
<p>TGA curves of the NR, G, NR-ALG, and NR-G-ALG composite films.</p>
Full article ">Figure 8
<p>DSC curves of the NR, G, NR-ALG, and NR-G-ALG composite films.</p>
Full article ">Figure 9
<p>The water absorption capacity results of the NR and NR-G-ALG composite films.</p>
Full article ">Figure 10
<p>The toluene uptake results of the NR and NR-G-ALG composite films.</p>
Full article ">Figure 11
<p>Biodegradation test results of the NR and NR-G-ALG composite films.</p>
Full article ">Figure 12
<p>The visual analysis of biodegradation test of NR and NR-G-ALG composite films for the duration of 90 days.</p>
Full article ">Figure 13
<p>Nyquist plots of NR and NR-G-ALG across a frequency range of 10<sup>5</sup> Hz to 1 Hz, exhibited within various impedance ranges: (<b>a</b>) NR, (<b>b</b>) NR-G10-ALG and NR-G-20-ALG, (<b>c</b>) NR-G30-ALG, and (<b>d</b>) NR-G40-ALG, NR-G50-ALG, and (<b>e</b>) NR-G60-ALG.</p>
Full article ">Figure 14
<p>The Bode plot depicts the impedance magnitude of NR and NR-G-ALG with G loading ranging from 10 to 60 phr over a frequency range of 10<sup>5</sup> Hz to 1 Hz.</p>
Full article ">Figure 15
<p>The relationship between log (electrical conductivity) and G loading, highlighting the percolation threshold within the graphite loading range of 30 to 40 phr.</p>
Full article ">Figure 16
<p>The cyclic voltammetry (CV) measurement of NR and NR-G-ALG, taken at a scan rate of 0.1 V/s, displays the graph representing the 2<sup>nd</sup> cycle (<b>a</b>) at G loading above percolation threshold and (<b>b</b>) at G loading below percolation threshold.</p>
Full article ">
19 pages, 10372 KiB  
Article
Polysaccharide Composite Alginate–Pectin Hydrogels as a Basis for Developing Wound Healing Materials
by Galina A. Davydova, Leonid L. Chaikov, Nikolay N. Melnik, Radmir V. Gainutdinov, Irina I. Selezneva, Elena V. Perevedentseva, Muhriddin T. Mahamadiev, Vadim A. Proskurin, Daniel S. Yakovsky, Aurel George Mohan and Julietta V. Rau
Polymers 2024, 16(2), 287; https://doi.org/10.3390/polym16020287 - 20 Jan 2024
Cited by 2 | Viewed by 1572
Abstract
This article presents materials that highlight the bioengineering potential of polymeric systems of natural origin based on biodegradable polysaccharides, with applications in creating modern products for localized wound healing. Exploring the unique biological and physicochemical properties of polysaccharides offers a promising avenue for [...] Read more.
This article presents materials that highlight the bioengineering potential of polymeric systems of natural origin based on biodegradable polysaccharides, with applications in creating modern products for localized wound healing. Exploring the unique biological and physicochemical properties of polysaccharides offers a promising avenue for the atraumatic, controlled restoration of damaged tissues in extensive wounds. The study focused on alginate, pectin, and a hydrogel composed of their mixture in a 1:1 ratio. Atomic force microscopy data revealed that the two-component gel exhibits greater cohesion and is characterized by the presence of filament-like elements. The dynamic light scattering method indicated that this structural change results in a reduction in the damping of acoustic modes in the gel mixture compared to the component gels. Raman spectroscopy research on these gels revealed the emergence of new bonds between the components’ molecules, contributing to the observed effects. The biocompatibility of the gels was evaluated using dental pulp stem cells, demonstrating that all the gels exhibit biocompatibility. Full article
(This article belongs to the Special Issue Advanced Polymers for Medical Applications)
Show Figures

Figure 1

Figure 1
<p>AFM images of dried gel samples on mica substrate. (<b>a</b>–<b>c</b>): scale 2 × 2 μm<sup>2</sup>; (<b>d</b>–<b>f</b>): 500 × 500 nm<sup>2</sup>; (<b>a</b>,<b>d</b>): alginate; (<b>b</b>,<b>e</b>): pectin; (<b>c</b>,<b>f</b>): 1:1 mixture.</p>
Full article ">Figure 1 Cont.
<p>AFM images of dried gel samples on mica substrate. (<b>a</b>–<b>c</b>): scale 2 × 2 μm<sup>2</sup>; (<b>d</b>–<b>f</b>): 500 × 500 nm<sup>2</sup>; (<b>a</b>,<b>d</b>): alginate; (<b>b</b>,<b>e</b>): pectin; (<b>c</b>,<b>f</b>): 1:1 mixture.</p>
Full article ">Figure 2
<p>Correlation functions of light intensity scattered in pectin hydrogel (concentration 2% by mass) at angles: (<b>a</b>) at 45°, the curve is result of fitting by exponent to clearly show the presence of cosine component; (<b>b</b>,<b>c</b>) at 60° and 120°, respectively, curves are result of fitting by the Formula (1).</p>
Full article ">Figure 3
<p>Correlation functions of light intensity scattered in alginate hydrogel (concentration 2% by mass) at angles: (<b>a</b>) at 45°; (<b>b</b>) at 120°, respectively, curves are result of fitting by the Formula (1).</p>
Full article ">Figure 4
<p>Correlation functions of light intensity scattered in the hydrogel of a 1:1 mixture of alginate and pectin (mixture concentration 2% by mass) at angles: (<b>a</b>) at 45°, the curve is fit by exponent for clarity of the cosine component presence; (<b>b</b>) at 120°, fit using Formula (1).</p>
Full article ">Figure 5
<p>(<b>a</b>): RS spectra of hydrogels of alginate, pectin and their 1:1 mixture after subtracting the RS spectrum of water, concentration of gel-forming agent in water 2% by mass; (<b>b</b>): spectra of air-dried samples of the same hydrogels on a quartz substrate after subtracting the RS spectrum of the quartz substrate and the RS spectrum of the quartz substrate.</p>
Full article ">Figure 6
<p>RS spectra of pectin and alginate (after subtraction of the substrate Q spectrum) with coefficients of 0.625 and 0.375, respectively, their sum, and the RS spectrum experimentally obtained in the mixture. P means pectin; A means alginate; AP means mixture of pectin and alginate; Q means quartz.</p>
Full article ">Figure 7
<p>Schematic illustration of chemical structures of pectin and alginate based on Raman spectra, created using the ACD/ChemSketch program (version 14.00) Hydrogen bonding are denoted by blue dotted lines.</p>
Full article ">Figure 8
<p>Appearance of cells cultured in the presence of gels. SYTO 9 (<b>a</b>) and PI (<b>b</b>) staining, 100 μm scale. 1—alginate, 2—pectin, 3—alginate/pectin, 4—control.</p>
Full article ">
26 pages, 3788 KiB  
Review
Advancing Drug Delivery Paradigms: Polyvinyl Pyrolidone (PVP)-Based Amorphous Solid Dispersion for Enhanced Physicochemical Properties and Therapeutic Efficacy
by Agus Rusdin, Amirah Mohd Gazzali, Nur Ain Thomas, Sandra Megantara, Diah Lia Aulifa, Arif Budiman and Muchtaridi Muchtaridi
Polymers 2024, 16(2), 286; https://doi.org/10.3390/polym16020286 - 20 Jan 2024
Cited by 2 | Viewed by 1981
Abstract
Background: The current challenge in drug development lies in addressing the physicochemical issues that lead to low drug effectiveness. Solubility, a crucial physicochemical parameter, greatly influences various biopharmaceutical aspects of a drug, including dissolution rate, absorption, and bioavailability. Amorphous solid dispersion (ASD) has [...] Read more.
Background: The current challenge in drug development lies in addressing the physicochemical issues that lead to low drug effectiveness. Solubility, a crucial physicochemical parameter, greatly influences various biopharmaceutical aspects of a drug, including dissolution rate, absorption, and bioavailability. Amorphous solid dispersion (ASD) has emerged as a widely explored approach to enhance drug solubility. Objective: The objective of this review is to discuss and summarize the development of polyvinylpyrrolidone (PVP)-based amorphous solid dispersion in improving the physicochemical properties of drugs, with a focus on the use of PVP as a novel approach. Methodology: This review was conducted by examining relevant journals obtained from databases such as Scopus, PubMed, and Google Scholar, since 2018. The inclusion and exclusion criteria were applied to select suitable articles. Results: This study demonstrated the versatility and efficacy of PVP in enhancing the solubility and bioavailability of poorly soluble drugs. Diverse preparation methods, including solvent evaporation, melt quenching, electrospinning, coprecipitation, and ball milling are discussed for the production of ASDs with tailored characteristics. Conclusion: PVP-based ASDs could offer significant advantages in the formulation strategies, stability, and performance of poorly soluble drugs to enhance their overall bioavailability. The diverse methodologies and findings presented in this review will pave the way for further advancements in the development of effective and tailored amorphous solid dispersions. Full article
(This article belongs to the Special Issue Polymeric Materials for Drug Delivery II)
Show Figures

Figure 1

Figure 1
<p>Flowchart of the methodology(“n” represents a variable. supplementary data represent all discussion from the introduction till the main discussion in this article).</p>
Full article ">Figure 2
<p>Amorphous solid dispersion.</p>
Full article ">
15 pages, 6654 KiB  
Article
The Performance of Cellulose Composite Membranes and Their Application in Drinking Water Treatment
by Rengui Weng, Guohong Chen, Xin He, Jie Qin, Shuo Dong, Junjiang Bai, Shaojie Li and Shikang Zhao
Polymers 2024, 16(2), 285; https://doi.org/10.3390/polym16020285 - 20 Jan 2024
Viewed by 1255
Abstract
Water scarcity and water pollution have become increasingly severe, and therefore, the purification of water resources has recently garnered increasing attention. Given its position as a major water resource, the efficient purification of drinking water is of crucial importance. In this study, we [...] Read more.
Water scarcity and water pollution have become increasingly severe, and therefore, the purification of water resources has recently garnered increasing attention. Given its position as a major water resource, the efficient purification of drinking water is of crucial importance. In this study, we adopted a phase transition method to prepare ZrO2/BCM (bamboo cellulose membranes), after which we developed IP-ZrO2/BC-NFM (bamboo cellulose nanofiltration membranes) through interfacial polymerization using piperazine (PIP) and tricarbonyl chloride (TMC). Subsequently, we integrated these two membranes to create a combined “ultrafiltration + nanofiltration” membrane process for the treatment of drinking water. The membrane combination process was conducted at 25 °C, with ultrafiltration at 0.1 MPa and nanofiltration at 0.5 MPa. This membrane combination, featuring “ultrafiltration + nanofiltration,” had a significant impact on reducing turbidity, consistently maintaining the post-filtration turbidity of drinking water at or below 0.1 NTU. Furthermore, the removal rates for CODMN and ammonia nitrogen reached 75% and 88.6%, respectively, aligning with the standards for high-quality drinking water. In a continuous 3 h experiment, the nanofiltration unit exhibited consistent retention rates for Na2SO4 and bovine serum protein (BSA), with variations of less than 5%, indicating exceptional separation performance. After 9 h of operation, the water flux of the nanofiltration unit began to stabilize, with a decrease rate of approximately 25%, demonstrating that the “ultrafiltration + nanofiltration” membrane combination can maintain consistent performance during extended use. In conclusion, the “ultrafiltration + nanofiltration” membrane combination exhibited remarkable performance in the treatment of drinking water, offering a viable solution to address issues related to water scarcity and water pollution. Full article
(This article belongs to the Section Polymer Membranes and Films)
Show Figures

Figure 1

Figure 1
<p>“Ultrafiltration + Nanofiltration” cellulose membrane component treatment process: (<b>a</b>) microfiltration membrane filtration; (<b>b</b>) membrane filtration system.</p>
Full article ">Figure 2
<p>Turbidity and chromaticity in water.</p>
Full article ">Figure 3
<p>Ammonia nitrogen and COD<sub>MN</sub> in water.</p>
Full article ">Figure 4
<p>Removal efficiency of membrane combination process for turbidity in water quality.</p>
Full article ">Figure 5
<p>Removal efficiency of membrane combination process for COD<sub>MN</sub> in water quality.</p>
Full article ">Figure 6
<p>Removal efficiency of ammonia nitrogen in water by membrane combination process.</p>
Full article ">Figure 7
<p>Comparison of turbidity, COD<sub>MN</sub> and ammonia nitrogen removal between conventional nanofiltration membrane and combined membrane process: (<b>A</b>) removal efficiency for turbidity in water quality; (<b>B</b>) removal efficiency for COD<sub>MN</sub> in water quality; (<b>C</b>) Removal efficiency for ammonia nitrogen in water.</p>
Full article ">Figure 8
<p>The retention effect of pollutants by nanofiltration unit.</p>
Full article ">Figure 9
<p>Influence of operating time on separation performance of nanofiltration unit.</p>
Full article ">Figure 10
<p>Membrane flux recovery under different cleaning conditions.</p>
Full article ">
19 pages, 7233 KiB  
Article
A Study of PLA Thin Film on SS 316L Coronary Stents Using a Dip Coating Technique
by Mariana Macías-Naranjo, Margarita Sánchez-Domínguez, J. F. Rubio-Valle, Ciro A. Rodríguez, J. E. Martín-Alfonso, Erika García-López and Elisa Vazquez-Lepe
Polymers 2024, 16(2), 284; https://doi.org/10.3390/polym16020284 - 19 Jan 2024
Cited by 1 | Viewed by 1319
Abstract
The dip coating process is one of the recognized techniques used to generate polymeric coatings on stents in an easy and low-cost way. However, there is a lack of information about the influence of the process parameters of this technique on complex geometries [...] Read more.
The dip coating process is one of the recognized techniques used to generate polymeric coatings on stents in an easy and low-cost way. However, there is a lack of information about the influence of the process parameters of this technique on complex geometries such as stents. This paper studies the dip coating process parameters used to provide a uniform coating of PLA with a 4–10 µm thickness. A stainless-steel tube (AISI 316L) was laser-cut, electropolished, and dip-coated in a polylactic acid (PLA) solution whilst changing the process parameters. The samples were characterized to examine the coating’s uniformity, thickness, surface roughness, weight, and chemical composition. FTIR and Raman investigations indicated the presence of PLA on the stent’s surface, the chemical stability of PLA during the coating process, and the absence of residual chloroform in the coatings. Additionally, the water contact angle was measured to determine the hydrophilicity of the coating. Our results indicate that, when using entry and withdrawal speeds of 500 mm min−1 and a 15 s immersion time, a uniform coating thickness was achieved throughout the tube and in the stent with an average thickness of 7.8 µm. Full article
Show Figures

Figure 1

Figure 1
<p>Process and samples: (<b>a</b>) Process chain of samples and (<b>b</b>) dip coating system: entry, immersion, and withdrawal stages.</p>
Full article ">Figure 2
<p>Shear viscosity of PLA solutions in CHCl<sub>3</sub>.</p>
Full article ">Figure 3
<p>Plot of the Specific viscosity of PLA concentration and estimation of the critical entanglement concentration.</p>
Full article ">Figure 4
<p>Coating uniformity observed in the stereo microscope at different entry and withdrawal speeds and immersion times: (<b>a</b>–<b>c</b>) Central zone, S<sub>E</sub> = 100 mm min<sup>−1</sup> and S<sub>W</sub> = 100 mm min<sup>−1</sup>, for 5 s, 10 s, and 15 s, respectively, (<b>d</b>–<b>f</b>) Central zone, S<sub>E</sub> = 500 mm min<sup>−1</sup> and S<sub>W</sub> = 500 mm min<sup>−1</sup>, for 5 s, 10 s, and 15 s, respectively, (<b>g</b>–<b>i</b>) Top zone, S<sub>E</sub> = 500 mm min<sup>−1</sup> and S<sub>W</sub> = 500 mm min<sup>−1</sup>, for 5 s, 10 s, and 15 s, respectively, and (<b>j</b>–<b>l</b>) Bottom zone, S<sub>E</sub>= 500 mm min<sup>−1</sup> and S<sub>W</sub> = 500 mm min<sup>−1</sup>, for 5 s, 10 s, and 15 s, respectively.</p>
Full article ">Figure 5
<p>Weight comparison of the samples.</p>
Full article ">Figure 6
<p>Average surface roughness (R<sub>a</sub>) and ten-point mean roughness (R<sub>z</sub>) after coating and PLA coating showed at different entry and withdrawal speeds: (<b>a</b>) S<sub>E</sub> = 100 mm min<sup>−1</sup> and S<sub>W</sub> = 100 mm min<sup>−1</sup>, (<b>b</b>) S<sub>E</sub> = 100 mm min<sup>−1</sup> and S<sub>W</sub> = 500 mm min<sup>−1</sup>, (<b>c</b>) S<sub>E</sub> = 500 mm min<sup>−1</sup> and S<sub>W</sub> = 100 mm min<sup>−1</sup>, and (<b>d</b>) S<sub>E</sub> = 500 mm min<sup>−1</sup> and S<sub>W</sub> = 500 mm min<sup>−1</sup>.</p>
Full article ">Figure 7
<p>Weight and thickness increases throughout the different speed combinations (t = 15 s) and PLA coating showed by SEM images at different entry and withdrawal speeds: (<b>a</b>) S<sub>E</sub> = 100 mm min<sup>−1</sup> and S<sub>W</sub> = 100 mm min<sup>−1</sup>, (<b>b</b>) S<sub>E</sub> = 100 mm min<sup>−1</sup> and S<sub>W</sub> = 500 mm min<sup>−1</sup>, (<b>c</b>) S<sub>E</sub> = 500 mm min<sup>−1</sup> and S<sub>W</sub> = 100 mm min<sup>−1</sup>, and (<b>d</b>) S<sub>E</sub> = 500 mm min<sup>−1</sup> and S<sub>W</sub> = 500 mm min<sup>−1</sup>.</p>
Full article ">Figure 8
<p>Stent geometry: (<b>a</b>) uncoated stent observed in SEM, (<b>b</b>) coated stent observed in SEM (Magnification 100×), and (<b>c</b>) photograph of coated stent.</p>
Full article ">Figure 9
<p>SEM micrographs: (<b>a</b>) 5% (<span class="html-italic">w</span>/<span class="html-italic">v</span>), (<b>b</b>) 7.5% (<span class="html-italic">w</span>/<span class="html-italic">v</span>), and (<b>c</b>) 10% (<span class="html-italic">w</span>/<span class="html-italic">v</span>).</p>
Full article ">Figure 10
<p>AFM images of PLA film at different concentrations: (<b>a</b>) 5% (<span class="html-italic">w</span>/<span class="html-italic">v</span>), (<b>b</b>) 7.5% (<span class="html-italic">w</span>/<span class="html-italic">v</span>), and (<b>c</b>) 10% (<span class="html-italic">w</span>/<span class="html-italic">v</span>).</p>
Full article ">Figure 11
<p>Fourier transform infrared (FTIR) spectra of PLA.</p>
Full article ">Figure 12
<p>Raman spectra of PLA pellets and PLA film 7.5% (<span class="html-italic">w</span>/<span class="html-italic">v</span>).</p>
Full article ">
12 pages, 2668 KiB  
Article
The Toughness-Enhanced Atelocollagen Double-Network Gel for Biomaterials
by Atsushi Tsuyukubo, Riku Kubota, Yuzo Sato and Ichiro Fujimoto
Polymers 2024, 16(2), 283; https://doi.org/10.3390/polym16020283 - 19 Jan 2024
Cited by 1 | Viewed by 1165
Abstract
A tough gel composed of atelocollagen, which lacks an immunogenetic site, is a promising material for biomedical application. In this study, we created a composite hydrogel composed of atelocollagen gel cross-linked with glutaraldehyde (GA) and poly-(N,N-dimethylacrylamide) gel exhibiting biocompatibility [...] Read more.
A tough gel composed of atelocollagen, which lacks an immunogenetic site, is a promising material for biomedical application. In this study, we created a composite hydrogel composed of atelocollagen gel cross-linked with glutaraldehyde (GA) and poly-(N,N-dimethylacrylamide) gel exhibiting biocompatibility based on the double-network (DN) gel principle. The tensile toughness of atelocollagen gel remained constant regardless of the amount of cross-linker (GA) used. In contrast, tensile tests of the DN gel indicated that mechanical properties, such as fracture stress and toughness, were significantly higher than those of the atelocollagen gel. Moreover, fibroblast cells adhered and spread on the gels, the Schiff bases of which were treated via reductive amination for detoxification from GA. These findings demonstrate the potential of the proposed gel materials as artificial alternative materials to soft tissues with sub-MPa fracture stress. Full article
(This article belongs to the Special Issue Polymer Materials for Biomedical Applications)
Show Figures

Graphical abstract

Graphical abstract
Full article ">Figure 1
<p>Schematic illustration for preparation of double-network (DN) gel composed of atelocollagen and poly-(<span class="html-italic">N</span>,<span class="html-italic">N</span>-dimethylacrylamide).</p>
Full article ">Figure 2
<p>Mechanical tensile properties of glutaraldehyde (GA) cross-linked atelocollagen gels (GC-ACGs) under various ratios of GA/(Lys &amp; Hyl). (<b>a</b>) Manner of tensile tests; (<b>b</b>) stress–strain curve; (<b>c</b>) fracture stress; (<b>d</b>) fracture strain; (<b>e</b>) Young’s modulus (n = 3; N.S: not significant; * <span class="html-italic">p</span> &lt; 0.05; *** <span class="html-italic">p</span> &lt; 0.001).</p>
Full article ">Figure 3
<p>Characteristics of composite gels. (<b>a</b>) Water content in atelocollagen gel (GC-ACG) and composite gels prepared by two <span class="html-italic">N</span>,<span class="html-italic">N’</span>-methylenebisacrylamide (MBAA) concentrations (0.01 and 0.3 mol%, n = 3, ** <span class="html-italic">p</span> &lt; 0.01, *** <span class="html-italic">p</span> &lt; 0.001). (<b>b</b>–<b>d</b>) Scanning electron microscopy (SEM) images of GC-ACG (<b>b</b>) and DN gels prepared by two MBAA concentrations (0.01 mol% (<b>c</b>) and 0.3 mol% (<b>d</b>)).</p>
Full article ">Figure 4
<p>Mechanical tensile properties of DN atelocollagen gels: (<b>a</b>) stress–strain curve; (<b>b</b>) fracture stress; (<b>c</b>) fracture strain; (<b>d</b>) Young’ modulus; (<b>e</b>) toughness (n = 3; * <span class="html-italic">p</span> &lt; 0.05; ** <span class="html-italic">p</span> &lt; 0.01).</p>
Full article ">Figure 5
<p>Characteristics of the developed double-network (DN) gel after reductive amination (RA) treatment. (<b>a</b>) Tensile stress–strain curve of DN gels prepared using 0.3 mol% <span class="html-italic">N</span>,<span class="html-italic">N’</span>-methylenebisacrylamide (MBAA) before or after RA treatment. (<b>b</b>) Scanning electron microscopy (SEM) image of atelocollagen gel. (<b>c</b>) SEM image of the DN gel prepared using 0.3 mol% MBAA after RA treatment.</p>
Full article ">Figure 6
<p>Images of cell adhesion on cell culture treated polystyrene (PS) substrate and DN gels ((<b>a</b>–<b>c</b>): V79 cell line; (<b>d</b>–<b>f</b>): Primary Normal Human Dermal Fibroblast (NHDF) cell). (<b>a</b>,<b>d</b>) cell culture-treated PS substrates; (<b>b</b>,<b>e</b>) the DN gel before reductive amination (RA) treatment; (<b>c</b>,<b>f</b>) the DN gel after RA treatment.</p>
Full article ">
15 pages, 5399 KiB  
Article
Influence of Partially Carboxylated Powdered Lignocellulose from Oat Straw on Technological and Strength Properties of Water-Swelling Rubber
by Elena Cherezova, Yulia Karaseva, Abdirakym Nakyp, Airat Nuriev, Bakytbek Islambekuly and Nurgali Akylbekov
Polymers 2024, 16(2), 282; https://doi.org/10.3390/polym16020282 - 19 Jan 2024
Viewed by 1017
Abstract
The work is aimed at the development of an energy-saving technique involving the partial carboxylation of powdered lignocellulose products from the straw of annual agricultural plants and the use of the obtained products in rubber compositions as a water-swelling filler. Lignocellulose powder from [...] Read more.
The work is aimed at the development of an energy-saving technique involving the partial carboxylation of powdered lignocellulose products from the straw of annual agricultural plants and the use of the obtained products in rubber compositions as a water-swelling filler. Lignocellulose powder from oat straw (composition: α-cellulose—77.0%, lignin—3.8%, resins and fats—1.8%) was used for carboxylation without preliminary separation into components. Microwave radiation was used to activate the carboxylation process. This reduced the reaction time by 2–3 times. The synthesized products were analyzed by IR spectroscopy, thermogravimetry and scanning electron microscopy. Industrial product sodium carboxymethylcellulose (Na-CMC) was used as a swelling filler for comparison. The swelling fillers were fractionated by the sieve method; particles with the size of 0–1 mm were used for filling rubber compounds. The amount of swelling filler was 150 parts per 100 parts of rubber (phr). Due to the high filling of rubber compounds, plasticizer Oxal T-92 was added to the composition of a number of samples to facilitate the processing and uniform distribution of ingredients. The rubber composition was prepared in two stages. In the first stage, ingredients without swelling filler were mixed with rubber on a laboratory two-roll mill to create a base rubber compound (BRC). In the second stage, the BRC was mixed with the swelling filler in a closed laboratory plasti-corder rubber mixer, the Brabender Plasti-Corder® Lab-Station. Vulcanization was carried out at 160 °C. For the obtained samples, the physical-mechanical and sorption properties were determined. It has been shown that the carboxylated powdered lignocellulose from oat straw increases the strength properties of rubber in comparison with Na-CMC. It has been shown that when the carboxylated powdered lignocellulose from oat straw is introduced into the rubber composition, the degree of rubber swelling in aqueous solutions of various mineralizations increases by 50 and 100% in comparison with a noncarboxylated lignocellulose. Full article
(This article belongs to the Special Issue Advances in Cellulose-Based Polymers and Composites)
Show Figures

Figure 1

Figure 1
<p>Reaction of cellulose carboxylation.</p>
Full article ">Figure 2
<p>IR spectra (reflection spectra): 1—powdered lignocellulose from oat straw (PC-Oat), 2—carboxylated product of lignocellulose from oat straw (CMC-Oat).</p>
Full article ">Figure 3
<p>TGA curves: 1—powdered lignocellulose from oat straw (PC-Oat), 2—carboxylated product of lignocellulose from oat straw (CMC-Oat).</p>
Full article ">Figure 4
<p>Microphotographs of samples of swelling fillers: (<b>a</b>) PC-Oat, (<b>b</b>) CMC-Oat, (<b>c</b>) Na-CMC.</p>
Full article ">Figure 5
<p>Microphotographs of the samples: (<b>a</b>) PC-Oat, (<b>b</b>) CMC-Oat, (<b>c</b>) Na-CMC. Microphotographs of plasticized rubber samples filled with (Respectively).</p>
Full article ">Figure 6
<p>Visualization of the swelling process of samples: (<b>a</b>)—before swelling, (<b>b</b>)—during swelling.</p>
Full article ">Figure 7
<p>Influence of water-swelling filler composition on the degree of rubber swelling: 1—Na-CMC, 2—Na-CMC + PC-Oat, 3—PC-Oat, 4—Na-CMC + CMC-Oat, 5—CMC-Oat. Medium: (<b>a</b>)—I, (<b>b</b>)—II.</p>
Full article ">Figure 8
<p>Influence of water-swelling filler composition on the degree of rubber swelling: 1—Na-CMC, 2—Na-CMC + PC-Oat, 3—PC-Oat, 4—Na-CMC + CMC-Oat, 5—CMC-Oat. Medium: (<b>a</b>)—III, (<b>b</b>)—IV.</p>
Full article ">Figure 9
<p>Influence of water-swelling filler composition on the degree of rubber swelling: 1—Na-CMC, 2—Na-CMC + PC-Oat, 3—PC-Oat, 4—Na-CMC + CMC-Oat, 5—CMC-Oat. Medium: (<b>a</b>)—V, (<b>b</b>)—VI.</p>
Full article ">Figure 10
<p>Photographs of a disk-shaped rubber sample: (<b>a</b>) before swelling, (<b>b</b>) swollen in 5% NaOH solution.</p>
Full article ">
22 pages, 5967 KiB  
Review
Repair of Infected Bone Defects with Hydrogel Materials
by Zhenmin Cao, Zuodong Qin, Gregory J. Duns, Zhao Huang, Yao Chen, Sheng Wang, Ruqi Deng, Libo Nie and Xiaofang Luo
Polymers 2024, 16(2), 281; https://doi.org/10.3390/polym16020281 - 19 Jan 2024
Cited by 2 | Viewed by 1667
Abstract
Infected bone defects represent a common clinical condition involving bone tissue, often necessitating surgical intervention and antibiotic therapy. However, conventional treatment methods face obstacles such as antibiotic resistance and susceptibility to postoperative infections. Hydrogels show great potential for application in the field of [...] Read more.
Infected bone defects represent a common clinical condition involving bone tissue, often necessitating surgical intervention and antibiotic therapy. However, conventional treatment methods face obstacles such as antibiotic resistance and susceptibility to postoperative infections. Hydrogels show great potential for application in the field of tissue engineering due to their advantageous biocompatibility, unique mechanical properties, exceptional processability, and degradability. Recent interest has surged in employing hydrogels as a novel therapeutic intervention for infected bone repair. This article aims to comprehensively review the existing literature on the anti-microbial and osteogenic approaches utilized by hydrogels in repairing infected bones, encompassing their fabrication techniques, biocompatibility, antimicrobial efficacy, and biological activities. Additionally, the potential opportunities and obstacles in their practical implementation will be explored. Lastly, the limitations presently encountered and the prospective avenues for further investigation in the realm of hydrogel materials for the management of infected bone defects will be deliberated. This review provides a theoretical foundation and advanced design strategies for the application of hydrogel materials in the treatment of infected bone defects. Full article
(This article belongs to the Special Issue Advances in Functional Polymer Materials for Biomedical Applications)
Show Figures

Figure 1

Figure 1
<p>Crosslinking processes for preparation and various applications of hydrogels. Reproduced from ref. [<a href="#B37-polymers-16-00281" class="html-bibr">37</a>]. Copyright 2023, with permission from Elsevier.</p>
Full article ">Figure 2
<p>Synthesis and application of Van-AA-OGP hydrogels and mechanism of antimicrobial and osteogenic action. The recognition of Van and specific terminal AA dipeptide of the cell wall peptidoglycan precursor in nature. The synthesis and self-healing characteristics of hematoma-like Van-AA-OGP hydrogel. Van-M (marked blue) and AA-M (marked yellow) paired in the hydrogel demonstrate the reversible Van–AA interaction. Van-AA-OGP hydrogel eliminates <span class="html-italic">S. aureus</span> and promots bone repair in murine fracture infection. Reproduced from ref. [<a href="#B83-polymers-16-00281" class="html-bibr">83</a>]. Copyright 2023, with permission from Elsevier.</p>
Full article ">Figure 3
<p>(<b>a</b>) SF/nHAP hydrogel preparation scheme; (<b>b</b>) sessile and planktonic growth of MSSA, MRSA, <span class="html-italic">S. epidermidis</span>, <span class="html-italic">E. coli</span> and <span class="html-italic">P. aeruginosa</span> on SF/nHAP hydrogels containing different AgNPs and AuNPs concentrations, as percentages of the control materials without nanoparticles, after 24 h of incubation. * <span class="html-italic">p</span> &lt; 0.01, significant reduction compared to hydrogels without NPs; (<b>c</b>) CLSM images of osteoblastic cells at day 7 on SF/nHAP hydrogels with different concentrations of AgNPs and AuNPs. MG63 cells were stained for F-actin cytoskeleton with alexafluor phalloidin (green) and nuclei with propidium iodide (red). Reproduced from ref. [<a href="#B90-polymers-16-00281" class="html-bibr">90</a>]. Copyright 2017, with permission from Elsevier.</p>
Full article ">Figure 4
<p>A schematic illustration depicting the process of preparing and utilizing multifunctional hydrogels. The thermosensitive hydrogel, which is responsive to gingivine, is crosslinked using PEG-DA and FPM, and subsequently loaded with SDF-1 for a duration of 10 min at a temperature of 37 °C. The FPM is composed of SAMP positioned in the center, flanked by two anchoring peptides on the periphery. Each anchoring peptide encompasses a splice site that is specific to RgpA. Upon contact with RgpA, released by <span class="html-italic">P. gingivalis</span> at the location of a periodontal defect, the hydrogel undergoes splicing at the designated site within the FPM, leading to the release of SAMPs*. Consequently, the growth of periodontal pathogens is inhibited. Reproduced from ref. [<a href="#B100-polymers-16-00281" class="html-bibr">100</a>]. Copyright 2021, with permission from American Chemical Society.</p>
Full article ">Figure 5
<p>Preparation and biological effects of the CGH/PDA@HAP hydrogel. (<b>A</b>) Synthetic process. (<b>B</b>) Biological effects oxidized. (EDC: N-(3-Dimethylaminopropyl)-N′-ethylcarbodiimide hydrochloride, NHS: N-Hydroxysuccinimide, CS-GA: GA-modified CS, HA-ALD: oxidized HA). Reproduced from ref. [<a href="#B107-polymers-16-00281" class="html-bibr">107</a>]. under Creative Commons Attribution <a href="https://creativecommons.org/licenses/by/4.0/" target="_blank">https://creativecommons.org/licenses/by/4.0/</a> (accessed on 13 December 2023). Copyright 2023. Pang et al.</p>
Full article ">Figure 6
<p>The mechanisms underlying HA@SDF-1α/M2D-Exos hydrogel’s ability to accelerate fracture healing. The HA@SDF-1α/M2D-Exos hydrogel can be constructed in situ through a mixed injection process. The hydrogel forms rapidly due to the hydrazone bond formation between the HA-ADH and the OHAQA crosslinking, while the positively charged quaternary ammonium groups of the hydrogel provide a long-term antibacterial and hemostasis environment. Synchronously and sustainably released SDF-1α and M2D-Exos from the HA@SDF-1α/M2D-Exos hydrogel enhance osteogenesis and angiogenesis both in vivo and in vitro. Reproduced from ref. [<a href="#B113-polymers-16-00281" class="html-bibr">113</a>]. Copyright 2023, with permission from Elsevier.</p>
Full article ">Figure 7
<p>Schematic diagram of a composite ADA−Gel hydrogel double cross-linked by Ca<sup>2+</sup> and chemically bonded and decorated with nHAP. Dynamic dissociated PO<sub>4</sub><sup>3−</sup> and Ca<sup>2+</sup> from nHAP interact with the biopolymer to form a tight and compact structure. Improved biomedical and mechanical properties were achieved for its application in maxillofacial bone defects. Through interactive modulation between macrophages and BMSCs, the composite hydrogel significantly accelerated the bone repair process. Reproduced from ref. [<a href="#B129-polymers-16-00281" class="html-bibr">129</a>]. Copyright 2022, with permission from Elsevier.</p>
Full article ">Figure 8
<p>Composite schematic diagram of CRL@ BMP-2@MS. Reproduced from ref. [<a href="#B145-polymers-16-00281" class="html-bibr">145</a>]. under Creative Commons Attribution <a href="https://creativecommons.org/licenses/by/4.0/" target="_blank">https://creativecommons.org/licenses/by/4.0/</a> (accessed on 13 December 2023). Copyright 2023. Cai et al.</p>
Full article ">Figure 9
<p>Schematic illustration of the study design of a composite hydrogel consisting of GelMA and BMSCs and wrapped with a two-layer drug-loaded poly (lactic-co-glycolic acid) (PLGA) microsphere system consisting of bevacizumab and IGF-1 to achieve sustained drug delivery to the injury site. Reproduced from ref. [<a href="#B148-polymers-16-00281" class="html-bibr">148</a>] under Creative Commons Attribution <a href="https://creativecommons.org/licenses/by/4.0/" target="_blank">https://creativecommons.org/licenses/by/4.0/</a> (accessed on 13 December 2023). Copyright 2023. Qiang et al.</p>
Full article ">
0 pages, 3546 KiB  
Article
Comparison of Two Methods for Measuring the Temperature Dependence of H2 Permeation Parameters in Nitrile Butadiene Rubber Polymer Composites Blended with Fillers: The Volumetric Analysis Method and the Differential Pressure Method
by Ji Hun Lee, Ye Won Kim, Do Jung Kim, Nak Kwan Chung and Jae Kap Jung
Polymers 2024, 16(2), 280; https://doi.org/10.3390/polym16020280 - 19 Jan 2024
Cited by 1 | Viewed by 893
Abstract
Hydrogen uptake/diffusivity in nitrile butadiene rubber (NBR) blended with carbon black (CB) and silica fillers was measured with a volumetric analysis method in the 258–323 K temperature range. The temperature-dependent H2 diffusivity was obtained by assuming constant solubility with temperature variations. The [...] Read more.
Hydrogen uptake/diffusivity in nitrile butadiene rubber (NBR) blended with carbon black (CB) and silica fillers was measured with a volumetric analysis method in the 258–323 K temperature range. The temperature-dependent H2 diffusivity was obtained by assuming constant solubility with temperature variations. The logarithmic diffusivity decreased linearly with increasing reciprocal temperature. The diffusion activation energies were calculated with the Arrhenius equation. The activation energies for NBR blended with high-abrasion furnace CB and silica fillers increased linearly with increasing filler content. For NBR blended with medium thermal CB filler, the activation energy decreased with increasing filler content. The activation energy filler dependency is similar to the glass transition temperature filler dependency, as determined with dynamic mechanical analysis. Additionally, the activation energy was compared with that obtained by the differential pressure method through permeability temperature dependence. The same activation energy between diffusion and permeation in the range of 33–39 kJ/mol was obtained, supporting the temperature-independent H2 solubility and H2 physisorption in polymer composites. Full article
(This article belongs to the Section Polymer Analysis and Characterization)
Show Figures

Figure 1

Figure 1
<p>Volumetric measurements for hydrogen employing a graduated cylinder with a cell after high-pressure exposure and decompression: (<b>a</b>) specimen exposed in a high-pressure chamber. The light gray cubic-shaped box indicates the supporting body containing the cylindrical-shaped high-pressure chamber, manufactured from SUS 316 material to withstand pressures up to 20 MPa. The dark gray box below the chamber is the shelf plate on which the chamber is horizontally placed during the hydrogen exposure and (<b>b</b>) after decompression in the chamber and specimen loading into the cell. The H<sub>2</sub> emission measurement was conducted with a graduated cylinder partially immersed in a water container. The blue color in the cylinder indicates distilled water.</p>
Full article ">Figure 2
<p>Temperature-controlled chamber for six parallel volumetric measurements with six graduated cylinders after high-pressure exposure and decompression. There are six sample-containing cells in the temperature control chamber. The blue in the cylinder indicates distilled water.</p>
Full article ">Figure 3
<p>Schematic of the temperature-control system of the DPM: (<b>a</b>) front view of the internal cross-section for the permeation cell and (<b>b</b>) overall temperature-controlled system with the bath fluid circulator outside the permeation cell.</p>
Full article ">Figure 4
<p>H<sub>2</sub> emission content versus time for neat NBR at different temperatures after hydrogen exposure at 7 MPa. The corresponding solid lines are the least-squares fits to Equation (4) with the diffusion analysis program. The blue arrow on the dashed blue line indicates the hydrogen uptake at infinite time.</p>
Full article ">Figure 5
<p>Hydrogen diffusivity versus reciprocal temperature for neat NBR and NBR composites blended with fillers: (<b>a</b>) HAF CB filler, (<b>b</b>) MT CB filler, and (<b>c</b>) silica filler. The slopes of the linear fits indicated the activation energies for diffusion. The diffusivity result for neat NBR is included in all panels for comparison with those of the NBR composites with fillers. The diffusivities for the NBR MT series and the NBR silica series were almost the same as for neat NBR within the measurement uncertainty, as shown in the enlarged graph. The error bars represent the expanded uncertainty (8.8%) in the diffusivity.</p>
Full article ">Figure 5 Cont.
<p>Hydrogen diffusivity versus reciprocal temperature for neat NBR and NBR composites blended with fillers: (<b>a</b>) HAF CB filler, (<b>b</b>) MT CB filler, and (<b>c</b>) silica filler. The slopes of the linear fits indicated the activation energies for diffusion. The diffusivity result for neat NBR is included in all panels for comparison with those of the NBR composites with fillers. The diffusivities for the NBR MT series and the NBR silica series were almost the same as for neat NBR within the measurement uncertainty, as shown in the enlarged graph. The error bars represent the expanded uncertainty (8.8%) in the diffusivity.</p>
Full article ">Figure 6
<p>Activation energies versus filler contents for NBR composites blended with HAF, MT, and silica fillers. The legends show the linear least-squares fits of the activation energy versus filler content plots and their squared correlation coefficients, R<sup>2</sup>. The blue, green, and red lines indicate linear fits and the slopes for the NBR HAF CB series, the NBR MT CB series, and the NBR silica series, respectively. The error bars represent the expanded uncertainty (10%) of the activation energy, which will be estimated in the uncertainty analysis.</p>
Full article ">Figure 7
<p>Plots of the glass transition temperature versus filler content for NBR composites blended with HAF CB, MT CB, and silica filler. The legends show the linear least-squares fits for the plots of T<sub>g</sub> versus filler contents and their squared correlation coefficients, R<sup>2</sup>. The blue, green, and red lines indicate linear fits with slopes for the NBR with HAF CB series, the NBR with MT CB series, and the NBR with silica series, respectively.</p>
Full article ">Figure 8
<p>Hydrogen pressure measured on the permeated side versus time after H<sub>2</sub> injection for neat NBR at different temperatures. The slope in the permeation curves was obtained after hydrogen injection started (t = 0).</p>
Full article ">Figure 9
<p>Temperature-independent solubility in the DPM measurements for the neat NBR and NBR composites filled with HAF CB, MT CB, and silica at 40 phr at three different temperatures: (<b>a</b>) measured at 0.1 MPa H<sub>2</sub> and (<b>b</b>) measured at 7 MPa H<sub>2</sub>.</p>
Full article ">Figure 10
<p>Comparison of the activation energies determined in the VAM with those obtained in the DPM: (<b>a</b>) neat NBR and NBR composites filled with HAF CB; (<b>b</b>) neat NBR and NBR composites filled with MT CB; and (<b>c</b>) neat NBR and NBR composites filled with silica. The results for neat NBR are contained in all panels for comparison with those of the NBR composites blended with fillers. The error bars representing the expanded uncertainty for the activation energy in DPM are 13%, as estimated in the uncertainty analysis.</p>
Full article ">Figure 10 Cont.
<p>Comparison of the activation energies determined in the VAM with those obtained in the DPM: (<b>a</b>) neat NBR and NBR composites filled with HAF CB; (<b>b</b>) neat NBR and NBR composites filled with MT CB; and (<b>c</b>) neat NBR and NBR composites filled with silica. The results for neat NBR are contained in all panels for comparison with those of the NBR composites blended with fillers. The error bars representing the expanded uncertainty for the activation energy in DPM are 13%, as estimated in the uncertainty analysis.</p>
Full article ">
2 pages, 326 KiB  
Correction
Correction: Zhu et al. Mineralized Collagen/Polylactic Acid Composite Scaffolds for Load-Bearing Bone Regeneration in a Developmental Model. Polymers 2023, 15, 4194
by Wenbo Zhu, Wenjing Li, Mengxuan Yao, Yan Wang, Wei Zhang, Chao Li, Xiumei Wang, Wei Chen and Hongzhi Lv
Polymers 2024, 16(2), 279; https://doi.org/10.3390/polym16020279 - 19 Jan 2024
Viewed by 1262
Abstract
In the original publication [...] Full article
(This article belongs to the Special Issue Stimuli Responsive Polymeric-Based Electroactive Biomaterials)
Show Figures

Figure 1

Figure 1
<p>X-ray images of the femur defect at 1 (<b>A</b>), 3 (<b>B</b>), and 6 (<b>C</b>) months after the MC/PLA scaffold implantation in 3-month-old sheep.</p>
Full article ">
15 pages, 6848 KiB  
Article
Influence of Novel SrTiO3/MnO2 Hybrid Nanoparticles on Poly(methyl methacrylate) Thermal and Mechanical Behavior
by Houda Taher Elhmali, Ivana Stajcic, Aleksandar Stajcic, Ivan Pesic, Marija Jovanovic, Milos Petrovic and Vesna Radojevic
Polymers 2024, 16(2), 278; https://doi.org/10.3390/polym16020278 - 19 Jan 2024
Cited by 3 | Viewed by 998
Abstract
While dental poly methyl methacrylate(PMMA) possesses distinctive qualities such as ease of fabrication, cost-effectiveness, and favorable physical and mechanical properties, these attributes alone are inadequate to impart the necessary impact strength and hardness. Consequently, pure PMMA is less suitable for dental applications. This [...] Read more.
While dental poly methyl methacrylate(PMMA) possesses distinctive qualities such as ease of fabrication, cost-effectiveness, and favorable physical and mechanical properties, these attributes alone are inadequate to impart the necessary impact strength and hardness. Consequently, pure PMMA is less suitable for dental applications. This research focused on the incorporation of Strontium titanate (SrTiO3-STO) and hybrid filler STO/Manganese oxide (MnO2) to improve impact resistance and hardness. The potential of STO in reinforcing PMMA is poorly investigated, while hybrid filler STO/MnO2 has not been presented yet. Differential scanning calorimetry is conducted in order to investigate the agglomeration influence on the PMMA glass transition temperature (Tg), as well as the leaching of residual monomer and volatile additives that could pose a threat to human health. It has been determined that agglomeration with 1 wt% loading had no influence on Tg, while the first scan revealed differences in evaporation of small molecules, in favor of composite PMMA-STO/MnO2, which showed the trapping potential of volatiles. Investigations of mechanical properties have revealed the significant influence of hybrid STO/MnO2 filler on microhardness and total absorbed impact energy, which were increased by 89.9% and 145.4%, respectively. Results presented in this study revealed the reinforcing potential of hybrid nanoparticles that could find application in other polymers as well. Full article
(This article belongs to the Special Issue Thermal Properties Analysis of Polymers)
Show Figures

Figure 1

Figure 1
<p>(<b>a</b>) FESEM of STO/MnO<sub>2</sub> (<b>b</b>) Particle size distribution.</p>
Full article ">Figure 2
<p>XRD of SrTiO<sub>3</sub>/MnO<sub>2</sub> particles.</p>
Full article ">Figure 3
<p>FESEM images of (<b>a</b>) PMMA (2000× magnification); (<b>b</b>) PMMA-STO (1000× magnification); (<b>c</b>) PMMA-STO/MnO<sub>2</sub> (1000× magnification); (<b>d</b>) PMMA-STO (2000× magnification); (<b>e</b>) PMMA-STO/MnO<sub>2</sub> (2000× magnification); (<b>f</b>) PMMA-STO/MnO<sub>2</sub> (5000× magnification).</p>
Full article ">Figure 4
<p>FTIR spectra of PMMA and composites with enlarged region 1500–500 cm<sup>−1</sup>.</p>
Full article ">Figure 5
<p>DSC analysis of PMMA and composites: (<b>a</b>) second scan; (<b>b</b>) first scan.</p>
Full article ">Figure 6
<p>Load-time curves obtained from controlled energy impact test.</p>
Full article ">Scheme 1
<p>Advantages and applications of PMMA in dentistry.</p>
Full article ">
18 pages, 5748 KiB  
Article
A Novel In-Line Measurement and Analysis Method of Bubble Growth-Dependent Strain and Deformation Rates during Foaming
by Tobias Schaible and Christian Bonten
Polymers 2024, 16(2), 277; https://doi.org/10.3390/polym16020277 - 19 Jan 2024
Cited by 1 | Viewed by 943
Abstract
Bubble growth processes are highly influenced by the elongational viscosity of the blowing agent-loaded polymer melt. Therefore, the elongational viscosity is an important parameter for the development of new polymers for foaming applications, as well as for the prediction of bubble growth processes. [...] Read more.
Bubble growth processes are highly influenced by the elongational viscosity of the blowing agent-loaded polymer melt. Therefore, the elongational viscosity is an important parameter for the development of new polymers for foaming applications, as well as for the prediction of bubble growth processes. Thus, knowledge of the initial expansion and deformation behavior in dependency on the polymer, the blowing agent concentration, and the process conditions is necessary. This study presents a novel method for the in-line observation and analysis of the initial expansion and deformation behavior within the bead foam extrusion process. For this purpose, nitrogen as the blowing agent was injected into the polymer melt (PS and PLA) during the extrusion process. The in-line observation system consists of a borescope equipped with a camera, which was integrated into the water box of an underwater pelletizer. The camera is controlled by a developed trigger by means of angular step signal analysis of a rotary encoder on the cutter shaft of the underwater pelletizer. Thus, images can be taken at any time during the foaming process depending on the cutter position to the die outlet. It is shown that the developed method provides reliable results and that the differences of the initial expansion and deformation behavior during bubble growth can be analyzed in-line in dependency on real foaming process conditions and the type of polymer used. Full article
Show Figures

Figure 1

Figure 1
<p>Illustration of the modified pelletizing unit of the underwater pelletizer (<b>a</b>) and schematic drawing of the die plate with the observed die hole during processing (<b>b</b>).</p>
Full article ">Figure 2
<p>Exemplary image taken with the in-line observation method at a random time step during underwater pelletizing.</p>
Full article ">Figure 3
<p>Schematic representation of the model for the analysis of the initial expansion and deformation behavior at exemplary times without a blowing agent concentration as reference (<b>a</b>) and for blowing agent-loaded polymer melts with otherwise unchanged process conditions (<b>b</b>).</p>
Full article ">Figure 4
<p>Analysis of the transient uniaxial elongational viscosity profile of PS (<b>a</b>) and PLA (<b>b</b>) at exemplary SER measurement conditions in relation to the uniaxial Trouton ratio (<math display="inline"><semantics> <mrow> <mn>3</mn> <mo>·</mo> <mi>η</mi> </mrow> </semantics></math>).</p>
Full article ">Figure 5
<p>In-line observation at ten exemplary times between two cuts in the underwater pelletizing process of PS at 220 °C and 0 wt.-% N<sub>2</sub> to analyze the expansion and thus the deformation behavior.</p>
Full article ">Figure 6
<p>Analysis of the mean projected pellet area in dependency of N<sub>2</sub> concentration for PLA at 220 °C.</p>
Full article ">Figure 7
<p>Investigation of the reproducibility of the in-line observation method for PLA and PS.</p>
Full article ">Figure 8
<p>Pellet density at the end of the underwater pelletizing process at 4.52 s for PS (<b>a</b>) and PLA (<b>b</b>) at two temperatures.</p>
Full article ">Figure 9
<p>Initial expansion behavior over time of N<sub>2</sub> in PS at 220 °C (<b>a</b>) and 240 °C (<b>b</b>).</p>
Full article ">Figure 10
<p>Comparison of the initial expansion behavior over time of N<sub>2</sub> in PLA and PS at 220 °C.</p>
Full article ">Figure 11
<p>Hencky strain (<b>a</b>) and strain rate (<b>b</b>) over time during expansion of the blowing agent at the bubble wall for PS in dependency of temperature and blowing agent concentration.</p>
Full article ">Figure 12
<p>Hencky strain (<b>a</b>) and strain rate (<b>b</b>) over time during expansion of the blowing agent at the bubble wall for PS and PLA in dependency of temperature and N<sub>2</sub> concentration.</p>
Full article ">
12 pages, 4713 KiB  
Article
The Role of Lanthanum Stearate on Strain-Induced Crystallization and the Mechanical Properties of Whole Field Latex Rubber
by Changjin Yang, Yuhang Luo, Zechun Li, Chuanyu Wei and Shuangquan Liao
Polymers 2024, 16(2), 276; https://doi.org/10.3390/polym16020276 - 19 Jan 2024
Viewed by 778
Abstract
Natural rubber (NR) is extensively utilized in numerous industries, such as aerospace, military, and transportation, because of its exceptional elasticity and all-around mechanical qualities. However, commercial NR made using various techniques typically has distinct mechanical characteristics. For instance, whole field latex rubber (SCR-WF) [...] Read more.
Natural rubber (NR) is extensively utilized in numerous industries, such as aerospace, military, and transportation, because of its exceptional elasticity and all-around mechanical qualities. However, commercial NR made using various techniques typically has distinct mechanical characteristics. For instance, whole field latex rubber (SCR-WF) cured with accelerator 2-Mercaptobenzothiazole exhibits poor mechanical properties. This work attempts to enhance the mechanical property of SCR-WF via the addition of lanthanum stearate (LaSt). The influence of LaSt on strain-induced crystallization (SIC) and the mechanical properties of SCR-WF were investigated. The results of crosslinking density measured by the equilibrium swelling method demonstrate that the presence of LaSt significantly increases the crosslinking density of SCR-WF with lower loading of LaSt. The results of the mechanical properties show that the introduction of LaSt can enhance the tensile strength and fracture toughness of SCR-WF. To reveal the mechanism of LaSt improving the mechanical properties of SCR-WF, synchrotron radiation wide-angle X-ray diffraction (WAXD) experiments were used to investigate the SIC behaviors of SCR-WF. We found that the LaSt leads to higher crystallinity of SIC for the strain higher than 3.5. The tube model indicates the contribution of LaSt in both crosslinking and topological constraints. This work may provide an instruction for developing SCR-WF with superior mechanical properties. Full article
(This article belongs to the Section Polymer Analysis and Characterization)
Show Figures

Figure 1

Figure 1
<p>The cure curves of NR compound with different LaSt loadings.</p>
Full article ">Figure 2
<p>The cure curves of vulcanized SCR-WF with different LaSt loadings.</p>
Full article ">Figure 3
<p>Effect of LaSt loading on the tear strength (<b>a</b>) and fracture toughness (<b>b</b>) of vulcanized SCR-WF.</p>
Full article ">Figure 4
<p>WAXD patterns of (<b>a</b>) SCR-WF without LaSt and (<b>b</b>) SCR-WF with 2 phr LaSt.</p>
Full article ">Figure 5
<p>The variation of crystallinity index (<b>a</b>) and amorphous orientation parameter &lt;<math display="inline"><semantics> <mrow> <msubsup> <mi>P</mi> <mn>2</mn> <mrow> <mi>a</mi> <mi>m</mi> </mrow> </msubsup> </mrow> </semantics></math>&gt; (<b>b</b>) of SCR-WF without LaSt and with 2 phr LaSt.</p>
Full article ">Figure 6
<p>The Mooney–Rivlin plots of reduced stress (<b>a</b>) and parameters G<sub>c</sub> and G<sub>e</sub> (<b>b</b>) of SCR-WF without LaSt and 2 phr LaSt.</p>
Full article ">Figure 7
<p>Schematic models of the role of LaSt on the SIC of vulcanized SCR-WF.</p>
Full article ">
15 pages, 5044 KiB  
Article
Development of a UiO-66 Based Waterborne Flame-Retardant Coating for PC/ABS Material
by Shaojun Chen, Youhan Zeng, Weifeng Bi, Haitao Zhuo and Haiqiang Zhong
Polymers 2024, 16(2), 275; https://doi.org/10.3390/polym16020275 - 19 Jan 2024
Viewed by 979
Abstract
The flame-retardancy of polymeric materials has garnered great interest. Most of the flame retardants used in copolymers are functionalized additives, which can deteriorate the intrinsic properties of these materials. As a new type of flame retardant, functionalized metal–organic frameworks (MOFs) can be used [...] Read more.
The flame-retardancy of polymeric materials has garnered great interest. Most of the flame retardants used in copolymers are functionalized additives, which can deteriorate the intrinsic properties of these materials. As a new type of flame retardant, functionalized metal–organic frameworks (MOFs) can be used in surface coatings of polymers. To reduce the flammability, a mixture of phytic acid, multi-wall carbon nanotubes, zirconium-based MOFs, and UiO-66 was coated on a PC/ABS substrate. The structure of the UiO-66-based flame retardant was established by FT-IR, XRD, XPS, and SEM. The flammable properties of coated PC/ABS materials were assessed by LOI, a vertical combustion test, TGA, CCT, and Raman spectroscopy. The presence of a UiO-66-based coating on the PC/ABS surface resulted in a good flame-retardant performance. Heat release and smoke generation were significantly reduced. Importantly, the structure and mechanical properties of PC/ABS were less impacted by the presence of the flame-retardant coating. Hence, this work presents a new strategy for the development of high-performance PC/ABC materials with both excellent flame-retardancy and good mechanical properties. Full article
(This article belongs to the Special Issue Advance in Polymer Composites: Fire Protection and Thermal Management)
Show Figures

Graphical abstract

Graphical abstract
Full article ">Figure 1
<p>Route for the synthesis of PA@MWCNT@UiO-66.</p>
Full article ">Figure 2
<p>FT-IR spectra (<b>a</b>) and XRD patterns (<b>b</b>) of UiO-66@PA@MWCNT, UiO-66@MWCNT, MWCNT−COOH, and UiO-66.</p>
Full article ">Figure 3
<p>XPS spectra of UiO-66@PA@MWCNT: (<b>a</b>)survey scan; (<b>b</b>) C1s; (<b>c</b>) O1s; (<b>d</b>) Zr3d; (<b>e</b>) P<sub>2p</sub>.</p>
Full article ">Figure 4
<p>FT-IR spectra (<b>a</b>) and XRD patterns (<b>b</b>) of WAUPM, WA, UiO-66@PA@MWCNT and TGA (<b>c</b>) and DTG (<b>d</b>) curves of WAUPM, WAUM, WAU, and WA.</p>
Full article ">Figure 5
<p>SEM images of untreated PC/ABS (<b>a</b>), WAU-3 (<b>b</b>), WAUM-3 (<b>c</b>), and WAUPM-3 (<b>d</b>,<b>e</b>).</p>
Full article ">Figure 6
<p>Limiting oxygen index and vertical burning grade (<b>a</b>) and fire growth index (FGI) (<b>b</b>) of PC/ABS samples coated with a waterborne flame-retardant coating.</p>
Full article ">Figure 7
<p>Curves for heat release rate (HPR) (<b>a</b>), total heat release (THR) (<b>b</b>), smoke production rate (SPR) (<b>c</b>), total smoke production (TSR) (<b>d</b>), CO<sub>2</sub> (<b>e</b>), and O<sub>2</sub> (<b>f</b>) contents of untreated, WAUM-3, WAUPM-1, WAUPM-2, and WAUPM-3 samples.</p>
Full article ">Figure 8
<p>FT-IR spectra of carbon residues after the cone calorimetry test.</p>
Full article ">Figure 9
<p>Macroscopic images and SEM images of carbon residues after vertical combustion test: (<b>a</b>,<b>f</b>) Untreated; (<b>b</b>,<b>g</b>) WAUM-3; (<b>c</b>,<b>h</b>) WAUPM-1; (<b>d</b>,<b>i</b>) WAUPM-2; and (<b>e</b>,<b>j</b>) WAUM-3.</p>
Full article ">Figure 10
<p>Raman spectra of carbon residues from untreated PC/ABS (<b>a</b>), WAUM-3 (<b>b</b>), WAUPM-1 (<b>c</b>), WAUPM-2 (<b>d</b>) WAUM-3, and (<b>e</b>) coated PC/ABS.</p>
Full article ">Figure 11
<p>Illustration of the mode of action of fire-retardancy of the MOFs-based flame-retardant coating.</p>
Full article ">
Previous Issue
Back to TopTop