[go: up one dir, main page]

Next Issue
Volume 16, March-1
Previous Issue
Volume 16, February-1
 
 
polymers-logo

Journal Browser

Journal Browser

Polymers, Volume 16, Issue 4 (February-2 2024) – 119 articles

Cover Story (view full-size image): 
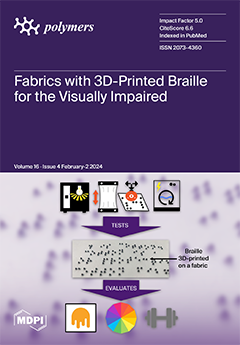
There are 1 billion visually impaired and blind individuals (VIBIs). The integration of 3D-printed (3DP) Braille directly onto clothing presents a ground-breaking opportunity for VIBIs, offering them a new level of independence. This innovation allows them to learn about their clothing before making a purchase, easily identify garments in their wardrobe, and understand care instructions through touch. This study explores the impact of 3DP photosensitive resin on textile substrates, focusing on essential textile properties such as strength and washability. Fabrics enhanced with 3D printing on their surface are pioneering new standards for inclusivity and functionality in the textile industry. View this paper
  • Issues are regarded as officially published after their release is announced to the table of contents alert mailing list.
  • You may sign up for e-mail alerts to receive table of contents of newly released issues.
  • PDF is the official format for papers published in both, html and pdf forms. To view the papers in pdf format, click on the "PDF Full-text" link, and use the free Adobe Reader to open them.
Order results
Result details
Section
Select all
Export citation of selected articles as:
15 pages, 6177 KiB  
Article
Agro-Waste Sweet Pepper Extract-Magnetic Iron Oxide Nanoparticles for Antioxidant Enrichment and Sustainable Nanopackaging
by Elisia María López-Alcántara, Grecia Marcela Colindres-Vásquez, Nouzha Fodil, Marlon Sánchez-Barahona, Octavio Rivera-Flores, Alberto Romero and Johar Amin Ahmed Abdullah
Polymers 2024, 16(4), 564; https://doi.org/10.3390/polym16040564 - 19 Feb 2024
Viewed by 1259
Abstract
This study synthesizes magnetic iron oxide nanoparticles from agro-waste sweet pepper extract, exploring their potential as antioxidant additives and in food preservation. Iron (III) chloride hexahydrate is the precursor, with sweet pepper extract as both a reducing and capping agent at pH 7.5. [...] Read more.
This study synthesizes magnetic iron oxide nanoparticles from agro-waste sweet pepper extract, exploring their potential as antioxidant additives and in food preservation. Iron (III) chloride hexahydrate is the precursor, with sweet pepper extract as both a reducing and capping agent at pH 7.5. Characterization techniques, including microscopy and spectroscopy, analyze the sweet pepper extract-magnetic iron oxide nanoparticles. Antioxidant capacities against 2,2-diphenyl-1-picrylhydrazyl are assessed, incorporating nanoparticles into banana-based bioplastic for grape preservation. Microscopy reveals cubic and quasi-spherical structures, and spectroscopy confirms functional groups, including Fe–O bonds. X-ray diffraction identifies cubic and monoclinic magnetite with a monoclinic hematite presence. Sweet pepper extract exhibits 100% inhibitory activity in 20 min, while sweet pepper extract-magnetic iron oxide nanoparticles show an IC50 of 128.1 µg/mL. Furthermore, these nanoparticles, stabilized with banana-based bioplastic, effectively preserve grapes, resulting in a 27.4% lower weight loss rate after 144 h compared to the control group (34.6%). This pioneering study encourages institutional research into the natural antioxidant properties of agro-waste sweet pepper combined with magnetic iron and other metal oxide nanoparticles, offering sustainable solutions for nanopackaging and food preservation. Current research focuses on refining experimental parameters and investigating diverse applications for sweet pepper extract-magnetic iron oxide nanoparticles in varied contexts. Full article
(This article belongs to the Special Issue Metal Nanoparticles–Polymers Hybrid Materials III)
Show Figures

Figure 1

Figure 1
<p>SEM image of SPEx-MIONPs (<b>a</b>) and their corresponding diameter distribution (<b>b</b>).</p>
Full article ">Figure 2
<p>TEM image of SPEx-MIONPs (<b>a</b>) and their size distribution (<b>b</b>).</p>
Full article ">Figure 3
<p>FTIR spectra of the SPEx-MIONPs in the ranges of (<b>a</b>) 4000–1500 cm<sup>−1</sup> and (<b>b</b>) 1500–400 cm<sup>−1</sup>. The thickened spectrum in black represents the entire spectra, while peaks in other colors denote the deconvoluted components fitted using Gaussian functions.</p>
Full article ">Figure 4
<p>XRD diffractogram of SPEx-MIONPs illustrating distinct crystalline systems and their corresponding crystallographic planes (<b>a</b>). The magnetic response of SPEx-MIONPs to the magnet is visually depicted in (<b>b</b>).</p>
Full article ">Figure 5
<p>Antioxidant activity of SPEx-MIONPs against DPPH free radicals demonstrated a dependence on concentration.</p>
Full article ">
39 pages, 5703 KiB  
Article
Effect of End Groups on the Cloud Point Temperature of Aqueous Solutions of Thermoresponsive Polymers: An Inside View by Flory–Huggins Theory
by Thi To Nga Dang and Erik Nies
Polymers 2024, 16(4), 563; https://doi.org/10.3390/polym16040563 - 19 Feb 2024
Viewed by 774
Abstract
In an effort to gain insight into the origin of the effects of end groups on the cloud point temperature (Tcp) as a function of the polymer molar mass of thermoresponsive polymers with lower critical solution behavior in dilute [...] Read more.
In an effort to gain insight into the origin of the effects of end groups on the cloud point temperature (Tcp) as a function of the polymer molar mass of thermoresponsive polymers with lower critical solution behavior in dilute aqueous solutions, we use the Flory–Huggins (FH) theory amended for end groups. The theory was applied to available experimental data sets of poly(N-isopropylacrylamide) (PNIPAM), poly(4-vinylbenzyl methoxytris(oxyethylene) ether) (PTEGSt), and poly(α-hydro-ω-(4-vinylbenzyl)tetrakis(oxyethylene) ether) (PHTrEGSt). The theory relates the variations in TcpM,ϕcp for different end groups to the effective FH χ parameter of the end groups and explains the qualitative notion that the influence of the end groups is related to the hydrophobicity/hydrophilicity of the end groups relative to that of the so called intrinsic TcpM,ϕcp response of a polymer without end groups. The limits to the applicability of the FH theory are established, and a set of possible theoretical improvements is considered. The ultimate scrutiny of the simple FH theory and suggested improved theories must await the measurement of truly thermodynamic cloud points; the available cloud points are merely estimations of the thermodynamic cloud point, for which the deviation to the true cloud point cannot be established with sufficient accuracy. Full article
Show Figures

Figure 1

Figure 1
<p>Double logarithmic plot of <math display="inline"><semantics> <mrow> <msub> <mi>χ</mi> <mrow> <mi>c</mi> <mi>p</mi> </mrow> </msub> <mfenced> <mrow> <msub> <mi>ϕ</mi> <mrow> <mi>c</mi> <mi>p</mi> </mrow> </msub> <mo>,</mo> <mo> </mo> <msub> <mi>s</mi> <mi>P</mi> </msub> </mrow> </mfenced> <mo>−</mo> <msub> <mi>χ</mi> <mrow> <mi>c</mi> <mi>p</mi> </mrow> </msub> <mfenced> <mrow> <msub> <mi>ϕ</mi> <mrow> <mi>c</mi> <mi>p</mi> </mrow> </msub> <mo>,</mo> <mo> </mo> <msub> <mi>s</mi> <mi>P</mi> </msub> <mo>→</mo> <mo>∞</mo> </mrow> </mfenced> </mrow> </semantics></math> versus <math display="inline"><semantics> <mrow> <msub> <mi>s</mi> <mi>P</mi> </msub> </mrow> </semantics></math> according to the FH theory (Equations (2) and (4)) for selected compositions, <math display="inline"><semantics> <mrow> <msub> <mi>ϕ</mi> <mrow> <mi>c</mi> <mi>p</mi> </mrow> </msub> </mrow> </semantics></math> (symbols), and the empirical fit of the data using Equation (7) (solid lines).</p>
Full article ">Figure 2
<p>The influence of <math display="inline"><semantics> <mrow> <msub> <mi>χ</mi> <mrow> <mi>O</mi> <msub> <mi>E</mi> <mn>1</mn> </msub> <mo>,</mo> <mn>1</mn> </mrow> </msub> </mrow> </semantics></math> of the end segment on <math display="inline"><semantics> <mrow> <msub> <mi>T</mi> <mrow> <mi>c</mi> <mi>p</mi> </mrow> </msub> </mrow> </semantics></math> of a polymer solution <math display="inline"><semantics> <mrow> <mfenced> <mrow> <msub> <mi>ϕ</mi> <mi>P</mi> </msub> <mo>=</mo> <mn>0.01</mn> </mrow> </mfenced> </mrow> </semantics></math> as a function of the polymer chain length, <math display="inline"><semantics> <mrow> <msub> <mi>s</mi> <mi>P</mi> </msub> </mrow> </semantics></math>.</p>
Full article ">Figure 3
<p>Experimental <math display="inline"><semantics> <mrow> <msub> <mi>T</mi> <mrow> <mi>c</mi> <mi>p</mi> </mrow> </msub> </mrow> </semantics></math> versus polymer molar mass, <math display="inline"><semantics> <mrow> <msub> <mi>M</mi> <mi>n</mi> </msub> <mo>,</mo> </mrow> </semantics></math> for narrow-disperse RCOCHCH<sub>3</sub>-(NIPAM)<sub>n</sub>-Cl in aqueous solutions with R = -NH<sub>2</sub>, -NH-<span class="html-italic">i</span>-Pr, -OMe, -OEt, and -NHPh <math display="inline"><semantics> <mrow> <mfenced> <mrow> <msub> <mi>w</mi> <mrow> <mi>P</mi> <mi>N</mi> <mi>I</mi> <mi>P</mi> <mi>A</mi> <mi>M</mi> </mrow> </msub> <mo>=</mo> <mn>0.01</mn> </mrow> </mfenced> </mrow> </semantics></math> [<a href="#B13-polymers-16-00563" class="html-bibr">13</a>,<a href="#B17-polymers-16-00563" class="html-bibr">17</a>] and R = -Py <math display="inline"><semantics> <mrow> <mfenced> <mrow> <msub> <mi>w</mi> <mrow> <mi>P</mi> <mi>N</mi> <mi>I</mi> <mi>P</mi> <mi>A</mi> <mi>M</mi> </mrow> </msub> <mo>=</mo> <mn>0.002</mn> </mrow> </mfenced> </mrow> </semantics></math> [<a href="#B18-polymers-16-00563" class="html-bibr">18</a>] and for R-(NIPAM)<sub>n</sub>- in aqueous solutions with R = -IBN, -CONH<sub>2</sub>, and -CONH-Tr <math display="inline"><semantics> <mrow> <mfenced> <mrow> <msub> <mi>w</mi> <mrow> <mi>P</mi> <mi>N</mi> <mi>I</mi> <mi>P</mi> <mi>A</mi> <mi>M</mi> </mrow> </msub> <mo>=</mo> <mn>0.01</mn> </mrow> </mfenced> </mrow> </semantics></math> [<a href="#B29-polymers-16-00563" class="html-bibr">29</a>].</p>
Full article ">Figure 4
<p>Experimental <math display="inline"><semantics> <mrow> <msub> <mi>T</mi> <mrow> <mi>c</mi> <mi>p</mi> </mrow> </msub> </mrow> </semantics></math> versus polymer molar mass, <math display="inline"><semantics> <mrow> <msub> <mi>M</mi> <mi>n</mi> </msub> <mo>,</mo> </mrow> </semantics></math> for PNIPAM homopolymer reference system in water <math display="inline"><semantics> <mrow> <mfenced> <mrow> <msub> <mi>w</mi> <mrow> <mi>P</mi> <mi>N</mi> <mi>I</mi> <mi>P</mi> <mi>A</mi> <mi>M</mi> </mrow> </msub> <mo>=</mo> <mn>0.01</mn> </mrow> </mfenced> </mrow> </semantics></math> [<a href="#B13-polymers-16-00563" class="html-bibr">13</a>,<a href="#B17-polymers-16-00563" class="html-bibr">17</a>] (symbols) and the FH fit with <math display="inline"><semantics> <mrow> <msub> <mi>χ</mi> <mrow> <mi>O</mi> <mi>M</mi> <mo>,</mo> <mn>0</mn> </mrow> </msub> <mo>=</mo> <mn>3.1595</mn> <mrow> <mo> </mo> <mi>and</mi> <mo> </mo> </mrow> <msub> <mi>χ</mi> <mrow> <mi>O</mi> <mi>M</mi> <mo>,</mo> <mn>1</mn> </mrow> </msub> <mo>=</mo> <mo>−</mo> <mn>805.34</mn> </mrow> </semantics></math> K (dashed line).</p>
Full article ">Figure 5
<p><math display="inline"><semantics> <mrow> <mi mathvariant="sans-serif">Δ</mi> <msub> <mi>χ</mi> <mrow> <msub> <mi>E</mi> <mn>1</mn> </msub> </mrow> </msub> </mrow> </semantics></math> versus the reciprocal of the polymer molar mass, <math display="inline"><semantics> <mrow> <mfrac> <mn>1</mn> <mrow> <msub> <mi>M</mi> <mi>n</mi> </msub> </mrow> </mfrac> <mo>,</mo> </mrow> </semantics></math> for PNIPAM polymers with different R groups (symbols) and the FH linear fits of the data using Equation (9) (dashed lines). The black solid line shows the PNIPAM homopolymer reference system. The zoomed-in graph is for the results of Furyk et al.</p>
Full article ">Figure 6
<p>Experimental <math display="inline"><semantics> <mrow> <msub> <mi>T</mi> <mrow> <mi>c</mi> <mi>p</mi> </mrow> </msub> </mrow> </semantics></math> versus polymer molar mass, <math display="inline"><semantics> <mrow> <msub> <mi>M</mi> <mi>n</mi> </msub> </mrow> </semantics></math>, (symbols) and the FH fits of the data using Equations (6)–(9) (lines) for PNIPAM polymers in water with varying hydrophilicity of the R group: R = -NH<sub>2</sub>, -OEt, and -NHPh and PNIPAM homopolymer reference system (data for R = -NH-<span class="html-italic">i</span>-Pr and R = -OMe) [<a href="#B13-polymers-16-00563" class="html-bibr">13</a>,<a href="#B17-polymers-16-00563" class="html-bibr">17</a>]; and R = -Py [<a href="#B18-polymers-16-00563" class="html-bibr">18</a>]; R = -IBN, -CONH<sub>2</sub>, and -CONH-Tr [<a href="#B29-polymers-16-00563" class="html-bibr">29</a>]. The standard errors of <math display="inline"><semantics> <mrow> <msub> <mi>M</mi> <mi>n</mi> </msub> </mrow> </semantics></math> are not plotted to avoid cluttering the figure.</p>
Full article ">Figure 7
<p>Experimental <math display="inline"><semantics> <mrow> <msub> <mi>T</mi> <mrow> <mi>c</mi> <mi>p</mi> </mrow> </msub> </mrow> </semantics></math> versus polymer molar mass, <math display="inline"><semantics> <mrow> <msub> <mi>M</mi> <mi>n</mi> </msub> <mo>,</mo> </mrow> </semantics></math> for PTEGSt polymers with different end groups in aqueous solutions <math display="inline"><semantics> <mrow> <mfenced> <mrow> <msub> <mi>w</mi> <mrow> <mi>P</mi> <mi>T</mi> <mi>E</mi> <mi>G</mi> <mi>S</mi> <mi>t</mi> </mrow> </msub> <mo>=</mo> <mn>0.01</mn> </mrow> </mfenced> </mrow> </semantics></math> [<a href="#B20-polymers-16-00563" class="html-bibr">20</a>].</p>
Full article ">Figure 8
<p>Experimental <math display="inline"><semantics> <mrow> <msub> <mi>T</mi> <mrow> <mi>c</mi> <mi>p</mi> </mrow> </msub> </mrow> </semantics></math> versus polymer molar mass, <math display="inline"><semantics> <mrow> <msub> <mi>M</mi> <mi>n</mi> </msub> <mo>,</mo> </mrow> </semantics></math> for H-(TEGSt)<sub>n</sub>-H homopolymer in water <math display="inline"><semantics> <mrow> <mfenced> <mrow> <msub> <mi>w</mi> <mrow> <mi>P</mi> <mi>T</mi> <mi>E</mi> <mi>G</mi> <mi>S</mi> <mi>t</mi> </mrow> </msub> <mo>=</mo> <mn>0.01</mn> </mrow> </mfenced> </mrow> </semantics></math> [<a href="#B20-polymers-16-00563" class="html-bibr">20</a>] (symbols) and the FH fit with <math display="inline"><semantics> <mrow> <msub> <mi>χ</mi> <mrow> <mi>O</mi> <mi>M</mi> <mo>,</mo> <mn>0</mn> </mrow> </msub> <mo>=</mo> <mn>3.0576</mn> </mrow> </semantics></math> and <math display="inline"><semantics> <mrow> <msub> <mi>χ</mi> <mrow> <mi>O</mi> <mi>M</mi> <mo>,</mo> <mn>1</mn> </mrow> </msub> <mo>=</mo> <mo>−</mo> <mn>735.44</mn> </mrow> </semantics></math> K (dashed lines).</p>
Full article ">Figure 9
<p><math display="inline"><semantics> <mrow> <mi mathvariant="sans-serif">Δ</mi> <msub> <mi>χ</mi> <mrow> <msub> <mi>E</mi> <mn>1</mn> </msub> </mrow> </msub> </mrow> </semantics></math> versus the reciprocal of the polymer molar mass, <math display="inline"><semantics> <mrow> <mfrac> <mn>1</mn> <mrow> <msub> <mi>M</mi> <mi>n</mi> </msub> </mrow> </mfrac> <mo>,</mo> </mrow> </semantics></math> for Ph-(TEGSt)<sub>n</sub>-H and H-(TEGSt)<sub>n</sub>-ON (symbols) and the FH linear fits of the data using Equation (9) (dashed lines). The excluded data point of Ph-(TEGSt)<sub>n</sub>-H at <math display="inline"><semantics> <mrow> <msub> <mi>M</mi> <mi>n</mi> </msub> <mo>=</mo> <mn>6.6</mn> <mo> </mo> </mrow> </semantics></math> kDa is shown in red.</p>
Full article ">Figure 10
<p>Experimental <math display="inline"><semantics> <mrow> <msub> <mi>T</mi> <mrow> <mi>c</mi> <mi>p</mi> </mrow> </msub> </mrow> </semantics></math> versus polymer molar mass, <math display="inline"><semantics> <mrow> <msub> <mi>M</mi> <mi>n</mi> </msub> <mo>,</mo> </mrow> </semantics></math> for PTEGSt polymers in water with varying hydrophilicity of the end group(s) [<a href="#B20-polymers-16-00563" class="html-bibr">20</a>] (symbols) and the FH fits/predictions of the data using Equations (6)–(9) (lines). The standard errors of <math display="inline"><semantics> <mrow> <msub> <mi>M</mi> <mi>n</mi> </msub> </mrow> </semantics></math> are not plotted to avoid cluttering the figure.</p>
Full article ">Figure 11
<p>Experimental <math display="inline"><semantics> <mrow> <msub> <mi>T</mi> <mrow> <mi>c</mi> <mi>p</mi> </mrow> </msub> </mrow> </semantics></math> versus polymer molar mass, <math display="inline"><semantics> <mrow> <msub> <mi>M</mi> <mi>n</mi> </msub> <mo>,</mo> </mrow> </semantics></math> for PHTrEGSt polymers with different end groups in aqueous solutions <math display="inline"><semantics> <mrow> <mfenced> <mrow> <msub> <mi>w</mi> <mrow> <mi>P</mi> <mi>H</mi> <mi>T</mi> <mi>r</mi> <mi>E</mi> <mi>G</mi> <mi>S</mi> <mi>t</mi> </mrow> </msub> <mo>=</mo> <mn>0.01</mn> </mrow> </mfenced> </mrow> </semantics></math> [<a href="#B20-polymers-16-00563" class="html-bibr">20</a>].</p>
Full article ">Figure 12
<p>Experimental <math display="inline"><semantics> <mrow> <msub> <mi>T</mi> <mrow> <mi>c</mi> <mi>p</mi> </mrow> </msub> </mrow> </semantics></math> versus polymer molar mass, <math display="inline"><semantics> <mrow> <msub> <mi>M</mi> <mi>n</mi> </msub> <mo>,</mo> </mrow> </semantics></math> for H-(HTrEGSt)<sub>n</sub>-H homopolymer in water <math display="inline"><semantics> <mrow> <mfenced> <mrow> <msub> <mi>w</mi> <mrow> <mi>P</mi> <mi>H</mi> <mi>T</mi> <mi>r</mi> <mi>E</mi> <mi>G</mi> <mi>S</mi> <mi>t</mi> </mrow> </msub> <mo>=</mo> <mn>0.01</mn> </mrow> </mfenced> </mrow> </semantics></math> [<a href="#B20-polymers-16-00563" class="html-bibr">20</a>] (symbols) and the FH fit with <math display="inline"><semantics> <mrow> <msub> <mi>χ</mi> <mrow> <mi>O</mi> <mi>M</mi> <mo>,</mo> <mn>0</mn> </mrow> </msub> <mo>=</mo> <mn>1.7782</mn> </mrow> </semantics></math> and <math display="inline"><semantics> <mrow> <msub> <mi>χ</mi> <mrow> <mi>O</mi> <mi>M</mi> <mo>,</mo> <mn>1</mn> </mrow> </msub> <mo>=</mo> <mo>−</mo> <mn>429.81</mn> </mrow> </semantics></math> K (dashed lines).</p>
Full article ">Figure 13
<p><math display="inline"><semantics> <mrow> <mi mathvariant="sans-serif">Δ</mi> <msub> <mi>χ</mi> <mrow> <msub> <mi>E</mi> <mn>1</mn> </msub> </mrow> </msub> </mrow> </semantics></math> (or <math display="inline"><semantics> <mrow> <mo>Δ</mo> <msub> <mi>χ</mi> <mi>E</mi> </msub> </mrow> </semantics></math>) versus the reciprocal of the polymer molar mass, <math display="inline"><semantics> <mrow> <mfrac> <mn>1</mn> <mrow> <msub> <mi>M</mi> <mi>n</mi> </msub> </mrow> </mfrac> <mo>,</mo> </mrow> </semantics></math> for H-(HTrEGSt)<sub>n</sub>-ON and Ph-(HTrEGSt)<sub>n</sub>-ON (symbols) and the FH linear fits of the data using Equations (9) and (11) (dashed lines).</p>
Full article ">Figure 14
<p>Experimental <math display="inline"><semantics> <mrow> <msub> <mi>T</mi> <mrow> <mi>c</mi> <mi>p</mi> </mrow> </msub> </mrow> </semantics></math> versus polymer molar mass, <math display="inline"><semantics> <mrow> <msub> <mi>M</mi> <mi>n</mi> </msub> <mo>,</mo> </mrow> </semantics></math> for PHTrEGSt polymers in water with varying hydrophilicity of the end group(s) [<a href="#B20-polymers-16-00563" class="html-bibr">20</a>] (symbols) and the FH fits/predictions of the data using Equations (6)–(9) (lines). The standard errors of <math display="inline"><semantics> <mrow> <msub> <mi>M</mi> <mi>n</mi> </msub> </mrow> </semantics></math> are not plotted to avoid cluttering the figure.</p>
Full article ">Scheme 1
<p>(<b>a</b>) Narrow-disperse RCOCHCH<sub>3</sub>-(NIPAM)<sub>n</sub>-Cl with R= -NH<sub>2</sub>, -NH-<span class="html-italic">i</span>-Pr, -OEt, -OMe, -NHPh [<a href="#B13-polymers-16-00563" class="html-bibr">13</a>,<a href="#B17-polymers-16-00563" class="html-bibr">17</a>] and R= -Py [<a href="#B18-polymers-16-00563" class="html-bibr">18</a>]; (<b>b</b>) R-(NIPAM)<sub>n</sub>- with R= -IBN, -CONH-Tr, -CONH<sub>2</sub> [<a href="#B29-polymers-16-00563" class="html-bibr">29</a>].</p>
Full article ">Scheme 2
<p>Chemical structure of narrow-disperse R-(TEGSt)<sub>n</sub>-R′ investigated with R, R′ = -H, -Ph, and -ON [<a href="#B20-polymers-16-00563" class="html-bibr">20</a>].</p>
Full article ">Scheme 3
<p>Chemical structure of narrow-disperse R-(HTrEGSt)<sub>n</sub>-R′ investigated with R, R′ = -H, -Ph, and -ON [<a href="#B20-polymers-16-00563" class="html-bibr">20</a>].</p>
Full article ">Figure A1
<p>Exact value of <math display="inline"><semantics> <mrow> <mi>β</mi> <msub> <mi mathvariant="sans-serif">Δ</mi> <mrow> <mi>m</mi> <mi>i</mi> <mi>x</mi> </mrow> </msub> <msubsup> <mi>A</mi> <mrow> <mi>H</mi> <mi>O</mi> <mi>G</mi> <mi>M</mi> </mrow> <mrow> <mi>A</mi> <mi>t</mi> <mi>h</mi> <mi>e</mi> <mi>r</mi> <mi>m</mi> <mi>a</mi> <mi>l</mi> </mrow> </msubsup> <mo>/</mo> <msub> <mi>N</mi> <mi>L</mi> </msub> </mrow> </semantics></math> and the approximate quadratic concentration dependence of <math display="inline"><semantics> <mrow> <msub> <mi>α</mi> <mi mathvariant="normal">m</mi> </msub> <mo> </mo> <msub> <mi>ϕ</mi> <mi>P</mi> </msub> <mfenced> <mrow> <mn>1</mn> <mo>−</mo> <msub> <mi>ϕ</mi> <mi>P</mi> </msub> </mrow> </mfenced> </mrow> </semantics></math> on <math display="inline"><semantics> <mrow> <msub> <mi>ϕ</mi> <mi>P</mi> </msub> </mrow> </semantics></math> for <math display="inline"><semantics> <mrow> <mi>z</mi> <mo>=</mo> <mn>10</mn> </mrow> </semantics></math> and <math display="inline"><semantics> <mrow> <msub> <mi>s</mi> <mi>P</mi> </msub> <mo>=</mo> <mn>100</mn> </mrow> </semantics></math>.</p>
Full article ">Figure A2
<p>Exact value of the concentration dependence, <math display="inline"><semantics> <mrow> <mn>1</mn> <mo>/</mo> <mfenced> <mrow> <mn>1</mn> <mo>−</mo> <msub> <mi>Γ</mi> <mi>P</mi> </msub> <msub> <mi>ϕ</mi> <mi>P</mi> </msub> </mrow> </mfenced> </mrow> </semantics></math>, the linear approximation, and the residual versus <math display="inline"><semantics> <mrow> <msub> <mi>ϕ</mi> <mi>P</mi> </msub> </mrow> </semantics></math> for <math display="inline"><semantics> <mrow> <mi>z</mi> <mo>=</mo> <mn>10</mn> </mrow> </semantics></math> and <math display="inline"><semantics> <mrow> <msub> <mi>s</mi> <mi>P</mi> </msub> <mo>=</mo> <mn>100</mn> </mrow> </semantics></math>.</p>
Full article ">
13 pages, 3704 KiB  
Article
Mold Fungal Resistance of Loose-Fill Thermal Insulation Materials Based on Processed Wheat Straw, Corn Stalk and Reed
by Ramunas Tupciauskas, Zigmunds Orlovskis, Karlis Trevors Blums, Janis Liepins, Andris Berzins, Gunars Pavlovics and Martins Andzs
Polymers 2024, 16(4), 562; https://doi.org/10.3390/polym16040562 - 19 Feb 2024
Viewed by 1018
Abstract
The present study evaluates the mold fungal resistance of newly developed loose-fill thermal insulation materials made of wheat straw, corn stalk and water reed. Three distinct techniques for the processing of raw materials were used: mechanical crushing (Raw, ≤20 mm), thermo-mechanical pulping (TMP) [...] Read more.
The present study evaluates the mold fungal resistance of newly developed loose-fill thermal insulation materials made of wheat straw, corn stalk and water reed. Three distinct techniques for the processing of raw materials were used: mechanical crushing (Raw, ≤20 mm), thermo-mechanical pulping (TMP) with 4% NaOH and steam explosion pulping (SEP). An admixture of boric acid (8%) and tetraborate (7%) was applied to all processed substrates due to their anti-fungal properties. The fourth sample group was prepared from SEP substrates without added fungicide (SEP*) as control. Samples from all treatments were separately inoculated by five different fungal species and incubated in darkness for 28 days at 28 °C and RH > 90%. The highest resistance to the colonization of mold fungi was achieved by TMP and SEP processing, coupled with the addition of boric acid and tetraborate, where molds infested only around 35% to 40% of the inoculated sample area. The lowest mold fungi resistance was detected for the Raw and SEP* samples, each ~75%; they were affected by rich amount of accessible nutrients, suggesting that boric acid and tetraborate additives alone did not prevent mold fungal growth as effectively as in combination with TMP and SEP treatments. Together, the achieved fungal colonization scores after combined fungicide and pulping treatments are very promising for the application of tested renewable materials in the future development of thermal insulation products. Full article
(This article belongs to the Special Issue Advances in Wood-Based Materials and Wood Polymer Composites)
Show Figures

Figure 1

Figure 1
<p>Radial (<b>a</b>) and tangential (<b>b</b>) surfaces of pine sapwood specimens.</p>
Full article ">Figure 2
<p>Microscopical surface view (25×, scale bar 1 mm) of mold fungal colonization on radial (<b>above</b>) and tangential (<b>bottom</b>) surfaces of pine sapwood specimens after 4 weeks incubation with (<b>a</b>) <span class="html-italic">Trichoderma viride</span>, (<b>b</b>) <span class="html-italic">Chaetomium globulosum</span>, (<b>c</b>) <span class="html-italic">Paecilomyces variotii</span>, (<b>d</b>) <span class="html-italic">Penicillium pinophilum</span> and (<b>e</b>) <span class="html-italic">Aspergillus niger</span>.</p>
Full article ">Figure 3
<p>Mold fungal colonization (A–H2O, according to <a href="#polymers-16-00562-t001" class="html-table">Table 1</a>) of differently processed wheat straw samples. Error bars are one standard deviation of 4 specimens mean.</p>
Full article ">Figure 4
<p>Microscopical surface view (10×, scale bar 3 mm) of mold fungal colonization on wheat straw samples after 4 weeks incubation: (<b>a</b>) WS-raw + A—<span class="html-italic">Trichoderma viride</span>, (<b>b</b>) WS-TMP + B—<span class="html-italic">Chaetomium globulosum</span>, (<b>c</b>) WS-SE + C—<span class="html-italic">Paecilomyces variotii</span> and (<b>d</b>) WS-SE* (H2O).</p>
Full article ">Figure 5
<p>Mold fungal colonization (A–H2O, according to <a href="#polymers-16-00562-t001" class="html-table">Table 1</a>) on differently processed corn stalk samples. Error bars are one standard deviation of 4 specimens mean.</p>
Full article ">Figure 6
<p>Microscopical surface view (10×, scale bar 3 mm) of mold fungal colonization on corn stalk samples after 4 weeks incubation: (<b>a</b>) Corn-raw + E—<span class="html-italic">Aspergillus niger</span>, (<b>b</b>) Corn-TMP (H2O), (<b>c</b>) Corn-SE + C—<span class="html-italic">Paecilomyces variotii</span> and (<b>d</b>) Corn-SE* + D—<span class="html-italic">Penicillium pinophilum</span>.</p>
Full article ">Figure 7
<p>Mold fungal colonization (A–H2O, according to <a href="#polymers-16-00562-t001" class="html-table">Table 1</a>) of differently processed water reed samples. Error bars are one standard deviation of 4 specimens mean.</p>
Full article ">Figure 8
<p>Microscopical surface view (10×, scale bar 3 mm) of mold fungal colonization on water reed samples after 4 weeks incubation: (<b>a</b>) Reed-raw + A—<span class="html-italic">Trichoderma viride</span>, (<b>b</b>) Reed-TMP (H2O), (<b>c</b>) Reed-SE + D—<span class="html-italic">Penicillium pinophilum</span> and (<b>d</b>) Reed-SE* + B—<span class="html-italic">Chaetomium globulosum</span>.</p>
Full article ">
12 pages, 11497 KiB  
Article
Pretreating Recycled Carbon Fiber Nonwoven with a Sizing Formulation to Improve the Performance of Thermoplastic Recycled Fiber-Reinforced Composites
by Frederik Goethals, Elke Demeyer, Isabel De Schrijver and Myriam Vanneste
Polymers 2024, 16(4), 561; https://doi.org/10.3390/polym16040561 - 19 Feb 2024
Viewed by 1130
Abstract
Pyrolysis is already an established recycling method to recover the carbon fibers of end-of-life composites. However, the pyrolysis process removes the fiber sizing. Fiber sizing is a critical step in composite material production, influencing adhesion, protection and overall performance. In this study, recycled [...] Read more.
Pyrolysis is already an established recycling method to recover the carbon fibers of end-of-life composites. However, the pyrolysis process removes the fiber sizing. Fiber sizing is a critical step in composite material production, influencing adhesion, protection and overall performance. In this study, recycled carbon nonwoven reinforcements made from pyrolyzed carbon fibers were pretreated to improve the mechanical properties of polyamide and polypropylene composites. The pretreatment involved applying specific coatings (sizings) on the nonwoven by spraying. Pretreated and non-pretreated composites were prepared by compression molding to investigate the impact of the fiber pretreatment on the tensile properties and interlaminar shear strength. The tests were performed in the 0° and 90° directions of the composite plate. The results revealed that pretreatment had little effect on the polyamide composites. However, significant improvements were obtained for the polypropylene composites, as an increase of more than 50% in tensile strength was achieved in the 0° direction and more than 35% in the 90° direction. In addition, the interlaminar shear strength increased from 11.9 MPa to 14.3 MPa in the 0° direction and from 14.9 MPa to 17.8 MPa in the 90° direction. Full article
(This article belongs to the Section Polymer Fibers)
Show Figures

Figure 1

Figure 1
<p>Applying the sizing formulation.</p>
Full article ">Figure 2
<p>SEM images of treated carbon nonwoven: (<b>a</b>) bottom of sample treated with Form 1; (<b>b</b>) middle of sample treated with Form 1.</p>
Full article ">Figure 3
<p>SEM images of treated carbon nonwoven: (<b>a</b>) bottom of sample treated with Form 5; (<b>b</b>) middle of sample treated with Form 5.</p>
Full article ">Figure 4
<p>Tensile strength of carbon/PA6 and carbon/PP composites containing different fiber sizings. In black are the results obtained in the 0° direction and in gray are the results obtained in the 90° direction of the composite plate.</p>
Full article ">Figure 5
<p>Tensile modulus of carbon/PA6 and carbon/PP composites containing different fiber sizings. In black are the results obtained in the 0° direction and in gray are the results obtained in the 90° direction of the composite plate.</p>
Full article ">Figure 6
<p>Interlaminar shear strength of carbon/PA6 and carbon/PP composites containing different fiber sizings. In black are the results obtained in the 0° direction and in gray are the results obtained in the 90° direction of the composite plate.</p>
Full article ">Figure 7
<p>SEM images of the cross section of (<b>a</b>) non-pretreated PA6 composite (no-sizing PA), (<b>b</b>) pretreated PA6 composite (COM 4), (<b>c</b>) non-pretreated PP composite (no-sizing PP) and (<b>d</b>) pretreated PP composite (COM 6).</p>
Full article ">
17 pages, 12960 KiB  
Article
Photopolymerization Pattern of New Methacrylate Cellulose Acetate Derivatives
by Ioana-Sabina Trifan, Andreea L. Chibac-Scutaru, Violeta Melinte and Sergiu Coseri
Polymers 2024, 16(4), 560; https://doi.org/10.3390/polym16040560 - 19 Feb 2024
Viewed by 1018
Abstract
Polymeric photocrosslinked networks, of particular interest in the design of materials with targeted characteristics, can be easily prepared by grafting light-sensitive moieties, such as methacrylates, on polymeric chains and, after photochemical reactions, provide materials with multiple applications via photopolymerization. In this work, photopolymerizable [...] Read more.
Polymeric photocrosslinked networks, of particular interest in the design of materials with targeted characteristics, can be easily prepared by grafting light-sensitive moieties, such as methacrylates, on polymeric chains and, after photochemical reactions, provide materials with multiple applications via photopolymerization. In this work, photopolymerizable urethane–methacrylate sequences were attached to free hydroxyl units of cellulose acetate chains in various proportions (functionalization degree from 5 to 100%) to study the properties of the resulting macromolecules and the influence of the cellulosic material structure on the double bond conversion degree. Additionally, to manipulate the properties of the photocured systems, the methacrylate-functionalized cellulose acetate derivatives were mixed with low molecular weight dimethacrylate derivatives (containing castor oil and polypropylene glycol flexible chains), and the influence of UV-curable composition on the photopolymerization parameters being studied. The achieved data reveal that the addition of dimethacrylate comonomers augmented the polymerization rates and conversion degrees, leading to polymer networks with various microstructures. Full article
(This article belongs to the Collection Biopolymers: Synthesis and Properties)
Show Figures

Figure 1

Figure 1
<p>The two reaction routes involving the attachment of 2-IEMA emphasising the corresponding products formation.</p>
Full article ">Figure 2
<p>Possible reaction pathways for the structural sequences of 2-IEMA and the formation of the corresponding products.</p>
Full article ">Figure 3
<p><sup>1</sup>H NMR (<b>a</b>) and <sup>13</sup>C NMR (<b>b</b>) spectra of initial (CA and 2-IEMA) and functionalized CA-Mx derivatives. The red asterisk, green asterisk, and red triangle highlights the structural changes that occur after the reaction, highlighting the change in the intensity of the <sup>13</sup>C-NMR signals for the carbon atoms.</p>
Full article ">Figure 4
<p>XRD patterns of CA and modified CA samples showing the existing (semi)crystalline and amorphous regions in each compound. The red arrow indicates the appearance of the new crystalline peak located at 23.2°.</p>
Full article ">Figure 5
<p>TG curves (<b>a</b>) and DTG curves (<b>b</b>) of CA and methacrylated CA derivatives.</p>
Full article ">Figure 6
<p>FTIR absorbance spectra (<b>a</b>) and the conversion degree (<b>b</b>) of photopolymerizable C=C bonds in a CA-M100 sample monitored at 815 cm<sup>−1</sup> during various irradiation stages.</p>
Full article ">Figure 7
<p>CD (%) of the CA-Mx series (CA-M5–CA-M100).</p>
Full article ">Figure 8
<p>Chemical structures of PPG-M and CO-UDMA used in combination with CA-Mx samples for improvement of the photopolymerization process.</p>
Full article ">Figure 9
<p>CD (%) of the CA-Mx–PPG-M films (<b>a</b>) and of the CA-Mx–CO-UDMA films (<b>b</b>).</p>
Full article ">Figure 10
<p>Schematic idealized representation of the photopolymerization process with the formation of a crosslinked network.</p>
Full article ">Figure 11
<p>FTIR spectra of the CA-M100–PPG-M film (<b>a</b>) and comparison between the CDs (%) of CA-M100, CA-M100–PPG-M, and CA-M100–CO-UDMA films (<b>b</b>).</p>
Full article ">Figure 12
<p>Conversion degree of CA-M5–CA-M100, alone and in combination with PPG-M or CO-UDMA, after an irradiation time of 300 s.</p>
Full article ">Figure 13
<p>SEM microphotographs (5000× magnification) of CA-M50 (<b>a</b>), CA-M10 (<b>b</b>), CA-M50–PPG-M (<b>c</b>), CA-M10–PPG-M (<b>d</b>), CA-M50–CO-UDMA (<b>e</b>), and CA-M10–CO-UDMA (<b>f</b>).</p>
Full article ">
14 pages, 2264 KiB  
Article
Experimental and Theoretical Insights into the Effect of Dioldibenzoate Isomers on the Performance of Polypropylene Catalysts
by Huasheng Feng, Changxiu Li, Junling Zhou, Xiaofan Zhang, Shuxuan Tang, Xiangya Xu and Zhihui Song
Polymers 2024, 16(4), 559; https://doi.org/10.3390/polym16040559 - 19 Feb 2024
Viewed by 837
Abstract
Experimental investigations and density functional theory (DFT) calculations were carried out to study the comprehensive effect of different 3,5-heptanedioldibenzoate (HDDB) optical isomers as the internal electron donor on the catalytic performance of Ziegler−Natta catalysts. The experimental catalytic activity of HDDB has a positive [...] Read more.
Experimental investigations and density functional theory (DFT) calculations were carried out to study the comprehensive effect of different 3,5-heptanedioldibenzoate (HDDB) optical isomers as the internal electron donor on the catalytic performance of Ziegler−Natta catalysts. The experimental catalytic activity of HDDB has a positive correlation with the relative content of the mesomer incorporated during catalyst preparation, while the hydrogen response of HDDB displayed a negative correlation with the relative content of the mesomer. In order to apply the DFT calculation results to the macroscopic activity of the catalyst, the content of the active centers of the catalyst was analyzed. Assuming that the content of the active centers is proportional to the internal electron donor content of the catalyst, binary linear regression was carried out, which showed a good linear correlation between experimental activity data and internal electron donor content. Furthermore, the fitted activity of the single active centers aligned well with the calculated activation energies. These results revealed that the catalytic activity of polypropylene (PP) catalysts is dependent on both the active center content and the catalytic activity of an individual active center. Additionally, the lower hydrogen response of HDDB leads to a higher molecular weight of polypropylene obtained from the RS-containing catalyst compared to the SS-containing catalyst. Further study reveals that the hydrogen transfer reactions of 2,4-pentanediol dibenzoate (PDDB)/HDDB are influenced by the orientation of the methyl/ethyl groups in different isomers, which affect the activation energy differences between the hydrogen transfer reaction and the propylene insertion reaction, and finally influence the molecular weight of PP. Full article
(This article belongs to the Special Issue Catalytic Olefin Polymerization and Polyolefin Materials)
Show Figures

Figure 1

Figure 1
<p>The optimized DFT geometries for the HDDB stereoisomers in the free state (red: oxygen; grey: carbon; hydrogen is omitted).</p>
Full article ">Figure 2
<p>The <span class="html-italic">trans</span>-a adsorption modes of HDDB stereoisomers and TiCl<sub>4</sub> on the (110)-facet of MgCl<sub>2</sub> (red: oxygen; grey: carbon; green: chlorine; yellow: magnesium; hydrogen is omitted).</p>
Full article ">Figure 3
<p>Structures of HDDB–catalyst–propylene complexes (red: oxygen; grey: carbon; green: chlorine; yellow: magnesium; hydrogen is omitted).</p>
Full article ">Figure 4
<p>The transition state structures of HDDB–catalyst–propylene (<span class="html-italic">si</span>-insertion) complexes (red: oxygen; grey: carbon; green: chlorine; yellow: magnesium; hydrogen is omitted).</p>
Full article ">Figure 5
<p>The changes of macroscopic activity for the active centers with (<b>a</b>) PDDB and (<b>b</b>) HDDB ID when increasing the stereoisomer content. The residuals are distributed according to the relative content percent of the <span class="html-italic">RS</span> or <span class="html-italic">SS</span> stereoisomers. The slope represents the catalytic activity for the active centers per unit.</p>
Full article ">Figure 6
<p>The transition state structures of HDDB stereoisomer catalysts in the hydrogen transfer reaction (red: oxygen; grey: carbon; green: chlorine; yellow: magnesium; hydrogen is omitted).</p>
Full article ">
15 pages, 6448 KiB  
Article
Preparation and Mechanical Properties of Flexible Prepreg Resin with High Strength and Low Creep
by Zhaoyi Sun, Zhiyuan Mei, Zheng Huang and Guorong Wang
Polymers 2024, 16(4), 558; https://doi.org/10.3390/polym16040558 - 18 Feb 2024
Cited by 1 | Viewed by 1025
Abstract
In this study, aiming at the problem of low strength and high creep caused by medium–low modulus flexible resin based on the formulation design idea of high-molecular-weight epoxy resin (E12)-reinforced flexible epoxy-terminated urethane resin (EUR), a flexible epoxy prepreg resin with high strength [...] Read more.
In this study, aiming at the problem of low strength and high creep caused by medium–low modulus flexible resin based on the formulation design idea of high-molecular-weight epoxy resin (E12)-reinforced flexible epoxy-terminated urethane resin (EUR), a flexible epoxy prepreg resin with high strength and low bending creep was prepared to be suitable for hot melt processing technology. Flexible EUR was synthesized by grafting flexible polyurethane segments onto the epoxy side chain by urethane bonding. By adjusting the ratio of E12 and EUR, the effects of different ratios of the two components on the mechanical properties and viscoelasticity of the resin were systematically studied with dicyandiamide as the latent curing system. Research has found that when the E12 content is between 20%wt and 40%wt, the resin system has the best coating viscosity at 65 °C to 85 °C. The molecular weight and the content of aromatic heterocyclic groups of the resin determine the strength and creep behavior of the resin. When the content of E12 in the system is less than 50%wt, modulus and strength increase linearly, but after more than 50%wt E12 content, the modulus is almost unchanged and the strength begins to decrease. By increasing the content of E12 in the resin, the creep behavior of the resin is greatly reduced. When the content of E12 increases to 50%wt, the bending creep is the lowest. Full article
Show Figures

Figure 1

Figure 1
<p>The EUR synthesis reaction mechanism diagram.</p>
Full article ">Figure 2
<p>The curing process of prepreg resin.</p>
Full article ">Figure 3
<p>FTIR spectra: (<b>a</b>) EUR synthesis reaction; (<b>b</b>) prepreg resins with different E12 content.</p>
Full article ">Figure 4
<p>Viscosity vs. temperature curve of resin.</p>
Full article ">Figure 5
<p>Tensile stress–strain curve (<b>a</b>) and bending stress–strain curve (<b>b</b>) of different resin formulations.</p>
Full article ">Figure 6
<p>Impact strength of different formulations of resin.</p>
Full article ">Figure 7
<p>SEM images of impact fracture morphology: (<b>a</b>–<b>f</b>) is 0%-E12~60%-E12 in turn.</p>
Full article ">Figure 8
<p>Changes in storage modulus curves (<b>a</b>); loss modulus curves (<b>b</b>); and loss factor curves (<b>c</b>) for different resin formulations.</p>
Full article ">Figure 9
<p>Effect of E12 content on bending creep characteristics.</p>
Full article ">
15 pages, 4535 KiB  
Article
Effect of Heat Treatment under Different Atmospheres on the Bonding Properties and Mechanism of Ceramiziable Heat-Resistant Adhesive
by Qingke Wang, Jiadong Tao, Huawei Shan, Tangyin Cui, Jie Ding and Jianghang Wang
Polymers 2024, 16(4), 557; https://doi.org/10.3390/polym16040557 - 18 Feb 2024
Viewed by 976
Abstract
In this study, a heat-resistant adhesive was prepared using molybdenum-phenolic (Mo-PF) resin as the matrix and TiB2 particle as the ceramizable filler for bonding Al2O3 ceramic substrates. Firstly, Fourier transform infrared (FTIR) was used to characterize the chemical structure [...] Read more.
In this study, a heat-resistant adhesive was prepared using molybdenum-phenolic (Mo-PF) resin as the matrix and TiB2 particle as the ceramizable filler for bonding Al2O3 ceramic substrates. Firstly, Fourier transform infrared (FTIR) was used to characterize the chemical structure of the Mo-PF. Subsequently, thermo gravimetric analysis (TGA) and shear strength testing were employed to investigate the effects of heat treatment in different atmospheres on the thermal stability and residual bonding properties of the adhesive. To further explore the bonding mechanism of the adhesive after heat treatment in different atmospheres, scanning electron microscopy (SEM), compressive strength testing, and X-ray diffraction (XRD) were utilized to analyze the microstructure, mechanical strength, and composition evolution of the adhesive at different temperatures. The bonding strength of Al2O3 joints showed a trend of initially decreasing and then increasing after different temperature heat treatment in air, with the shear strength reaching a maximum value of 25.68 MPa after treatment at 1200 °C. And the bonding strength of Al2O3 joints decreased slowly with the increase of temperature in nitrogen. In air, the ceramicization reaction at a high temperature enabled the mechanical strength of the adhesive to rise despite the continuous pyrolysis of the resin. However, the TiB2 filler in nitrogen did not react, and the properties of the adhesive showed a decreasing tendency with the pyrolysis of the resin. Full article
Show Figures

Figure 1

Figure 1
<p>Schematic diagram of the synthesis process of the Mo-PF [<a href="#B36-polymers-16-00557" class="html-bibr">36</a>].</p>
Full article ">Figure 2
<p>IR spectra before and after modification of phenolic resin.</p>
Full article ">Figure 3
<p>Preparation process of ceramizable adhesive and Al<sub>2</sub>O<sub>3</sub> joints.</p>
Full article ">Figure 4
<p>TG and DTG curves of Mo-PF and the adhesive under different conditions. (<b>a</b>) TG curves in air; (<b>b</b>) DTG curves in air; (<b>c</b>) TG curves in nitrogen; (<b>d</b>) DTG curves in nitrogen.</p>
Full article ">Figure 5
<p>The shear strength of Al<sub>2</sub>O<sub>3</sub> joints bonded by the adhesive after heat treatment at different temperatures and atmospheres.</p>
Full article ">Figure 6
<p>The physical photos of each Al<sub>2</sub>O<sub>3</sub> joint after shear strength test.</p>
Full article ">Figure 7
<p>SEM fracture surface micrographs of the adhesive after heat treatment at different temperatures and atmospheres. (<b>a</b>) 400 °C in air; (<b>b</b>) 600 °C in air; (<b>c</b>) 1200 °C in air; (<b>d</b>) 400 °C in nitrogen; (<b>e</b>) 600 °C in nitrogen; (<b>f</b>) 1200 °C in nitrogen.</p>
Full article ">Figure 8
<p>The physical photos of the cured blocks of Mo-PF and the adhesive before and after heat treatment under different conditions.</p>
Full article ">Figure 9
<p>XRD spectra of the adhesive after heat treatment at different temperatures and atmospheres.</p>
Full article ">
22 pages, 6087 KiB  
Article
Effect of Silica Fume Utilization on Structural Build-Up, Mechanical and Dimensional Stability Performance of Fiber-Reinforced 3D Printable Concrete
by Hatice Gizem Şahin, Ali Mardani and Hatice Elif Beytekin
Polymers 2024, 16(4), 556; https://doi.org/10.3390/polym16040556 - 18 Feb 2024
Cited by 5 | Viewed by 1023
Abstract
It is known that 3D printable concrete mixtures can be costly because they contain high dosages of binder and that the drying-shrinkage performance may be adversely affected. Mineral additives and fibers are generally used to control these negative aspects. In this study, the [...] Read more.
It is known that 3D printable concrete mixtures can be costly because they contain high dosages of binder and that the drying-shrinkage performance may be adversely affected. Mineral additives and fibers are generally used to control these negative aspects. In this study, the use of silica fume, a natural viscosity modifying admixture, was investigated to improve the rheological and thixotropic behavior of 3D printable concrete mixtures reinforced with polypropylene fiber (FR-3DPC). The effect of increasing the silica fume utilization ratio in FR-3DPC on the compressive strength (CS), flexural strength (FS), and drying-shrinkage (DS) performance of the mixtures was also examined. A total of five FR-3DPC mixtures were produced using silica fume at the rate of 3, 6, 9, and 12% of the cement weight, in addition to the control mixture without silica fume. As a result of the tests, the dynamic yield stress value decreased with the addition of 3% silica fume to the control mixture. However, it was found that the dynamic yield stress and apparent viscosity values of the mixtures increased with the addition of 6, 9, and 12% silica fume. With the increase in the use of silica fume, the CS values of the mixtures were generally affected positively, while the FS and DS behavior were affected negatively. Full article
(This article belongs to the Special Issue Functional Polymer-Associated Self-Healing Materials)
Show Figures

Graphical abstract

Graphical abstract
Full article ">Figure 1
<p>Workflow used within the scope of the study.</p>
Full article ">Figure 2
<p>Illustration of mixtures.</p>
Full article ">Figure 2 Cont.
<p>Illustration of mixtures.</p>
Full article ">Figure 2 Cont.
<p>Illustration of mixtures.</p>
Full article ">Figure 3
<p>Rheometer device used for rheological measurements of FR-3DPC mixtures and (<b>b</b>) sample mixture.</p>
Full article ">Figure 4
<p>(<b>a</b>) Rheological measurement process. (<b>b</b>) Determination of DYS and viscosity values from the 3rd period. (<b>c</b>) Determination of τ<sub>i</sub> and τ<sub>e</sub> values required to calculate the I<sub>thix</sub> value from the 5th and 7th periods. (<b>d</b>) Determination of the SYS required to calculate the A<sub>thix</sub> value from the 5th and 7th periods.</p>
Full article ">Figure 5
<p>Setting time of paste mixtures.</p>
Full article ">Figure 6
<p>Layer width/layer height and shape stability values of the mixtures.</p>
Full article ">Figure 6 Cont.
<p>Layer width/layer height and shape stability values of the mixtures.</p>
Full article ">Figure 7
<p>The 7- and 28-day CS results of FR-3DPC mixtures.</p>
Full article ">Figure 8
<p>The 7- and 28-day FS results of FR-3DPC mixtures.</p>
Full article ">Figure 9
<p>Length-change performance of FR-3DPC mixtures due to drying-shrinkage.</p>
Full article ">
26 pages, 7011 KiB  
Review
A Review of Polymer-Based Environment-Induced Nanogenerators: Power Generation Performance and Polymer Material Manipulations
by Shuanghong Xie, Huping Yan and Ronghui Qi
Polymers 2024, 16(4), 555; https://doi.org/10.3390/polym16040555 - 18 Feb 2024
Viewed by 1713
Abstract
Natural environment hosts a considerable amount of accessible energy, comprising mechanical, thermal, and chemical potentials. Environment-induced nanogenerators are nanomaterial-based electronic chips that capture environmental energy and convert it into electricity in an environmentally friendly way. Polymers, characterized by their superior flexibility, lightweight, and [...] Read more.
Natural environment hosts a considerable amount of accessible energy, comprising mechanical, thermal, and chemical potentials. Environment-induced nanogenerators are nanomaterial-based electronic chips that capture environmental energy and convert it into electricity in an environmentally friendly way. Polymers, characterized by their superior flexibility, lightweight, and ease of processing, are considered viable materials. In this paper, a thorough review and comparison of various polymer-based nanogenerators were provided, focusing on their power generation principles, key materials, power density and stability, and performance modulation methods. The latest developed nanogenerators mainly include triboelectric nanogenerators (TriboENG), piezoelectric nanogenerators (PENG), thermoelectric nanogenerators (ThermoENG), osmotic power nanogenerator (OPNG), and moist-electric generators (MENG). Potential practical applications of polymer-based nanogenerator were also summarized. The review found that polymer nanogenerators can harness a variety of energy sources, with the basic power generation mechanism centered on displacement/conduction currents induced by dipole/ion polarization, due to the non-uniform distribution of physical fields within the polymers. The performance enhancement should mainly start from strengthening the ion mobility and positive/negative ion separation in polymer materials. The development of ionic hydrogel and hydrogel matrix composites is promising for future nanogenerators and can also enable multi-energy collaborative power generation. In addition, enhancing the uneven distribution of temperature, concentration, and pressure induced by surrounding environment within polymer materials can also effectively improve output performance. Finally, the challenges faced by polymer-based nanogenerators and directions for future development were prospected. Full article
(This article belongs to the Special Issue High Performance Polymer Membranes II)
Show Figures

Figure 1

Figure 1
<p>Different nanogenerators and their applications: using mechanical energy: (<b>a</b>) PENG: for the manufacture of implantable medical devices [<a href="#B25-polymers-16-00555" class="html-bibr">25</a>] and human gait monitoring sensors [<a href="#B26-polymers-16-00555" class="html-bibr">26</a>], (<b>b</b>) TriboENG: for the collection of friction energy between droplets and triboelectric materials [<a href="#B27-polymers-16-00555" class="html-bibr">27</a>] or between different triboelectric materials [<a href="#B28-polymers-16-00555" class="html-bibr">28</a>]. (<b>c</b>) ThermoENG using thermal energy: it is used to manufacture self-powered sensors [<a href="#B29-polymers-16-00555" class="html-bibr">29</a>] and wearable devices [<a href="#B30-polymers-16-00555" class="html-bibr">30</a>]. Using chemical potential energy: (<b>d</b>) OPNG: used to collect energy between different concentrations of liquids [<a href="#B31-polymers-16-00555" class="html-bibr">31</a>] and promote in vitro drug delivery [<a href="#B32-polymers-16-00555" class="html-bibr">32</a>], (<b>e</b>) MENG: used to collect human respiration [<a href="#B33-polymers-16-00555" class="html-bibr">33</a>] and humidity energy in the environment to charge smartphones [<a href="#B34-polymers-16-00555" class="html-bibr">34</a>].</p>
Full article ">Figure 2
<p>Power generation principles of different nanogenerators: (<b>a</b>) The power generation principle of PENG with different types of materials: (i) inorganic piezoelectric crystals (ZnO) with asymmetric charge centers [<a href="#B42-polymers-16-00555" class="html-bibr">42</a>], (ii) Piezoelectric polymer with permanent dipole moment [<a href="#B43-polymers-16-00555" class="html-bibr">43</a>], (iii) Ionic hydrogel [<a href="#B44-polymers-16-00555" class="html-bibr">44</a>]. (<b>b</b>) The power generation principle of TriboENG [<a href="#B45-polymers-16-00555" class="html-bibr">45</a>]: (i) Triboelectric effect, (ii) Electrostatic effect. (<b>c</b>) Different types of ThermoENG [<a href="#B46-polymers-16-00555" class="html-bibr">46</a>]: (i) Conductive polymer-based thermal diffusion generator, (ii) Ion hydrogel-based thermal diffusion generator, (iii) Ionic hydrogel-based thermocouple generator. (<b>d</b>) The structure of OPNG [<a href="#B47-polymers-16-00555" class="html-bibr">47</a>]: (i) only one selective cation permeable membrane and (ii) both anion and cation selective permeable membranes: positive and negative ions move from high concentration side to low concentration side through cation selective permeable membrane and anion selective permeable membrane, respectively. (<b>e</b>) The formation method of MENG: (i) the asymmetric distribution of hygroscopic materials [<a href="#B48-polymers-16-00555" class="html-bibr">48</a>], (ii) the gradient distribution of oxygen-containing functional groups.</p>
Full article ">Figure 3
<p>Methods and schematic diagrams for improving the piezoelectric performance of PVDF: (<b>a</b>) PVDF with different crystal structures [<a href="#B68-polymers-16-00555" class="html-bibr">68</a>] and (<b>b</b>) PVDF with different conformational structures [<a href="#B68-polymers-16-00555" class="html-bibr">68</a>]: red, cyan, and blue spheres represent F, C, and H atoms. (<b>c</b>) The energy difference between PVDF α and β molecules [<a href="#B69-polymers-16-00555" class="html-bibr">69</a>]: the yellow, white, light blue, and gray balls represent gold, hydrogen, fluoride, and carbon atoms, respectively. (<b>d</b>) Local annealing treatment and changes in Raman spectra of materials before and after annealing treatment [<a href="#B69-polymers-16-00555" class="html-bibr">69</a>], (<b>e</b>) mechanical stretching and images of crystal phase changes before and after stretching [<a href="#B70-polymers-16-00555" class="html-bibr">70</a>], (<b>f</b>) different ways of electrode polarization [<a href="#B71-polymers-16-00555" class="html-bibr">71</a>], (<b>g</b>) the energy difference between the molecular structure of copolymers and those with different phases and isomorphic anti-plane phases with different proportions of TrFE co doping ΔE. Among them, 3/1-helix is the most stable [<a href="#B72-polymers-16-00555" class="html-bibr">72</a>].</p>
Full article ">Figure 4
<p>Schematic diagram of PEDOT: PSS structure: (<b>a</b>) Schematic diagram of PSS and PEDOT molecular structure [<a href="#B74-polymers-16-00555" class="html-bibr">74</a>], (<b>b</b>) The structure of PEDOT: PSS before and after treatment with dimethyl sulfone (DMSO<sub>2</sub>) [<a href="#B75-polymers-16-00555" class="html-bibr">75</a>], (<b>c</b>) Trifluoroacetic acid (TFA) [<a href="#B76-polymers-16-00555" class="html-bibr">76</a>] and (<b>d</b>) The effect of the degree of π-π contact between chains on conductivity: (i) The microstructure of intrinsic films of different modified polymers was studied using grazing incidence wide-angle X-ray scattering (GIWAXS) technology. The diffraction signal Qr ≈ 1.5 Å<sup>−1</sup> showed the anisotropic distribution of TBDOPV-T-518 in the layered side chain stacking material, indicating the positive orientation of TBDOPV-T-518 π stacking and the formation of ordered anisotropic arrangements on the molecular side chains. Changes in conductivity of TBDOPV-T-518 when using (ii) N-DMBI and (iii) FeCl<sub>3</sub> as dopants, respectively [<a href="#B77-polymers-16-00555" class="html-bibr">77</a>].</p>
Full article ">Figure 5
<p>Ionic hydrogels for different environment-induced power generation and their applications: (<b>a</b>) demonstration of piezoionic neuromodulation in a rodent modelt [<a href="#B44-polymers-16-00555" class="html-bibr">44</a>], (<b>b</b>) injectable and biodegradable PLLA-PENG for osteoarthritis treatment [<a href="#B109-polymers-16-00555" class="html-bibr">109</a>]. (<b>c</b>) PSSA/PAN-MENG made by electrospinning is used as a self-powered respiratory detector [<a href="#B110-polymers-16-00555" class="html-bibr">110</a>].</p>
Full article ">Figure 6
<p>Applications of natural polymer nanogenerators: (<b>a</b>) cellulose-based PENG with sponge structure is used as a wearable smart pressure sensor [<a href="#B116-polymers-16-00555" class="html-bibr">116</a>], (<b>b</b>) the self-powered air filter manufactured by CA/Ni-HITP TriboENG and the comparison of the number of submicron particles inside and outside the mask after wearing it for 2 h [<a href="#B117-polymers-16-00555" class="html-bibr">117</a>], (<b>c</b>) the structure of the acidic/alkaline whey protein film, the principle of power generation, and the picture of it powering the wireless position tracker at low humidity [<a href="#B118-polymers-16-00555" class="html-bibr">118</a>], (<b>d</b>) introducing ionic liquids into the internal solvent of the gel [<a href="#B119-polymers-16-00555" class="html-bibr">119</a>].</p>
Full article ">Figure 7
<p>Performance enhancement methods of polymer-based nanogenerators: (<b>a</b>) utilizing charged fragments [<a href="#B131-polymers-16-00555" class="html-bibr">131</a>] or (<b>b</b>) utilizing other substances possessing micro-nano pore structures [<a href="#B33-polymers-16-00555" class="html-bibr">33</a>] to creat a single charge channel, (<b>c</b>) utilizing ions with smaller radii as solutes [<a href="#B54-polymers-16-00555" class="html-bibr">54</a>], (<b>d</b>) introducing ionic liquids into the internal solvent of the gel [<a href="#B134-polymers-16-00555" class="html-bibr">134</a>], (<b>e</b>) configuring with a fence-like structure on the sliding surface of TriboENG [<a href="#B135-polymers-16-00555" class="html-bibr">135</a>], (<b>f</b>) increasing contact pressure and accelerate friction frequency to obtain a larger effective contact area [<a href="#B136-polymers-16-00555" class="html-bibr">136</a>], (<b>g</b>) creating an ion rectifier junction akin to a semiconductor [<a href="#B137-polymers-16-00555" class="html-bibr">137</a>].</p>
Full article ">
24 pages, 4634 KiB  
Article
Cellulose Acetate–Ionic Liquid Blends as Potential Polymers for Efficient CO2 Separation Membranes
by Giannis Kontos, Costas Tsioptsias and Ioannis Tsivintzelis
Polymers 2024, 16(4), 554; https://doi.org/10.3390/polym16040554 - 18 Feb 2024
Viewed by 1103
Abstract
CO2 capture, applied in CO2 separation from natural gas or in CO2/N2 separation from power plant flue gas streams, is of great importance for technical, economic, and environmental reasons. The latter seems important because CO2, as [...] Read more.
CO2 capture, applied in CO2 separation from natural gas or in CO2/N2 separation from power plant flue gas streams, is of great importance for technical, economic, and environmental reasons. The latter seems important because CO2, as a greenhouse gas, is considered the main contributor to global warming. Using polymeric membranes for CO2 separation presents several advantages, such as low energy demand, small equipment volume, and the absence of liquid waste. In this study, two ionic liquids (ILs) were used for the preparation of cellulose acetate (CA)–IL blend membranes for potential CO2 capture applications, namely, 1-butyl-3-methylimidazolium hydrogen sulfate ([Bmim+][HSO4]) and choline glycine ([Ch+]Gly), as they present adequate CO2 dissolution ability. The first IL is commercially available, whereas the latter was synthesized by a novel route. Several composite membranes were prepared through the solvent casting technique and characterized by a variety of methods, including thermogravimetry, calorimetry, FTIR spectroscopy, and X-ray diffraction. The CO2 sorption in the composite membranes was experimentally measured using the mass loss analysis (MLA) technique. The results showed that the ILs strongly interacted with the C=O groups of CA, which exhibited high affinity with CO2. In the case of [Bmim+][HSO4], a reduction in the available sites that allow strong intermolecular interactions with CO2 resulted in a decrease in CO2 sorption compared to that of pure CA. In the case of [Ch+]Gly, the reduction was balanced out by the presence of specific groups in the IL, which presented high affinity with CO2. Thus, the CA-[Ch+]Gly blend membranes exhibited increased CO2 sorption capability, in addition to other advantages such as non-toxicity and low cost. Full article
(This article belongs to the Section Polymer Membranes and Films)
Show Figures

Figure 1

Figure 1
<p>XRD patterns of CA-IL blends: (<b>a</b>) CA-<math display="inline"><semantics> <mrow> <mo stretchy="false">[</mo> <msup> <mrow> <mi>Ch</mi> </mrow> <mo>+</mo> </msup> <mo stretchy="false">]</mo> <mfenced close="]" open="["> <mrow> <msup> <mrow> <mi>Gly</mi> </mrow> <mo>−</mo> </msup> </mrow> </mfenced> </mrow> </semantics></math> and (<b>b</b>) CA-<math display="inline"><semantics> <mrow> <mo stretchy="false">[</mo> <msup> <mrow> <mi>Bmim</mi> </mrow> <mo>+</mo> </msup> <mo stretchy="false">]</mo> </mrow> </semantics></math>[<math display="inline"><semantics> <mrow> <msubsup> <mrow> <mrow> <mi mathvariant="sans-serif">H</mi> <mi>SO</mi> </mrow> </mrow> <mn>4</mn> <mo>−</mo> </msubsup> </mrow> </semantics></math>]. The numbers denote the % wt. IL in composite membranes. The dashed lines act as a visual guide.</p>
Full article ">Figure 2
<p>Degree of crystallinity as a function of IL content for CA-IL blends: (<b>a</b>) CA-<math display="inline"><semantics> <mrow> <mo stretchy="false">[</mo> <msup> <mrow> <mi>Ch</mi> </mrow> <mo>+</mo> </msup> <mo stretchy="false">]</mo> <mfenced close="]" open="["> <mrow> <msup> <mrow> <mi>Gly</mi> </mrow> <mo>−</mo> </msup> </mrow> </mfenced> </mrow> </semantics></math> and (<b>b</b>) CA-<math display="inline"><semantics> <mrow> <mo stretchy="false">[</mo> <msup> <mrow> <mi>Bmim</mi> </mrow> <mo>+</mo> </msup> <mo stretchy="false">]</mo> </mrow> </semantics></math>[<math display="inline"><semantics> <mrow> <msubsup> <mrow> <mrow> <mi mathvariant="sans-serif">H</mi> <mi>SO</mi> </mrow> </mrow> <mn>4</mn> <mo>−</mo> </msubsup> </mrow> </semantics></math>].</p>
Full article ">Figure 3
<p>FTIR spectra of CA-<math display="inline"><semantics> <mrow> <mo stretchy="false">[</mo> <msup> <mrow> <mi>Bmim</mi> </mrow> <mo>+</mo> </msup> <mo stretchy="false">]</mo> </mrow> </semantics></math>[<math display="inline"><semantics> <mrow> <msubsup> <mrow> <mrow> <mi mathvariant="sans-serif">H</mi> <mi>SO</mi> </mrow> </mrow> <mn>4</mn> <mo>−</mo> </msubsup> </mrow> </semantics></math>] membranes (with 0, 10, 20, 30% wt. <math display="inline"><semantics> <mrow> <mo stretchy="false">[</mo> <msup> <mrow> <mi>Bmim</mi> </mrow> <mo>+</mo> </msup> <mo stretchy="false">]</mo> </mrow> </semantics></math>[<math display="inline"><semantics> <mrow> <msubsup> <mrow> <mrow> <mi mathvariant="sans-serif">H</mi> <mi>SO</mi> </mrow> </mrow> <mn>4</mn> <mo>−</mo> </msubsup> </mrow> </semantics></math>]) in the region 4000–400 cm<sup>−1</sup>.</p>
Full article ">Figure 4
<p>CA spectrum and subtracted spectra of the blend membranes in the region 1900–1590 cm<sup>−1</sup> (the CA spectrum was subtracted from the blend membrane spectra).</p>
Full article ">Figure 5
<p>DSC and TGA curves of pure CA in the temperature range: (<b>a</b>) 0–450 °C and (<b>b</b>) 0–300 °C.</p>
Full article ">Figure 6
<p>DSC and TGA curves of a CA membrane doped with 10% wt. <math display="inline"><semantics> <mrow> <mo stretchy="false">[</mo> <msup> <mrow> <mi>Ch</mi> </mrow> <mo>+</mo> </msup> <mo stretchy="false">]</mo> <mfenced close="]" open="["> <mrow> <msup> <mrow> <mi>Gly</mi> </mrow> <mo>−</mo> </msup> </mrow> </mfenced> </mrow> </semantics></math> in the temperature range: (<b>a</b>) 0–450 °C and (<b>b</b>) 0–300 °C.</p>
Full article ">Figure 7
<p>DSC and TGA curves of a CA membrane doped with 10% wt. <math display="inline"><semantics> <mrow> <mo stretchy="false">[</mo> <msup> <mrow> <mi>Bmim</mi> </mrow> <mo>+</mo> </msup> <mo stretchy="false">]</mo> </mrow> </semantics></math>[<math display="inline"><semantics> <mrow> <msubsup> <mrow> <mrow> <mi mathvariant="sans-serif">H</mi> <mi>SO</mi> </mrow> </mrow> <mn>4</mn> <mo>−</mo> </msubsup> </mrow> </semantics></math>] in the temperature range: (<b>a</b>) 0–450 °C and (<b>b</b>) 0–300 °C.</p>
Full article ">Figure 8
<p>Thermogravimetric curve of pure <math display="inline"><semantics> <mrow> <mo stretchy="false">[</mo> <msup> <mrow> <mi>Ch</mi> </mrow> <mo>+</mo> </msup> <mo stretchy="false">]</mo> <mfenced close="]" open="["> <mrow> <msup> <mrow> <mi>Gly</mi> </mrow> <mo>−</mo> </msup> </mrow> </mfenced> </mrow> </semantics></math>.</p>
Full article ">Figure 9
<p>Thermogravimetric curves of pure <math display="inline"><semantics> <mrow> <mo stretchy="false">[</mo> <msup> <mrow> <mi>Bmim</mi> </mrow> <mo>+</mo> </msup> <mo stretchy="false">]</mo> </mrow> </semantics></math>[<math display="inline"><semantics> <mrow> <msubsup> <mrow> <mrow> <mi mathvariant="sans-serif">H</mi> <mi>SO</mi> </mrow> </mrow> <mn>4</mn> <mo>−</mo> </msubsup> </mrow> </semantics></math>] for weight loss range: (<b>a</b>) 0–100% and (<b>b</b>) 0–4%.</p>
Full article ">Figure 10
<p>Thermogravimetric curves of CA doped with (<b>a</b>) <math display="inline"><semantics> <mrow> <mo stretchy="false">[</mo> <msup> <mrow> <mi>Ch</mi> </mrow> <mo>+</mo> </msup> <mo stretchy="false">]</mo> <mfenced close="]" open="["> <mrow> <msup> <mrow> <mi>Gly</mi> </mrow> <mo>−</mo> </msup> </mrow> </mfenced> </mrow> </semantics></math> and (<b>b</b>) <math display="inline"><semantics> <mrow> <mo stretchy="false">[</mo> <msup> <mrow> <mi>Bmim</mi> </mrow> <mo>+</mo> </msup> <mo stretchy="false">]</mo> </mrow> </semantics></math>[<math display="inline"><semantics> <mrow> <msubsup> <mrow> <mrow> <mi mathvariant="sans-serif">H</mi> <mi>SO</mi> </mrow> </mrow> <mn>4</mn> <mo>−</mo> </msubsup> </mrow> </semantics></math>]. The numbers denote the % wt. IL content in the composite membranes.</p>
Full article ">Figure 11
<p>DSC heat flow curves of CA-IL blends obtained at a heating rate of 10 °C/min for (<b>a</b>) <math display="inline"><semantics> <mrow> <mo stretchy="false">[</mo> <msup> <mrow> <mi>Ch</mi> </mrow> <mo>+</mo> </msup> <mo stretchy="false">]</mo> <mfenced close="]" open="["> <mrow> <msup> <mrow> <mi>Gly</mi> </mrow> <mo>−</mo> </msup> </mrow> </mfenced> </mrow> </semantics></math> and (<b>b</b>) <math display="inline"><semantics> <mrow> <mo stretchy="false">[</mo> <msup> <mrow> <mi>Bmim</mi> </mrow> <mo>+</mo> </msup> <mo stretchy="false">]</mo> </mrow> </semantics></math>[<math display="inline"><semantics> <mrow> <msubsup> <mrow> <mrow> <mi mathvariant="sans-serif">H</mi> <mi>SO</mi> </mrow> </mrow> <mn>4</mn> <mo>−</mo> </msubsup> </mrow> </semantics></math>]. The numbers denote the % wt. IL content in the composite membranes.</p>
Full article ">Figure 12
<p>(<b>a</b>) CO<sub>2</sub> sorption isotherms at 35 °C and (<b>b</b>) trend of CO<sub>2</sub> sorption as a function of the IL content at 50 bar and 35 °C, for CA-<math display="inline"><semantics> <mrow> <mo stretchy="false">[</mo> <msup> <mrow> <mi>Ch</mi> </mrow> <mo>+</mo> </msup> <mo stretchy="false">]</mo> <mfenced close="]" open="["> <mrow> <msup> <mrow> <mi>Gly</mi> </mrow> <mo>−</mo> </msup> </mrow> </mfenced> </mrow> </semantics></math> blends.</p>
Full article ">Figure 13
<p>(<b>a</b>) CO<sub>2</sub> sorption isotherms at 35 °C and (<b>b</b>) trend of CO<sub>2</sub> sorption as a function of the IL content at 50 bar and 35 °C, for CA-<math display="inline"><semantics> <mrow> <mo stretchy="false">[</mo> <msup> <mrow> <mi>Bmim</mi> </mrow> <mo>+</mo> </msup> <mo stretchy="false">]</mo> </mrow> </semantics></math>[<math display="inline"><semantics> <mrow> <msubsup> <mrow> <mrow> <mi mathvariant="sans-serif">H</mi> <mi>SO</mi> </mrow> </mrow> <mn>4</mn> <mo>−</mo> </msubsup> </mrow> </semantics></math>] blends.</p>
Full article ">Figure 14
<p>Main intermolecular (dashed lines) and chemical interactions (red line) of CO<sub>2</sub> with <math display="inline"><semantics> <mrow> <mo stretchy="false">[</mo> <msup> <mrow> <mi>Ch</mi> </mrow> <mo>+</mo> </msup> <mo stretchy="false">]</mo> <mfenced close="]" open="["> <mrow> <msup> <mrow> <mi>Gly</mi> </mrow> <mo>−</mo> </msup> </mrow> </mfenced> </mrow> </semantics></math> and <math display="inline"><semantics> <mrow> <mo stretchy="false">[</mo> <msup> <mrow> <mi>Bmim</mi> </mrow> <mo>+</mo> </msup> <mo stretchy="false">]</mo> </mrow> </semantics></math>[<math display="inline"><semantics> <mrow> <msubsup> <mrow> <mrow> <mi mathvariant="sans-serif">H</mi> <mi>SO</mi> </mrow> </mrow> <mn>4</mn> <mo>−</mo> </msubsup> </mrow> </semantics></math>].</p>
Full article ">Figure 15
<p>Main CA-ILs with strong intermolecular interactions.</p>
Full article ">
34 pages, 11139 KiB  
Article
Kraft (Nano)Lignin as Reactive Additive in Epoxy Polymer Bio-Composites
by Christina P. Pappa, Simone Cailotto, Matteo Gigli, Claudia Crestini and Konstantinos S. Triantafyllidis
Polymers 2024, 16(4), 553; https://doi.org/10.3390/polym16040553 - 18 Feb 2024
Cited by 1 | Viewed by 2124
Abstract
The demand for high-performance bio-based materials towards achieving more sustainable manufacturing and circular economy models is growing significantly. Kraft lignin (KL) is an abundant and highly functional aromatic/phenolic biopolymer, being the main side product of the pulp and paper industry, as well as [...] Read more.
The demand for high-performance bio-based materials towards achieving more sustainable manufacturing and circular economy models is growing significantly. Kraft lignin (KL) is an abundant and highly functional aromatic/phenolic biopolymer, being the main side product of the pulp and paper industry, as well as of the more recent 2nd generation biorefineries. In this study, KL was incorporated into a glassy epoxy system based on the diglycidyl ether of bisphenol A (DGEBA) and an amine curing agent (Jeffamine D-230), being utilized as partial replacement of the curing agent and the DGEBA prepolymer or as a reactive additive. A D-230 replacement by pristine (unmodified) KL of up to 14 wt.% was achieved while KL–epoxy composites with up to 30 wt.% KL exhibited similar thermo-mechanical properties and substantially enhanced antioxidant properties compared to the neat epoxy polymer. Additionally, the effect of the KL particle size was investigated. Ball-milled kraft lignin (BMKL, 10 μm) and nano-lignin (NLH, 220 nm) were, respectively, obtained after ball milling and ultrasonication and were studied as additives in the same epoxy system. Significantly improved dispersion and thermo-mechanical properties were obtained, mainly with nano-lignin, which exhibited fully transparent lignin–epoxy composites with higher tensile strength, storage modulus and glass transition temperature, even at 30 wt.% loadings. Lastly, KL lignin was glycidylized (GKL) and utilized as a bio-based epoxy prepolymer, achieving up to 38 wt.% replacement of fossil-based DGEBA. The GKL composites exhibited improved thermo-mechanical properties and transparency. All lignins were extensively characterized using NMR, TGA, GPC, and DLS techniques to correlate and justify the epoxy polymer characterization results. Full article
(This article belongs to the Collection Lignin)
Show Figures

Figure 1

Figure 1
<p>(<b>a</b>) TGA and (<b>b</b>) DTG curves of the different lignin samples (N<sub>2</sub> atmosphere).</p>
Full article ">Figure 2
<p>(<b>a</b>) Nitrogen adsorption–desorption isotherms and (<b>b</b>) particle size distribution (PSD) of lignins.</p>
Full article ">Figure 3
<p>Morphological characterization by SEM of (<b>a</b>) pristine kraft lignin (KL), (<b>b</b>) ball-milled lignin (BMKL), (<b>c</b>) nano-lignin (NLH), and (<b>d</b>) glycidylized lignin (GKL).</p>
Full article ">Figure 4
<p>TEM images of NLH primary nanoparticles.</p>
Full article ">Figure 5
<p>(<b>a</b>) Two-dimensional-HSQC NMR spectra of pristine kraft (KL), ball-milled lignin (BMKL), nano-lignin (NLH), and glycidylized lignin (GKL). The aliphatic region is shown in the first row, while the aromatic region is shown in the second. (<b>b</b>) Chemical structures of the main identified motifs present in the lignin samples.</p>
Full article ">Figure 6
<p><sup>1</sup>H-NMR spectrum of the glycidylized kraft lignin (GKL). The characteristic epoxy ring peaks (H<sub>1</sub> and H’<sub>1</sub>) are identified and quantified.</p>
Full article ">Figure 7
<p>(<b>a</b>) FT-IR-ATR spectra and (<b>b</b>) DSC curves of pristine KL/DGEBA mixtures after curing stages: self-polymerization of DGEBA at 200 °C (black line), Stage 1—3 h at 75 °C followed by 3 h at 125 °C (orange line), and (Stage 2—3 h at 170 °C followed by 2 h at 200 °C (blue line).</p>
Full article ">Figure 8
<p>(<b>a</b>) Optical microscopy images of glassy lignin–epoxy composites containing 3 wt.% KL, prepared by Method A—stirring, Method B—sonication and Method C—combination of sonication and EtOH. (<b>b</b>) Respective photographs of the glassy lignin–epoxy composites (3 wt.% KL). Indicative lignin particles of increased size are indicated by arrows.</p>
Full article ">Figure 9
<p>(<b>a</b>,<b>b</b>) Optical microscopy images of lignin–epoxy composites with 3 wt.% BMKL, GKL, and NLH lignins. The composites were prepared using sonication (Method B) or a combination of sonication and EtOH (Method C). (<b>c</b>) Photographs of the corresponding lignin–epoxy composites with 3 wt.% lignin.</p>
Full article ">Figure 10
<p>(<b>a</b>) Stress–strain curves, (<b>b</b>) storage modulus E’ curves, and (<b>c</b>) tanD curves of pristine KL–epoxy composites. KL was used as curing agent, replacing 5 wt.% of D-230 (3 wt.% KL content in the composite), 10 wt.% of D-230 (6 wt.% KL content), and 14 wt.% of D-230 (9 wt.% KL content).</p>
Full article ">Figure 11
<p>Tensile strength of KL–epoxy composites. (<b>a</b>) Effect of the preparation methods. (<b>b</b>) Effect of KL loading.</p>
Full article ">Figure 12
<p>(<b>a</b>) Storage modulus and (<b>b</b>) tanD vs. temperature curves of initial (KL) and modified (BMKL and NLH) lignin–epoxy composites.</p>
Full article ">Figure 13
<p>Stress–strain curves of (<b>a</b>) BMKL- and (<b>b</b>) NLH-epoxy composites.</p>
Full article ">Figure 14
<p>Stress–strain curves of glycidylized lignin GKL–epoxy composites after the replacement of 4 wt.%–50 wt.% of DGEBA with GKL.</p>
Full article ">Figure 15
<p>(<b>a</b>) Storage modulus and (<b>b</b>) tanD vs. temperature curves of glycidylized lignin GKL–epoxy composites, with GKL lignin as the DGEBA replacement in various percentages.</p>
Full article ">Figure 16
<p>TGA/DTG curves of KL–epoxy composites showing the effect of KL loading.</p>
Full article ">Figure 17
<p>TGA/DTG curves of lignin-containing composites. (<b>a</b>) Effect of a 9 wt.% content of various lignins in composites, and (<b>b</b>) effect of D230 and DGEBA replacement by 9 wt.% KL and GKL, respectively.</p>
Full article ">Figure 18
<p>Antioxidant activity of (<b>a</b>) KL lignin in epoxy composites at various contents (3–9 wt.%) and (<b>b</b>) various lignins at a 3 wt.% content in epoxy composites.</p>
Full article ">Figure 19
<p>Antioxidant activity of KL lignin vs. GKL lignin in epoxy composites.</p>
Full article ">Figure 20
<p>Solvent (EtOH) resistance (expressed as weight uptake) of the pristine epoxy polymer and the lignin–epoxy composites with various contents (3% relative standard deviation).</p>
Full article ">Scheme 1
<p>Proposed lignin/DGEBA/diamine crosslinking mechanism. Lignin can be utilized as a reactive additive or act both as a curing agent via its reactive Ohs or as an epoxy prepolymer via its epoxy rings (after glycidylation).</p>
Full article ">
12 pages, 9342 KiB  
Article
Flame-Retardant Thermoplastic Polyether Ester/Aluminum Butylmethylphosphinate/Phenolphthalein Composites with Enhanced Mechanical Properties and Antidripping
by Xue Yang, Yan Zhang, Jia Chen, Liyong Zou, Xuesong Xing, Kangran Zhang, Jiyan Liu and Xueqing Liu
Polymers 2024, 16(4), 552; https://doi.org/10.3390/polym16040552 - 18 Feb 2024
Cited by 1 | Viewed by 857
Abstract
Aluminum butylmethylphosphinate AiBMP as a flame retardant and phenolphthalein as a synergistic agent were applied in a thermoplastic polyester elastomer (TPEE)) in the current study. The thermal properties, flame retardancy, crystallization and mechanical properties of TPEE/AiMBP with or without phenolphthalein were investigated using [...] Read more.
Aluminum butylmethylphosphinate AiBMP as a flame retardant and phenolphthalein as a synergistic agent were applied in a thermoplastic polyester elastomer (TPEE)) in the current study. The thermal properties, flame retardancy, crystallization and mechanical properties of TPEE/AiMBP with or without phenolphthalein were investigated using various characterizations, including the limiting oxygen index (LOI), vertical burning test (UL 94), thermogravimetric analysis TG, differential scanning calorimetry, microcombustion calorimeter (MCC), scanning electron microscopy (SEM), and mechanical tests. The results revealed that AiBMP alone is an efficient flame retardant of TPEE. Adding 15 wt.% AiBMP increases the LOI value of TPEE from 20% to 36%. The formula TPEE-15 AiBMP passed the UL 94 V-0 rating with no dripping occurring. The MCC test shows that AiBMP depresses the heat release of TPEE. In comparison with pure TPEE, the heat release rate at peak temperature and the heat release capacity of TPEE-15AiBMP are reduced by 46.1% and 55.5%, respectively. With the phenolphthalein added, the formula TPEE/13AiBMP/2Ph shows a higher char yield at high temperatures (>600 °C), and the char layer is stronger and more condensed than TPEE-15AiBMP.The tensile strength and elongation at break values of TPEE-13AiBMP-2Ph are increased by 29.63% and 4.8% in comparison with TPEE-15AiBMP. The SEM morphology of the fracture surface of the sample shows that phenolphthalein acts as a plasticizer to improve the dispersion of AiBMP within the matrix. The good char charming ability of phenolphthalein itself and improved dispersion of AiBMP make the TPEE composites achieve both satisfying flame retardancy and high mechanical properties. Full article
(This article belongs to the Special Issue Advance in Polymer Composites: Fire Protection and Thermal Management)
Show Figures

Figure 1

Figure 1
<p>(<b>a</b>) XRD spectra, (<b>b</b>)XRF, (<b>c</b>) morphology and (<b>d</b>) FTIR spectra of AiBMP.</p>
Full article ">Figure 2
<p>Heat release rate vs. temperature of samples.</p>
Full article ">Figure 3
<p>(<b>a</b>) TG and (<b>b</b>) DTG curves of TPEE, phenolphthalein and AiBMP in N<sub>2</sub>. (<b>c</b>) TG and (<b>d</b>) DTG curves of TPEE composites in N<sub>2</sub>. (<b>c′</b>) TG curves of TPEE composites between 500–700 °C in N<sub>2</sub>, (<b>d′</b>) DTG curves of TPEE composites between 300–450 °C in N<sub>2</sub>.</p>
Full article ">Figure 4
<p>SEM (upper) and digital photos (bottom) of the residues TPEE (<b>a</b>), TPEE-15AiBMP (<b>b</b>) and TPEE-13AiBMP-2Ph (<b>c</b>) obtained by heating samples at 500 °C for 5 min.</p>
Full article ">Figure 5
<p>DSC curves of heating and subsequent cooling for samples.</p>
Full article ">Figure 6
<p>Tensile properties of samples at a crosshead speed of 25 mm/min.</p>
Full article ">Figure 7
<p>SEM images of fractured surface for TPEE (<b>a</b>), TPEE-15AiBMP (<b>b</b>) and TPEE-13AiBMP-2Ph (<b>c</b>).</p>
Full article ">
17 pages, 5363 KiB  
Article
Lignocellulosic Membranes Grafted with N-Vinylcaprolactam Using Radiation Chemistry: Load and Release Capacity of Vancomycin
by Maite Rentería-Urquiza, Guadalupe Gabriel Flores-Rojas, Belén Gómez-Lázaro, Felipe López-Saucedo, Ricardo Vera-Graziano, Eduardo Mendizabal and Emilio Bucio
Polymers 2024, 16(4), 551; https://doi.org/10.3390/polym16040551 - 18 Feb 2024
Viewed by 941
Abstract
Radiation chemistry presents a unique avenue for developing innovative polymeric materials with desirable properties, eliminating the need for chemical initiators, which can be potentially detrimental, especially in sensitive sectors like medicine. In this investigation, we employed a radiation-induced graft polymerization process with N-vinylcaprolactam [...] Read more.
Radiation chemistry presents a unique avenue for developing innovative polymeric materials with desirable properties, eliminating the need for chemical initiators, which can be potentially detrimental, especially in sensitive sectors like medicine. In this investigation, we employed a radiation-induced graft polymerization process with N-vinylcaprolactam (NVCL) to modify lignocellulosic membranes derived from Agave salmiana, commonly known as maguey. The membranes underwent thorough characterization employing diverse techniques, including contact angle measurement, degree of swelling, scanning electron microscopy (SEM), atomic force microscopy (AFM), Fourier-transform infrared-attenuated total reflectance spectroscopy (FTIR-ATR), nuclear magnetic resonance (CP-MAS 13C-NMR), X-ray photoelectron spectroscopy (XPS), and uniaxial tensile mechanical tests. The membranes’ ability to load and release an antimicrobial glycopeptide drug was assessed, revealing significant enhancements in both drug loading and sustained release. The grafting of PNVCL contributed to prolonged sustained release by decreasing the drug release rate at temperatures above the LCST. The release profiles were analyzed using the Higuchi, Peppas–Sahlin, and Korsmeyer–Peppas models, suggesting a Fickian transport mechanism as indicated by the Korsmeyer–Peppas model. Full article
(This article belongs to the Special Issue Polymers in Pharmaceutical Technology II)
Show Figures

Graphical abstract

Graphical abstract
Full article ">Figure 1
<p>(<b>a</b>) Illustration of gamma ray-induced graft polymerization. (<b>b</b>) Grafting percentage versus irradiation dose with a monomer concentration of 50 g/v %. (<b>c</b>) Grafting percentage versus monomer concentration at an irradiation dose of 20 kGy.</p>
Full article ">Figure 2
<p>(<b>a</b>) Images of contact angle at 25 °C, 1 min; (<b>b</b>) relationship between the water contact angle at 25 °C and the PNVCL grafting percentage onto MS membranes, with the contact angles recorded in both sides of the membrane at 1 and 5 min; and (<b>c</b>) thermal responsiveness of MS-g-NVCL membranes with different grafting percentages. The LCST is indicated in the graph.</p>
Full article ">Figure 3
<p>FTIR-ATR spectra of both sides of the MS and MS-g-NVCL (13.2 %) membranes, and PNVCL obtained by gamma rays. Samples labeled with (a) and (b) are the inner and outer side, respectively.</p>
Full article ">Figure 4
<p>CP-MAS <sup>13</sup>C-NMR spectra of MS, PNVCL homopolymer, and MS-g-NVCL (13.2%) membranes. C-*, polymer aliphatic chain carbon.</p>
Full article ">Figure 5
<p>XPS survey spectra of membranes of both inner (labeled with a) and outer (labeled with b) sides with different grafting percentages and PNVCL.</p>
Full article ">Figure 6
<p>Deconvolution of XPS spectra corresponding to C1s and O1s of (<b>a</b>) PNVCL and (<b>b</b>) and (<b>c</b>) the inner and outer side of the MS membrane; (<b>d</b>) and (<b>e</b>) correspond to the inner and outer side of the MS-g-NVCL (13.2%) membrane, respectively.</p>
Full article ">Figure 7
<p>Tensile stress–strain curves of MS and MS-g-NVCL membranes with different graft percentages.</p>
Full article ">Figure 8
<p>(<b>a</b>) SEM and (<b>b</b>) AFM images of MS and MS-g-NVCL (13.2%) membranes with different magnifications of the inner and outer sides.</p>
Full article ">Figure 9
<p>Kinetics of (<b>a</b>) loading of vancomycin at 25 °C, (<b>b</b>) release of vancomycin at 25 °C, (<b>c</b>) release of vancomycin at 40 °C, and (<b>d</b>) percentage and amount of drug released versus graft percentage of PNVCL at 3060 min.</p>
Full article ">Figure 10
<p>Illustration depicting the influence of the LCST of PNVCL graft on the release of vancomycin.</p>
Full article ">Figure 11
<p>Fitting of mathematical models of drug release at 60% for MS and MS-g-NVCL membranes at 25 °C with grafting percentages of 0.8%, 4.6%, and 13.2%.</p>
Full article ">
25 pages, 5890 KiB  
Article
Sustainable Innovation: Fabrication and Characterization of Mycelium-Based Green Composites for Modern Interior Materials Using Agro-Industrial Wastes and Different Species of Fungi
by Worawoot Aiduang, Kritsana Jatuwong, Praween Jinanukul, Nakarin Suwannarach, Jaturong Kumla, Wandee Thamjaree, Thana Teeraphantuvat, Tanut Waroonkun, Rawiwan Oranratmanee and Saisamorn Lumyong
Polymers 2024, 16(4), 550; https://doi.org/10.3390/polym16040550 - 18 Feb 2024
Cited by 2 | Viewed by 1805
Abstract
Mycelium-based bio-composites (MBCs) represent a sustainable and innovative material with high potential for contemporary applications, particularly in the field of modern interior design. This research investigates the fabrication of MBCs for modern interior materials using agro-industrial wastes (bamboo sawdust and corn pericarp) and [...] Read more.
Mycelium-based bio-composites (MBCs) represent a sustainable and innovative material with high potential for contemporary applications, particularly in the field of modern interior design. This research investigates the fabrication of MBCs for modern interior materials using agro-industrial wastes (bamboo sawdust and corn pericarp) and different fungal species. The study focuses on determining physical properties, including moisture content, shrinkage, density, water absorption, volumetric swelling, thermal degradation, and mechanical properties (bending, compression, impact, and tensile strength). The results indicate variations in moisture content and shrinkage based on fungal species and substrate types, with bamboo sawdust exhibiting lower shrinkage. The obtained density values range from 212.31 to 282.09 kg/m3, comparable to traditional materials, suggesting MBCs potential in diverse fields, especially as modern interior elements. Water absorption and volumetric swelling demonstrate the influence of substrate and fungal species, although they do not significantly impact the characteristics of interior decoration materials. Thermal degradation analysis aligns with established patterns, showcasing the suitability of MBCs for various applications. Scanning electron microscope observations reveal the morphological features of MBCs, emphasizing the role of fungal mycelia in binding substrate particles. Mechanical properties exhibit variations in bending, compression, impact, and tensile strength, with MBCs demonstrating compatibility with traditional materials used in interior elements. Those produced from L. sajor-caju and G. fornicatum show especially promising characteristics in this context. Particularly noteworthy are their superior compression and impact strength, surpassing values observed in certain synthetic foams multiple times. Moreover, this study reveals the biodegradability of MBCs, reaching standards for environmentally friendly materials. A comprehensive comparison with traditional materials further supports the potential of MBCs in sustainable material. Challenges in standardization, production scalability, and market adoption are identified, emphasizing the need for ongoing research, material engineering advancements, and biotechnological innovations. These efforts aim to enhance MBC properties, promoting sustainability in modern interior applications, while also facilitating their expansion into mass production within the innovative construction materials market. Full article
(This article belongs to the Special Issue Polymer Composites in Waste Recycling)
Show Figures

Figure 1

Figure 1
<p>Designing molds for molding MBCs involves distinct examinations utilizing drawings created with Google SketchUp program version 8 for Windows: (<b>A</b>) molds for shaping MBCs in compression strength and water absorption tests, (<b>B</b>) molds for shaping MBCs in tensile strength tests, (<b>C</b>) molds for shaping MBCs in bending strength tests, (<b>D</b>) molds for shaping MBCs in impact strength tests, and (<b>E</b>) molds for shaping MBCs in soil burial tests.</p>
Full article ">Figure 2
<p>The obtained MBC samples in this study were derived from <span class="html-italic">Lentinus sajor-caju</span> and <span class="html-italic">Ganoderma fornicatum</span> in each substrate: (<b>A</b>) samples for compression and water absorption tests, (<b>B</b>) samples for tensile strength test, (<b>C</b>) samples for bending strength test, (<b>D</b>) samples for impact strength test, and (<b>E</b>) samples for soil burial test.</p>
Full article ">Figure 3
<p>The moisture content (<b>A</b>), average shrinkage (<b>B</b>), and density (<b>C</b>) of the MBCs obtained in this study. The data are expressed as means with error bars representing the ± standard deviation. In the same experiment of each substrate type (depicted in the same color), different letters indicate significant differences according to Duncan’s multiple range test (<span class="html-italic">p</span> ≤ 0.05).</p>
Full article ">Figure 4
<p>The water absorption abilities (<b>A</b>) and volumetric swelling levels (<b>B</b>) of the MBCs were obtained in this investigation. The presented data represents means, with error bars at each point indicating the ± standard deviation. In (<b>A</b>), “*” signifies a significant difference based on Duncan’s multiple range test (<span class="html-italic">p</span> ≤ 0.05) at each point. In the experiment for each substrate type (<b>B</b>), different letters denote significant differences according to Duncan’s multiple range test (<span class="html-italic">p</span> ≤ 0.05).</p>
Full article ">Figure 5
<p>Thermogravimetric analysis of MBCs produced in this study utilizing a combination of each fungal species with bamboo sawdust (<b>A</b>) and corn pericarp (<b>B</b>).</p>
Full article ">Figure 6
<p>The scanning electron microscopic images of MBCs obtained in this study: The original bamboo sawdust (<b>A</b>) and corn pericarp (<b>B</b>) particles. The surfaces of MBCs produced from bamboo sawdust combined with <span class="html-italic">G. fornicatum</span> (<b>C</b>), <span class="html-italic">G. williamsianum</span> (<b>D</b>), <span class="html-italic">L. sajor-caju</span> (<b>E</b>), <span class="html-italic">T. coccinea</span> (<b>F</b>), and <span class="html-italic">S. commune</span> (<b>G</b>). The surfaces of MBCs produced from corn pericarp combined with <span class="html-italic">G. fornicatum</span> (<b>H</b>), <span class="html-italic">G. williamsianum</span> (<b>I</b>), <span class="html-italic">L. sajor-caju</span> (<b>J</b>), <span class="html-italic">T. coccinea</span> (<b>K</b>), and <span class="html-italic">S. commune</span> (<b>L</b>). The cross-sectional structure of MBCs derived from bamboo sawdust combined with <span class="html-italic">L. sajor-caju</span> (<b>M</b>) and corn pericarp combined with <span class="html-italic">G. fornicatum</span> (<b>N</b>). Yellow arrows represented the internal structure of the MBCs, consisting of air-voids, fungal mycelia, and substrate.</p>
Full article ">Figure 7
<p>Bending (<b>A</b>), compression (<b>B</b>), and impact strengths (<b>C</b>) of MBCs produced from a combination of each fungal species with bamboo sawdust and corn pericarp. The presented data consists of means, with error bars at each point indicating the ± standard deviation. Significance in differences within the same experiment for each substrate type (depicted in the same color) is determined by Duncan’s multiple range test, where distinct letters denote statistical significance (<span class="html-italic">p</span> ≤ 0.05).</p>
Full article ">Figure 8
<p>Tensile strength (<b>A</b>) and elongation at break (<b>B</b>) of MBCs produced from a combination of each fungal species with bamboo sawdust and corn pericarp. The presented data shows means, and error bars at each point indicate the ± standard deviation. Significance in differences within the same experiment for each substrate type (depicted in the same color) is determined by Duncan’s multiple range test, where distinct letters denote statistical significance (<span class="html-italic">p</span> ≤ 0.05).</p>
Full article ">Figure 9
<p>The cumulative percentage of weight loss for the MBC samples used in this investigation that were buried in soil. The weight loss percentage of the MBCs derived from bamboo sawdust (<b>A</b>) and corn pericarp (<b>B</b>). The data is presented as means, and error bars at each point indicate the ± standard deviation. The “*” symbol indicates a significant difference based on Duncan’s multiple range test (<span class="html-italic">p</span> ≤ 0.05) at each point.</p>
Full article ">Figure 10
<p>The possibility for next-generation environmentally friendly interior elements made from MBC materials, contributing to environmental protection within a circular economy system.</p>
Full article ">
10 pages, 837 KiB  
Article
Effect of Different Post-Curing Methods on the Degree of Conversion of 3D-Printed Resin for Models in Dentistry
by Scott Kirby, Igor Pesun, Anthony Nowakowski and Rodrigo França
Polymers 2024, 16(4), 549; https://doi.org/10.3390/polym16040549 - 18 Feb 2024
Cited by 2 | Viewed by 1190
Abstract
The aim was to investigate the effects of different post-curing units on the chemical properties (degree of conversion) of 3D-printed resins for producing models in dentistry. The goal is to determine whether less-expensive post-curing units can be a viable alternative to the manufacturer’s [...] Read more.
The aim was to investigate the effects of different post-curing units on the chemical properties (degree of conversion) of 3D-printed resins for producing models in dentistry. The goal is to determine whether less-expensive post-curing units can be a viable alternative to the manufacturer’s recommended units. Forty-five samples were fabricated with an LCD printer (Phrozen Sonic Mini, Phrozen 3D, Hsinchu City, Taiwan) using MSLA Dental Modeling Resin (Apply Lab Work, Torrance, CA, USA). These samples were divided randomly into four different groups for post-curing using four distinct curing units: Phrozen Cure V2 (Phrozen 3D, Hsinchu City, Taiwan), a commercial acrylic nail UV LED curing unit (SUNUV, Shenzhen, China), a homemade curing unit created from a readily available UV LED light produced (Shenzhen, China), and the Triad® 2000™ tungsten halogen light source (Dentsply Sirona, York, PA, USA). The degree of conversion was measured with FTIR spectroscopy using a Nicolet 6700 FTIR Spectrometer (Thermo Fisher Scientific, Waltham, MA, USA). Phrozen Cure V2 had the highest overall mean degree of conversion (69.6% with a 45 min curing time). The Triad® 2000 VLC Curing Unit had the lowest mean degree of conversion value at the 15 min interval (66.2%) and the lowest mean degree of conversion at the 45 min interval with the homemade curing unit (68.2%). The type of light-curing unit did not yield statistically significant differences in the degree of conversion values. There was a statistically significant difference in the degree of conversion values between the 15 min and 45 min curing intervals. When comparing individual light-curing units, there was a statistically significant difference in the degree of conversion for the post-curing units between the 15 min and 45 min curing time (p = 0.029). Full article
(This article belongs to the Special Issue 3D Printing Polymer: Processing and Fabrication)
Show Figures

Figure 1

Figure 1
<p>FTIR spectra from 1500 cm<sup>−1</sup> to 1650 cm<sup>−1</sup> for all tested groups compared with uncured baseline.</p>
Full article ">Figure 2
<p>Mean and standard deviation for the degree of conversion (%) for HC = homemade curing unit, NC = SUNUV nail curing unit, PC = Phrozen Cure V2, TC = Triad<sup>®</sup> 2000 VLC Curing Unit.</p>
Full article ">
26 pages, 3071 KiB  
Article
Impact of Eco-Friendly Plaster Using Epoxy Resin and Epoxy Hardener on Mechanical Properties under Compression and Tension
by Mohammed A. Albadrani and Ahmed D. Almutairi
Polymers 2024, 16(4), 548; https://doi.org/10.3390/polym16040548 - 18 Feb 2024
Viewed by 1254
Abstract
BISCO plaster (BRP) is an environmentally friendly material with high mechanical properties and is considered a great elective to conventional materials such as gypsum and cement. Our investigation seeks to examine BISCO plaster (BRP) and a mixture of resin and hardener in three [...] Read more.
BISCO plaster (BRP) is an environmentally friendly material with high mechanical properties and is considered a great elective to conventional materials such as gypsum and cement. Our investigation seeks to examine BISCO plaster (BRP) and a mixture of resin and hardener in three proportions (30%, 45%, and 60%) to achieve our ultimate goal, which is to preserve the environment and achieve the vision of the Kingdom of Saudi Arabia 2030 to reach zero carbon emissions by 2060? Emissions tests were performed, and although the CO2 level was zero, they emitted SO2 sulfur dioxide and NO2 nitrogen dioxide, and 60% was the lowest emission rate. We also used ANSYS 2023 R1 software to compare them with their mechanical properties resulting from tensile and compression testing. In this study, we looked closely at the mechanical characteristics of different materials designed for wall coverings, with particular emphasis on their environmental sustainability. We carried out experiments to gauge the tensile and compressive stress on samples with varying mixing ratios. Our main objective was on crucial mechanical properties such as the modulus of elasticity, ultimate tensile strength, yield strength, yield strain, modulus of resilience, and ductility. Through meticulous scrutiny, we determined that the amalgamation of these mechanical attributes at the 30% mixing ratio provides an optimal combination for attaining structural integrity, adaptability, and resilience in wall coverings. Significantly, this ratio also underscores a commitment to environmentally conscious material selection. Our study offers important new insights into the selection of wall covering materials by providing a detailed understanding of their mechanical behavior under various stress conditions. It aligns with the increasing significance of environmental responsibility in contemporary design and construction. By emphasizing the 30% mixing ratio, our findings establish a foundation for informed decision making, promoting the utilization of sustainable materials that achieve a balance between strength, flexibility, and longevity. This ensures optimal performance in practical applications while simultaneously minimizing the environmental impact. Full article
(This article belongs to the Section Polymer Applications)
Show Figures

Figure 1

Figure 1
<p>Tensile and compression testing device MTS.</p>
Full article ">Figure 2
<p>Simulation in ANSYS program.</p>
Full article ">Figure 3
<p>Emission Test setup.</p>
Full article ">Figure 4
<p>The sample (during) Compression test of BSCO Plaster 30%.</p>
Full article ">Figure 5
<p>Stress–strain curve in Compression test of BSCO Plaster 30%.</p>
Full article ">Figure 6
<p>The sample (during) Compression test of BSCO Plaster 45%.</p>
Full article ">Figure 7
<p>Stress–strain curve in Compression test of BSCO Plaster 45%.</p>
Full article ">Figure 8
<p>The sample (during) Compression test of BSCO Plaster 60%.</p>
Full article ">Figure 9
<p>Stress–strain curve in Compression of BSCO Plaster 60%.</p>
Full article ">Figure 10
<p>Pictures of the sample (during) Tensile test of BSCO Plaster 30%.</p>
Full article ">Figure 11
<p>Stress–strain curve in Tensile test of BSCO Plaster 30%.</p>
Full article ">Figure 12
<p>The sample (during) Tensile test of BSCO Plaster 45%.</p>
Full article ">Figure 13
<p>Stress–strain curve in Tensile test of BSCO Plaster 45%.</p>
Full article ">Figure 14
<p>The sample (during) Tensile test of BSCO Plaster 60%.</p>
Full article ">Figure 15
<p>Stress–strain curve in Tensile test of BSCO Plaster 60%.</p>
Full article ">
20 pages, 5061 KiB  
Article
In Situ Study and Improvement of the Temperature Increase and Isothermal Retention Stages in the Polyacrylonitrile (PAN) Fiber Pre-Oxidation Process
by Ye Cui, Lizhi Liu, Lixin Song, Sanxi Li, Ying Wang, Ying Shi and Yuanxia Wang
Polymers 2024, 16(4), 547; https://doi.org/10.3390/polym16040547 - 18 Feb 2024
Cited by 2 | Viewed by 905
Abstract
The pre-oxidation process of Polyacrylonitrile (PAN) fibers is a complex procedure involving multiple stages of temperature increase and isothermal temperature retention. However, the impact of the temperature increase stage on PAN fiber has often been overlooked. To address this, samples were collected before [...] Read more.
The pre-oxidation process of Polyacrylonitrile (PAN) fibers is a complex procedure involving multiple stages of temperature increase and isothermal temperature retention. However, the impact of the temperature increase stage on PAN fiber has often been overlooked. To address this, samples were collected before and after the temperature increase and isothermal retention stages, treating them as separate influencing factors. Therefore, the pre-oxidation process can be divided into four distinct stages: (1) A temperature increase stage before the cyclization reactions: the PAN fiber’s small-size crystals melt, and the crystal orientation changes under fixed tension, leading to shrinkage and increased orientation of the micropore. (2) An isothermal retention stage before the cyclization reactions: The crystal structure maintains well, resulting in minimal micropore evolution. The PAN fiber’s crystal orientation and micropore orientation increased under fixed tension. (3) A temperature increase stage after the cyclization reactions: The PAN fiber’s crystal melts again, reducing the average chord length and relative volume of the micropore. However, the PAN fiber can recrystallize under fixed tension. (4) An isothermal retention stage after the cyclization reactions: Significant crystal melting of the PAN fiber occurs, but the highly oriented crystals are maintained well. The average chord length and relative volume of the micropore increase. Recommendations for improving the pre-oxidation process are made according to these stages. Full article
(This article belongs to the Special Issue Polymer-Based Carbon Fiber Composites)
Show Figures

Figure 1

Figure 1
<p>Schematic diagram of PAN fiber A preparation (<b>A</b>) and carbon fiber preparation (<b>B</b>).</p>
Full article ">Figure 2
<p>Schematic diagram of PAN fiber in situ SAXS/WAXD analysis.</p>
Full article ">Figure 3
<p>Schematic diagram of the fiber fixing method in the aluminum DSC pans.</p>
Full article ">Figure 4
<p>DSC thermograms of PAN fiber A heated at 10 °C/min in nitrogen.</p>
Full article ">Figure 5
<p>2D diffraction patterns of different carbon fibers at room temperature: (<b>a</b>) T800 carbon fiber, and (<b>b</b>) carbon fiber A prepared from PAN fiber.</p>
Full article ">Figure 6
<p>Linear WAXD profiles of carbon fibers along the fiber axis directions (<b>a</b>) and perpendicular to fiber axis directions (<b>b</b>) for a 10° integral range. Carbon fiber A was prepared from PAN fiber A (gray line) and T800 carbon fiber (black line).</p>
Full article ">Figure 7
<p>Schematic diagram of intensity integration along the azimuth (<b>A</b>) and S<sup>2</sup>~<math display="inline"><semantics> <mrow> <msup> <mrow> <mi mathvariant="normal">S</mi> </mrow> <mrow> <mn>2</mn> </mrow> </msup> <msubsup> <mrow> <mi mathvariant="normal">B</mi> </mrow> <mrow> <mrow> <mrow> <mi>π</mi> </mrow> <mo>/</mo> <mrow> <mn>2</mn> </mrow> </mrow> </mrow> <mrow> <mn>2</mn> </mrow> </msubsup> </mrow> </semantics></math>(S) plot of T800 carbon fiber (<b>B</b>).</p>
Full article ">Figure 8
<p>2D SASX patterns at room temperature (<b>A</b>); Linear SAXS Profiles of Toray T800 carbon fiber (black line) and carbon fiber A prepared from PAN fiber (gray line) in the transverse directions (<b>B</b>), where s = |s| = (2 sin θ)/λ, θ is the Bragg angle, and λ is the wavelength.</p>
Full article ">Figure 9
<p>2D diffraction patterns of PAN fiber A during in situ study of the pre-oxidation process.</p>
Full article ">Figure 10
<p>Linear WAXD profiles of PAN fiber A during in situ study of the pre-oxidation process in the transverse directions (integral range 10°): (<b>A</b>) The pre-oxidation process of PAN fiber A at the temperature increase stage from 25 °C to the isothermal retention stages of 220 °C; (<b>B</b>) The pre-oxidation process of PAN fiber A at the isothermal retention stages of 220 °C to the isothermal retention stages of 270 °C.</p>
Full article ">Figure 11
<p>The crystal structure model of the PAN fiber during the pre-oxidation process.</p>
Full article ">Figure 12
<p>2D SAXS patterns of PAN fiber A during the pre-oxidation process.</p>
Full article ">Figure 13
<p>(<b>A</b>,<b>B</b>) Linear SAXS profiles of PAN fiber A during the pre-oxidation process, and (<b>C</b>,<b>D</b>) S<sub>2</sub>~<math display="inline"><semantics> <mrow> <msup> <mrow> <mi mathvariant="normal">S</mi> </mrow> <mrow> <mn>2</mn> </mrow> </msup> <msubsup> <mrow> <mi mathvariant="normal">B</mi> </mrow> <mrow> <mrow> <mrow> <mi>π</mi> </mrow> <mo>/</mo> <mrow> <mn>2</mn> </mrow> </mrow> </mrow> <mrow> <mn>2</mn> </mrow> </msubsup> </mrow> </semantics></math> (S) plot of PAN fiber A during the pre-oxidation process.</p>
Full article ">Figure 13 Cont.
<p>(<b>A</b>,<b>B</b>) Linear SAXS profiles of PAN fiber A during the pre-oxidation process, and (<b>C</b>,<b>D</b>) S<sub>2</sub>~<math display="inline"><semantics> <mrow> <msup> <mrow> <mi mathvariant="normal">S</mi> </mrow> <mrow> <mn>2</mn> </mrow> </msup> <msubsup> <mrow> <mi mathvariant="normal">B</mi> </mrow> <mrow> <mrow> <mrow> <mi>π</mi> </mrow> <mo>/</mo> <mrow> <mn>2</mn> </mrow> </mrow> </mrow> <mrow> <mn>2</mn> </mrow> </msubsup> </mrow> </semantics></math> (S) plot of PAN fiber A during the pre-oxidation process.</p>
Full article ">Figure 14
<p>The micropore model of the PAN fiber during the pre-oxidation process.</p>
Full article ">
31 pages, 7722 KiB  
Review
Advances in Monte Carlo Method for Simulating the Electrical Percolation Behavior of Conductive Polymer Composites with a Carbon-Based Filling
by Zhe Zhang, Liang Hu, Rui Wang, Shujie Zhang, Lisong Fu, Mengxuan Li and Qi Xiao
Polymers 2024, 16(4), 545; https://doi.org/10.3390/polym16040545 - 18 Feb 2024
Cited by 2 | Viewed by 2020
Abstract
Conductive polymer composites (CPCs) filled with carbon-based materials are widely used in the fields of antistatic, electromagnetic interference shielding, and wearable electronic devices. The conductivity of CPCs with a carbon-based filling is reflected by their electrical percolation behavior and is the focus of [...] Read more.
Conductive polymer composites (CPCs) filled with carbon-based materials are widely used in the fields of antistatic, electromagnetic interference shielding, and wearable electronic devices. The conductivity of CPCs with a carbon-based filling is reflected by their electrical percolation behavior and is the focus of research in this field. Compared to experimental methods, Monte Carlo simulations can predict the conductivity and analyze the factors affecting the conductivity from a microscopic perspective, which greatly reduces the number of experiments and provides a basis for structural design of conductive polymers. This review focuses on Monte Carlo models of CPCs with a carbon-based filling. First, the theoretical basis of the model’s construction is introduced, and a Monte Carlo simulation of the electrical percolation behaviors of spherical-, rod-, disk-, and hybridfilled polymers and the analysis of the factors influencing the electrical percolation behavior from a microscopic point of view are summarized. In addition, the paper summarizes the progress of polymer piezoresistive models and polymer foaming structure models that are more relevant to practical applications; finally, we discuss the shortcomings and future research trends of existing Monte Carlo models of CPCs with carbon-based fillings. Full article
(This article belongs to the Section Polymer Chemistry)
Show Figures

Figure 1

Figure 1
<p>Conductivity of filled CPCs vs. addition of conductive materials.</p>
Full article ">Figure 2
<p>(<b>a</b>) Schematic diagram of the equivalent resistance calculation for the 2D model [<a href="#B60-polymers-16-00545" class="html-bibr">60</a>]; (<b>b</b>) cloud diagram of the CNT-filled RVE with the model and experimental conductivity results [<a href="#B61-polymers-16-00545" class="html-bibr">61</a>].</p>
Full article ">Figure 3
<p>(<b>a</b>) Schematic diagram of waviness in the CNT model; (<b>b</b>) schematic of the CNT-filled RVE with different waviness degrees; (<b>c</b>–<b>e</b>) effect of model parameters on the polymer’s conductivity; (<b>c</b>) CNTs’ waviness; (<b>d</b>) CNTs’ intrinsic conductivity; (<b>e</b>) polymer potential barrier [<a href="#B68-polymers-16-00545" class="html-bibr">68</a>].</p>
Full article ">Figure 4
<p>Size distribution of the CB particles [<a href="#B96-polymers-16-00545" class="html-bibr">96</a>].</p>
Full article ">Figure 5
<p>(<b>a</b>) 3D graphene network model [<a href="#B107-polymers-16-00545" class="html-bibr">107</a>]; (<b>b</b>) schematic of the disk-shaped graphene model filled with RVEs, with individual graphene in black, aggregated graphene in white, and percolation network in grey [<a href="#B108-polymers-16-00545" class="html-bibr">108</a>]; (<b>c</b>) schematic of the graphene model for coated surfaces (CSs) [<a href="#B110-polymers-16-00545" class="html-bibr">110</a>].</p>
Full article ">Figure 6
<p>(<b>a</b>) Schematic diagrams of the disk model, square model, and folded plate model of graphene; (<b>b</b>) model predictions and experimental percolation threshold results [<a href="#B111-polymers-16-00545" class="html-bibr">111</a>]; (<b>c</b>–<b>f</b>) effective conductivity versus volume fraction for different parameters; (<b>c</b>) tunneling distance dc; (<b>d</b>) interface thickness; (<b>e</b>) polymer barrier; (<b>f</b>) graphene thickness [<a href="#B113-polymers-16-00545" class="html-bibr">113</a>].</p>
Full article ">Figure 7
<p>(<b>a</b>) Schematic of CB and CNT model filled RVE, (<b>b</b>) SEM images of CB and CNTs in polymer, (<b>c</b>) Dependence of synergistic effect on the L/D ratio of CNTs, (<b>d</b>) Dependence of synergistic effect on CB to CNTs’ diameter ratio [<a href="#B122-polymers-16-00545" class="html-bibr">122</a>], (<b>e</b>) Effect of the degree of CB agglomeration on the percolation behavior, (<b>f</b>) Distribution of CB in the RVE when the degree of agglomeration is set to 0, 50, 100 and 150, (<b>g</b>) Effect of fold angle and number of fold segments on polymer percolation behavior, (<b>h</b>) Schematic diagrams of rod and folded CNTs [<a href="#B124-polymers-16-00545" class="html-bibr">124</a>].</p>
Full article ">Figure 8
<p>(<b>a</b>) Effect of agglomeration radius of CNTs on percolation threshold, (<b>b</b>) Effect of agglomeration angle of CNTs on percolation threshold, (<b>c</b>) Effect of addition of graphene on electrical conductivity of CNT-filled CPCs in agglomerated state [<a href="#B127-polymers-16-00545" class="html-bibr">127</a>].</p>
Full article ">Figure 9
<p>(<b>a</b>) Schematic representation of the structural response of CNTs in polymers after mechanical deformation; (<b>b</b>) effect of uniaxial strain on the vertical and lateral percolation thresholds; (<b>c</b>) effect of biaxial strain on vertical and lateral percolation thresholds [<a href="#B136-polymers-16-00545" class="html-bibr">136</a>].</p>
Full article ">Figure 10
<p>(<b>a</b>) Schematic of a graphene-filled polymer system subjected to tensile strain; (<b>b</b>) unstable piezoresistivity at a low filler volume fraction; (<b>c</b>) piezoresistivity at a 7.5% graphene volume fraction; (<b>d</b>) piezoresistivity at an 8.8% graphene volume fraction [<a href="#B138-polymers-16-00545" class="html-bibr">138</a>].</p>
Full article ">Figure 11
<p>(<b>a</b>) Monte Carlo model of foamed polymer and schematic diagram of its conductive pathways; (<b>b</b>) variation in the conductivity with the volume fraction of the CNTs at different void fractions; (<b>c</b>) variation in the conductivity with the void fraction for the different CNT additions [<a href="#B149-polymers-16-00545" class="html-bibr">149</a>]; (<b>d</b>) simulated images of CNT networks in polymer foams at 0%, 10%, 30%, and 50% void fractions; (<b>e</b>,<b>f</b>) conductivity results for different volume fractions of CNT-filled foamed polymers at different void fractions; (<b>e</b>) model predictions; (<b>f</b>) experiments; (<b>g</b>) effect of CNT length on the conductivity of foamed polymers with a constant porosity, β, and bubble radius, Rc [<a href="#B150-polymers-16-00545" class="html-bibr">150</a>].</p>
Full article ">
13 pages, 4076 KiB  
Article
Preparation of MoS2@PDA-Modified Polyimide Films with High Mechanical Performance and Improved Electrical Insulation
by Xian Cheng, Chenxi Wang, Shuo Chen, Leyuan Zhang, Zihao Liu and Wenhao Zhang
Polymers 2024, 16(4), 546; https://doi.org/10.3390/polym16040546 - 17 Feb 2024
Viewed by 977
Abstract
Polyimide (PI) has been widely used in cable insulation, thermal insulation, wind power protection, and other fields due to its high chemical stability and excellent electrical insulation and mechanical properties. In this research, a modified PI composite film (MoS2@PDA/PI) was obtained [...] Read more.
Polyimide (PI) has been widely used in cable insulation, thermal insulation, wind power protection, and other fields due to its high chemical stability and excellent electrical insulation and mechanical properties. In this research, a modified PI composite film (MoS2@PDA/PI) was obtained by using polydopamine (PDA)-coated molybdenum disulfide (MoS2) as a filler. The low interlayer friction characteristics and high elastic modulus of MoS2 provide a theoretical basis for enhancing the flexible mechanical properties of the PI matrix. The formation of a cross-linking structure between a large number of active sites on the surface of the PDA and the PI molecular chain can effectively enhance the breakdown field strength of the film. Consequently, the tensile strength of the final sample MoS2@PDA/PI film increased by 44.7% in comparison with pure PI film, and the breakdown voltage strength reached 1.23 times that of the original film. It can be seen that the strategy of utilizing two-dimensional (2D) MoS2@PDA nanosheets filled with PI provides a new modification idea to enhance the mechanical and electrical insulation properties of PI films. Full article
(This article belongs to the Section Polymer Applications)
Show Figures

Figure 1

Figure 1
<p>Schematic diagram of the synthesis process of MoS<sub>2</sub>@PDA/PI composites.</p>
Full article ">Figure 2
<p>SEM (<b>a</b>) and TEM (<b>b</b>,<b>c</b>) images of MoS2; SEM (<b>d</b>) and TEM (<b>e</b>,<b>f</b>) images of MoS2@PDA; (<b>g</b>–<b>i</b>) are the SEM images of PI, MoS2/PI, and MoS2@PDA/PI; (<b>j</b>) is the SEM image and element mapping of MoS<sub>2</sub>@PDA/PI. The red dotted frames highlight the distribution locations of MoS<sub>2</sub>@PDA nanosheets.</p>
Full article ">Figure 3
<p>(<b>a</b>) The XRD pattern of MoS<sub>2</sub>, MoS<sub>2</sub>@PDA, PI, MoS<sub>2</sub>/PI, and MoS<sub>2</sub>@PDA/PI; (<b>b</b>) FT-IR spectrum of the PI, MoS<sub>2</sub>/PI, and MoS<sub>2</sub>@PDA/PI. The heart symbol represents the XRD diffraction peaks.</p>
Full article ">Figure 4
<p>(<b>a</b>) The full spectra, (<b>b</b>) C 1s, (<b>c</b>) N 1s, and (<b>d</b>) O 1s of MoS<sub>2</sub>@PDA/PI.</p>
Full article ">Figure 5
<p>The friction coefficient and wear rate of PI, MoS<sub>2</sub>/PI, and MoS<sub>2</sub>@PDA/PI.</p>
Full article ">Figure 6
<p>(<b>a</b>) The strain–stress curve of pure PI, MoS<sub>2</sub>/PI, and MoS<sub>2</sub>@PDA/PI composites; (<b>b</b>) tensile strength, elastic modulus, and break elongation of pure PI, MoS<sub>2</sub>/PI, and MoS<sub>2</sub>@PDA/PI composites.</p>
Full article ">Figure 7
<p>Dielectric properties of pure PI, MoS<sub>2</sub>/PI, and MoS<sub>2</sub>@PDA/PI: (<b>a</b>) dielectric constant and (<b>b</b>) dielectric loss tangent.</p>
Full article ">Figure 8
<p>Structure of the pulse aging experimental device.</p>
Full article ">Figure 9
<p>(<b>a</b>) Breakdown voltage and (<b>b</b>) partial discharge inception voltage of pure PI, MoS<sub>2</sub>/PI, and MoS<sub>2</sub>@PDA/PI.</p>
Full article ">Figure 10
<p>Insulation life of pure PI, MoS<sub>2</sub>/PI, and MoS<sub>2</sub>@PDA/PI under different aging voltages.</p>
Full article ">
12 pages, 3087 KiB  
Article
Flame-Retardant GF-PSB/DOPO-POSS Composite with Low Dk/Df and High Thermal Stability for High-Frequency Copper Clad Applications
by Ke Zheng, Yizhi Zhang, Jiaxiang Qiu, Guanqun Xie, Zengbiao Huang, Wei Lin, Zhimeng Liu, Qianfa Liu and Xiaoxia Wang
Polymers 2024, 16(4), 544; https://doi.org/10.3390/polym16040544 - 17 Feb 2024
Viewed by 1150
Abstract
In the field of high-frequency communications devices, there is an urgent need to develop high-performance copper clad laminates (CCLs) with low dielectric loss (Df) plus good flame retardancy and thermal stability. The hydrocarbon resin styrene-butadiene block copolymer (PSB) was modified with the flame-retardant [...] Read more.
In the field of high-frequency communications devices, there is an urgent need to develop high-performance copper clad laminates (CCLs) with low dielectric loss (Df) plus good flame retardancy and thermal stability. The hydrocarbon resin styrene-butadiene block copolymer (PSB) was modified with the flame-retardant 9,10-dihydro-9-oxa-10-phosphaphenanthrene-10-oxide/polyhedral oligomeric silsesquioxanes (DOPO-POSS) to meet the demands of high-frequency and high-speed applications. The resulting DOPO-POSS-modified PSB was used as the resin matrix along with other additives to fabricate PSB/DOPO-POSS laminates. At a high-frequency of 10 GHz, the laminates containing 20 wt.% of DOPO-POSS and with a thickness of 0.09 mm exhibited a Df of 0.00328, which is much lower compared with the commercial PSB/PX-200 composite (Df: 0.00498) and the PSB without flame retardancy (Df: 0.00453). Afterwards, glass fiber cloth (GF) was used as a reinforcing material to manufacture GF-PSB/DOPO-POSS composite laminates with a thickness of 0.25 mm. The flame retardancy of GF-PSB/DOPO-POSS composite laminate reached vertical burning (UL-94) V-1 grade, and GF-PSB/DOPO-POSS exhibited higher thermal and dynamic mechanical properties than GF-PSB/PX-200. The results of a limited oxygen index (LOI) and self-extinguishing time tests also demonstrated the superior flame-retardant performance of DOPO-POSS compared with PX-200. The investigation indicates that GF-PSB/DOPO-POSS composite laminates have significant potential for use in fabricating a printed circuit board (PCB) for high-frequency and high-speed applications. Full article
(This article belongs to the Special Issue Development in Flame-Retardant Polymer Composites)
Show Figures

Graphical abstract

Graphical abstract
Full article ">Figure 1
<p>The structure and components of a CCL, a base material of PCB.</p>
Full article ">Figure 2
<p>The molecular structures of (<b>a</b>) PX-200 and (<b>b</b>) DOPO-POSS.</p>
Full article ">Figure 3
<p>IR spectra of the samples of DOPO-POSS, GF-PSB, and GF-PSB/DOPO-POSS (the content of DOPO-POSS is 10 wt.%).</p>
Full article ">Figure 4
<p>(<b>a</b>) Dk and Df values of PSB composites at 10 GHz (without GF, the thickness of sample is 0.09 mm, the contents of PX-200 in PSB/PX-200 and DOPO-POSS in PSB/DOPO-POSS are 20 wt.%). (<b>b</b>) Dk and Df values of the GF-PSB composite laminates with the different DOPO-POSS contents (with GF, the thickness is 0.25 mm).</p>
Full article ">Figure 5
<p>(<b>a</b>) TG curves of DOPO-POSS, PX-200, and PSB. (<b>b</b>) TG curves of flame-retardant GF-PSB composites (the contents of PX-200 in PSB/PX-200 and DOPO-POSS in PSB/DOPO-POSS are 10 wt.%).</p>
Full article ">Figure 6
<p>(<b>a</b>) Dynamic storage modulus and (<b>b</b>) tan δ of various laminates at 1 Hz (the contents of PX-200 in PSB/PX-200 and DOPO-POSS in PSB/DOPO-POSS are 10 wt.%).</p>
Full article ">Figure 7
<p>(<b>a</b>) HRR, (<b>b</b>) THR, (<b>c</b>) MLR, and (<b>d</b>) SPR curves of flame-retarded GF-PSB composites (the contents of PX-200 in PSB/PX-200 and DOPO-POSS in PSB/DOPO-POSS are 10 wt.%).</p>
Full article ">Figure 8
<p>SEM micrographs of the top layer of GF-PSB/DOPO-POSS laminate after cone calorimeter test (the thickness of laminate is 0.25 mm, the content of DOPO-POSS is 10 wt.%). The four images come from the same location with different magnifications.</p>
Full article ">
16 pages, 8947 KiB  
Article
Performance of Particleboard Made of Agroforestry Residues Bonded with Thermosetting Adhesive Derived from Waste Styrofoam
by Tati Karliati, Muhammad Adly Rahandi Lubis, Rudi Dungani, Rijanti Rahaju Maulani, Anne Hadiyane, Alfi Rumidatul, Petar Antov, Viktor Savov and Seng Hua Lee
Polymers 2024, 16(4), 543; https://doi.org/10.3390/polym16040543 - 17 Feb 2024
Cited by 1 | Viewed by 918
Abstract
This paper investigated the upcycling process of thermoplastic waste polystyrene (WPS) into thermosetting particleboard adhesive using two cross-linkers, namely methylene diphenyl diisocyanate (MDI) and maleic anhydride (MA). The WPS was dissolved in an organic co-solvent. The weight ratio of WPS/co-solvent was 1:9, and [...] Read more.
This paper investigated the upcycling process of thermoplastic waste polystyrene (WPS) into thermosetting particleboard adhesive using two cross-linkers, namely methylene diphenyl diisocyanate (MDI) and maleic anhydride (MA). The WPS was dissolved in an organic co-solvent. The weight ratio of WPS/co-solvent was 1:9, and 10% of cross-linkers based on the WPS solids content were added subsequently at 60 °C under continuous stirring for 30 min. The adhesive properties, cohesion strength, and thermo-mechanical properties of WPS-based adhesives were examined to investigate the change of thermoplastic WPS to thermosetting adhesives. The bonding strength of WPS-based adhesives was evaluated in particleboard made of sengon (Falcataria moluccana (Miq.) Barneby & J.W. Grimes) wood and rice straw particles at different weight ratios according to the Japanese Industrial Standard (JIS) A 5908:2003. Rheology and Dynamic Mechanical Analysis revealed that modification with MDI and MA resulted in thermosetting properties in WPS-based adhesives by increasing the viscosity at a temperature above 72.7 °C and reaching the maximum storage modulus above 90.8 °C. WPS modified with MDI had a lower activation energy (Ea) value (83.4 kJ/mole) compared to the WPS modified with MA (150.8 kJ/mole), indicating the cross-linking with MDI was much faster compared with MA. Particleboard fabricated from 100% sengon wood particles bonded with WPS modified with MDI fulfilled the minimum requirement of JIS A 5908:2003 for interior applications. Full article
(This article belongs to the Section Biomacromolecules, Biobased and Biodegradable Polymers)
Show Figures

Figure 1

Figure 1
<p>Preparation of the waste Styrofoam-based adhesives used in this work.</p>
Full article ">Figure 2
<p>Preparation of particleboard bonded with WPS-based adhesive.</p>
Full article ">Figure 3
<p>Digital microscope images of waste styrofoam. (<b>a</b>) WPS-1 at scale without magnification, (<b>b</b>) WPS-1 at 20 times magnification, (<b>c</b>) WPS-1 at 100 times magnification, (<b>d</b>) WPS-2 at scale without magnification, (<b>e</b>) WPS-2 at 20 times magnification, and (<b>f</b>) WPS-2 at 100 times magnification.</p>
Full article ">Figure 4
<p>FTIR spectra of WPS-based adhesives modified with MDI. (<b>a</b>) Liquid adhesives and (<b>b</b>) cured adhesives.</p>
Full article ">Figure 5
<p>FTIR spectra of WPS-based adhesives modified with MA. (<b>a</b>) Liquid adhesives and (<b>b</b>) cured adhesives.</p>
Full article ">Figure 6
<p>Dynamic viscosity of modified WPS-based adhesives as a function of temperature (<b>a</b>) and cohesion strength of modified WPS-based adhesives as a function of viscosity (<b>b</b>). Values with * refer to the peak temperature to reach a maximum viscosity of WPS-based adhesives.</p>
Full article ">Figure 7
<p>Relaxation modulus of modified WPS-based adhesives as a function of cohesion strength.</p>
Full article ">Figure 8
<p>Thermo-mechanical properties of WPS-based adhesives. DMA thermogram of neat Styrofoam (<b>a</b>), storage modulus as a function of stiffness (<b>b</b>), storage modulus of WPS-MDI as a function of temperature (<b>c</b>), and storage modulus of WPS-MA as a function of temperature (<b>d</b>). Values with * refer to the peak temperature to reach a maximum storage modulus of WPS-based adhesives.</p>
Full article ">Figure 9
<p>Morphological features of WPS-based adhesives captured by a digital microscope at different magnifications with dual-light high-magnification zoom lens. (<b>a</b>) 100× magnification of WPS modified with MDI, (<b>b</b>) 200× magnification of WPS modified with MDI, (<b>c</b>) 100× magnification of WPS modified with MA, and (<b>d</b>) 200× magnification of WPS modified with MA.</p>
Full article ">Figure 10
<p>Mechanical properties of particleboard. (<b>a</b>) Modulus of rupture (MOR) and (<b>b</b>) modulus of elasticity (MOE).</p>
Full article ">Figure 11
<p>Internal bonding (IB) strength of particleboard.</p>
Full article ">
20 pages, 3284 KiB  
Article
Synapse-Mimicking Memristors Based on 3,6-Di(tpy)-9-Phenylcarbazole Unimer and Its Copolymer with Cobalt(II) Ions
by Ambika Pandey, Andrei Chernyshev, Yadu Ram Panthi, Jiří Zedník, Adriana Šturcová, Magdalena Konefał, Olga Kočková, Stephen H. Foulger, Jiří Vohlídal and Jiří Pfleger
Polymers 2024, 16(4), 542; https://doi.org/10.3390/polym16040542 - 17 Feb 2024
Cited by 1 | Viewed by 1628
Abstract
The title compound, unimer U (tpy stands for 2,2′:6′,2″-terpyridin-4′-yl end-group), by itself shows the memristor effect with a retention time of 18 h and persistence of 11 h. Its coordination copolymer with Co(II) ions, [CoU]n, exhibits multimodal resistance changes similar [...] Read more.
The title compound, unimer U (tpy stands for 2,2′:6′,2″-terpyridin-4′-yl end-group), by itself shows the memristor effect with a retention time of 18 h and persistence of 11 h. Its coordination copolymer with Co(II) ions, [CoU]n, exhibits multimodal resistance changes similar to the synaptic responses observed in biological systems. More than 320 cycles of potentiation and depression measured in continuous sequence occurred without observing a significant current change, confirming the operational stability and reproducibility of the device based on the [CoU]n polymer. The synaptic effect of a device with an indium tin oxide (ITO)/[CoU]n/top-electrode (TE) configuration is more pronounced for the device with TE = Au compared to devices with TE = Al or Ga. However, the latter TEs provide a cost-effective approach without any significant compromise in device plasticity. The detected changes in the synaptic weight, about 12% for pair-pulse facilitation and 80% for its depression, together with a millisecond trigger and reading pulses that decay exponentially on the time scale typical of neurosynapses, justify the device’s ability to learn and memorize. These properties offer potential applications in neuromorphic computation and brain-inspired synaptic devices. Full article
(This article belongs to the Special Issue Emerging Smart Applications of Functional Polymeric Materials)
Show Figures

Graphical abstract

Graphical abstract
Full article ">Figure 1
<p>XRD records of powdered materials studied and their films on quartz substrate.</p>
Full article ">Figure 2
<p>UV–vis absorption and emission spectra (excited at 350 nm) of <b>U</b> and <b>[CoU]<sub>n</sub></b>. HFP/ACN (4:1) mixed solvent, film thickness of 300 nm.</p>
Full article ">Figure 3
<p>(<b>a</b>) Cyclic voltammograms of films (~200 nm) of <b>U</b> (blue) and <b>[CoU]</b><sub>n</sub> (red) deposited on ITO, and ferrocene reference (black top), scan rate 200 mV s<sup>−1</sup>; inset: magnified area around Co<sup>2+</sup> oxidation potential; (<b>b</b>) energy diagrams for sandwich systems with Al and Au top electrodes, ITO bottom electrode, and <b>U</b> and <b>[CoU]<sub>n</sub></b> active layers.</p>
Full article ">Figure 4
<p>I−V characteristics of sandwich samples: (<b>a</b>) ITO/<b>U</b> (20 nm)/Al and (<b>b</b>) ITO/<b>[CoU]<sub>n</sub></b> (750 nm)/Au. Sweep directions are indicated by arrows. Polarity of applied voltage refers to the top electrode.</p>
Full article ">Figure 5
<p>(<b>a</b>) I–V characteristics with repeating write, read, erase. and re-read (WRER) pulses and (<b>b</b>) persistence of the memory state after one writing pulse at −7 V and erasing pulse at +7 V under continuous reading at −1 V in ITO/<b>U</b>/Al device. Blue lines—current, black lines—applied voltage.</p>
Full article ">Figure 6
<p>Potentiation and depression in the ITO<b>/[CoU]<sub>n</sub></b>/Au device. (<b>a</b>) Measurement scheme of 100 consecutive potentiation pulses followed by 100 successive depression pulses (trigger: ±0.5 V, read: −50 mV). (<b>b</b>) Current evolution during the stimulation by the train of trigger pulses and (<b>c</b>) current evolution during the stimulation by the train of trigger pulses with different magnitude: ±0.5 V—black symbols, ±1 V—red symbols, ±1.5 V—blue symbols, ±2 V—green symbols. Thickness of the <b>[CoU]<sub>n</sub></b> layer: 200 nm.</p>
Full article ">Figure 6 Cont.
<p>Potentiation and depression in the ITO<b>/[CoU]<sub>n</sub></b>/Au device. (<b>a</b>) Measurement scheme of 100 consecutive potentiation pulses followed by 100 successive depression pulses (trigger: ±0.5 V, read: −50 mV). (<b>b</b>) Current evolution during the stimulation by the train of trigger pulses and (<b>c</b>) current evolution during the stimulation by the train of trigger pulses with different magnitude: ±0.5 V—black symbols, ±1 V—red symbols, ±1.5 V—blue symbols, ±2 V—green symbols. Thickness of the <b>[CoU]<sub>n</sub></b> layer: 200 nm.</p>
Full article ">Figure 7
<p>Transition from short-term (STM) to long-term memory (top, red symbols) and short-term to long-term forgetting (bottom, black symbols) for the ITO/<b>[CoU]<sub>n</sub></b>/Au device. One STM cycle consisted of current recorded by ten subsequent trigger pulses (−0.5 V), each followed by a read pulse (±0.05 V). The time gap between subsequent STM cycles was 1.6 s.</p>
Full article ">Figure 8
<p><span class="html-italic">PPF/PPD</span> in the ITO/<b>[CoU]<sub>n</sub></b>/Au device. (<b>a</b>) A scheme for <span class="html-italic">PPF</span> measurement (trigger pulses with opposite polarity but with same magnitude and time scale were used for <span class="html-italic">PPD</span>) and (<b>b</b>) dependences of the <span class="html-italic">PPF</span> (top, circles) and PPD (bottom, squares) indices on the time gap Δ<span class="html-italic">t</span> between pulses. Red lines—fitted using Equation (2).</p>
Full article ">Figure 9
<p>The retention of the memory state in the Au/<b>[CoU]<sub>n</sub></b>/ITO device after 10, 50, 100, and 500 consecutive trigger pulses: background current in the relaxed equilibrium state before triggering, during triggering by multiple pulses (alternating trigger and reading pulses), and during relaxation of the sample after triggering. Read currents recorded using testing voltage pulses 0.05 V with 20 ms duration, excitation trigger pulses + 1 V, and 20 ms pulse duration.</p>
Full article ">Figure 10
<p>Bi-logarithmic I–V plots for Al/<b>U</b>/ITO device during SET and RESET sweeps fitted using the SCLC and ohmic conduction models (red lines).</p>
Full article ">Scheme 1
<p>Synthesis of unimer <b>U</b> and its transformation to organometallic (metallo-supramolecular) copolymer <b>[CoU]<sub>n</sub></b> (note that the planes of <span class="html-italic">tpy</span> groups coordinated to a Co<sup>2+</sup> ion are perpendicular to each other).</p>
Full article ">
18 pages, 6580 KiB  
Article
Fluorescent Carbon Dioxide-Based Polycarbonates Probe for Rapid Detection of Aniline in the Environment and Its Biomarkers in Urine
by Yun Liu, Wen-Zhen Wang, Zhi-Ping Zhang, Chun-Bao Du, Lei-Lei Li, Chen Zhao, Hong-Jiu Li and Qing Huang
Polymers 2024, 16(4), 541; https://doi.org/10.3390/polym16040541 - 17 Feb 2024
Viewed by 956
Abstract
Aniline compounds, as a class of widely used but highly toxic chemical raw materials, are increasingly being released and accumulated in the environment, posing serious threats to environmental safety and human health. Therefore, developing detection methods for aniline compounds is of particular significance. [...] Read more.
Aniline compounds, as a class of widely used but highly toxic chemical raw materials, are increasingly being released and accumulated in the environment, posing serious threats to environmental safety and human health. Therefore, developing detection methods for aniline compounds is of particular significance. Herein, we synthesized the fluorescent third monomer cyano-stilbene epoxide M and ternary copolymerized it with carbon dioxide (CO2) and propylene oxide (PO) to synthesize carbon dioxide-based polycarbonate (PPCM) with fluorescence recognition functions, as well as excellent performance, for the first time. The results revealed that the PPCM fluorescent probe exhibited typical aggregation-induced luminescence properties and could be quenched by aniline compounds. The probe presented anti-interference-specific selectivity for aniline compounds, and the detection limit was 1.69 × 10⁻⁴ M. Moreover, it was found to be a highly sensitive aniline detection probe. At the same time, the aniline biomarker p-aminophenol in urine could also be detected, which could expand the potential applications of polymers in the fluorescence-sensing field. Full article
(This article belongs to the Special Issue Novel Polymers in Sensors)
Show Figures

Graphical abstract

Graphical abstract
Full article ">Figure 1
<p><sup>1</sup>H NMR spectrum of monomer M.</p>
Full article ">Figure 2
<p>FT-IR spectrum of polymers M and PPCM.</p>
Full article ">Figure 3
<p><sup>1</sup>H NMR spectrum of PPCM.</p>
Full article ">Figure 4
<p>(<b>a</b>) DSC curves of PPC and PPCMs; (<b>b</b>) TGA curves of PPC and PPCMs.</p>
Full article ">Figure 5
<p>(<b>a</b>) Strain–stress curves of PPC and PPCM<sub>S</sub>; (<b>b</b>) Young’s modulus of PPC and PPCMs.</p>
Full article ">Figure 6
<p>(<b>a</b>) Photoluminescence spectra of PPCM (M<sub>n</sub> = 14,577 g mol<sup>−1</sup>) in the mixed solution of THF and H<sub>2</sub>O (concentration: 1 mg mL<sup>−1</sup>, λ<sub>ex</sub> = 365 nm); (<b>b</b>) fluorescence plot of PPCM in a mixed solution of THF and H<sub>2</sub>O under UV light (365 nm).</p>
Full article ">Figure 7
<p>(<b>a</b>) Changes in fluorescence spectra of PPCM solution after the addition of different organic compounds; (<b>b</b>) changes in fluorescence intensity of PPCM solution after the addition of different organic compounds; (<b>c</b>) changes in fluorescence spectra of PPCM solution after the addition of different amines; (<b>d</b>) vhanges in fluorescence intensity of PPCM solution after the addition of different amines.</p>
Full article ">Figure 8
<p>Fluorescence of PPCM solution under UV lamp (365 nm) after addition of different amine compounds.</p>
Full article ">Figure 9
<p>Energy level diagram of PPCM with various types of amines.</p>
Full article ">Figure 10
<p>Anti-interference fluorescence intensity plots for different amine compounds.</p>
Full article ">Figure 11
<p>(<b>a</b>) Fluorescence spectra of PPCM for various concentrations of aniline; (<b>b</b>) linear curve of fluorescence intensity at 475 nm versus aniline concentration.</p>
Full article ">Figure 12
<p>Linear curve of PPCM fluorescence intensity at 475 nm versus aniline concentration.</p>
Full article ">Figure 13
<p>(<b>a</b>) Changes in fluorescence spectra of PPCM solution after addition of different aniline analogs. (<b>b</b>) Changes in fluorescence intensity of PPCM solution after addition of different aniline analogs.</p>
Full article ">Figure 14
<p>(<b>a</b>) Fluorescence spectra of PPCM for various concentrations of p-aminophenol. (<b>b</b>) Fluorescence spectra of PPCM for various concentrations of p-aminophenol in artificial urine (pH = 4.7). (<b>c</b>) Fluorescence spectra of PPCM for various concentrations of p-aminophenol in artificial urine (pH = 5.7).</p>
Full article ">Scheme 1
<p>Synthesis route of monomer M.</p>
Full article ">Scheme 2
<p>Synthesis route of PPCM.</p>
Full article ">
15 pages, 3277 KiB  
Article
Novel Conductive AgNP-Based Adhesive Based on Novel Poly (Ionic Liquid)-Based Waterborne Polyurethane Chloride Salts for E-Textiles
by Haiyang Liao, Yeqi Xiao, Tiemin Xiao, Hongjin Kuang, Xiaolong Feng, Xiao Sun, Guixin Cui, Xiaofei Duan and Pu Shi
Polymers 2024, 16(4), 540; https://doi.org/10.3390/polym16040540 - 17 Feb 2024
Viewed by 931
Abstract
The emergence of novel e-textile materials that combine the inherent qualities of the textile substrate (lightweight, soft, breathable, durable, etc.) with the functionality of micro/nano-electronic materials (conductive, dielectric, sensing, etc.) has resulted in a trend toward miniaturization, integration, and intelligence in new electronic [...] Read more.
The emergence of novel e-textile materials that combine the inherent qualities of the textile substrate (lightweight, soft, breathable, durable, etc.) with the functionality of micro/nano-electronic materials (conductive, dielectric, sensing, etc.) has resulted in a trend toward miniaturization, integration, and intelligence in new electronic devices. However, the formation of a conductive network by micro/nano-conductive materials on textiles necessitates high-temperature sintering, which inevitably causes substrate aging and component damage. Herein, a bis-hydroxy-imidazolium chloride salt as a hard segment to synthesize a waterborne polyurethane (WPU) adhesive is designed and prepared. When used in nano-silver-based printing coatings, it offers strong adherence for coatings, reaching 16 N cm−1; on the other hand, the introduction of chloride ions enables low-temperature (60 °C) chemical sintering to address the challenge of secondary treatment and high-temperature sintering (>150 °C). Printed into flexible circuits, the resistivity can be controlled by the content of imidazolium salts anchored in the molecular chain of the WPU from a maximum resistivity of 3.1 × 10⁷ down to 5.8 × 10⁻⁵ Ω m, and it can conduct a Bluetooth-type finger pulse detector with such low resistivity. As a flexible circuit, it also offers high stability against washing and adhesion, which the resistivity only reduces less than 20% after washing 10 times and adhesion. Owing to the adjustability of the resistivity, we fabricated an all-textile flexible pressure sensor that accurately differentiates different external pressures (min. 10 g, ~29 Pa), recognizes forms, and detects joint motions (finger bending and wrist flexion). Full article
(This article belongs to the Special Issue Advanced Conductive Polymers for Electrochemical Applications)
Show Figures

Graphical abstract

Graphical abstract
Full article ">Figure 1
<p>(<b>a</b>) Schematic illustration for fabrication of AgNP-based printed conductive pattern; (<b>b</b>) SEM image of the as-prepared AgNPs; (<b>c</b>) TEM image of as-prepared AgNPs and insert image shows the HR-TEM image; and (<b>d</b>) FTIR spectrum of CA-Na and AgNPs.</p>
Full article ">Figure 2
<p>(<b>a</b>) TG curves of AgNPs and conductive adhesive and WPU<sub>[Cl−]</sub>; (<b>b</b>) particle size distribution of AgNPs; (<b>c</b>) particle size distribution of WPU<sub>[Cl−]</sub>; (<b>d</b>) FTIR spectra of conductive adhesive and WPU<sub>[Cl−]</sub>; (<b>e</b>) XPS spectra of AgNP-based conductive adhesive with 2 mmol of WPU<sub>[Cl−]</sub>; (<b>f</b>) photo of printed pattern on textile; (<b>g</b>) microscopic photograph of the demarcation line of a printed pattern; differences in the morphology of patterns printed on textile; (<b>h</b>) SEM image of unprinted site; and (<b>i</b>) SEM image of printed site.</p>
Full article ">Figure 3
<p>(<b>a</b>) Resistivity of as-prepared AgNP-based printed conductive coatings based on different contents of OH-IL<sub>[Cl−]</sub>-OH in WPU<sub>[Cl−]</sub>; (<b>b</b>) photo of printed conductive pattern based on 4 mmol of OH-IL<sub>[Cl−]</sub>-OH in a WPU<sub>[Cl−]</sub>application in conductive wire for connecting the LEDs; morphology of printed pattern based on different contents of OH-IL<sub>[Cl−]</sub>-OH in WPU<sub>[Cl−]</sub>: (<b>c</b>) 0 mmol, (<b>d</b>) 2 mmol, and (<b>e</b>) 4 mmol; and XPS spectra of different elements: (<b>f</b>) Ag 3d, (<b>g</b>) N 1s, and (<b>h</b>) Cl 2d.</p>
Full article ">Figure 4
<p>(<b>a</b>) Structure and photographs of textile pressure sensors based on AgNP-based conductive adhesive; (<b>b</b>) real-time resistance curve of the textile pressure sensor for detection of different weights with 10 g, 20 g, and 50 g; (<b>c</b>) real-time resistance curve of the PET-FPS to thumb bending; (<b>d</b>) stability of the PET-FPS on weight detection (50 g); (<b>e</b>) real-time resistance curve of PET-FPS on monitoring wrist vibration; and (<b>f</b>) the PET-FPS on area recognition.</p>
Full article ">Figure 5
<p>Conductive AgNP-based printed circuits for electrical component integration.</p>
Full article ">
15 pages, 14632 KiB  
Article
Ligand-Induced Synthesis of Highly Stable NM88(DB)@COF-JLU19 Composite: Accelerating Electron Flow for Visible-Light-Efficient Degradation of Tetracycline Hydrochloride
by Jinxia Zhao, Jingchao Liu, Zenghe Li and Yilin Yin
Polymers 2024, 16(4), 539; https://doi.org/10.3390/polym16040539 - 17 Feb 2024
Cited by 1 | Viewed by 806
Abstract
In recent years, the response of new porous materials to visible light and their potential applications in wastewater treatment has received extensive attention from the scientific community. Metal Organic Frameworks (MOFs) and Covalent Organic Frameworks (COFs) have been the focus of attention due [...] Read more.
In recent years, the response of new porous materials to visible light and their potential applications in wastewater treatment has received extensive attention from the scientific community. Metal Organic Frameworks (MOFs) and Covalent Organic Frameworks (COFs) have been the focus of attention due to their strong visible light absorption, high specific surface area, well-regulated pore structures, and diverse topologies. In this study, a novel MOF@COF composite with a high surface area, high crystallinity, and structural stability was obtained using the covalent bond formation strategy from COF-JLU19 and NH2-MIL-88B(Fe). Under visible light irradiation, the degradation of tetracycline hydrochloride by this material reached more than 90% within 10 min and was completely degraded within 30 min, which exceeded the degradation rate of individual materials. Remarkably, the catalytic activity decreased by less than 5% even after five degradation cycles, indicating good structural stability. The excellent photocatalytic performance of the NM88(DB)@COF-JLU19 hybrids was attributed to the formation of covalent bonds, which formed a non-homogeneous interface that facilitated effective charge separation and promoted the generation of hydroxyl radicals. Full article
(This article belongs to the Section Polymer Analysis and Characterization)
Show Figures

Graphical abstract

Graphical abstract
Full article ">Figure 1
<p>XRD pattern of COF-JLU19, NM88(DB), NM88@COF-JLU19(6:4), and NM88(DB)@COF-JLU19 hybrids.</p>
Full article ">Figure 2
<p>FT-IR image of COF-JLU19, NM88(DB), NM88@COF-JLU19(6:4), and NM88(DB)@COF-JLU19(6:4).</p>
Full article ">Figure 3
<p>SEM images of NM88(DB) (<b>a</b>), COF-JLU19 (<b>b</b>), and NM88(DB)@COF-JLU19(6:4) (<b>c</b>); TEM images (<b>d</b>,<b>e</b>) of NM88(DB)@COF-JLU19(6:4) and EDS mapping images (<b>f</b>) of NM88(DB)@COF-JLU19(6:4).</p>
Full article ">Figure 4
<p>XPS pattern measurements of NM88(DB)@COF-JLU19(6:4): a survey (<b>a</b>); N 1s (<b>b</b>) and Fe 2p (<b>c</b>) binding energy spectra.</p>
Full article ">Figure 5
<p>UV-vis DRS spectra (<b>a</b>); plots of (Ahv)<sup>2</sup> as a function of photon energy (<b>b</b>) of NM88(DB); COF-JLU19 and NM88(DB)@COF-JLU19(6:4). XPS valence band spectrum (<b>c</b>,<b>d</b>); typical Mott–Schottky plots (<b>e</b>,<b>f</b>) of NM88(DB) and COF-JLU19.</p>
Full article ">Figure 6
<p>Transient photocurrent response (<b>a</b>); EIS Nyquist plots (<b>b</b>) and PL spectra (<b>c</b>) of NM88(DB), COF-JLU19, and NM88(DB)@COF-JLU19(6:4).</p>
Full article ">Figure 7
<p>Photo-Fenton degradation of TCH over different materials under visible light irradiation (<b>a</b>) and comparison of the degradation kinetics of the degradation of TCH (<b>b</b>).</p>
Full article ">Figure 8
<p>The recyclability and (<b>a</b>) the influence of different scavengers (<b>b</b>) and ESR spectra of -OH radical species trapped (<b>c</b>) by DMPO of NM88(DB)@COF-JLU19(6:4).</p>
Full article ">Figure 9
<p>Proposed mechanism of photo-Fenton degradation of TCH in the NM88(DB)@COF-JLU19(6:4)/H<sub>2</sub>O<sub>2</sub>/visible light system.</p>
Full article ">Scheme 1
<p>Schematic of the synthesis process for NM88@COF-JLU19 hybrids.</p>
Full article ">Figure A1
<p>XRD (<b>a</b>) and FT-IR (<b>b</b>) of NM88(DB)@COF-JLU19(6:4) and reused NM88(DB)@COF-JLU19(6:4).</p>
Full article ">Figure A2
<p>TEM image of reused NM88(DB)@COF-JLU19(6:4).</p>
Full article ">Figure A3
<p>Thermogravimetric analysis of NM88(DB), COF-JLU19, and NM88(DB)@COF-JLU19(6:4).</p>
Full article ">
17 pages, 12429 KiB  
Article
Artificial Neural Network Approach for Assessing Mechanical Properties and Impact Performance of Natural-Fiber Composites Exposed to UV Radiation
by Khaled Nasri and Lotfi Toubal
Polymers 2024, 16(4), 538; https://doi.org/10.3390/polym16040538 - 17 Feb 2024
Cited by 1 | Viewed by 889
Abstract
Amidst escalating environmental concerns, short natural-fiber thermoplastic (SNFT) biocomposites have emerged as sustainable materials for the eco-friendly production of mechanical components. However, their limited durability has prompted research into the experimental evaluation of the deterioration of the mechanical characteristics of SNFT biocomposites, particularly [...] Read more.
Amidst escalating environmental concerns, short natural-fiber thermoplastic (SNFT) biocomposites have emerged as sustainable materials for the eco-friendly production of mechanical components. However, their limited durability has prompted research into the experimental evaluation of the deterioration of the mechanical characteristics of SNFT biocomposites, particularly under the influence of ultraviolet rays. However, conducting tests to evaluate the mechanical properties can be time-consuming and expensive. In this study, an artificial neural network (ANN) model was employed to predict the mechanical properties (tensile strength) and the impact performance (resistance and absorbed energy) of polypropylene reinforced with 30 wt.% short flax or wood pine fibers (referred to as PP30-F or PP30-P, respectively). Eight parameters were collected from experimental studies. The ANN input parameters comprised nondestructive test results, including mass, hardness, roughness, and natural frequencies, while the output parameters were the tensile strength, the maximum impact load, and absorbed energy. The model was developed using the ANN toolbox in MATLAB. The linear coefficient of correlation and mean squared error were selected as the metrics for evaluating the performance function and accuracy of the ANN model. They calculate the relationship and the average squared difference between the predicted and actual values. The data analysis conducted by the models demonstrated exceptional predictive capability, achieving an accuracy rate exceeding 96%, which was deemed satisfactory. For both the PP30-F and PP30-P biocomposites, the ANN predictions deviated from the experimental data by 3, 5, and 6% with regard to the impact load, absorbed energy, and tensile strength, respectively. Full article
Show Figures

Figure 1

Figure 1
<p>Prediction methodology.</p>
Full article ">Figure 2
<p>Architecture of the artificial neural network (ANN) algorithm.</p>
Full article ">Figure 3
<p>Average hardness evolution of PP30-F and PP30-P biocomposites as function of exposure time.</p>
Full article ">Figure 4
<p>Average roughness of unaged and aged PP30-F and PP30-P biocomposites after 1440 h of exposure.</p>
Full article ">Figure 5
<p>Bending and torsional frequencies of unaged and aged PP30-F and PP30-P biocomposites after 1440 h of exposure.</p>
Full article ">Figure 6
<p>Strength of unaged and aged PP30-F and PP30-P biocomposites after 1440 h of exposure.</p>
Full article ">Figure 7
<p>Maximum impact loads of unaged and aged PP30-F and PP30-P biocomposites after 1440 h of exposure.</p>
Full article ">Figure 8
<p>Absorbed energy evolution of PP30-F and PP30-P biocomposites as function of exposure time.</p>
Full article ">Figure 9
<p>Linear coefficient regression of the artificial neural network (ANN) model (PP30-F).</p>
Full article ">Figure 10
<p>Linear coefficient regression of the artificial neural network (ANN) model (PP30-P).</p>
Full article ">Figure 11
<p>Comparison between experimental and artificial neural network (ANN) results for the impact load.</p>
Full article ">Figure 12
<p>Comparison between experimental and artificial neural network (ANN) results for the absorbed energy.</p>
Full article ">Figure 13
<p>Comparison between experimental and artificial neural network (ANN) results for the tensile strength.</p>
Full article ">Figure A1
<p>Equipment and samples used: 1—injection molding machine; 2—accelerated-weathering machine; 3—examples of unaged and aged PP30-F samples; 4—IET device; 5—3D confocal microscopy device; 6—hardness test machine; 7—drop-weight impact test machine.</p>
Full article ">
14 pages, 3532 KiB  
Article
Strategies to Cope with Inferior Long-Term Photostability of Bentonite Polyolefin Nanocomposites
by Erik Westphal, Guru Geertz, Michael Großhauser, Elke Metzsch-Zilligen and Rudolf Pfaendner
Polymers 2024, 16(4), 535; https://doi.org/10.3390/polym16040535 - 17 Feb 2024
Viewed by 1094
Abstract
This study provides insight into the causes of inferior long-term stability of nanocomposites based on organic layered silicates (OLSs) used for cable mantles. A hierarchy was established by analyzing bentonite products and their respective polyolefin nanocomposites. Thermogravimetric analysis (TGA), X-ray diffraction (XRD), gas [...] Read more.
This study provides insight into the causes of inferior long-term stability of nanocomposites based on organic layered silicates (OLSs) used for cable mantles. A hierarchy was established by analyzing bentonite products and their respective polyolefin nanocomposites. Thermogravimetric analysis (TGA), X-ray diffraction (XRD), gas adsorption, energy-dispersive spectroscopy (SEM-EDX), and infrared spectroscopy (IR) provided evidence for the adsorption of stabilizers onto the filler surface and thus their reduction in activity, promoting polymer oxidation. This behavior corresponds to the specific surface area of the incorporated OLS. Therefore, it can be stated that gas adsorption and XRD are especially useful for the evaluation of long-term photostability. It was revealed that photocatalytically active iron is of secondary importance since iron-rich bentonites still formed the most stable nanocomposite. This also applies to the Hofmann elimination products of the modifying agent, where higher contents do not accelerate the degradation process. No elimination products could be traced within the composites. Due to the polymer-filler interface being essential for long-term photostability, prior analysis of the filler surface properties can be used to estimate the stability of the respective nanocomposite as a rationale for product selection in the early stages of development. The reasons identified in this work for decreasing the long-term photostability of OLS nanocomposites compared with unfilled formulations is an important step toward increasing their stability. Full article
(This article belongs to the Section Polymer Composites and Nanocomposites)
Show Figures

Figure 1

Figure 1
<p>TG and DTG curves for OLS and unmodified bentonite samples. TG and DTG curves are denoted by the solid and dashed lines, respectively.</p>
Full article ">Figure 2
<p>SEM micrographs at 500× magnification, covering an area of 270 × 270 µm<sup>2</sup> for (<b>a</b>) OLS Dellite CW9, (<b>b</b>) OLS MAX CT 4260, (<b>c</b>) OLS Cloisite 20A, and (<b>d</b>) unmodified bentonite Cloisite 116.</p>
Full article ">Figure 2 Cont.
<p>SEM micrographs at 500× magnification, covering an area of 270 × 270 µm<sup>2</sup> for (<b>a</b>) OLS Dellite CW9, (<b>b</b>) OLS MAX CT 4260, (<b>c</b>) OLS Cloisite 20A, and (<b>d</b>) unmodified bentonite Cloisite 116.</p>
Full article ">Figure 3
<p>Particle size distribution of bentonite sample inferred by SEM imaging. The solid lines represent distribution curves and were fitted to the data evaluated by image analysis.</p>
Full article ">Figure 4
<p>Results of XRD analysis depicting <span class="html-italic">d<sub>001</sub></span> distances of bentonite products.</p>
Full article ">Figure 5
<p>XRD analysis of bentonite-filled nanocomposites.</p>
Full article ">Figure 6
<p>Carbonyl index during weathering of model composites.</p>
Full article ">Figure 7
<p>Iron content obtained by SEM-EDX analysis, normalized by (<b>a</b>) Si content and (<b>b</b>) Si content and organo-modifier content obtained by TGA, each with corresponding CI and the end of weathering.</p>
Full article ">
18 pages, 4312 KiB  
Article
Stability in Aqueous Solution of a New Spray-Dried Hydrocolloid of High Andean Algae Nostoc sphaericum
by David Choque-Quispe, Carlos A. Ligarda-Samanez, Yudith Choque-Quispe, Sandro Froehner, Aydeé M. Solano-Reynoso, Elibet Moscoso-Moscoso, Yakov Felipe Carhuarupay-Molleda and Ronald Peréz-Salcedo
Polymers 2024, 16(4), 537; https://doi.org/10.3390/polym16040537 - 16 Feb 2024
Cited by 1 | Viewed by 1055
Abstract
There is a growing emphasis on seeking stabilizing agents with minimal transformation, prioritizing environmentally friendly alternatives, and actively contributing to the principles of the circular economy. This research aimed to assess the stability of a novel spray-dried hydrocolloid from high Andean algae when [...] Read more.
There is a growing emphasis on seeking stabilizing agents with minimal transformation, prioritizing environmentally friendly alternatives, and actively contributing to the principles of the circular economy. This research aimed to assess the stability of a novel spray-dried hydrocolloid from high Andean algae when introduced into an aqueous solution. Nostoc sphaericum freshwater algae were subject to atomization, resulting in the production of spray-dried hydrocolloid (SDH). Subsequently, suspension solutions of SDH were meticulously prepared at varying pH levels and gelling temperatures. These solutions were then stored for 20 days to facilitate a comprehensive evaluation of their stability in suspension. The assessment involved a multifaceted approach, encompassing rheological analysis, scrutiny of turbidity, sedimentation assessment, ζ-potential, and measurement of particle size. The findings from these observations revealed that SDH exhibits a dilatant behavior when in solution, signifying an increase in with higher shear rate. Furthermore, it demonstrates commendable stability when stored under ambient conditions. SDH is emerging as a potential alternative stabilizer for use in aqueous solutions due to its easy extraction and application. Full article
(This article belongs to the Special Issue Advances in Sustainable Polymeric Materials II)
Show Figures

Graphical abstract

Graphical abstract
Full article ">Figure 1
<p>SDH solution preparation and analysis flowchart.</p>
Full article ">Figure 2
<p>Characteristics of SDH (<b>a</b>) Zero charge point, (<b>b</b>) XRD diffractogram, (<b>c</b>) FTIR spectrogram, (<b>d</b>) SEM image.</p>
Full article ">Figure 3
<p>Rheological behavior of SDH in solution.</p>
Full article ">Figure 4
<p>Effect diagram, (<b>a</b>) consistency index (k<sub>H</sub>), (<b>b</b>) behavior index (n), (<b>c</b>) elastic limit (<math display="inline"><semantics> <mrow> <msub> <mrow> <mi>τ</mi> </mrow> <mrow> <mi>y</mi> </mrow> </msub> </mrow> </semantics></math>).</p>
Full article ">Figure 5
<p>SDH viscosity in solution as a function of shear rate.</p>
Full article ">Figure 6
<p>Rheopectic behavior of SDH in solution as a function of temperature.</p>
Full article ">Figure 7
<p>Suspension stability, (<b>a</b>) Turbidity variation; (<b>b</b>) Effects for turbidity; (<b>c</b>) Sedimentation variation; (<b>d</b>) Effects for sedimentation.</p>
Full article ">Figure 8
<p>(<b>a</b>) variation of ζ potential; (<b>b</b>) Effects for ζ potential; (<b>c</b>) Variation of particle size; (<b>d</b>) Effects for particle size.</p>
Full article ">Figure 9
<p>PCA for treatments.</p>
Full article ">
13 pages, 7954 KiB  
Article
Flowing Liquid-Based Triboelectric Nanogenerator Performance Enhancement with Functionalized Polyvinylidene Fluoride Membrane for Self-Powered Pulsating Flow Sensing Application
by Duy Linh Vu, Quang Tan Nguyen, Pil Seung Chung and Kyoung Kwan Ahn
Polymers 2024, 16(4), 536; https://doi.org/10.3390/polym16040536 - 16 Feb 2024
Cited by 1 | Viewed by 973
Abstract
Pulsating flow, a common term in industrial and medical contexts, necessitates precise water flow measurement for evaluating hydrodynamic system performance. Addressing challenges in measurement technologies, particularly for pulsating flow, we propose a flowing liquid-based triboelectric nanogenerator (FL-TENG). To generate sufficient energy for a [...] Read more.
Pulsating flow, a common term in industrial and medical contexts, necessitates precise water flow measurement for evaluating hydrodynamic system performance. Addressing challenges in measurement technologies, particularly for pulsating flow, we propose a flowing liquid-based triboelectric nanogenerator (FL-TENG). To generate sufficient energy for a self-powered device, we employed a fluorinated functionalized technique on a polyvinylidene fluoride (PVDF) membrane to enhance the performance of FL-TENG. The results attained a maximum instantaneous power density of 50.6 µW/cm2, and the energy output proved adequate to illuminate 10 white LEDs. Regression analysis depicting the dependence of the output electrical signals on water flow revealed a strong linear relationship between the voltage and flow rate with high sensitivity. A high correlation coefficient R2 within the range from 0.951 to 0.998 indicates precise measurement accuracy for the proposed FL-TENG. Furthermore, the measured time interval between two voltage peaks precisely corresponds to the period of pulsating flow, demonstrating that the output voltage can effectively sense pulsating flow based on voltage and the time interval between two voltage peaks. This work highlights the utility of FL-TENG as a self-powered pulsating flow rate sensor. Full article
(This article belongs to the Special Issue Polymer Materials in Sensors, Actuators and Energy Conversion II)
Show Figures

Figure 1

Figure 1
<p>Schematic diagram of the procedure for functionalizing the PVDF membrane and diagram description of the FL-TENG device.</p>
Full article ">Figure 2
<p>Schematic diagram of the experimental set up of the FL-TENG device.</p>
Full article ">Figure 3
<p>(<b>a</b>) Schematic diagram of contact electrification and the forming of EDL. (<b>b</b>) Output electrical signals of the SE-WTENG when water flows through the cell at a flow rate of 390 cc/min.</p>
Full article ">Figure 4
<p>FE-SEM and AFM images of (<b>a</b>) PVDF membrane and (<b>b</b>) F-PVDF membrane; the inset image shows a contact angle; (<b>c</b>) frequency dependence of dielectric constant, and (<b>d</b>) output current of PVDF and F-PVDF-based TENG.</p>
Full article ">Figure 5
<p>(<b>a</b>) Voltage and (<b>b</b>) transferred charge of the F-PVDF-based TENG depending on the flow rate (Different colors correspond to different flow rates shown as in the x-axis), (<b>c</b>) comparison of voltages measured at different resistances and flow rates, (<b>d</b>) voltage and power, and (<b>e</b>) power density and energy density of the F-PVDF-based TENG, measured at various resistances from 1 kW to 10 MW at a flow rate of 1170 mL/min, (<b>f</b>) charging of 4.7μF, 22μF, and 47μF capacitor by F-PVDF-based TENG.</p>
Full article ">Figure 6
<p>Electrical performance of F-PVDF-based TENG, depending on water flow conditions at a flow rate of (<b>a</b>) 130, (<b>b</b>) 390, and (<b>c</b>) 780 mL/min; regression analyses of the electrical response of FL-TENG based on (<b>d</b>) voltage and (<b>e</b>) time interval between two voltage peaks with different flow rates.</p>
Full article ">Figure 7
<p>(<b>a</b>) Time interval between two voltage peaks and (<b>b</b>) output voltage, depending on the flow rate with different FL-TENG pipe sizes; regression analyses of the electrical response of (<b>c</b>) 3 mm-pipe, (<b>d</b>) 5 mm-pipe, (<b>e</b>) 8 mm-pipe-FL-TENG based on time interval between two voltage peaks and flow rates; regression analyses of the electrical response of (<b>f</b>) 3 mm-pipe, (<b>g</b>) 5 mm-pipe, and (<b>h</b>) 8 mm-pipe-FLTENG based on voltage and flow rate.</p>
Full article ">
Previous Issue
Next Issue
Back to TopTop