[go: up one dir, main page]

Next Issue
Volume 15, August-2
Previous Issue
Volume 15, July-2
 
 
nutrients-logo

Journal Browser

Journal Browser

Nutrients, Volume 15, Issue 15 (August-1 2023) – 211 articles

Cover Story (view full-size image): 
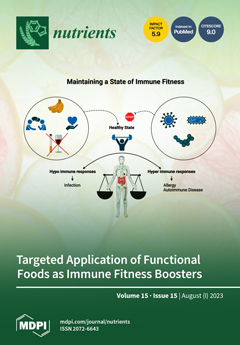
In recent times, the emergence of viral infections, including the SARS-CoV-2 virus, the monkeypox virus, and, most recently, the Langya virus, has highlighted the devastating effects of viral infection on human life. There has been significant progress in the development of efficacious vaccines for the prevention and control of viruses; however, the high rates of viral mutation and transmission necessitate the need for novel methods of control, management, and prevention. In recent years, there has been a shift in public awareness on health and wellbeing, with consumers making significant dietary changes to improve their immunity and overall health. This rising health awareness is driving a global increase in the consumption of functional foods. View this paper
  • Issues are regarded as officially published after their release is announced to the table of contents alert mailing list.
  • You may sign up for e-mail alerts to receive table of contents of newly released issues.
  • PDF is the official format for papers published in both, html and pdf forms. To view the papers in pdf format, click on the "PDF Full-text" link, and use the free Adobe Reader to open them.
Order results
Result details
Section
Select all
Export citation of selected articles as:
20 pages, 3588 KiB  
Article
Indicaxanthin Induces Autophagy in Intestinal Epithelial Cancer Cells by Epigenetic Mechanisms Involving DNA Methylation
by Maria Antonietta Ragusa, Flores Naselli, Ilenia Cruciata, Sara Volpes, Chiara Schimmenti, Graziella Serio, Maurizio Mauro, Mariangela Librizzi, Claudio Luparello, Roberto Chiarelli, Chiara La Rosa, Antonino Lauria, Carla Gentile and Fabio Caradonna
Nutrients 2023, 15(15), 3495; https://doi.org/10.3390/nu15153495 - 7 Aug 2023
Cited by 3 | Viewed by 1860
Abstract
Autophagy is an evolutionarily conserved process critical in maintaining cellular homeostasis. Recently, the anticancer potential of autophagy inducers, including phytochemicals, was suggested. Indicaxanthin is a betalain pigment found in prickly pear fruit with antiproliferative and pro-apoptotic activities in colorectal cancer cells associated with [...] Read more.
Autophagy is an evolutionarily conserved process critical in maintaining cellular homeostasis. Recently, the anticancer potential of autophagy inducers, including phytochemicals, was suggested. Indicaxanthin is a betalain pigment found in prickly pear fruit with antiproliferative and pro-apoptotic activities in colorectal cancer cells associated with epigenetic changes in selected methylation-silenced oncosuppressor genes. Here, we demonstrate that indicaxanthin induces the up-regulation of the autophagic markers LC3-II and Beclin1, and increases autophagolysosome production in Caco-2 cells. Methylomic studies showed that the indicaxanthin-induced pro-autophagic activity was associated with epigenetic changes. In addition to acting as a hypermethylating agent at the genomic level, indicaxanthin also induced significant differential methylation in 39 out of 47 autophagy-related genes, particularly those involved in the late stages of autophagy. Furthermore, in silico molecular modelling studies suggested a direct interaction of indicaxanthin with Bcl-2, which, in turn, influenced the function of Beclin1, a key autophagy regulator. External effectors, including food components, may modulate the epigenetic signature of cancer cells. This study demonstrates, for the first time, the pro-autophagic potential of indicaxanthin in human colorectal cancer cells associated with epigenetic changes and contributes to outlining its potential healthy effect in the pathophysiology of the gastrointestinal tract. Full article
(This article belongs to the Section Nutrigenetics and Nutrigenomics)
Show Figures

Figure 1

Figure 1
<p>Indicaxhanthin (IND) induces autophagy in Caco-2 cells. LC3-II (<b>A</b>) and Beclin1 (<b>B</b>) expression in treated and untreated Caco-2 cells (mean ± SD). Graphic representation (average of three independent experiments) of band densitometric analyses performed using ImageJ software. Data were normalized to α-tubulin. Asterisks represent the <span class="html-italic">p</span>-value: * <span class="html-italic">p</span> &lt;  0.05, ** <span class="html-italic">p</span> &lt; 0.01. (<b>C</b>) Representative Western blotting assay. (<b>D</b>–<b>F</b>). Representative plots for acidic vesicular organelles’ quantitation in Caco-2 cells by flow cytometry. Caco-2 cells were exposed to the medium either unsupplemented (<b>D</b>) or supplemented with IND50 (<b>E</b>) or IND100 (<b>F</b>). After 48 h, the cells were collected, stained with 100 μg/mL acridine orange, and subsequently analysed in a flow cytometer. The analyses were performed in triplicate.</p>
Full article ">Figure 2
<p>Reduced representation bisulphite sequencing (RRBS) results. (<b>A</b>) Staked column chart of % CpG methylation. Only the fully methylated (95–100%) or unmethylated (0–5%) fractions are represented. (<b>B</b>) Hierarchical clustering graph of global genomic methylation assessed in Caco-2 cells either untreated or treated with different concentrations of IND. Distance method: correlation; clustering method: ward. See also <a href="#app1-nutrients-15-03495" class="html-app">Figures S2 and S3</a>.</p>
Full article ">Figure 3
<p>IND effects on promoter methylation of autophagy genes: DMC analysis. Representative bar plots of HoBGeC-1 (<b>A</b>) and HoBGeC-2 (<b>B</b>) weighted average values. The lines indicate a robust methylation difference with respect to the controls (corresponding to a |diff.meth| &gt; 25%).</p>
Full article ">Figure 4
<p>IND induces BECN1 promoter demethylation. MSRE-PCR of <span class="html-italic">BECN1</span> promoter in treated and untreated Caco-2 cells. Caco-2 cells were exposed to the medium, either unsupplemented (Ctrl), or supplemented with IND10, IND50, or IND100, or 10 μM 5-azaC. At the end of the incubation period, the genomic DNA was isolated and quantified, and MSRE-PCR was performed, as reported in the methods. (<b>A</b>,<b>B</b>) CpG sites 126 and 255, respectively (L = 50 bp ladder; U = undigested; H′ and H″ = samples digested by <span class="html-italic">Hpa</span>II). (<b>C</b>,<b>D</b>): CpG sites 299 and 472, respectively (L = 50 bp ladder; U = undigested; H = samples digested by <span class="html-italic">Hha</span>I).</p>
Full article ">Figure 5
<p>IND affects Beclin1−Bcl-2 interaction and BECN1 regulation. (<b>A</b>) Three-dimensional representation of binding of Beclin1 to Bcl-2 active site (PDB id 5VAU). (<b>B</b>) Three-dimensional representation and (<b>C</b>) amino acids map of the IND − Bcl-2 binding mode after 10 ns of molecular dynamic simulation. (<b>D</b>) Potential energy in the molecular dynamic simulation for the IND–Bcl-2 complex. (<b>E</b>) Hypothetical interference mechanism of IND in Beclin1−Bcl-2 interaction. Protein drawings are based on Bcl-2 (PDB ID 5VAU) and Beclin1 (Alphafold ID AF-Q14457-F1) structures. (<b>F</b>) UCSC Genome Browser view of the <span class="html-italic">BECN1</span> promoter (hg38 assembly). The Browser view includes a custom track, which shows RRBS and MSRE-PCR results. Top: known transcription factors and DNMT3B binding sites.</p>
Full article ">
14 pages, 525 KiB  
Article
Changes in Food Consumption in Postmenopausal Women during the COVID-19 Pandemic: A Longitudinal Study
by Priscilla Rayanne E. Silva Noll, Monique G. Nascimento, Luiza Helena Costa Moreira Bayer, Juliana Zangirolami-Raimundo, José Antonio Orellana Turri, Matias Noll, Edmund Chada Baracat, José Maria Soares Junior and Isabel Cristina Esposito Sorpreso
Nutrients 2023, 15(15), 3494; https://doi.org/10.3390/nu15153494 - 7 Aug 2023
Cited by 3 | Viewed by 2410
Abstract
Studying the dietary habits and symptoms of postmenopausal women during situations such as the COVID-19 pandemic is important to mitigate long-term post-pandemic health problems. We compared the menopausal symptoms and food consumption in postmenopausal women before and during the COVID-19 pandemic. A longitudinal [...] Read more.
Studying the dietary habits and symptoms of postmenopausal women during situations such as the COVID-19 pandemic is important to mitigate long-term post-pandemic health problems. We compared the menopausal symptoms and food consumption in postmenopausal women before and during the COVID-19 pandemic. A longitudinal survey was conducted on postmenopausal Brazilian women between 2018 and 2021. The Kupperman–Blatt Menopausal Index, Women’s Health Questionnaire, and 24 h food recall were used. Of 274 women, 78 (28.5%) participated in the study during the COVID-19 pandemic. The intensity of the symptoms was lower during the pandemic than during the previous period (p < 0.05). Energy and processed food consumption were lower during the pandemic than before (p = 0.003 and p = 0.003, respectively). Milk and plain yogurt consumption were also lower (p = 0.043), while the consumption of sugar-sweetened beverages and sweet foods was higher (p = 0.007 and p = 0.001, respectively) during the pandemic. There was also a decrease in the consumption of proteins and lipids (p = 0.001 and p = 0.004, respectively). In conclusion, we found that postmenopausal women consumed sweet foods and sugar-sweetened beverages in higher quantities and had a lower consumption of milk and plain yogurt and processed foods during the pandemic than during the pre-pandemic period. Furthermore, decreases in energy and macronutrient consumption were observed. Full article
Show Figures

Figure 1

Figure 1
<p>Flowchart of participants in the study cohort.</p>
Full article ">
11 pages, 876 KiB  
Article
Vitamin D Intake and Serum Levels in Pregnant and Postpartum Women
by Laila Meija, Anna Piskurjova, Ksenija Nikolajeva, Olga Aizbalte, Roberta Rezgale, Aivars Lejnieks and Vinita Cauce
Nutrients 2023, 15(15), 3493; https://doi.org/10.3390/nu15153493 - 7 Aug 2023
Viewed by 1836
Abstract
Maternal vitamin D deficiency, which is highly prevalent in pregnant women in Europe, is linked to adverse health effects for both the mother and child. The objective was to assess vitamin D status in pregnant women by evaluating their dietary and supplemental vitamin [...] Read more.
Maternal vitamin D deficiency, which is highly prevalent in pregnant women in Europe, is linked to adverse health effects for both the mother and child. The objective was to assess vitamin D status in pregnant women by evaluating their dietary and supplemental vitamin D intake, serum vitamin D levels, parathyroid hormone levels, and lifestyle factors. This cross-sectional study, with a total of 735 participants (145 pregnant and 590 up to the seventh day postpartum), took place in Latvia. Blood samples, a food frequency questionnaire, and medical documentation were used for data collection. The median serum vitamin D concentration was 34.0 ng/mL, with pregnant women having higher levels (42.9 ng/mL) than postpartum women (31.8 ng/mL). There was no association between vitamin D serum concentration and dietary intake of vitamin D (p > 0.05), whereas there was a significant correlation with use of vitamin D supplements (r = 0.41; p < 0.001 in pregnant women and r = 0.35; p < 0.001 in postpartum women). This study demonstrated that a minority of pregnant women (21.9%) had optimal serum vitamin D concentration (>45 ng/mL), and diet had no significant impact on vitamin D levels. Thus, our proposed recommendation for vitamin D intake during pregnancy was 63 mcg (2500 IU) year-round for optimal levels in pregnant women in Northeastern Europe. Full article
Show Figures

Figure 1

Figure 1
<p>Vitamin D serum concentration by thresholds.</p>
Full article ">Figure 2
<p>Vitamin D concentration in pregnant and postpartum women in different seasons.</p>
Full article ">
13 pages, 3133 KiB  
Article
Association between Adiposity and Bone Mineral Density in Adults: Insights from a National Survey Analysis
by Yang Jiao, Juan Sun, Yuanmeng Li, Junduo Zhao and Jianxiong Shen
Nutrients 2023, 15(15), 3492; https://doi.org/10.3390/nu15153492 - 7 Aug 2023
Cited by 5 | Viewed by 2060
Abstract
Adiposity and bone mineral density (BMD) are closely associated. The aim of this research was to investigate the association between BMD and adiposity measures in adults, including gynoid percent fat (GPF), android percent fat (APF), total percent fat (TPF), visceral adipose tissue percent [...] Read more.
Adiposity and bone mineral density (BMD) are closely associated. The aim of this research was to investigate the association between BMD and adiposity measures in adults, including gynoid percent fat (GPF), android percent fat (APF), total percent fat (TPF), visceral adipose tissue percent (VAT%), and total lean mass percent (TLM%). Participants (n = 11,615) aged 18 years and older were analyzed using data from the National Health and Nutrition Examination Survey (NHANES) spanning from 1999 to 2018. Associations between BMD and adiposity measures were investigated, and potential differences based on gender and age were explored. Significant negative associations were observed among TPF, APF, GPF, VAT%, and BMD in the fully adjusted models, while TLM% and BMD were positively associated. Stratifying by age and sex, TPF, GPF, and VAT% consistently demonstrated a negative correlation with BMD. In the young adult group, a TPF of 38.2% eliminated the negative correlation between BMD and TPF. Male BMD exhibited an inverted U-shaped relationship with APF, peaking at 35.6%, while a similar pattern was observed for the middle-aged group BMD and APF, with a peak at 31.7%. This large-sample research found a significant negative association between adiposity measures and BMD, providing valuable revelations regarding the intricate connection between adiposity and bone health. Full article
(This article belongs to the Special Issue Association between Metabolic Syndrome and the Musculoskeletal System)
Show Figures

Figure 1

Figure 1
<p>Relationship between BMD and total percent fat. (<b>a</b>) Each black dot on the graph denotes a single sample and the red line represents the fitted line for all participants. (<b>b</b>,<b>c</b>) Association of BMD with TPF stratified by sex and age. Baseline characteristics were adjusted. The subgroup analyses were performed without adjusting for sex and age.</p>
Full article ">Figure 2
<p>Relationship between BMD and android percent fat. (<b>a</b>) Each black dot on the graph denotes a single sample and the red line represents the fitted line for all participants. (<b>b</b>,<b>c</b>) Association between BMD and APF stratified by sex and age. Baseline characteristics were adjusted. The subgroup analyses were performed without adjusting for sex and age.</p>
Full article ">Figure 3
<p>Relationship between BMD and gynoid percent fat. (<b>a</b>) Each black dot on the graph denotes a single sample and the red line represents the fitted line for all participants. (<b>b</b>,<b>c</b>) Association between BMD and GPF stratified by sex and age. Baseline characteristics were adjusted. The subgroup analyses were performed without adjusting for sex and age.</p>
Full article ">Figure 4
<p>Relationship between BMD and visceral adipose tissue percent (%). (<b>a</b>) Each black dot on the graph denotes a single sample and the red line represents the fitted line for all participants. (<b>b</b>,<b>c</b>) Association between BMD and VAT% stratified by sex and age. Baseline characteristics were adjusted. The subgroup analyses were performed without adjusting for sex and age.</p>
Full article ">Figure 5
<p>Relationship between BMD and total lean mass percent (%). (<b>a</b>) Each black dot on the graph denotes a single sample and the red line represents the fitted line for all participants. (<b>b</b>,<b>c</b>) Association between BMD and TLM% stratified by sex and age. Baseline characteristics were adjusted. The subgroup analyses were performed without adjusting for sex and age.</p>
Full article ">
13 pages, 758 KiB  
Article
The Effect of the Rice Endosperm Protein Hydrolysate on the Subjective Negative Mood Status in Healthy Humans: A Randomized, Double-Blind, and Placebo-Controlled Clinical Trial
by Ryoko Nakayama, Daisuke Nishi, Masaru Sato, Akira Ito, Kimiko Uchiyama, Yuki Higuchi, Hajime Takahashi and Kousaku Ohinata
Nutrients 2023, 15(15), 3491; https://doi.org/10.3390/nu15153491 - 7 Aug 2023
Cited by 1 | Viewed by 1769
Abstract
The rice endosperm protein (REP) hydrolysate containing the following rice endosperm protein derived oligopeptides QQFLPEGQSQSQK, LPEGQSQSQK, and pEQFLPEGQSQSQK (a N-terminal pyroglutamate residue-modified peptide) reportedly showed an antidepressant-like effect in an animal model. We investigated the effect of the REP hydrolysate on healthy [...] Read more.
The rice endosperm protein (REP) hydrolysate containing the following rice endosperm protein derived oligopeptides QQFLPEGQSQSQK, LPEGQSQSQK, and pEQFLPEGQSQSQK (a N-terminal pyroglutamate residue-modified peptide) reportedly showed an antidepressant-like effect in an animal model. We investigated the effect of the REP hydrolysate on healthy humans who self-reported mental fatigue with subjectively low vigor. Seventy-six participants (age: 20–64 years) were randomly allocated to two groups. The influence of the REP hydrolysate on the mood state was evaluated in two studies: single intake (Study 1) and repeated intake over 4 weeks (Study 2). A salivary stress marker, Chromogranin A (CgA), was measured in Study 1. The single intake of the REP hydrolysate significantly improved the Profile of Mood Status 2nd edition for adults (POMS 2) subscale of Tension–Anxiety. Additionally, the salivary CgA concentrations were remarkably reduced after the single intake of the REP hydrolysate. Though a single intake of the REP hydrolysate did not significantly influence the other subscales and the TMD of the POMS 2 and the Euthymia Scale, both the subjective and objective results supported the possible effect of the REP hydrolysate on reducing anxiety and nervousness. No significant positive effects on the subjective mood state (Euthymia Scale and POMS 2) and sleep quality (Insomnia Severity Index) were observed in the trial setting employed for Study 2. In conclusion, a single intake of REP hydrolysate might help relax the subjective feelings of tension and anxiety. The effectiveness of repeated REP hydrolysate intake needs to be tested in a different clinical setting. Full article
(This article belongs to the Section Clinical Nutrition)
Show Figures

Figure 1

Figure 1
<p>Flow diagram for study participants’ eligibility, enrollment, and followup.</p>
Full article ">
9 pages, 944 KiB  
Article
Fermentation and Quality Characteristics of Yogurt Treated with Bifidobacterium longum
by Jang Keun Son, Yeon Jae Jo, Yun Jo Jung, Youn Ri Lee, Junsoo Lee and Heon Sang Jeong
Nutrients 2023, 15(15), 3490; https://doi.org/10.3390/nu15153490 - 7 Aug 2023
Cited by 1 | Viewed by 1787
Abstract
The fermentation and quality characteristics of yogurt were investigated according to the inoculation concentration of Bifidobacterium longum. The total sugar content of yogurt decreased as the fermentation time increased, and with an increased concentration of B. longum treatment the fermentation time decreased [...] Read more.
The fermentation and quality characteristics of yogurt were investigated according to the inoculation concentration of Bifidobacterium longum. The total sugar content of yogurt decreased as the fermentation time increased, and with an increased concentration of B. longum treatment the fermentation time decreased rapidly. As fermentation progressed, the lactose content decreased rapidly at the beginning and gradually decreased as the pH decreased. Depending on the B. longum treatment concentration, the lactose content varied from 0.29 ± 0.01 to 0.47 ± 0.01% and was 0.5% or less in all experimental groups. The experimental group inoculated with 0.0015% of B. longum displayed the best results in all categories, including pH, total acidity, lactic acid content, solid non-fat content, and total lactic acid bacteria count, which are factors that determine the quality of yogurt. In summary, the experimental group inoculated with 0.0015% of B. longum was determined to be the highest quality yogurt. Full article
(This article belongs to the Section Prebiotics and Probiotics)
Show Figures

Figure 1

Figure 1
<p>Change of lactic acid content in yogurt added with <span class="html-italic">Bifidobacterium longum</span> and lactase. Each value is expressed as the mean ±standard deviation (n = 3); means in the same fermentation time (a–d) are significantly different (<span class="html-italic">p</span> &lt; 0.05) by Duncan’s multiple range test.</p>
Full article ">Figure 2
<p>Change of viscosity in yogurt added with <span class="html-italic">Bifidobacterium longum</span> and lactase. Each value is expressed as the mean ± standard deviation (n = 3); means in the same fermentation time (a–d) are significantly different (<span class="html-italic">p</span> &lt; 0.05) by Duncan’s multiple range test.</p>
Full article ">Figure 3
<p>Change of solid not fat content in yogurt added with <span class="html-italic">Bifidobacterium longum</span> and lactase. Each value is expressed as the mean ± standard deviation (n = 3); means in the same fermentation time (a–d) are significantly different (<span class="html-italic">p</span> &lt; 0.05) by Duncan’s multiple range test.</p>
Full article ">Figure 4
<p>Change in total lactic acid bacteria count in yogurt added with <span class="html-italic">Bifidobacterium longum</span> and lactase. Each value is expressed as the mean ± standard deviation (n = 3); means in the same fermentation time (a–d) are significantly different (<span class="html-italic">p</span> &lt; 0.05) by Duncan’s multiple range test.</p>
Full article ">
18 pages, 3746 KiB  
Article
Construction of a QSAR Model Based on Flavonoids and Screening of Natural Pancreatic Lipase Inhibitors
by Yutong Yuan, Fei Pan, Zehui Zhu, Zichen Yang, Ou Wang, Qing Li, Liang Zhao and Lei Zhao
Nutrients 2023, 15(15), 3489; https://doi.org/10.3390/nu15153489 - 7 Aug 2023
Cited by 2 | Viewed by 1659
Abstract
Pancreatic lipase (PL) is a key hydrolase in lipid metabolism. Inhibition of PL activity can intervene in obesity, a global sub-health disease. The natural product is considered a good alternative to chemically synthesized drugs due to its advantages, such as low side effects. [...] Read more.
Pancreatic lipase (PL) is a key hydrolase in lipid metabolism. Inhibition of PL activity can intervene in obesity, a global sub-health disease. The natural product is considered a good alternative to chemically synthesized drugs due to its advantages, such as low side effects. However, traditional experimental screening methods are labor-intensive and cost-consuming, and there is an urgent need to develop high-throughput screening methods for the discovery of anti-PL natural products. In this study, a high-throughput virtual screening process for anti-PL natural products is provided. Firstly, a predictable anti-PL natural product QSAR model (R2train = 0.9444, R2test = 0.8962) were developed using the artificial intelligence drug design software MolAIcal based on genetic algorithms and their conformational relationships. 1068 highly similar (FS > 0.8) natural products were rapidly enriched based on the structure-activity similarity principle, combined with the QSAR model and the ADMET model, for rapid prediction of a total of five potentially efficient anti-PL natural products (IC50pre < 2 μM). Subsequently, molecular docking, molecular dynamics simulation, and MMGBSA free energy calculation were performed to not only reveal the interaction of candidate novel natural products with the amino acid residues of PL but also to validate the stability of these novel natural compounds bound to PL. In conclusion, this study greatly simplifies the screening and discovery of anti-PL natural products and accelerates the development of novel anti-obesity functional foods. Full article
Show Figures

Figure 1

Figure 1
<p>Tree structure, representing the structuring of the flavonoid compounds by the position and nature of their substituents in the aromatic ring, which were tested for their inhibitory activity against the pancreatic lipase.</p>
Full article ">Figure 2
<p>MLR-QSAR linear regression models. Predicted inhibitory activity against the experimental inhibitory activity of dataset compounds.</p>
Full article ">Figure 3
<p>Relative importance of descriptors.</p>
Full article ">Figure 4
<p>Optimal autocorrelation analysis in MLR−QSAR models.</p>
Full article ">Figure 5
<p>Docking diagrams of the screened compounds with the pancreatic lipase enzyme molecule. Hydrogen bonds are represented by yellow dotted lines. (<b>A</b>) PL-CNP0186639. (<b>B</b>) PL-CNP0221970. (<b>C</b>) PL-CNP0358253. (<b>D</b>) PL-CNP0286940. (<b>E</b>) PL-CNP0206087. (<b>F</b>) Orlistat (Positive control).</p>
Full article ">Figure 6
<p>Molecular dynamics (100 ns) results for six enzymatic. (<b>A</b>) Root mean square fluctuation (RMSF, nm) of PL-Orlistat, PL-CNP0186639, and PL-CNP0221970. (<b>B</b>) Root mean square fluctuation (RMSF, nm) of PL-CNP0358253, PL-CNP0286940, and PL-CNP0206087. (<b>C</b>) Root mean square deviations (RMSD, nm) of PL-Orlistat, PL-CNP0186639, and PL-CNP0221970. (<b>D</b>) Root mean square deviations (RMSD, nm) of PL-CNP0358253, PL-CNP0286940, and PL-CNP0206087. (<b>E</b>) Solvent Accessible Surface of PL-Orlistat, PL-CNP0186639, and PL-CNP0221970. (<b>F</b>) Solvent Accessible Surface of PL-CNP0358253, PL-CNP0286940, and PL-CNP0206087. (<b>G</b>) The number of hydrogen bonds formed between the active compounds and 1LPB of PL-Orlistat, PL-CNP0186639, and PL-CNP0221970. (<b>H</b>) The number of hydrogen bonds formed between the active compounds and 1LPB of PL-CNP0358253, PL-CNP0286940, and PL-CNP0206087.</p>
Full article ">
14 pages, 764 KiB  
Article
Development and Validation of Nutrition Literacy Assessment Instrument for Chinese Lactating Women: A Preliminary Study
by Zhao Li, Yalin Zhou, Yuwei Tan, Xiaoyu Zhu, Wei Liu, Yuhan Chen, Yong Qin, Ruijun Li, Lanlan Yu, Runlong Zhao and Yajun Xu
Nutrients 2023, 15(15), 3488; https://doi.org/10.3390/nu15153488 - 7 Aug 2023
Viewed by 1590
Abstract
This study focused on the development and validation of a nutrition literacy assessment instrument for Chinese lactating women (NLAI-L). A comprehensive literature review and group discussion by experts in relevant fields were adopted to determine the dimension, topics and questions of NLAI-L. Content [...] Read more.
This study focused on the development and validation of a nutrition literacy assessment instrument for Chinese lactating women (NLAI-L). A comprehensive literature review and group discussion by experts in relevant fields were adopted to determine the dimension, topics and questions of NLAI-L. Content validity was evaluated by a panel of experts. The exploratory factor analyses (EFA) and confirmatory factor analyses (CFA) were used to evaluate the construct validity. Cronbach’s α and split-half reliability were applied to examine the reliability of NLAI-L. The final NLAI-L consisted of 38 questions covering three dimensions: knowledge, behavior and skill. The EFA revealed four sub-domains for knowledge, one sub-domain for behavior and four sub-domains for skill. The results showed that NLAI-L had satisfactory content validity (CVI = 0.98, CVR = 0.96), good reliability (Cronbach’s α coefficient = 0.84) and acceptable construct validity (χ2/df = 2.28, GFI = 2.81, AGFI = 0.79, RMSEA = 0.057). In the application part, the average NL score was 46.0 ± 9.3. In multivariate linear regression, education level, age, postnatal period and occupation were the potential influencing factors of NL for Chinese lactating women. The study established an effective and reliable assessment instrument for Chinese lactating women (NLAI-L) through qualitative and quantitative methods. The establishment of NLAI-L will provide an effective tool for exploring the role of NL in health or disease and provide a basis for the formulation of targeted nutrition interventions. Full article
(This article belongs to the Special Issue China National Nutrition Survey: 2nd Edition)
Show Figures

Figure 1

Figure 1
<p>The flow chart of the study on the development, validation and application of nutrition literacy assessment instrument for Chinese lactating women (NLAI-L).</p>
Full article ">Figure 2
<p>Venn diagram of influencing factors of NL scores in Chinese lactating women.</p>
Full article ">
31 pages, 2886 KiB  
Review
Evaluation and Management of Nutritional Consequences of Chronic Liver Diseases
by Silvia Espina, Diego Casas-Deza, Vanesa Bernal-Monterde, María José Domper-Arnal, Sandra García-Mateo and Alberto Lué
Nutrients 2023, 15(15), 3487; https://doi.org/10.3390/nu15153487 - 7 Aug 2023
Cited by 4 | Viewed by 3459
Abstract
Liver diseases are the major predisposing conditions for the development of malnutrition, sarcopenia, and frailty. Recently, the mechanism of the onset of these complications has been better established. Regardless of the etiology of the underlying liver disease, the clinical manifestations are common. The [...] Read more.
Liver diseases are the major predisposing conditions for the development of malnutrition, sarcopenia, and frailty. Recently, the mechanism of the onset of these complications has been better established. Regardless of the etiology of the underlying liver disease, the clinical manifestations are common. The main consequences are impaired dietary intake, altered macro- and micronutrient metabolism, energy metabolism disturbances, an increase in energy expenditure, nutrient malabsorption, sarcopenia, frailty, and osteopathy. These complications have direct effects on clinical outcomes, survival, and quality of life. The nutritional status should be assessed systematically and periodically during follow-up in these patients. Maintaining and preserving an adequate nutritional status is crucial and should be a mainstay of treatment. Although general nutritional interventions have been established, special considerations are needed in specific settings such as decompensated cirrhosis, alcohol-related liver disease, and metabolic-dysfunction-associated fatty liver disease. In this review, we summarize the physiopathology and factors that impact the nutritional status of liver disease. We review how to assess malnutrition and sarcopenia and how to prevent and manage these complications in this setting. Full article
Show Figures

Figure 1

Figure 1
<p>Main factors of sarcopenia in liver cirrhosis.</p>
Full article ">Figure 2
<p>Algorithm for nutritional screening and assessment in liver cirrhosis.</p>
Full article ">Figure 3
<p>Diagnosis of malnutrition and severity grading based on GLIM criteria.</p>
Full article ">Figure 4
<p>Lifestyle recommendations for patients with MAFLD.</p>
Full article ">Figure 5
<p>General nutritional recommendations for ALD patients.</p>
Full article ">
24 pages, 676 KiB  
Article
Associations of Dietary Intake and Nutrient Status with Micronutrient and Lipid Composition in Breast Milk of Donor Women
by Noelia Ureta-Velasco, Adriana Montealegre-Pomar, Kristin Keller, Diana Escuder-Vieco, Javier Fontecha, María V. Calvo, Javier Megino-Tello, José C. E. Serrano, Nadia Raquel García-Lara and Carmen R. Pallás-Alonso
Nutrients 2023, 15(15), 3486; https://doi.org/10.3390/nu15153486 - 7 Aug 2023
Cited by 3 | Viewed by 1759
Abstract
The influence of the diet and nutritional status of milk donors on the nutritional composition of donor human milk (DHM) is unknown. The present study aimed to determine the nutritional profile of DHM and the associations between donors’ dietary intake and nutritional status [...] Read more.
The influence of the diet and nutritional status of milk donors on the nutritional composition of donor human milk (DHM) is unknown. The present study aimed to determine the nutritional profile of DHM and the associations between donors’ dietary intake and nutritional status and the micronutrient and lipid composition in DHM. For this purpose, 113 donors completed a food frequency questionnaire, provided a five-day weighed dietary record, and collected milk for five consecutive days. Nutrient determinations in donors’ erythrocytes, plasma, urine, and milk were performed. Multiple linear regressions were conducted for the evaluation of the associations. We highlight the following results: DHM docosahexaenoic acid (DHA) was positively associated with donors’ plasma DHA content and donors’ DHA intake (R2 0.45, p < 0.001). For every 1 g/day DHA intake, an increase of 0.38% in DHA content and 0.78% in total omega-3 content was observed in DHM (R2 0.29, p < 0.001). DHM saturated fatty acids were positively associated with erythrocyte dimethyl acetals, plasma stearic acid, trans fatty acids intake, and breastfeeding duration and negatively associated with erythrocyte margaroleic acid (R2 0.34, p < 0.01). DHM cholecalciferol was associated with plasma cholecalciferol levels and dairy intake (R2 0.57, p < 0.01). Other weaker associations were found for free thiamin, free riboflavin, pyridoxal, dehydroascorbic acid, and the lipid profile in DHM. In conclusion, the diet and nutritional status of donors influence the fatty acid profile and micronutrient content of DHM. Full article
(This article belongs to the Section Pediatric Nutrition)
Show Figures

Figure 1

Figure 1
<p>Study protocol flowchart. * Provided to the RHMB during the first 15 days after the end of the study. Abbreviations: S-D, sociodemographic; FFQ, food frequency questionnaire.</p>
Full article ">
20 pages, 3233 KiB  
Article
Transcriptomic Analysis of Human Skeletal Muscle in Response to Aerobic Exercise and Protein Intake
by Xueqing Zeng, Linghong Li, Zhilin Xia, Lianhong Zou, Timothy Kwok and Yi Su
Nutrients 2023, 15(15), 3485; https://doi.org/10.3390/nu15153485 - 7 Aug 2023
Viewed by 1586
Abstract
This study aimed to provide a more comprehensive molecular insight into the effects of aerobic exercise (AE), protein intake (PI), and AE combined with PI on human skeletal muscle by comparing their transcriptomic profiles. Fourteen published datasets obtained from the Gene Expression Omnibus [...] Read more.
This study aimed to provide a more comprehensive molecular insight into the effects of aerobic exercise (AE), protein intake (PI), and AE combined with PI on human skeletal muscle by comparing their transcriptomic profiles. Fourteen published datasets obtained from the Gene Expression Omnibus (GEO) database were used. The hub genes were identified in response to acute AE (ACTB, IL6), training AE (UBB, COL1A1), PI (EZH2), acute AE combined with PI (DDIT3), and training AE combined with PI (MYC). Both FOS and MYC were upregulated in response to acute AE, and they were, respectively, downregulated by higher PI and a combination of AE and PI. COL1A1 was upregulated by training AE but was downregulated by higher PI. Results from the gene set enrichment analysis (p < 0.05 and FDR < 25%) showed that AE and PI delivered their impacts on human skeletal muscle in analogous pathways, including aerobic respiration, mitochondrial complexes, extracellular matrix (ECM) remodeling, metabolic process, and immune/inflammatory responses, whereas, PI may attenuate the response of immune/inflammation and ECM remodeling which would be promoted by AE, irrespective of its types. Compared to PI alone, acute AE combined with PI would further promote protein turnover and synthesis, but suppress skeletal muscle contraction and movement. Full article
(This article belongs to the Special Issue Nutrition Role in Bone and Muscle Health)
Show Figures

Figure 1

Figure 1
<p>(<b>A</b>,<b>B</b>) The number of identified DEGs in each dataset and co-DEGs from each intervention among different populations. Note: AE, aerobic exercise; PI, protein intake; Y, the younger one; O, the older one; M, male; F, female; YM, the younger male; OM, the older male; OF, the older female.</p>
Full article ">Figure 2
<p>The GO enrichment analysis of co-DEGs from varied interventions in the younger male. (<b>A</b>) acute AE; (<b>B</b>) training AE; (<b>C</b>) PI; (<b>D</b>) acute AE combined with PI; (<b>E</b>) training AE combined with PI. Note: GO, Gene Ontology; co-DEGs, co-differentially expressed genes; AE, aerobic exercise; PI, protein intake.</p>
Full article ">Figure 3
<p>The KEGG enrichment analysis of co-DEGs from varied interventions in the younger male. (<b>A</b>) acute AE; (<b>B</b>) training AE; (<b>C</b>) PI; (<b>D</b>) acute AE combined with PI; (<b>E</b>) training AE combined with PI. Note: KEGG, Kyoto Encyclopedia of Genes and Genomes; co-DEGs, co-differentially expressed genes; AE, aerobic exercise; PI, protein intake.</p>
Full article ">Figure 4
<p>The gene sets related GO terms from GSEA in each dataset of AE in the younger male. (<b>A</b>) GSE43856—Acute AE; (<b>B</b>) GSE59088—acute AE; (<b>C</b>) GSE126296—acute AE; (<b>D</b>) GSE111551—training AE. Note: GO, Gene Ontology; GSEA, gene set enrichment analysis; AE, aerobic exercise; NES, normalized enrichment score.</p>
Full article ">Figure 5
<p>The top 5 KEGG pathway-related gene sets from GSEA in each dataset of AE in the younger male. (<b>A</b>) GSE43856—acute AE; (<b>B</b>) GSE59088—acute AE; (<b>C</b>) GSE126296—acute AE; (<b>D</b>) GSE111551—training AE. Note: KEGG, Kyoto Encyclopedia of Genes and Genomes; GSEA, gene set enrichment analysis; AE, aerobic exercise.</p>
Full article ">
16 pages, 3891 KiB  
Article
The Effects of Cellular Membrane Damage on the Long-Term Storage and Adhesion of Probiotic Bacteria in Caco-2 Cell Line
by Jakub Kiepś, Wojciech Juzwa, Anna Olejnik, Anna Sip, Jolanta Tomaszewska-Gras and Radosław Dembczyński
Nutrients 2023, 15(15), 3484; https://doi.org/10.3390/nu15153484 - 7 Aug 2023
Cited by 6 | Viewed by 1611
Abstract
Adhesion is one of the main factors responsible for the probiotic properties of bacteria in the human gut. Membrane proteins affected by cellular damage are one of the key aspects determining adhesion. Fluid-bed-dried preparations containing probiotic bacteria were analyzed in terms of their [...] Read more.
Adhesion is one of the main factors responsible for the probiotic properties of bacteria in the human gut. Membrane proteins affected by cellular damage are one of the key aspects determining adhesion. Fluid-bed-dried preparations containing probiotic bacteria were analyzed in terms of their stability (temperature of glass transition) and shelf life in different conditions (modified atmosphere, refrigeration). Imaging flow cytometry was utilized to determine four subpopulations of cells based on their physiological and morphological properties. Lastly, adhesion was measured in bacteria cultured in optimal conditions and treated with heat shock. The results show that the subpopulations with no or low levels of cell membrane damage exhibit the ability to adhere to Caco-2 cells. The temperature of protein denaturation in bacteria was recorded as being between 65 °C and 70 °C. The highest glass transition temperature (Tg) value for hydroxypropyl methylcellulose (used as a coating substance) was measured at 152.6 °C. Drying and coating can be utilized as a sufficient treatment, allowing a long shelf-life (up to 12 months). It is, however, worth noting that technological processing, especially with high temperatures, may decrease the probiotic value of the preparation by damaging the bacterial cells. Full article
(This article belongs to the Special Issue The Probiotics and Prebiotics and Their Benefits for Health)
Show Figures

Figure 1

Figure 1
<p>DSC graph of probiotic preparations with different coatings. C—dried, uncoated sample; GA—sample coated with gum arabic; HPMC—sample coated with hydroxypropyl methylcellulose; shellac—sample coated with shellac.</p>
Full article ">Figure 2
<p>TG/DTA for (<b>A</b>) control (dried, uncoated); (<b>B</b>) samples coated with gum arabic; (<b>C</b>) samples coated with hydroxypropyl-methylcellulose; (<b>D</b>) samples coated with shellac.</p>
Full article ">Figure 3
<p>SEM pictures of dried probiotics coated with different materials. (<b>A</b>) Uncoated, (<b>B</b>) gum Arabic, (<b>C</b>) hydroxypropyl methylcellulose, (<b>D</b>) shellac.</p>
Full article ">Figure 4
<p>SEM picture of the surface of microcellulose matrix after drying with visible bacterial cells on its surface.</p>
Full article ">Figure 5
<p>Percentages of cell subpopulations in samples pre adhesion. CD—<span class="html-italic">C. divergens</span>; CD_HS—<span class="html-italic">C. divergens</span> after heat shock; EF—<span class="html-italic">E. faecium</span>; EF_HS—<span class="html-italic">E. faecium</span> after heat shock; LM—<span class="html-italic">L. mesenteroides</span>; LM_HS—<span class="html-italic">L. mesenteroides</span> after heat shock.</p>
Full article ">Figure 6
<p>Percentages of cell subpopulations in samples post adhesion. CD—<span class="html-italic">C. divergens</span>; CD_HS—<span class="html-italic">C. divergens</span> after heat shock; EF—<span class="html-italic">E. faecium</span>; EF_HS—<span class="html-italic">E. faecium</span> after heat shock; LM—<span class="html-italic">L.mesenteroides</span>; LM_HS—<span class="html-italic">L. mesenteroides</span> after heat shock.</p>
Full article ">Figure 7
<p>Example of adherence pattern in <span class="html-italic">E. faecium</span> visualized using DRAQ5 and WGA membrane dyes.</p>
Full article ">Figure 8
<p>DSC graph of thermal stability for <span class="html-italic">E. faecium</span> and <span class="html-italic">C. divergens</span> cultured under optimal conditions and after heat shock. The curves for denaturation are circled.</p>
Full article ">Figure 9
<p>(<b>A</b>) <span class="html-italic">E. faecium</span> viability after storage under different conditions (−20 °C, 4 °C, 20° and packaging atmosphere with air, N2, and vacuum) for dried samples; (<b>B</b>) <span class="html-italic">E. faecium</span> viability after storage under different conditions (−20 °C, 4 °C, 20° and packaging atmosphere with air, N2, and vacuum) for coated samples; (<b>C</b>) <span class="html-italic">L. mesenteroides</span> viability after storage under different conditions (−20 °C, 4 °C, 20° and packaging atmosphere with air, N2, and vacuum) for dried samples; (<b>D</b>) <span class="html-italic">E. faecium</span> viability after storage under different conditions (−20 °C, 4 °C, 20° and packaging atmosphere with air, N2, and vacuum) for coated samples.</p>
Full article ">Figure 10
<p>Comparison of percentages of cell subpopulations in dried and coated samples directly after processing and after 12 months of storage.</p>
Full article ">
14 pages, 977 KiB  
Review
Glycemic Index and Glycemic Load Estimates in the Dietary Approach of Polycystic Ovary Syndrome
by Aspasia Manta, Stavroula A. Paschou, Georgia Isari, Ioanna Mavroeidi, Sophia Kalantaridou and Melpomeni Peppa
Nutrients 2023, 15(15), 3483; https://doi.org/10.3390/nu15153483 - 7 Aug 2023
Cited by 3 | Viewed by 3302
Abstract
Polycystic ovary syndrome is a common endocrine disorder characterized by hormonal imbalances and various metabolic abnormalities linked to insulin resistance via a vicious cycle. Genetic and environmental factors underlie its pathogenesis and evolution. Nutrition, in terms of nutrient composition, dietary patterns, endocrine-disrupting chemicals, [...] Read more.
Polycystic ovary syndrome is a common endocrine disorder characterized by hormonal imbalances and various metabolic abnormalities linked to insulin resistance via a vicious cycle. Genetic and environmental factors underlie its pathogenesis and evolution. Nutrition, in terms of nutrient composition, dietary patterns, endocrine-disrupting chemicals, and food processing and preparation, has gained significant attention in the pathogenesis and the therapeutic approach of polycystic ovary syndrome. Carbohydrate intake seems to be a critical point in the diet assignment. Glycemic index and glycemic load constitute indexes of the impacts of dietary carbohydrates on postprandial glucose levels. Numerous studies have indicated that a high glycemic index and glycemic load diet may exacerbate insulin resistance, a key feature of the syndrome, and offer a risk for its development and its complications. Conversely, low-glycemic index and low-glycemic load diets seem to improve insulin sensitivity, regulate menstrual cycles, and mitigate the risk of comorbidities associated with polycystic ovary syndrome, such as obesity, alterations in body composition, type 2 diabetes, cardiovascular disease, and quality of life. This comprehensive review aims to explore the relevance of nutrition and more specifically, the association of glycemic index and glycemic load with the various aspects of polycystic ovary syndrome, as well as to assess the potential benefits of manipulating those indexes in the dietary approach for the syndrome. Full article
Show Figures

Figure 1

Figure 1
<p>Etiology and underlying mechanisms of PCOS.</p>
Full article ">Figure 2
<p>Effects of GI and GL on PCOS. GI: glycemic index; GL: glycemic load; IR: insulin resistance; OS: oxidative stress; QoL: quality of life.</p>
Full article ">
12 pages, 520 KiB  
Article
Changes in Diet Quality over 10 Years and Subsequent Mortality from Cardiovascular Disease in the Multiethnic Cohort Study
by Minji Kang, Carol J. Boushey, Yurii B. Shvetsov, Veronica W. Setiawan, Hee-Young Paik, Lynne R. Wilkens, Loïc Le Marchand and Song-Yi Park
Nutrients 2023, 15(15), 3482; https://doi.org/10.3390/nu15153482 - 7 Aug 2023
Cited by 1 | Viewed by 1686
Abstract
This study investigated how diet quality changes over a ten-year period, assessed using the following four diet quality indexes, the Healthy Eating Index-2015 (HEI-2015), Alternative Healthy Eating Index-2010 (AHEI-2010), alternate Mediterranean Diet (aMED), and Dietary Approaches to Stop Hypertension (DASH), were related to [...] Read more.
This study investigated how diet quality changes over a ten-year period, assessed using the following four diet quality indexes, the Healthy Eating Index-2015 (HEI-2015), Alternative Healthy Eating Index-2010 (AHEI-2010), alternate Mediterranean Diet (aMED), and Dietary Approaches to Stop Hypertension (DASH), were related to mortality from cardiovascular disease (CVD) in the Multiethnic Cohort Study. The analysis included 61,361 participants who completed both the 1993–1996 baseline survey and the 2003–2008 10-year follow-up surveys. Over the mean follow-up period of 13 years after the 10-year survey, 4174 deaths from CVD were identified. Hazard ratios (HRs) and 95% confidence intervals (CIs) were estimated using multivariable Cox models. Increases in diet quality scores were associated with a reduced risk of CVD mortality for all indexes: HRs per one SD increment of 0.94 to 0.99 (HR (95% CI), 0.96 (0.92–1.01) for HEI-2015, 0.96 (0.91–1.01) for AHEI-2010, 0.99 (0.94–1.04) for aMED, and 0.94 (0.89–0.99) for DASH) in men and 0.88 to 0.92 (0.88 (0.84–0.92) for HEI-2015, 0.90 (0.85–0.95) for AHEI-2010, 0.89 (0.84–0.95) for aMED, and 0.92 (0.87–0.96) for DASH) in women. The inverse association generally did not vary by race and ethnicity, age, body mass index, smoking, and hypertension in each sex. Our findings suggest that improving diet quality and maintaining a high-quality diet over time may help reduce the risk of CVD mortality and could also be beneficial for those at higher risk of CVD. Full article
(This article belongs to the Special Issue Eating Habits and Chronic Diseases: Latest Advances and Prospects)
Show Figures

Figure 1

Figure 1
<p>HRs (95% CI) for cardiovascular disease mortality according to change in diet quality over 10 years in the Multiethnic Cohort Study: (<b>a</b>) men; (<b>b</b>) women. AHEI, Alternative Healthy Eating Index; aMED, alternate Mediterranean Diet score; DASH, Dietary Approaches to Stop Hypertension; HEI, Healthy Eating Index. Changes in diet quality were categorized into four groups based on the median scores of each index at baseline as follows: (1) consistently low (participants whose scores remained below the median on both surveys); (2) high to low (participants who experienced a change from having dietary scores above the median in the baseline survey to below the median in the 10-year follow-up); (3) low to high (participants who changed from having dietary scores below the median in the baseline survey to above the median in the 10-year follow-up); (4) consistently high (participants whose dietary scores remained above the median at both surveys). Adjusted for race and ethnicity, age, BMI, history of hypertension, education, marital status, physical activity, menopausal hormone therapy uses for women only, BMI change between two surveys, total energy intake, and smoking model. For HEI-2015 and DASH, the models were further adjusted for alcohol intake. All variables were from the 10-year follow-up survey, except for race and ethnicity and education from the baseline questionnaire.</p>
Full article ">
8 pages, 1274 KiB  
Brief Report
Trabecular Bone Score Preceding and during a 2-Year Follow-Up after Sleeve Gastrectomy: Pitfalls and New Insights
by Joshua Stokar, Tair Ben-Porat, Donia Kaluti, Mahmud Abu-Gazala, Ram Weiss, Yoav Mintz, Ram Elazari and Auryan Szalat
Nutrients 2023, 15(15), 3481; https://doi.org/10.3390/nu15153481 - 7 Aug 2023
Cited by 2 | Viewed by 1466
Abstract
Bariatric surgery (BS) can have negative effects on bone health. Bone microarchitecture quality evaluation using the trabecular bone score (TBS) has not been described in patients after sleeve gastrectomy (SG). To test the hypothesis that the TBS is clinically useful for this population, [...] Read more.
Bariatric surgery (BS) can have negative effects on bone health. Bone microarchitecture quality evaluation using the trabecular bone score (TBS) has not been described in patients after sleeve gastrectomy (SG). To test the hypothesis that the TBS is clinically useful for this population, we evaluated changes in bone mineral density (BMD) and the TBS in a longitudinal cohort study following SG. The measurements before surgery and after 12 and 24 postoperative months were as follows: weight, height, BMI, waist circumference (WC), BMD and TBS. The results at baseline showed the following: a mean BMI of 43 ± 0.56, TBS of 1.25 ± 0.02, lumbar spine BMD T-score of −0.4 ± 0.93, TBS T-score of −2.30 ± 0.21, significantly lower than BMD-T-score, and associated with a BMD-T-TBS-T gap (T-gap) of −2.05 ± 1.26 (−0.24 ± 0.13). One year after surgery, the TBS had significantly improved (+12.12% ± 1.5), leading to a T-gap of −0.296 ± 0.14, which remained stable at 2 years post-surgery. A correlation analysis revealed a significant negative correlation between the T-gap and WC (r = −0.43 p = 0.004). Our interpretation is that abdominal fat may interfere with image acquisition via increased tissue thickness, leading to a false low TBS at baseline. In conclusion, TBS should be interpreted with caution in patients with obesity and elevated WC. Additionally, we show that after SG, the LS microarchitecture measured using the TBS is partially degraded in up to 25% of patients. Further studies are warranted to assess hip bone microarchitecture changes after bariatric surgery. Full article
(This article belongs to the Section Nutrition and Public Health)
Show Figures

Figure 1

Figure 1
<p>Differences between T-scores derived for lumbar spine bone mineral density and the trabecular bone score over time. <span class="html-italic">p</span>-values for mixed-effects analysis with Holm–Šídák’s multiple comparisons. BMD: bone mineral density; ns: non-significant; TBS: trabecular bone score. **** Statistically significant.</p>
Full article ">Figure 2
<p>Pearson’s correlations. Blue dotted line—simple linear regression. BMD: bone mineral density; TBS: trabecular bone score.</p>
Full article ">Figure 3
<p>Pearson’s correlation between waist circumference and BMD–TBS T-score gap at 1 year post-surgery. BMD: bone mineral density; TBS: trabecular bone score.</p>
Full article ">
11 pages, 275 KiB  
Article
Determinants of Stunting among Children under Five in Pakistan
by Sajid Bashir Soofi, Ahmad Khan, Sumra Kureishy, Imtiaz Hussain, Muhammad Atif Habib, Muhammad Umer, Shabina Ariff, Muhammad Sajid, Arjumand Rizvi, Imran Ahmed, Junaid Iqbal, Khawaja Masuood Ahmed, Abdul Baseer Khan Achakzai and Zulfiqar A. Bhutta
Nutrients 2023, 15(15), 3480; https://doi.org/10.3390/nu15153480 - 7 Aug 2023
Cited by 3 | Viewed by 2493
Abstract
Introduction: Child stunting remains a public health concern. It is characterized as poor cognitive and physical development in children due to inadequate nutrition during the first 1000 days of life. Across south Asia, Pakistan has the second-highest prevalence of stunting. This study assessed [...] Read more.
Introduction: Child stunting remains a public health concern. It is characterized as poor cognitive and physical development in children due to inadequate nutrition during the first 1000 days of life. Across south Asia, Pakistan has the second-highest prevalence of stunting. This study assessed the most recent nationally representative data, the National Nutrition Survey (NNS) 2018, to identify the stunting prevalence and determinants among Pakistani children under five. Methods: The NNS 2018, a cross-sectional household-level survey, was used to conduct a secondary analysis. Data on malnutrition, dietary practices, and food insecurity were used to identify the prevalence of stunting among children under five years in terms of demographic, socioeconomic, and geographic characteristics. The prevalence of stunting was calculated using the World Health Organization (WHO) height for age z-score references. Univariate and multivariable logistic regressions were conducted to identify the factors associated with child stunting. Results: The analysis showed that out of 52,602 children under five, 40.0% were found to be stunted. Male children living in rural areas were more susceptible to stunting. Furthermore, stunting was more prevalent among children whose mothers had no education, were between 20 and 34, and were employed. In the multivariable logistic regression, male children (AOR = 1.08, 95% CI [1.04–1.14], p < 0.001) from rural areas (AOR = 1.07, 95% CI [1.01–1.14], p = 0.014), with the presence of diarrhea in the last two weeks (AOR = 1.15, 95% CI [1.06–1.25], p < 0.001) and mothers who had no education (AOR = 1.57, 95% CI [1.42–1.73], p < 0.001) or lower levels of education (primary: AOR = 1.35, 95% CI [1.21–1.51], p < 0.001; middle: AOR = 1.29, 95% CI [1.15–1.45], p < 0.001), had higher odds of stunting. Younger children aged < 6 months (AOR = 0.53, 95% CI [0.48–0.58], p < 0.001) and 6–23 months (AOR = 0.89, 95% CI [0.84–0.94], p < 0.001), with mothers aged 35–49 years (AOR = 0.78, 95% CI [0.66–0.92], p = 0.003), had lower odds of stunting. At the household level, the odds of child stunting were higher in lower-income households (AOR = 1.64, 95% CI [1.46–1.83], p < 0.001) with ≥ 7 members (AOR = 1.09, 95% CI [1.04–1.15], p < 0.001), with no access to improved sanitation facilities (AOR = 1.14, 95% CI [1.06–1.22], p < 0.001) and experiencing severe food insecurity (AOR = 1.07, 95% CI [1.01–1.14], p = 0.02). Conclusion: Child stunting in Pakistan is strongly associated with various factors, including gender, age, diarrhea, residence, maternal age and education, household size, food and wealth status, and access to sanitation. To address this, interventions must be introduced to make locally available food and nutritious supplements more affordable, improve access to safe water and sanitation, and promote female education for long-term reductions in stunting rates. Full article
(This article belongs to the Section Micronutrients and Human Health)
18 pages, 4516 KiB  
Article
Evaluation of Albumin, Transferrin and Transthyretin in Inflammatory Bowel Disease Patients as Disease Activity and Nutritional Status Biomarkers
by Małgorzata Godala, Ewelina Gaszyńska, Konrad Walczak and Ewa Małecka-Wojciesko
Nutrients 2023, 15(15), 3479; https://doi.org/10.3390/nu15153479 - 7 Aug 2023
Cited by 6 | Viewed by 2166
Abstract
Inflammatory bowel disease (IBD), which includes Crohn’s disease (CD) and ulcerative colitis (UC), is often accompanied by malnutrition that manifests itself as nutrient deficiencies and body mass loss or deficit. The purpose of this study is to evaluate the utility of albumin, transferrin [...] Read more.
Inflammatory bowel disease (IBD), which includes Crohn’s disease (CD) and ulcerative colitis (UC), is often accompanied by malnutrition that manifests itself as nutrient deficiencies and body mass loss or deficit. The purpose of this study is to evaluate the utility of albumin, transferrin and transthyretin levels in the assessment of nutritional status and IBD activity. The case–control study included 82 IBD patients. The serum concentrations of albumin, transferrin and transthyretine were determined by a quantitative sandwich enzyme-linked immunosorbent assay (ELISA). Significantly lower median concentrations of albumin were found in the IBD patients vs. controls and in CD patients compared to the UC patients. Significantly higher median transthyretin concentrations were found in the IBD patients compared to the healthy subjects. There were no significant differences in median transferrin concentrations between the IBD patients and the healthy subjects. Significantly higher albumin levels were found in IBD patients in remission compared to patients with moderate and severe exacerbation of IBD symptoms. There were no significant differences in the median transferrin or transthyretin levels in patients with IBD depending on disease activity. No differences were identified in the median transferrin or transthyretin levels in the IBD patients according to nutritional status. The median albumin concentrations in the IBD subjects were significantly higher in patients with normal body fat, normal BMI and normal waist circumferences compared to those with an abnormal nutritional status. The albumin levels reflect both nutritional status and disease activity and therefore cannot be considered a prognostic marker of malnutrition in IBD. As regards the utility of transferrin and transthyretin as markers of activity and nutritional status in IBD patients, further studies are required. Full article
(This article belongs to the Special Issue Anti-inflammatory Diets: What Foods to Eat and Avoid)
Show Figures

Figure 1

Figure 1
<p>Correlation between the albumin and transferrin concentrations in patients with CD.</p>
Full article ">Figure 2
<p>Correlation between the albumin and transthyretin concentrations in patients with CD.</p>
Full article ">Figure 3
<p>Correlation between the albumin and transthyretin concentrations in patients with UC.</p>
Full article ">
18 pages, 2599 KiB  
Article
Cultural and Contextual Drivers of Triple Burden of Malnutrition among Children in India
by Shri Kant Singh, Alka Chauhan, Santosh Kumar Sharma, Parul Puri, Sarang Pedgaonkar, Laxmi Kant Dwivedi and Lindsey Smith Taillie
Nutrients 2023, 15(15), 3478; https://doi.org/10.3390/nu15153478 - 6 Aug 2023
Cited by 4 | Viewed by 2610
Abstract
This study examines malnutrition’s triple burden, including anaemia, overweight, and stunting, among children aged 6–59 months. Using data from the National Family Health Survey-5 (2019–2021), the study identifies risk factors and assesses their contribution at different levels to existing malnutrition burden. A random [...] Read more.
This study examines malnutrition’s triple burden, including anaemia, overweight, and stunting, among children aged 6–59 months. Using data from the National Family Health Survey-5 (2019–2021), the study identifies risk factors and assesses their contribution at different levels to existing malnutrition burden. A random intercept multilevel logistic regression model and spatial analysis are employed to identify child, maternal, and household level risk factors for stunting, overweight, and anaemia. The study finds that 34% of children were stunted, 4% were overweight, and 66% were anaemic. Stunting and anaemia prevalence were higher in central and eastern regions, while overweight was more prevalent in the north-eastern and northern regions. At the macro-level, the coexistence of stunting, overweight, and anaemia circumstantiates the triple burden of childhood malnutrition with substantial spatial variation (Moran’s I: stunting-0.53, overweight-0.41, and anaemia-0.53). Multilevel analysis reveals that child, maternal, and household variables play a substantial role in determining malnutrition burden in India. The nutritional health is significantly influenced by a wide range of determinants, necessitating multilevel treatments targeting households to address this diverse group of coexisting factors. Given the intra-country spatial heterogeneity, the treatment also needs to be tailor-made for various disaggregated levels. Full article
(This article belongs to the Special Issue Advances in Nutrition: Opportunities and Challenges in 2023)
Show Figures

Figure 1

Figure 1
<p>Patterns of stunting, overweight and anaemia among children under 6–59 months across 707 districts in India, National Family Health Survey (NFHS-5), 2019–2021.</p>
Full article ">Figure 2
<p>District distribution of the rates of malnutrition (<b>A</b>) stunting, (<b>B</b>) overweight, and (<b>C</b>) anaemia among children under 6–59 months across 707 districts in India, National Family Health Survey (NFHS-5), 2019–2021.</p>
Full article ">Figure 3
<p>Univariate LISA clustering of (<b>A</b>) stunting, (<b>B</b>) overweight, and (<b>C</b>) anaemia among children aged 6–59 months across 707 districts in India, National Family Health Survey (NFHS-5), 2019–2021.</p>
Full article ">
11 pages, 624 KiB  
Article
25(OH)D Concentration in Neonates, Infants, Toddlers, Older Children and Teenagers from Poland—Evaluation of Trends during Years 2014–2019
by Marek Wójcik, Maciej Jaworski and Paweł Płudowski
Nutrients 2023, 15(15), 3477; https://doi.org/10.3390/nu15153477 - 6 Aug 2023
Cited by 3 | Viewed by 1321
Abstract
Introduction: Local and international guidelines have provided schedules for the vitamin D supplementation of general populations of different ages, including children. Our study aimed to assess 25(OH)D concentration and its potential change during a growth and maturation period, adding parameters that reflect the [...] Read more.
Introduction: Local and international guidelines have provided schedules for the vitamin D supplementation of general populations of different ages, including children. Our study aimed to assess 25(OH)D concentration and its potential change during a growth and maturation period, adding parameters that reflect the risk of hypercalcemia. Materials and methods: The available 25(OH)D concentration values (n = 17,636; 7.8 ± 6.0 years), calcium (n = 2673; 16.3 ± 6.1 years) and phosphate (n = 2830; 3.8 ± 5.2 years) metabolism markers were analyzed in a studied group of patients (0–18 years). Results: In the studied group the mean 25(OH)D concentration was 29.4 ± 11.7 ng/mL. Concentrations of 25(OH)D < 10 ng/mL were observed in 1.7% of patients (n = 292), 10–20 ng/mL in 17.2% (n = 3039), 20–30 ng/mL in 39.5% (n = 6960) and 30–50 ng/mL in 37.2% (n = 6567). In patients with a 25(OH)D concentration <10 ng/mL, normal calcemia (2.25–2.65 mmol/L) was observed in 29.5% of cases (n = 86). Three patients had 25(OH)D concentrations above 100 ng/mL with co-existing hypercalcemia; the mean was Ca = 3.40 mmol/L. Hypocalcemia (Ca < 2.25 mmol/L) was observed in 10,4% of patients (n = 2797). Furthermore, 5.0% of patients showed an increased calcium concentration >2.65 mmol/L (n = 1327). The highest mean 25(OH)D concentration of 32.1 ng/mL ± 12.9 was noted in the years 2018–2019 (n = 3931) and the lowest in the year 2015 (27.2 ng/mL ± 11.0; n = 2822). Conclusions: Vitamin D deficiency (<20 ng/mL) was noted in 18,9% of subjects in the years 2014–2019. An effective prevention of vitamin D deficiency was observed in children aged 3 years and younger. A relationship between the concentrations of calcium and 25(OH)D was not observed. Full article
Show Figures

Figure 1

Figure 1
<p>Correlation between 25(OH)D concentrations (ng/mL) and age (years).</p>
Full article ">
18 pages, 1113 KiB  
Review
Identification of the Most Suitable Mobile Apps to Support Dietary Approaches to Stop Hypertension (DASH) Diet Self-Management: Systematic Search of App Stores and Content Analysis
by Ghadah Alnooh, Tourkiah Alessa, Essra Noorwali, Salwa Albar, Elizabeth Williams, Luc P. de Witte and Mark S. Hawley
Nutrients 2023, 15(15), 3476; https://doi.org/10.3390/nu15153476 - 6 Aug 2023
Cited by 4 | Viewed by 3250
Abstract
Smartphone apps might provide an opportunity to support the Dietary Approaches to Stop Hypertension (DASH) diet, a healthy diet designed to help lower blood pressure. This study evaluated DASH diet self-management apps based on their quality, likely effectiveness, and data privacy/security to identify [...] Read more.
Smartphone apps might provide an opportunity to support the Dietary Approaches to Stop Hypertension (DASH) diet, a healthy diet designed to help lower blood pressure. This study evaluated DASH diet self-management apps based on their quality, likely effectiveness, and data privacy/security to identify the most suitable app(s). A systematic search and content analysis were conducted of all DASH diet apps available in Google Play and the Apple App Store in the UK in November 2022. Apps were included if they provided DASH diet tracking. A previous systematic literature review found some commercial apps not found in the app store search, and these were also included in this review. Three reviewers used the App Quality Evaluation Tool (AQEL) to assess each app’s quality across seven domains: knowledge acquisition, skill development, behaviour change, purpose, functionality, and appropriateness for adults with hypertension. Domains with a score of 8 or higher were considered high-quality. Two reviewers assessed the apps’ data privacy and security and then coded Behaviour change techniques (BCTs) linked to the Theoretical Domain Framework (TDF) underpinning the likely effectiveness of the apps. Seven DASH diet apps were assessed, showing the limited availability of apps supporting DASH diet self-management. The AQEL assessment showed that three apps scored higher than eight in most of the AQEL domains. Nineteen BCTs were used across the apps, linked to nine TDF action mechanisms that may support DASH diet self-management behaviours. Four apps met standards for privacy and security. All seven apps with self-monitoring functionality had sufficient theoretical basis to demonstrate likely effectiveness. However, most had significant quality and data security shortcomings. Only two apps, NOOM and DASH To TEN, were found to have both adequate quality and security and were thus deemed suitable to support DASH diet self-management. Full article
(This article belongs to the Section Nutrition and Public Health)
Show Figures

Figure 1

Figure 1
<p>Flow diagram of app search and selection.</p>
Full article ">Figure 2
<p>The food tracker Methods; * the food tracker methods; ** the app’s name.</p>
Full article ">
19 pages, 352 KiB  
Article
Effect of Special Low-Protein Foods Consumption in the Dietary Pattern and Biochemical Profile of Patients with Inborn Errors of Protein Metabolism: Application of a Database of Special Low-Protein Foods
by Dolores Garcia-Arenas, Blanca Barrau-Martinez, Arnau Gonzalez-Rodriguez, Rafael Llorach, Jaume Campistol-Plana, Angeles García-Cazorla, Aida Ormazabal and Mireia Urpi-Sarda
Nutrients 2023, 15(15), 3475; https://doi.org/10.3390/nu15153475 - 6 Aug 2023
Cited by 1 | Viewed by 1765
Abstract
In inborn errors of intermediate protein metabolism (IEM), the effect of special low-protein foods (SLPFs) on dietary intake has been scarcely studied. The aim of this study was to compare the nutritional profile of SLPFs with usual foods and to assess whether their [...] Read more.
In inborn errors of intermediate protein metabolism (IEM), the effect of special low-protein foods (SLPFs) on dietary intake has been scarcely studied. The aim of this study was to compare the nutritional profile of SLPFs with usual foods and to assess whether their intake determines the dietary pattern and affects the plasma biochemical profile in children with IEMs with different protein restrictions. A database with the nutritional composition of 250 SLPFs was created. A total of 59 children with IEMs were included in this cross-sectional observational study. The greatest significant differences in macronutrient composition were observed between dairy, meat, fish, and egg SLPFs and regular foods. After stratifying subjects by SLPFs, the participants with the highest intake (>32%) had a higher total energy intake and lower intake of natural protein than those in the lowest tertile (<24%) (p < 0.05). However, when stratifying subjects by dairy SLPF intake, children in the highest tertile (>5%) showed a higher intake of sugars, total and saturated fats, and higher plasma levels of total and low-density lipoprotein cholesterol than those in the first tertile (<1%) (p < 0.05). The variability in the nutritional composition of SLPFs highlights the need for up-to-date databases which would greatly assist in optimizing individualized recommendations for children with IEMs and protein restrictions. Full article
(This article belongs to the Special Issue Databases, Nutrition and Human Health)
12 pages, 694 KiB  
Article
Associations of Food Addiction Symptomatology and Disordered Eating Behaviors in a Pre-Surgical Bariatric Population
by Melissa Butt, Paddy Ssentongo, Ann M. Rogers and Andrea Rigby
Nutrients 2023, 15(15), 3474; https://doi.org/10.3390/nu15153474 - 6 Aug 2023
Viewed by 1502
Abstract
The construct of food addiction (FA) has been highly debated in recent years particularly in the fields of disordered eating, medical weight management, and bariatric surgery. Some researchers have argued that FA symptoms are distinct, highly prevalent, and present a barrier for patients [...] Read more.
The construct of food addiction (FA) has been highly debated in recent years particularly in the fields of disordered eating, medical weight management, and bariatric surgery. Some researchers have argued that FA symptoms are distinct, highly prevalent, and present a barrier for patients seeking medical treatment for obesity. The purpose of this study is to evaluate the cross-sectional associations between FA symptomatology, binge eating disorder (BED) and other appetitive traits, as well as dietary quality in a sample of adults with obesity seeking bariatric surgery. This post hoc analysis was conducted on a prospectively collected dataset from August 2020 to August 2022 at a single academic medical center. Descriptive statistics were used to characterize the sample. Additional analyses included: correlation coefficients, multivariable linear regression, and analysis of variance. A total of 587 patients were included in this analysis with low average scores for FA symptoms (mean: 1.48; standard deviation (SD): 2.15). Those with no BED symptoms had the lowest average FA symptoms scores (mean: 0.87; SD: 1.52) and those with both bingeing and LOCE had the highest average scores (mean: 3.35; SD: 2.81). This finding supports the hypothesis that, while related, FA and BED may represent different cognitions and behaviors. Full article
(This article belongs to the Special Issue Nutrition, Taste, Reward and Bariatric Surgery)
Show Figures

Figure 1

Figure 1
<p>Associations of food addiction scores and binge eating criteria—known groups validity. *ANOVA: Pairwise comparisons included Tukey adjustment for multiple comparisons; **ANCOVA: controlling for socially desirable responding; ^^Unadjusted and adjusted comparisons significant.</p>
Full article ">
15 pages, 627 KiB  
Systematic Review
Unraveling Barriers to a Healthy Lifestyle: Understanding Barriers to Diet and Physical Activity in Patients with Chronic Non-Communicable Diseases
by Massimiliano Cavallo, Giovanni Morgana, Ivan Dozzani, Alessandro Gatti, Matteo Vandoni, Roberto Pippi, Giacomo Pucci, Gaetano Vaudo and Carmine Giuseppe Fanelli
Nutrients 2023, 15(15), 3473; https://doi.org/10.3390/nu15153473 - 5 Aug 2023
Cited by 4 | Viewed by 3432
Abstract
Although the important contribution of nutrition and physical activity to people’s health is known, it is equally well known that there are many barriers to adherence to healthy habits (i.e., of an organizational, economic, and/or psychological nature) experienced by the general population, as [...] Read more.
Although the important contribution of nutrition and physical activity to people’s health is known, it is equally well known that there are many barriers to adherence to healthy habits (i.e., of an organizational, economic, and/or psychological nature) experienced by the general population, as well as by people with non-communicable diseases. Knowledge of these barriers seems essential to the implementation of the activities and strategies needed to overcome them. Here, we aim to highlight the most frequent barriers to nutrition and exercise improvement that patients with chronic-degenerative diseases experience. Drawing from the Pubmed database, our analysis includes quantitative or mixed descriptive studies published within the last 10 years, involving adult participants with non-communicable diseases. Barriers of an organizational nature, as well as those of an environmental, economic, or psychological nature, are reported. The study of patients’ barriers enables healthcare and non-health professionals, stakeholders, and policymakers to propose truly effective solutions that can help both the general population and those with chronic pathologies to adhere to a healthy lifestyle. Full article
Show Figures

Figure 1

Figure 1
<p>PRISMA [<a href="#B29-nutrients-15-03473" class="html-bibr">29</a>] 2020 flow diagram for new systematic reviews.</p>
Full article ">
14 pages, 2974 KiB  
Systematic Review
Effect of Malaria on Blood Levels of Vitamin E: A Systematic Review and Meta-Analysis
by Manas Kotepui, Frederick Ramirez Masangkay, Aongart Mahittikorn and Kwuntida Uthaisar Kotepui
Nutrients 2023, 15(15), 3472; https://doi.org/10.3390/nu15153472 - 5 Aug 2023
Cited by 2 | Viewed by 1512
Abstract
Vitamin E has an antioxidant property and is associated with protection against malaria. The current study used systematic review and meta-analysis approaches examining the variance in blood levels of vitamin E in malaria patients as compared with uninfected individuals. The protocol for the [...] Read more.
Vitamin E has an antioxidant property and is associated with protection against malaria. The current study used systematic review and meta-analysis approaches examining the variance in blood levels of vitamin E in malaria patients as compared with uninfected individuals. The protocol for the systematic review was registered with PROSPERO (CRD4202341481). Searches for pertinent studies were carried out on Embase, MEDLINE, Ovid, PubMed, Scopus, ProQuest, and Google Scholar. The combined effect estimate (Cohen’s d) of the difference in vitamin E levels in malaria patients as compared with uninfected individuals was estimated using the random effects model. The searches yielded 2009 records, and 23 studies were included in the systematic review. The majority of the studies (80%) found that vitamin E levels were significantly lower in malaria patients than those who were not infected. Overall, the results revealed a significant reduction in blood levels of vitamin E in malaria patients when compared with uninfected individuals (p < 0.01, Cohen’s d: −2.74, 95% CI: −3.72–(−1.76), I2: 98.69%, 21 studies). There was a significant reduction in blood levels of vitamin E in patients suffering from severe malaria, in comparison with those experiencing less severe forms of the disease (p < 0.01, Cohen’s d: −0.56, 95% CI: −0.85–(−0.26), I2: 0%, 2 studies), but no variation in blood levels of vitamin E among patients suffering from either P. falciparum or P. vivax malaria (p = 0.13, Cohen’s d: −1.15, 95% CI: −2.62–0.33, I2: 93.22%, 3 studies). In summary, the present study strongly suggests that vitamin E levels are significantly reduced in malaria patients, with a more pronounced decrease observed in cases of severe malaria. However, the type of malaria parasite, specifically P. falciparum or P. vivax, did not appear to influence the levels of vitamin E. This study highlights the potential role of vitamin E in the pathogenesis of malaria and suggests that improved vitamin E status might be beneficial for improving disease outcomes. Full article
Show Figures

Figure 1

Figure 1
<p>Study flow diagram.</p>
Full article ">Figure 2
<p>The forest plot illustrates the variation in blood vitamin E levels between malaria patients and uninfected controls. Explanations for symbols: blue square, Cohen’s d for each study; green diamond, pooled Cohen’s d. Abbreviations: CI stands for confidence interval; N represents the number of populations enrolled; SD represents the standard deviation. References: [<a href="#B26-nutrients-15-03472" class="html-bibr">26</a>,<a href="#B27-nutrients-15-03472" class="html-bibr">27</a>,<a href="#B28-nutrients-15-03472" class="html-bibr">28</a>,<a href="#B29-nutrients-15-03472" class="html-bibr">29</a>,<a href="#B30-nutrients-15-03472" class="html-bibr">30</a>,<a href="#B31-nutrients-15-03472" class="html-bibr">31</a>,<a href="#B32-nutrients-15-03472" class="html-bibr">32</a>,<a href="#B33-nutrients-15-03472" class="html-bibr">33</a>,<a href="#B35-nutrients-15-03472" class="html-bibr">35</a>,<a href="#B36-nutrients-15-03472" class="html-bibr">36</a>,<a href="#B37-nutrients-15-03472" class="html-bibr">37</a>,<a href="#B38-nutrients-15-03472" class="html-bibr">38</a>,<a href="#B39-nutrients-15-03472" class="html-bibr">39</a>,<a href="#B40-nutrients-15-03472" class="html-bibr">40</a>,<a href="#B41-nutrients-15-03472" class="html-bibr">41</a>,<a href="#B42-nutrients-15-03472" class="html-bibr">42</a>,<a href="#B43-nutrients-15-03472" class="html-bibr">43</a>,<a href="#B44-nutrients-15-03472" class="html-bibr">44</a>,<a href="#B45-nutrients-15-03472" class="html-bibr">45</a>,<a href="#B47-nutrients-15-03472" class="html-bibr">47</a>,<a href="#B48-nutrients-15-03472" class="html-bibr">48</a>].</p>
Full article ">Figure 3
<p>The variation in blood vitamin E levels between patients with severe malaria and those experiencing less severe forms of the disease is illustrated by the forest plot. Explanations for symbols: blue square, Cohen’s d for each study; green diamond, pooled Cohen’s d. Abbreviations: CI stands for confidence interval; N represents the number of patients enrolled; SD represents the standard deviation. References: [<a href="#B32-nutrients-15-03472" class="html-bibr">32</a>,<a href="#B44-nutrients-15-03472" class="html-bibr">44</a>].</p>
Full article ">Figure 4
<p>The fluctuation in blood vitamin E levels among patients infected with either <span class="html-italic">P. falciparum</span> or <span class="html-italic">P. vivax</span> malaria is illustrated by the forest plot. Explanations for symbols: blue square, Cohen’s d for each study; green diamond, pooled Cohen’s d. Abbreviations: CI represents confidence interval; N represents the number of patients enrolled; SD represents the standard deviation. References: [<a href="#B37-nutrients-15-03472" class="html-bibr">37</a>,<a href="#B41-nutrients-15-03472" class="html-bibr">41</a>,<a href="#B43-nutrients-15-03472" class="html-bibr">43</a>].</p>
Full article ">Figure 5
<p>The leave-one-out meta-analysis showing a significant reduction in vitamin E levels in patients with malaria as compared with uninfected controls in each rerun analysis (<span class="html-italic">p</span> &lt; 0.05). Explanations for symbols: green circle, pooled Cohen’s d for each re-run analysis; red vertical line, overall Cohen’s d estimated from all re-run analyses. Abbreviation: CI stands for confidence interval. References: [<a href="#B26-nutrients-15-03472" class="html-bibr">26</a>,<a href="#B27-nutrients-15-03472" class="html-bibr">27</a>,<a href="#B28-nutrients-15-03472" class="html-bibr">28</a>,<a href="#B29-nutrients-15-03472" class="html-bibr">29</a>,<a href="#B30-nutrients-15-03472" class="html-bibr">30</a>,<a href="#B31-nutrients-15-03472" class="html-bibr">31</a>,<a href="#B32-nutrients-15-03472" class="html-bibr">32</a>,<a href="#B33-nutrients-15-03472" class="html-bibr">33</a>,<a href="#B35-nutrients-15-03472" class="html-bibr">35</a>,<a href="#B36-nutrients-15-03472" class="html-bibr">36</a>,<a href="#B37-nutrients-15-03472" class="html-bibr">37</a>,<a href="#B38-nutrients-15-03472" class="html-bibr">38</a>,<a href="#B39-nutrients-15-03472" class="html-bibr">39</a>,<a href="#B40-nutrients-15-03472" class="html-bibr">40</a>,<a href="#B41-nutrients-15-03472" class="html-bibr">41</a>,<a href="#B42-nutrients-15-03472" class="html-bibr">42</a>,<a href="#B43-nutrients-15-03472" class="html-bibr">43</a>,<a href="#B44-nutrients-15-03472" class="html-bibr">44</a>,<a href="#B45-nutrients-15-03472" class="html-bibr">45</a>,<a href="#B47-nutrients-15-03472" class="html-bibr">47</a>,<a href="#B48-nutrients-15-03472" class="html-bibr">48</a>].</p>
Full article ">Figure 6
<p>An asymmetrical spread of the effect estimate (SMD) from the middle line (red). The funnel plot was generated using the meta-analysis data from blood vitamin E levels between malaria patients and uninfected individuals. Abbreviation: CI, confidence interval.</p>
Full article ">
14 pages, 2246 KiB  
Review
Unlocking the Power of Late-Evening Snacks: Practical Ready-to-Prescribe Chart Menu for Patients with Cirrhosis
by Laura Leoni, Filippo Valoriani, Riccardo Barbieri, Martina Pambianco, Martina Vinciguerra, Chiara Sicuro, Antonio Colecchia, Renata Menozzi and Federico Ravaioli
Nutrients 2023, 15(15), 3471; https://doi.org/10.3390/nu15153471 - 5 Aug 2023
Cited by 4 | Viewed by 3947
Abstract
The efficacy of the late-evening snack (LES) has been extensively studied due to the impact of the longest intermeal duration occurring at night in patients with cirrhosis. While actual clinical guidelines on nutrition in chronic liver disease recommend an LES, no specific nutritional [...] Read more.
The efficacy of the late-evening snack (LES) has been extensively studied due to the impact of the longest intermeal duration occurring at night in patients with cirrhosis. While actual clinical guidelines on nutrition in chronic liver disease recommend an LES, no specific nutritional compositions have been reported by the European Association for the Study of the Liver (EASL) and the European Society for Clinical Nutrition and Metabolism (ESPEN). Late-evening snacks vary greatly among studies, including natural foods and/or nutritional supplements, yet oral supplements still need to fully meet the LES’s nutritional composition. In addition, many hepatologists need to gain experience in nutritional approaches and have access to registered dieticians who can help them manage patients with liver disease. Therefore, this review study aims to summarise evidence regarding using LESs and the mechanisms behind long starvation in patients with cirrhosis. It also provides a practical nutritional guide with several LES options based on common natural foods tailored to special patients’ nutritional requirements and geographical backgrounds. In preventing accelerated starvation and related protein malnutrition and sarcopenia in patients with cirrhosis, the nutritional composition of LESs is essential. The proper and straightforward application of the LES’s rational nutrition is an advantage to cirrhotic patients and should be carried out by healthcare professionals to enhance the overall liver function and nutritional status of patients with cirrhosis. Full article
(This article belongs to the Section Clinical Nutrition)
Show Figures

Figure 1

Figure 1
<p>Impact of an LES on the pathophysiology of sarcopenia in cirrhosis.</p>
Full article ">Figure 2
<p>Proposal for late-evening snacks. For bromatologic compositions, see <a href="#app1-nutrients-15-03471" class="html-app">Supplementary File</a>.</p>
Full article ">Figure 3
<p>Weekly meal plans for LESs based on different geographic cultures.</p>
Full article ">
13 pages, 1527 KiB  
Review
The Effect of Vitamin D Supplementation on the Length of Hospitalisation, Intensive Care Unit Admission, and Mortality in COVID-19—A Systematic Review and Meta-Analysis
by Alexandru Constantin Sîrbu, Octavia Sabin, Ioana Corina Bocșan, Ștefan Cristian Vesa and Anca Dana Buzoianu
Nutrients 2023, 15(15), 3470; https://doi.org/10.3390/nu15153470 - 5 Aug 2023
Cited by 5 | Viewed by 2044
Abstract
The coronavirus disease 2019 (COVID-19) pandemic caused by the Severe Acute Respiratory Syndrome Coronavirus-2 (SARS-CoV-2) has become a global health crisis and pushed researchers and physicians to discover possible treatments to improve the outcome of their patients. Vitamin D, known for its role [...] Read more.
The coronavirus disease 2019 (COVID-19) pandemic caused by the Severe Acute Respiratory Syndrome Coronavirus-2 (SARS-CoV-2) has become a global health crisis and pushed researchers and physicians to discover possible treatments to improve the outcome of their patients. Vitamin D, known for its role in immune system function, has been hypothesized to play a role in COVID-19 treatment. A systematic review and meta-analysis were conducted to evaluate the efficacy of vitamin D supplementation in COVID-19, focusing on length of hospital stay (LOS), admission to the intensive care unit (ICU), and mortality. Thirteen randomized controlled trials (RCTs) were included, and the meta-analysis revealed that high-dose vitamin D supplementation showed potential benefits in reducing the length of hospital stay and ICU admission rates for patients with COVID-19. However, the overall effect on mortality did not reach statistical significance. While this systematic review suggests the potential benefits of high-dose vitamin D supplementation in reducing hospital stays and ICU admission in COVID-19 patients, caution is warranted due to the high heterogeneity and limitations of the included studies. Further large-scale randomized controlled trials with consistent study characteristics are needed to provide more robust evidence regarding the therapeutic benefits of vitamin D supplementation in COVID-19 outcomes. Full article
(This article belongs to the Special Issue Vitamin D and COVID-19: New Mechanistic and Therapeutic Insights)
Show Figures

Figure 1

Figure 1
<p>PRISMA flow diagram on study screening and selection.</p>
Full article ">Figure 2
<p>Forest plot of the length of hospital stay for the studies evaluated [<a href="#B16-nutrients-15-03470" class="html-bibr">16</a>,<a href="#B17-nutrients-15-03470" class="html-bibr">17</a>,<a href="#B18-nutrients-15-03470" class="html-bibr">18</a>,<a href="#B19-nutrients-15-03470" class="html-bibr">19</a>,<a href="#B20-nutrients-15-03470" class="html-bibr">20</a>,<a href="#B21-nutrients-15-03470" class="html-bibr">21</a>,<a href="#B22-nutrients-15-03470" class="html-bibr">22</a>,<a href="#B23-nutrients-15-03470" class="html-bibr">23</a>,<a href="#B24-nutrients-15-03470" class="html-bibr">24</a>]. Mean hospitalization days and the difference are presented in the forest plot. Note that some mean values were estimated from medians. The first subgroup is for patients admitted to hospital wards, and the second subgroup with patients admitted exclusively to the ICU. ICU, intensive care unit; SD, standard deviation; IV, inverse variance.</p>
Full article ">Figure 3
<p>Forest plot of the intensive care unit admissions for the studies evaluated [<a href="#B16-nutrients-15-03470" class="html-bibr">16</a>,<a href="#B17-nutrients-15-03470" class="html-bibr">17</a>,<a href="#B18-nutrients-15-03470" class="html-bibr">18</a>,<a href="#B19-nutrients-15-03470" class="html-bibr">19</a>,<a href="#B20-nutrients-15-03470" class="html-bibr">20</a>,<a href="#B21-nutrients-15-03470" class="html-bibr">21</a>,<a href="#B22-nutrients-15-03470" class="html-bibr">22</a>,<a href="#B23-nutrients-15-03470" class="html-bibr">23</a>,<a href="#B24-nutrients-15-03470" class="html-bibr">24</a>]. Number of patients admitted and the risk ratio are presented in the forest plot. Note that some numbers were extrapolated from percentages. IV, inverse variance.</p>
Full article ">Figure 4
<p>Forest plot of mortality for the studies evaluated [<a href="#B16-nutrients-15-03470" class="html-bibr">16</a>,<a href="#B17-nutrients-15-03470" class="html-bibr">17</a>,<a href="#B18-nutrients-15-03470" class="html-bibr">18</a>,<a href="#B19-nutrients-15-03470" class="html-bibr">19</a>,<a href="#B20-nutrients-15-03470" class="html-bibr">20</a>,<a href="#B22-nutrients-15-03470" class="html-bibr">22</a>,<a href="#B23-nutrients-15-03470" class="html-bibr">23</a>,<a href="#B24-nutrients-15-03470" class="html-bibr">24</a>]. The number of patients deceased and the risk ratio are presented in the forest plot. Note that some numbers were extrapolated from percentages. IV, inverse variance.</p>
Full article ">Figure 5
<p>Risk of bias assessment for the studies open-label or placebo-controlled [<a href="#B16-nutrients-15-03470" class="html-bibr">16</a>,<a href="#B17-nutrients-15-03470" class="html-bibr">17</a>,<a href="#B18-nutrients-15-03470" class="html-bibr">18</a>,<a href="#B19-nutrients-15-03470" class="html-bibr">19</a>,<a href="#B20-nutrients-15-03470" class="html-bibr">20</a>,<a href="#B21-nutrients-15-03470" class="html-bibr">21</a>,<a href="#B22-nutrients-15-03470" class="html-bibr">22</a>,<a href="#B23-nutrients-15-03470" class="html-bibr">23</a>,<a href="#B24-nutrients-15-03470" class="html-bibr">24</a>,<a href="#B25-nutrients-15-03470" class="html-bibr">25</a>,<a href="#B26-nutrients-15-03470" class="html-bibr">26</a>,<a href="#B27-nutrients-15-03470" class="html-bibr">27</a>,<a href="#B28-nutrients-15-03470" class="html-bibr">28</a>] that evaluated the length of stay in hospital (LOH), intensive care unit (ICU admission), and mortality for vitamin D supplementation (D1, randomization process; D2, deviations from the intended interventions; D3, missing outcome data; D4, measurement of the outcome; D5, selection of the reported result).</p>
Full article ">
15 pages, 1868 KiB  
Article
Benefits of the Light Consumption of Red Wine in Pain, Tender Points, and Anxiety in Women with Fibromyalgia: A Pilot Study
by María Victoria González-López-Arza, José Vicente Triviño-Palomo, Jesús Montanero-Fernández, Elisa María Garrido-Ardila, Blanca González-Sánchez, María Jiménez-Palomares and Juan Rodríguez-Mansilla
Nutrients 2023, 15(15), 3469; https://doi.org/10.3390/nu15153469 - 5 Aug 2023
Cited by 3 | Viewed by 1718
Abstract
Background: Fibromyalgia (FM) is characterized by chronic widespread pain, as well as anxiety, sadness, and depression. These symptoms are present in most patients and have a negative impact on their daily, family, and social life. The role of neurotransmitters in the pathophysiology of [...] Read more.
Background: Fibromyalgia (FM) is characterized by chronic widespread pain, as well as anxiety, sadness, and depression. These symptoms are present in most patients and have a negative impact on their daily, family, and social life. The role of neurotransmitters in the pathophysiology of FM has been extensively discussed. The scientific evidence shows that levels of serotonin are decreased in patients with FM. Numerous studies support the beneficial effects that moderate wine consumption has on the body, with cardiovascular, endocrine, bone, and muscle improvements. Objective: The objective of this pilot study was to assess whether light consumption of red wine improves the main symptoms of FM. Methods: The study consisted of an experimental study with a control group with a total of 60 women diagnosed with FM following the American College of Rheumatology’s criteria. The experimental group ingested 15 g of alcohol per day, in the form of red wine, over a period of four weeks. The outcome measures were: the level of pain in tender points, sadness, anxiety, depression, and quality of life. The assessments tools were: tender point graphics, the visual analogue scale (for the assessment of pain and sadness), the Hamilton Anxiety Scale, the Hamilton Depression Rating Scale, and the Fibromyalgia Impact Questionnaire. The measurements were completed before and after the consumption of red wine. In addition, the differences between groups were evaluated in terms of drug consumption in the pre-intervention and follow-up phases. Results: Statistically significant improvements were obtained in the wine ingestion group for the variables of pain (p = 0.038), tender points (p < 0.001), and anxiety (p = 0.028). An improvement in the mean values was observed in favor of the experimental group for the variables of sadness, depression, and quality of life. The differences observed in the changes seen in the groups that were in favor of the wine ingestion group should not be attributed to the consumption of drugs but to the fact that the experimental group had a light intake of red wine. Conclusions: The results of this pilot study suggest a potential relationship between alcohol intake through the light consumption of red wine as part of the patients’ diet and the improvement of the main symptoms of fibromyalgia. Future studies are necessary to confirm these preliminary data; a bigger sample and a controlled diet should be considered, and the mechanisms through which improvements are achieved should be analyzed. Full article
Show Figures

Figure 1

Figure 1
<p>CONSORT flow chart.</p>
Full article ">Figure 2
<p>Comparative analysis of pain when controlling the intake of analgesic medication.</p>
Full article ">Figure 3
<p>Comparative analysis of tender/sensitive points when controlling the drug intake.</p>
Full article ">Figure 4
<p>Comparative analysis of sadness when controlling the SSRI intake.</p>
Full article ">Figure 5
<p>Comparative analysis of anxiety levels.</p>
Full article ">
10 pages, 641 KiB  
Article
Clinical Approach in the Management of Paediatric Patients with Familial Hypercholesterolemia: A National Survey Conducted by the LIPIGEN Paediatric Group
by Cristina Pederiva, Marta Gazzotti, Marcello Arca, Maurizio Averna, Giuseppe Banderali, Giacomo Biasucci, Marta Brambilla, Paola Sabrina Buonuomo, Paolo Calabrò, Francesco Cipollone, Nadia Citroni, Sergio D’Addato, Maria Del Ben, Simonetta Genovesi, Ornella Guardamagna, Gabriella Iannuzzo, Lorenzo Iughetti, Giuseppe Mandraffino, Lorenzo Maroni, Giuliana Mombelli, Sandro Muntoni, Fabio Nascimbeni, Angelina Passaro, Fabio Pellegatta, Matteo Pirro, Livia Pisciotta, Roberta Pujia, Riccardo Sarzani, Roberto Scicali, Patrizia Suppressa, Sabina Zambon, Maria Grazia Zenti, Sebastiano Calandra, Alberico Luigi Catapano, Patrizia Tarugi, Federica Galimberti, Manuela Casula and Maria Elena Capraadd Show full author list remove Hide full author list
Nutrients 2023, 15(15), 3468; https://doi.org/10.3390/nu15153468 - 5 Aug 2023
Cited by 1 | Viewed by 1868
Abstract
Detection and treatment of patients with familial hypercholesterolemia (FH) starting from childhood is fundamental to reduce morbidity and mortality. The activity of National realities such as the LIPIGEN (LIpid transPort disorders Italian GEnetic Network) Paediatric Group, founded in 2018, is a milestone in [...] Read more.
Detection and treatment of patients with familial hypercholesterolemia (FH) starting from childhood is fundamental to reduce morbidity and mortality. The activity of National realities such as the LIPIGEN (LIpid transPort disorders Italian GEnetic Network) Paediatric Group, founded in 2018, is a milestone in this context. The aim of this exploratory survey, conducted in October 2021 among Italian lipid clinics included in the LIPIGEN Paediatric Group, was to investigate the current clinical approach in the management and treatment of paediatric patients with suspected FH. A digital questionnaire composed of 20 questions investigating nutritional treatment and nutraceutical and pharmacological therapy for children and adolescents with FH was proposed to the principal investigators of 30 LIPIGEN centres. Twenty-four centres responded to the section referring to children aged < 10 years and 30 to that referring to adolescents. Overall, 66.7% of children and 73.3% of adolescents were given lipid-lowering nutritional treatment as the first intervention level for at least 3–4 months (29.2% and 23.3%) or 6–12 months (58.3% and 53.3%). Nutraceuticals were considered in 41.7% (regarding children) and 50.0% (regarding adolescents) of the centres as a supplementary approach to diet. Lipid-lowering drug therapy initiation was mainly recommended (91.7% and 80.0%). In 83.3% of children and 96.7% of adolescents, statins were the most frequently prescribed drug. We highlighted several differences in the treatment of paediatric patients with suspected FH among Italian centres; however, the overall approach is in line with the European Atherosclerosis Society (EAS) recommendations for FH children and adolescents. We consider this survey as a starting point to reinforce collaboration between LIPIGEN centres and to elaborate in the near future a consensus document on the management of paediatric patients with suspected FH so as to improve and uniform detection, management, and treatment of these patients in our country. Full article
(This article belongs to the Section Pediatric Nutrition)
Show Figures

Figure 1

Figure 1
<p>Recommendations for the use of nutraceuticals/food supplements in children (&lt;10 years) and adolescents (≥10 years).</p>
Full article ">Figure 2
<p>Evaluation of the usefulness of dietary–nutritional approach (diet), lifestyle modification (lifestyle), and nutraceutical intervention (nutraceuticals) in children (&lt;10 years) (<b>A</b>) and in adolescents (≥10 years) (<b>B</b>) by Italian lipid clinics.</p>
Full article ">
15 pages, 2771 KiB  
Article
Preparation of Corn Peptides with Anti-Adhesive Activity and Its Functionality to Alleviate Gastric Injury Induced by Helicobacter pylori Infection In Vivo
by Guanlong Li, Xiaolan Liu, Zhengfei Miao, Nan Hu and Xiqun Zheng
Nutrients 2023, 15(15), 3467; https://doi.org/10.3390/nu15153467 - 5 Aug 2023
Cited by 6 | Viewed by 1567
Abstract
More than 50% of the world population is infected with Helicobacter pylori (H. pylori), which is classified as group I carcinogen by the WHO. H. pylori surface adhesins specifically recognize gastric mucosal epithelial cells’ (GES-1 cells) receptor to complete the adhesion. [...] Read more.
More than 50% of the world population is infected with Helicobacter pylori (H. pylori), which is classified as group I carcinogen by the WHO. H. pylori surface adhesins specifically recognize gastric mucosal epithelial cells’ (GES-1 cells) receptor to complete the adhesion. Blocking the adhesion with an anti-adhesion compound is an effective way to prevent H. pylori infection. The present study found that corn protein hydrolysate, hydrolyzed by Neutral, effectively alleviated gastric injury induced by H. pylori infection through anti-adhesive and anti-inflammatory effects in vitro and in vivo. The hydrolysate inhibited H. pylori adhesion to GES-1 cells significantly, and its anti-adhesive activity was 50.44 ± 0.27% at 4 mg/mL, which indicated that the hydrolysate possessed a similar structure to the GES-1 cells’ receptor, and exhibited anti-adhesive activity in binding to H. pylori. In vivo, compared with the H. pylori infection model group, the medium and high dose of the hydrolysate (400–600 mg/kg·bw) significantly decreased (p < 0.05) the amount of H. pylori colonization, pro-inflammatory cytokines (IL-6, IL-1β, TNF-α and MPO), chemokines (KC and MCP-1) as well as key metabolites of NF-κB signaling pathway levels (TLR4, MyD88 and NF-κB), and it increased antioxidant enzyme contents (SOD and GSH-Px) and the mitigation of H. pylori-induced pathological changes in the gastric mucosa. Taken together, these results indicated that the hydrolysate intervention can prevent H. pylori-induced gastric injury by anti-adhesive activity and inhibiting the NF-κB signaling pathway’s induction of inflammation. Hence, the corn protein hydrolysate might act as a potential anti-adhesive agent to prevent H. pylori infection. Full article
(This article belongs to the Special Issue Nutrition Intervention on Digestive Diseases)
Show Figures

Figure 1

Figure 1
<p>The anti-adhesion assays of CPN. (<b>a</b>) CPN and <span class="html-italic">H. pylori</span> were pre-incubated; (<b>b</b>) CPN and GES-1 cells were pre-incubated; (<b>c</b>) <span class="html-italic">H. pylori</span> and GES-1 cells were pre-incubated.</p>
Full article ">Figure 2
<p>Effects of CPN on gastric contents of IL-1β (<b>A</b>), IL-6 (<b>B</b>), TNF-α (<b>C</b>), MPO (<b>D</b>), KC (<b>E</b>) and MCP-1 (<b>F</b>) in <span class="html-italic">H. pylori</span>-infected mice. Data are expressed as the mean ± SD, <span class="html-italic">n</span> = 8. * Denotes significant difference to NC group, <span class="html-italic">p</span> &lt; 0.05; # denotes significant difference to HM group, <span class="html-italic">p</span> &lt; 0.05.</p>
Full article ">Figure 3
<p>Effects of CPN on gastric contents of TLR4 (<b>A</b>), MyD88 (<b>B</b>), NF-κB (<b>C</b>) in H. pylori-infected mice. Data are expressed as the mean±SD, <span class="html-italic">n</span> = 8. * Denotes significant difference to NC group, <span class="html-italic">p</span> &lt; 0.05; # denotes significant difference to HM group, <span class="html-italic">p</span> &lt; 0.05.</p>
Full article ">Figure 4
<p>Histopathological sections of the gastric mucosa (H&amp;E, ×400). (<b>A</b>) NC group; (<b>B</b>) HM group; (<b>C</b>) CPN-200; (<b>D</b>) CPN-400; (<b>E</b>) CPN-600; (<b>F</b>) positive control.</p>
Full article ">
16 pages, 1174 KiB  
Article
Intake of Lactiplantibacillus plantarum HEAL9 Improves Cognition in Moderately Stressed Subjects: A Randomized Controlled Study
by Gunilla Önning, Caroline Montelius, Magnus Hillman and Niklas Larsson
Nutrients 2023, 15(15), 3466; https://doi.org/10.3390/nu15153466 - 5 Aug 2023
Cited by 6 | Viewed by 3985
Abstract
Background: The usage of probiotics has expanded beyond the areas of gut and immune health improvement. Several studies have shown the positive impact associated between probiotics and stress, cognition, and mood; a relationship referred to as the gut–brain axis. Method: The aim of [...] Read more.
Background: The usage of probiotics has expanded beyond the areas of gut and immune health improvement. Several studies have shown the positive impact associated between probiotics and stress, cognition, and mood; a relationship referred to as the gut–brain axis. Method: The aim of this exploratory study was to evaluate the effect of the probiotic strain Lactiplantibacillus plantarum HEAL9 (LPHEAL9) on the gut–brain axis in subjects with moderate stress. One hundred and twenty-nine subjects aged 21–52 years completed the study, randomized to consume either LPHEAL9 (n = 65) or placebo (n = 64) for 12 weeks. Results: Perceived stress and awakening cortisol were significantly reduced over time in both groups. A significant improvement in four cognition tests after consumption of LPHEAL9 compared to placebo was observed (rapid information processing test, numeric working memory test, paired associated learning, and word recall, p < 0.05). There was a tendency for a significantly better improvement in the LPHEAL9 group for three mood subscales (Confusion–Bewilderment, Anger–Hostility, and Depression–Dejection) and for fewer subjects with poor sleep in the LPHEAL9 group compared to placebo (p < 0.10). Conclusions: Intake of LPHEAL9 significantly improved cognitive functions compared to the placebo, potentially by ameliorating aspects of mood and sleep. Full article
(This article belongs to the Section Prebiotics and Probiotics)
Show Figures

Figure 1

Figure 1
<p>Participant flow chart. Abbreviations: ITT, intention to treat; PP, per protocol; PI, primary investigator.</p>
Full article ">Figure 2
<p>Perceived stress as measured by Cohen’s Perceived Stress Scale (PSS). Both LPHEAL9 and placebo groups experienced a significant decline in PPS from baseline to week 12. Within group difference compared to baseline *** <span class="html-italic">p</span> &lt; 0.001 (Wilcoxon Signed-Rank Test).</p>
Full article ">Figure 3
<p>Word recall test, mean change (SEM) from baseline to week 12 in accuracy (%). Within-group differences compared to baseline ** <span class="html-italic">p</span> &lt; 0.01 (Wilcoxon Signed-Rank Test) and between-group differences *** <span class="html-italic">p</span> &lt; 0.001 (mixed two-way between–within groups ANOVA).</p>
Full article ">Figure 4
<p>Paired associate learning (PAL): Mean (SEM) change from baseline to week 12 in total errors (<b>A</b>) and mean errors to success (<b>B</b>). Within-group differences compared to baseline * <span class="html-italic">p</span> &lt; 0.05 (Wilcoxon Signed-Rank Test) and between-group differences * <span class="html-italic">p</span> &lt; 0.05 (mixed two-way between–within groups ANOVA, outliers removed).</p>
Full article ">
Previous Issue
Next Issue
Back to TopTop