[go: up one dir, main page]

Next Issue
Volume 15, August-1
Previous Issue
Volume 15, July-1
 
 
nutrients-logo

Journal Browser

Journal Browser

Nutrients, Volume 15, Issue 14 (July-2 2023) – 209 articles

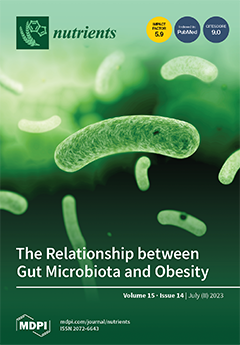
Cover Story (view full-size image): The relationship between gut microbiota and obesity is well documented in humans and animal models. Dietary factors can change the intestinal microbiota composition and influence obesity development. However, knowledge of how diet, metabolism, and intestinal microbiota interact and modulate energy metabolism and obesity development is still limited. Epidemiological studies show a link between consuming dietary proteins and fats from specific sources and obesity. Animal studies confirm that proteins and fats of different origins differ in their ability to prevent or induce obesity. Protein sources, such as meat, dairy products, vegetables, pulses, and seafood, vary in their amino acid composition. View this paper
  • Issues are regarded as officially published after their release is announced to the table of contents alert mailing list.
  • You may sign up for e-mail alerts to receive table of contents of newly released issues.
  • PDF is the official format for papers published in both, html and pdf forms. To view the papers in pdf format, click on the "PDF Full-text" link, and use the free Adobe Reader to open them.
Order results
Result details
Section
Select all
Export citation of selected articles as:
34 pages, 16398 KiB  
Article
Human Breast Milk microRNAs, Potential Players in the Regulation of Nervous System
by Luis Freiría-Martínez, Marta Iglesias-Martínez-Almeida, Cynthia Rodríguez-Jamardo, Tania Rivera-Baltanás, María Comís-Tuche, Daniela Rodrígues-Amorím, Patricia Fernández-Palleiro, María Blanco-Formoso, Yolanda Diz-Chaves, Natalia González-Freiria, María Suárez-Albo, Montserrat Martín-Forero-Maestre, Cristina Durán Fernández-Feijoo, Jose Ramón Fernández-Lorenzo, Ana Concheiro Guisán, Jose Manuel Olivares and Carlos Spuch
Nutrients 2023, 15(14), 3284; https://doi.org/10.3390/nu15143284 - 24 Jul 2023
Cited by 9 | Viewed by 3447
Abstract
Human milk is the biological fluid with the highest exosome amount and is rich in microRNAs (miRNAs). These are key regulators of gene expression networks in both normal physiologic and disease contexts, miRNAs can influence many biological processes and have also shown promise [...] Read more.
Human milk is the biological fluid with the highest exosome amount and is rich in microRNAs (miRNAs). These are key regulators of gene expression networks in both normal physiologic and disease contexts, miRNAs can influence many biological processes and have also shown promise as biomarkers for disease. One of the key aspects in the regeneration of the nervous system is that there are practically no molecules that can be used as potential drugs. In the first weeks of lactation, we know that human breast milk must contain the mechanisms to transmit molecular and biological information for brain development. For this reason, our objective is to identify new modulators of the nervous system that can be used to investigate neurodevelopmental functions based on miRNAs. To do this, we collected human breast milk samples according to the time of delivery and milk states: mature milk and colostrum at term; moderate and very preterm mature milk and colostrum; and late preterm mature milk. We extracted exosomes and miRNAs and realized the miRNA functional assays and target prediction. Our results demonstrate that miRNAs are abundant in human milk and likely play significant roles in neurodevelopment and normal function. We found 132 different miRNAs were identified across all samples. Sixty-nine miRNAs had significant differential expression after paired group comparison. These miRNAs are implicated in gene regulation of dopaminergic/glutamatergic synapses and neurotransmitter secretion and are related to the biological process that regulates neuron projection morphogenesis and synaptic vesicle transport. We observed differences according to the delivery time and with less clarity according to the milk type. Our data demonstrate that miRNAs are abundant in human milk and likely play significant roles in neurodevelopment and normal function. Full article
(This article belongs to the Section Nutrigenetics and Nutrigenomics)
Show Figures

Figure 1

Figure 1
<p>Western blot for exosome-specific surface markers CD9, CD63 and CD81 across exosome-containing fractions extracted with EX04 Exo-spin<sup>TM</sup> midi column.</p>
Full article ">Figure 2
<p>TEM microscopy images of isolated exosomes stained with Phosphotungstic Acid.</p>
Full article ">Figure 3
<p>Electropherogram for samples G1 (Term Mature Milk), G2 (Term Colostrum), G3 (Moderate/very Preterm Mature Milk), G4 (Moderate/very Preterm Colostrum) and G5 (Late Preterm Milk) Eukaryote Total RNA Nano Assay.</p>
Full article ">Figure 4
<p>Electropherogram for samples G1 (Term Mature Milk), G2 (Term Colostrum), G3 (Moderate/very Preterm Mature Milk), G4 (Moderate/very Preterm Colostrum) and G5 (Late Preterm Milk) Small RNA Assay.</p>
Full article ">Figure 5
<p>Volcano plot depicting the significant differentially expressed miRNAs from Term Colostrum (G2) vs. Term Mature Milk (G1). miRNAs with red dots are upregulated, miRNAs with blue dots are downregulated in G2 vs. G1.</p>
Full article ">Figure 6
<p>Volcano plot depicting the significant differentially expressed miRNAs from Moderate/Very Preterm Mature Milk (G3) vs. Term Mature Milk (G1). miRNAs with red dots are upregulated, miRNAs with blue dots are downregulated in G3 vs. G1.</p>
Full article ">Figure 7
<p>Volcano plot depicting the significant differentially expressed miRNAs from Late Preterm Mature Milk (G5) vs. Term Mature Milk (G1). miRNAs with blue dots are downregulated in G5 vs. G1.</p>
Full article ">Figure 8
<p>Volcano plot depicting the significant differentially expressed miRNAs from Moderate/Very Preterm Colostrum (G4) vs. Term Colostrum (G2). miRNAs with red dots are upregulated, miRNAs with blue dots are downregulated in G4 vs. G2.</p>
Full article ">Figure 9
<p>Volcano plot depicting the significant differentially expressed miRNAs from Moderate/Very Preterm Colostrum (G4) vs. Moderate/Very Preterm Mature Milk (G3). miRNAs with red dots are upregulated, miRNAs with blue dots are downregulated in G4 vs. G3.</p>
Full article ">Figure 10
<p>Volcano plot depicting the significant differentially expressed miRNAs from Late Preterm Mature Milk (G5) vs. Moderate/Very Preterm Mature Milk (G3). miRNAs with red dots are upregulated, miRNAs with blue dots are downregulated in G5 vs. G3.</p>
Full article ">Figure 11
<p>PCA plot for samples in (<b>A</b>) Term Mature Milk (G1) and Colostrum (G2) groups. (<b>B</b>) Term (G1) and Moderate/Very Preterm (G3) Mature Milk groups. (<b>C</b>) Term (G1) and Late Preterm (G5) Mature Milk groups. (<b>D</b>) Term (G2) and Moderate/Very Preterm (G4) Colostrum groups. (<b>E</b>) Moderate/Very Preterm Mature Milk (G3) and Colostrum (G4) groups. (<b>F</b>) Moderate/Very Preterm (G3) and Late Preterm (G5) Mature Milk groups.</p>
Full article ">Figure 12
<p>miRNA target analysis in terms of Cellular Component, Biological Process and KEGG Pathways for significant differentially expressed miRNAs for Term Colostrum (G2) vs. Mature Milk (G1). miRNAs with red backgrounds are upregulated, whereas miRNAs with blue backgrounds are downregulated in G2 compared to G1. In green it is represented when the miRNA localizes within the pathways in terms of Cellular Component, Biological Process and KEGG.</p>
Full article ">Figure 13
<p>miRNA target analysis in terms of Cellular Component, Biological Process and KEGG Pathways for significant differentially expressed miRNAs for Moderate/Very Preterm (G3) vs. Term (G1) Mature Milk. miRNAs with a red background are upregulated, whereas miRNAs with a blue background are downregulated in G3 compared to G1. In green it is represented when the miRNA localizes within the pathways in terms of Cellular Component, Biological Process and KEGG.</p>
Full article ">Figure 14
<p>miRNA target analysis in terms of Cellular Component, Biological Process and KEGG Pathways for significant differentially expressed miRNAs for Late Preterm (G5) vs. Term (G1) Mature Milk. miRNAs with a blue background are downregulated in G5 compared to G1. In green it is represented when the miRNA localizes within the pathways in terms of Cellular Component, Biological Process and KEGG.</p>
Full article ">Figure 15
<p>miRNA target analysis in terms of Cellular Component, Biological Process and KEGG Pathways for significant differentially expressed miRNAs for Moderate/Very Preterm (G4) vs. Term (G2) Colostrum. miRNAs with red backgrounds are upregulated, whereas miRNAs with blue backgrounds are downregulated in G4 compared to G2. In green it is represented when the miRNA localizes within the pathways in terms of Cellular Component, Biological Process and KEGG.</p>
Full article ">Figure 16
<p>miRNA target analysis in terms of Cellular Component, Biological Process and KEGG Pathways for significant differentially expressed miRNAs for Moderate/Very Preterm Colostrum (G4) vs. Mature Milk (G3). miRNAs with a red background are upregulated, whereas miRNAs with a blue background are downregulated in G4 compared to G3. In green it is represented when the miRNA localizes within the pathways in terms of Cellular Component, Biological Process and KEGG.</p>
Full article ">Figure 17
<p>miRNA target analysis in terms of Cellular Component, Biological Process and KEGG Pathways for significant differentially expressed miRNAs for Late Preterm (G5) vs. Moderate/Very Preterm (G3) Mature Milk. miRNAs with a red background are upregulated, whereas miRNAs with a blue background are downregulated in G5 compared to G3. In green it is represented when the miRNA localizes within the pathways in terms of Cellular Component, Biological Process and KEGG.</p>
Full article ">Figure 18
<p>miRNA target analysis over codifying genes of 9 neuro-related proteins for the significant differentially expressed miRNAs in Term Colostrum (G2) vs. Mature Milk (G1). miRNAs in the red background are upregulated, and miRNAs in the blue background are downregulated. Green cells mean the relationship between genes and miRNA.</p>
Full article ">Figure 19
<p>miRNA target analysis over codifying genes of 9 neuro-related proteins for the significant differentially expressed miRNAs in Moderate/Very Preterm (G3) vs. Term (G1) Mature Milk. miRNAs with red background are upregulated, miRNAs with blue background are downregulated. Green cells mean the relationship between genes and miRNA. Green cells mean the relationship between genes and miRNA.</p>
Full article ">Figure 20
<p>miRNA target analysis over codifying genes of 9 neuro-related proteins for the significant differentially expressed miRNAs in Late Preterm (G5) vs. Term (G1) Mature Milk. miRNAs with a blue background are downregulated. Green cells mean the relationship between genes and miRNA.</p>
Full article ">Figure 21
<p>miRNA target analysis over codifying genes of 9 neuro-related proteins for the significant differentially expressed miRNAs in Moderate/Very Preterm (G4) vs. Term (G2) Colostrum. miRNAs with red background are upregulated, miRNAs with blue background are downregulated. Green cells mean the relationship between genes and miRNA.</p>
Full article ">Figure 22
<p>miRNA target analysis over codifying genes of 9 neuro-related proteins for the significant differentially expressed miRNAs in Moderate/Very Preterm Colostrum (G4) vs. Mature Milk (G3). miRNAs with red background are upregulated, miRNAs with blue background are downregulated. Green cells mean the relationship between genes and miRNA.</p>
Full article ">Figure 23
<p>miRNA target analysis over codifying genes of 9 neuro-related proteins for the significant differentially expressed miRNAs in Late Preterm (G5) vs. Moderate/Very Preterm (G3) Mature Milk. miRNAs with red background are upregulated, miRNAs with blue background are downregulated. Green cells mean the relationship between genes and miRNA.</p>
Full article ">Figure 24
<p>Balances model about miRNA expression changes.</p>
Full article ">
14 pages, 311 KiB  
Article
The Prevalence and Impact of Nutritional Risk and Malnutrition in Gastrointestinal Surgical Oncology Patients: A Prospective, Observational, Multicenter, and Exploratory Study
by Manuel Durán Poveda, Alejandro Suárez-de-la-Rica, Emilia Cancer Minchot, Julia Ocón Bretón, Andrés Sánchez Pernaute and Gil Rodríguez Caravaca
Nutrients 2023, 15(14), 3283; https://doi.org/10.3390/nu15143283 - 24 Jul 2023
Cited by 3 | Viewed by 2413
Abstract
A prospective, observational, multicenter, and exploratory study was conducted in 469 gastrointestinal cancer patients undergoing elective surgery. The Malnutrition Universal Screening Tool (MUST) and the Global Leadership Initiative on Malnutrition (GLIM) criteria were used to assess nutritional risk. On admission, 17.9% and 21.1% [...] Read more.
A prospective, observational, multicenter, and exploratory study was conducted in 469 gastrointestinal cancer patients undergoing elective surgery. The Malnutrition Universal Screening Tool (MUST) and the Global Leadership Initiative on Malnutrition (GLIM) criteria were used to assess nutritional risk. On admission, 17.9% and 21.1% of patients were at moderate (MUST score 1) and severe (MUST score ≥ 2) nutritional risk, respectively. The GLIM criteria used in patients with a MUST score ≥ 2 showed moderate malnutrition in 35.3% of patients and severe in 64.6%. Forty-seven percent of patients with a MUST score ≥ 2 on admission had the same score at discharge, and 20.7% with a MUST score 0 had moderate/severe risk at discharge. Small bowel, esophageal, and gastric cancer and diabetes were predictors of malnutrition on admission. Complications were significantly higher among patients with a MUST score 1 or ≥2 either on admission (p = 0.001) or at discharge (p < 0.0001). In patients who received nutritional therapy (n = 231), 43% continued to have moderate/severe nutritional risk on discharge, and 54% of those with MUST ≥ 2 on admission maintained this score at discharge. In gastrointestinal cancer patients undergoing elective surgery, there is an urgent need for improving nutritional risk screening before and after surgery, as well as improving nutritional therapy during hospitalization. Full article
15 pages, 321 KiB  
Article
Micronutrient and Nutritional Status of HIV-Exposed and HIV-Unexposed Malawian Infants in the First Year of Life: Assessment of Ferritin, Vitamin A, and D Status and Its Association with Growth
by Marco Floridia, Clementina Maria Galluzzo, Stefano Orlando, Richard Luhanga, Robert Mphwere, Thom Kavalo, Mauro Andreotti, Roberta Amici, Fausto Ciccacci, Maria Cristina Marazzi and Marina Giuliano
Nutrients 2023, 15(14), 3282; https://doi.org/10.3390/nu15143282 - 24 Jul 2023
Viewed by 1650
Abstract
Breastfed Malawian infants from Human Immunodeficiency Virus (HIV)-uninfected and HIV-infected women who received antiretroviral therapy were followed until 12 months of age, allowing us to evaluate plasma levels of ferritin, vitamin A (as retinol-binding protein, RBP), and vitamin D (25(OH)D) at six months, [...] Read more.
Breastfed Malawian infants from Human Immunodeficiency Virus (HIV)-uninfected and HIV-infected women who received antiretroviral therapy were followed until 12 months of age, allowing us to evaluate plasma levels of ferritin, vitamin A (as retinol-binding protein, RBP), and vitamin D (25(OH)D) at six months, as well as nutritional status and growth between six and 12 months. Ferritin and RBP levels were adjusted for inflammation. The study included 88 infants, 63 of whom were part of a recent cohort (2019–2021) that included 49 HIV-exposed but uninfected (HEU) and 14 HIV-unexposed and uninfected (HUU) infants, as well as 25 infants (all HEU) from an earlier cohort (2008–2011). No differences were observed between HEU and HUU infants regarding micronutrient levels, anthropometric indexes, growth, and rates of stunting, being underweight, or wasting. HEU infants from the earlier cohort, when compared to more recent HEU infants, had significantly worse anthropometric measures at six months and inferior growth between six and twelve months. Overall, ferritin deficiency involved 68.6% of infants, while vitamin A and vitamin D deficiency involved 8% and 1.2% of infants, respectively. Micronutrient deficiencies were not associated with HIV exposure, cohort, stunting, being underweight, or wasting. At six months, stunting, being underweight, and wasting involved 25.0%, 2.7% and 2.8% of infants, respectively, with no differences related to HIV exposure. Ferritin deficiency at six months was associated with inferior subsequent growth. In this small observational study conducted in Malawian infants, no major nutritional gap was observed between HIV-exposed and HIV-unexposed infants, though the study highlighted specific nutritional deficiencies that deserve attention. High rates of stunting and ferritin deficiency were observed in the first year of life in Malawian infants, irrespective of maternal HIV status; a significant association between ferritin deficiency and worse subsequent growth was found. Vitamin A and vitamin D deficiencies were much less frequent. Based on the data observed, nutritional interventions should give priority to the correction of ferritin deficiency and chronic undernutrition. Full article
(This article belongs to the Section Nutritional Epidemiology)
16 pages, 2805 KiB  
Article
Yacon (Smallanthus sonchifolius) Flour Reduces Inflammation and Had No Effects on Oxidative Stress and Endotoxemia in Wistar Rats with Induced Colorectal Carcinogenesis
by Mariana Grancieri, Mirelle Lomar Viana, Daniela Furtado de Oliveira, Maria das Graças Vaz Tostes, Mariana Drummond Costa Ignacchiti, André Gustavo Vasconcelos Costa and Neuza Maria Brunoro Costa
Nutrients 2023, 15(14), 3281; https://doi.org/10.3390/nu15143281 - 24 Jul 2023
Cited by 2 | Viewed by 1617
Abstract
Colorectal cancer has a high worldwide incidence. The aim of this study was to determine the effect of yacon flour (YF) on oxidative stress, inflammation, and endotoxemia in rats with induced colorectal cancer (CRC). The Wistar male rats were divided and kept for [...] Read more.
Colorectal cancer has a high worldwide incidence. The aim of this study was to determine the effect of yacon flour (YF) on oxidative stress, inflammation, and endotoxemia in rats with induced colorectal cancer (CRC). The Wistar male rats were divided and kept for 8 weeks in four groups: S (basal diet, n = 10), Y (YF flour + basal diet, n = 10), C (CRC-induced control + basal diet, n = 12), CY (CRC-induced animals + YF, n = 12). CRC was induced by intraperitoneal injections of 1,2-dimethylhydrazine (25 mg/kg body weight). Groups Y and CY received 7.5% of the prebiotic FOS from YF. The treatment with YF increased fecal secretory immunoglobulin A levels and decreased lipopolysaccharides, tumor necrosis factor alpha and interleukin-12. However, no effect was observed on the oxidative stress by the total antioxidant capacity of plasma, anion superoxide, and nitric oxide analysis of the animals (p < 0.05). The short-chain fatty acids acetate, propionate, and butyrate showed interactions with NF-κB, TLR4, iNOS, and NADPH oxidase by in silico analysis and had a correlation (by the Person analysis) with CRC markers. The yacon flour treatment reduced the inflammation in rats with induced CRC, and could be a promising food to reduce the damages caused by colorectal cancer. Full article
(This article belongs to the Special Issue The Action of Bioactive Compounds on Human Health or Disease)
Show Figures

Figure 1

Figure 1
<p>Experimental designer of experiment. DMH: 1,2-dimethilhydrazine; CRC: colorectal cancer; w/: with; w/o: without.</p>
Full article ">Figure 2
<p>Superoxide anion and nitric oxide release by neutrophils from rats fed or not with yacon flour and induced or not to colorectal cancer. (<b>A</b>) Superoxide anion release by neutrophils not stimulated by opsonized zymozan; (<b>B</b>) superoxide anion release by neutrophils stimulated by opsonized zymozan; (<b>C</b>) nitric oxide release by neutrophils not stimulated by opsonized zymozan; (<b>D</b>) NO release by neutrophils stimulated by opsonized zymozan. Values are shown as means ± SD. Dates analyzed by one-way ANOVA and post hoc Newman–Keuls (<span class="html-italic">p</span> &lt; 0.05). The lowercase letter “a” indicates that there is no difference between groups. Dates analyzed by absorbance. S = group without the induction of colon cancer and without yacon flour (<span class="html-italic">n</span> = 10); C = group with the induction of colon cancer and without yacon flour (<span class="html-italic">n</span> = 10); Y = group without the induction of colon cancer and with yacon flour (<span class="html-italic">n</span> = 12); CY = group with the induction of colon cancer and with yacon flour (<span class="html-italic">n</span> = 12). YF = yacon flour; CRC = colorectal cancer. O<sub>2</sub><sup>−</sup>: superoxide anion; NO: nitric oxide.</p>
Full article ">Figure 3
<p>Immunologic and oxidative markers produced by rats fed or not with yacon flour and induced or not to colorectal cancer. (<b>A</b>) IgA release; (<b>B</b>) endotoxin levels; (<b>C</b>) TAC. Values shown as means ± SD. Dates are analyzed by one-way ANOVA and post hoc Newman–Keuls (<span class="html-italic">p</span> &lt; 0.05). The different letters are the differences between groups. Dates analyzed by absorbance. S = group without induction of colon cancer and without yacon flour (<span class="html-italic">n</span> = 10); C = group with induction of colon cancer and without yacon flour (<span class="html-italic">n</span> = 10); Y = group without induction of colon cancer and with yacon flour (<span class="html-italic">n</span> = 12); CY = group with induction of colon cancer and with yacon flour (<span class="html-italic">n</span> = 12). YF = yacon flour; CRC = colorectal cancer. sIgA= secretory immunoglobulin A. TAC= total antioxidant capacity. mMTE= millimolar of Trolox equivalent. EU/mL: endotoxin unit/mL plasma.</p>
Full article ">Figure 4
<p>Plasmatic cytokine release by rats fed or not with yacon flour and induced or not to colorectal cancer. (<b>A</b>) TNF-α release; (<b>B</b>) IL-12 release; (<b>C</b>) IL-10 release. Values showed as means ± SD. Dates analyzed by one-way ANOVA and post hoc Newman–Keuls (<span class="html-italic">p</span> &lt; 0.05). The different letters are the differences between groups. Dates analyzed by absorbance. S = group without induction of colon cancer and without yacon flour (<span class="html-italic">n</span> = 10); C = group with induction of colon cancer and without yacon flour (<span class="html-italic">n</span> = 10); Y = group without induction of colon cancer and with yacon flour (<span class="html-italic">n</span> = 12); CY = group with induction of colon cancer and with yacon flour (<span class="html-italic">n</span> = 12). TNF-α = tumoral necrosis factor alpha; IL-12 = interleukin-12; YF = yacon flour; CRC = colorectal cancer.</p>
Full article ">Figure 5
<p>The in silico interaction of the main short-chain fatty acids generate by FOS fermentation after yacon consumption: acetate, propionate, and butyrate. Dates analyzed by AutoDock Vina<sup>®</sup> and visualized by Discovery Studio 2016 Client<sup>®</sup>. Color code indicates the residue interaction: heliotrope: Pi-sigma bond; lime green: conventional hydrogen bond; light green: carbon hydrogen bond; neon pink: Pi-Pi T-shaped bond; orange: Pi-cation bond. p65 NF-κB: nuclear factor kappa B. TLR4: Toll-like receptor 4. iNOS: inducible nitric oxide synthase. NADPH oxidase: nicotinamide adenine dinucleotide phosphate oxidase.</p>
Full article ">Figure 6
<p>Heat map of the Pearson rank correlations between the biological outcomes of animals with induced colorectal cancer and fed with yacon flour for 8 weeks. * <span class="html-italic">p</span> &lt; 0.05. %UM: percentage of urinary excretion of mannitol; %UL: percentage of urinary excretion of lactulose; total ACF: total aberrant crypt foci; TAC: total antioxidant capacity; LPS: lipopolysaccharide; IL: interleukin; TNF: tumor necrosis factor; sIgA: secretory immunoglobulin A.</p>
Full article ">Figure 7
<p>The proposal effect caused by the consumption of yacon flour as a FOS (prebiotic) source. The prebiotic ingestion stimulates the <span class="html-italic">Bacteroidetes</span> bacteria development instead of <span class="html-italic">Firmicutes</span> bacteria, which reduce the production and release of LPS to the blood circulation. Then, the binding of LPS on TLR4, and consequently the downstream pathway activation, is reduced on immune cells, like neutrophil, which reduces the cytokines’ release and reduces the inflammation. LPS: lipopolysaccharide; O<sub>2</sub><sup>−</sup>: superoxide anion; NADPH oxidase: nicotinamide adenine dinucleotide phosphate oxidase; sIgA: secretory immunoglobulin A. TLR4: Toll-like receptor 4; p65 NF-κB: nuclear factor kappa B; IκB: inhibitor of κB; TNF-α = tumoral necrosis factor alpha; IL-12 = interleukin-12.</p>
Full article ">
18 pages, 1783 KiB  
Systematic Review
Predictive Value of Malnutrition, Identified via Different Nutritional Screening or Assessment Tools, for Functional Outcomes in Patients with Stroke: A Systematic Review and Meta-Analysis
by Peiqi Liu, Huimin Tian, Tianliang Ji, Tangsheng Zhong, Lan Gao and Li Chen
Nutrients 2023, 15(14), 3280; https://doi.org/10.3390/nu15143280 - 24 Jul 2023
Cited by 4 | Viewed by 2513
Abstract
Background: Malnutrition affects more than half of patients with stroke. Although malnutrition leads to more deaths, a longer hospital stay, and higher costs, there is still a lack of consensus regarding the impact of malnutrition on physical functional outcomes in patients with stroke, [...] Read more.
Background: Malnutrition affects more than half of patients with stroke. Although malnutrition leads to more deaths, a longer hospital stay, and higher costs, there is still a lack of consensus regarding the impact of malnutrition on physical functional outcomes in patients with stroke, and there are large differences in the diagnostic effects of nutritional screening or assessment tools for malnutrition. This study aimed to explore the impact of malnutrition in patients with stroke and assess the significance of current nutritional screening and assessment tools for these patients. Methods: Six databases were systematically searched until October 2022. Cohort studies meeting the eligibility criteria were included. Pooled effects were calculated using random-effects models. Results: Twenty-six studies with 21,115 participants were included. The pooled effects of malnutrition on poor functional outcome, FIM points, and dysphagia were OR = 2.72 (95% CI = 1.84–4.06), WMD = −19.42(95% CI = −32.87–−5.96), and OR = 2.80 (95% CI = 1.67–4.67), respectively. Conclusion: Malnutrition adversely affects the recovery of physical and swallowing functions in patients with stroke. Nutritional assessments consistently predict the outcomes of physical function in patients with stroke. Full article
(This article belongs to the Section Clinical Nutrition)
Show Figures

Figure 1

Figure 1
<p>Flow diagram of the literature search process.</p>
Full article ">Figure 2
<p>The effect of malnutrition on poor functional outcome in patients with stroke [<a href="#B23-nutrients-15-03280" class="html-bibr">23</a>,<a href="#B26-nutrients-15-03280" class="html-bibr">26</a>,<a href="#B28-nutrients-15-03280" class="html-bibr">28</a>,<a href="#B29-nutrients-15-03280" class="html-bibr">29</a>,<a href="#B35-nutrients-15-03280" class="html-bibr">35</a>,<a href="#B36-nutrients-15-03280" class="html-bibr">36</a>,<a href="#B37-nutrients-15-03280" class="html-bibr">37</a>,<a href="#B38-nutrients-15-03280" class="html-bibr">38</a>,<a href="#B39-nutrients-15-03280" class="html-bibr">39</a>,<a href="#B40-nutrients-15-03280" class="html-bibr">40</a>,<a href="#B41-nutrients-15-03280" class="html-bibr">41</a>,<a href="#B42-nutrients-15-03280" class="html-bibr">42</a>,<a href="#B43-nutrients-15-03280" class="html-bibr">43</a>,<a href="#B44-nutrients-15-03280" class="html-bibr">44</a>].</p>
Full article ">Figure 3
<p>The effect of malnutrition on FIM points in patients with stroke [<a href="#B20-nutrients-15-03280" class="html-bibr">20</a>,<a href="#B25-nutrients-15-03280" class="html-bibr">25</a>,<a href="#B27-nutrients-15-03280" class="html-bibr">27</a>,<a href="#B33-nutrients-15-03280" class="html-bibr">33</a>].</p>
Full article ">Figure 4
<p>The impact of malnutrition on dysphagia in patients with stroke [<a href="#B5-nutrients-15-03280" class="html-bibr">5</a>,<a href="#B20-nutrients-15-03280" class="html-bibr">20</a>,<a href="#B21-nutrients-15-03280" class="html-bibr">21</a>,<a href="#B22-nutrients-15-03280" class="html-bibr">22</a>,<a href="#B27-nutrients-15-03280" class="html-bibr">27</a>].</p>
Full article ">
15 pages, 2106 KiB  
Article
Shear-Viscosity-Dependent Effect of a Gum-Based Thickening Product on the Safety of Swallowing in Older Patients with Severe Oropharyngeal Dysphagia
by Mireia Bolivar-Prados, Yuki Hayakawa, Noemi Tomsen, Viridiana Arreola, Weslania Nascimento, Stephanie Riera, Satomi Kawakami, Kazuhiro Miyaji, Yasuhiro Takeda, Jun Kayashita and Pere Clavé
Nutrients 2023, 15(14), 3279; https://doi.org/10.3390/nu15143279 - 24 Jul 2023
Cited by 8 | Viewed by 1692
Abstract
Fluid thickening is a valid therapeutic strategy for patients with oropharyngeal dysphagia (OD). The main aim of this study was to determine the therapeutic effect of the xanthan-gum-based thickener Tsururinko Quickly (TQ, Morinaga Milk Co., Tokyo, Japan) in older patients with severe OD. [...] Read more.
Fluid thickening is a valid therapeutic strategy for patients with oropharyngeal dysphagia (OD). The main aim of this study was to determine the therapeutic effect of the xanthan-gum-based thickener Tsururinko Quickly (TQ, Morinaga Milk Co., Tokyo, Japan) in older patients with severe OD. A total of 85 patients (83.32 ± 6.75 y) with OD and a penetration–aspiration score (PAS) of n ≥ 3 were studied by videofluoroscopy while swallowing duplicate 10 mL boluses at <50 mPa·s, 100, 200, 400, 800, and 1600 mPa·s, to assess the safety and efficacy of swallowing and the biomechanics of a swallowing response at each viscosity level. At <50 mPa·s, only 16.25% patients swallowed safely, 45% had penetrations (PAS 3–5), and 38.75% had aspirations (PAS 6–8). Fluid thickening with TQ greatly increased the prevalence of patients with safe swallowing from 62.90% at 100 mPa·s to 95.24% at 1600 mPa·s in a shear-viscosity-dependent manner. The penetrations and aspirations were significantly reduced to 3.60% and 1.19%, respectively, at 1600 mPa·s. The threshold viscosity was 100 mPa·s and the increasing viscosity above 800 mPa·s did not further improve the therapeutic effect significantly. Increasing the shear viscosity significantly reduced the time to laryngeal vestibule closure (−16.70%), increased the time to upper oesophageal sphincter opening (+26.88%), and reduced the pharyngeal bolus velocity (−31.62%) without affecting the pharyngeal residue. TQ has a strong shear-viscosity-dependent effect on the safety of swallowing in older patients with severe OD without increasing the pharyngeal residue. The therapeutic range for TQ is 100–800 mPa·s, with 200 and 800 mPa·s being the optimal doses to cover the needs of older patients with OD. Full article
(This article belongs to the Section Clinical Nutrition)
Show Figures

Figure 1

Figure 1
<p>Experimental design of TQ study NCT04565587 at Consorci Sanitari del Maresme.</p>
Full article ">Figure 2
<p>Consort flow chart of patient recruitment and inclusion in the study. PAS indicates the penetration–aspiration scale.</p>
Full article ">Figure 3
<p>Prevalence of patients with safe swallowing at each viscosity level assessed herein. Significant differences are also presented for all viscosities. * <span class="html-italic">p</span> &lt; 0.05; ** <span class="html-italic">p</span> &lt; 0.01; *** <span class="html-italic">p</span> &lt; 0.001; **** <span class="html-italic">p</span> &lt; 0.0001.</p>
Full article ">Figure 4
<p>Dose–response curve. The effect of increasing viscosity on the prevalence of patients with safe swallowing. The green frame depicts the therapeutic range of TQ in older patients with OD. The green circles represent the two optimal viscosity levels needed to ensure safe swallowing for all the patients included in this study.</p>
Full article ">Figure 5
<p>Effect of the bolus velocity on the oropharyngeal swallow response. The mean times to laryngeal vestibule closure (LVC) and upper oesophageal sphincter opening (UESO) for each viscosity level assessed herein are shown. The dashed line represents the reference value in healthy volunteers (160 ms for LVC according to Clavé 2006; 200 ms for UESO according to Rofes 2010). ** <span class="html-italic">p</span> &lt; 0.01; *** <span class="html-italic">p</span> &lt; 0.001; **** <span class="html-italic">p</span> &lt; 0.0001.</p>
Full article ">Figure 6
<p>Mean ± SD punctuation on palatability given by the participants according to the 5-point facial Likert scale at each viscosity level assessed. ** <span class="html-italic">p</span> &lt; 0.01; *** <span class="html-italic">p</span> &lt; 0.001.</p>
Full article ">Figure 7
<p>Viscosity flow curves of the pre- and post-oral incubation viscosity levels of 200 and 800 mPa·s, respectively, in a shear rate range from 1 to 1000 s<sup>−1</sup>.</p>
Full article ">
18 pages, 345 KiB  
Review
The Footprint of Microbiome in Pediatric Asthma—A Complex Puzzle for a Balanced Development
by Ancuta Lupu, Elena Jechel, Cristina Maria Mihai, Elena Cristina Mitrofan, Silvia Fotea, Iuliana Magdalena Starcea, Ileana Ioniuc, Adriana Mocanu, Dragos Catalin Ghica, Alina Popp, Dragos Munteanu, Maria Oana Sasaran, Delia Lidia Salaru and Vasile Valeriu Lupu
Nutrients 2023, 15(14), 3278; https://doi.org/10.3390/nu15143278 - 24 Jul 2023
Cited by 14 | Viewed by 2039
Abstract
Considered to be of greater complexity than the human genome itself, the microbiome, the structure of the body made up of trillions of bacteria, viruses, and fungi, has proven to play a crucial role in the context of the development of pathological processes [...] Read more.
Considered to be of greater complexity than the human genome itself, the microbiome, the structure of the body made up of trillions of bacteria, viruses, and fungi, has proven to play a crucial role in the context of the development of pathological processes in the body, starting from various infections, autoimmune diseases, atopies, and culminating in its involvement in the development of some forms of cancer, a diagnosis that is considered the most disabling for the patient from a psychological point of view. Therefore, being a cornerstone in the understanding and optimal treatment of a multitude of ailments, the body’s microbiome has become an intensively studied subject in the scientific literature of the last decade. This review aims to bring the microbiome–asthma correlation up to date by classifying asthmatic patterns, emphasizing the development patterns of the microbiome starting from the perinatal period and the impact of pulmonary dysbiosis on asthmatic symptoms in children. Likewise, the effects of intestinal dysbiosis reflected at the level of homeostasis of the internal environment through the intestine–lung/vital organs axis, the circumstances in which it occurs, but also the main methods of studying bacterial variability used for diagnostic purposes and in research should not be omitted. In conclusion, we draw current and future therapeutic lines worthy of consideration both in obtaining and maintaining remission, as well as in delaying the development of primary acute episodes and preventing future relapses. Full article
(This article belongs to the Special Issue Nutrition, Gut Microbiota and Health)
11 pages, 1114 KiB  
Article
Trajectories of Meat Intake and Risk of Type 2 Diabetes: Findings from the China Health and Nutrition Survey (1997–2018)
by Mengran Liu, Huijun Wang, Shufa Du, Yingying Jiao, Qi Wang, Chang Su, Bing Zhang and Gangqiang Ding
Nutrients 2023, 15(14), 3277; https://doi.org/10.3390/nu15143277 - 24 Jul 2023
Cited by 1 | Viewed by 1565
Abstract
Few articles have investigated the impact of long-term meat intake trends and their changes during follow-up on the risk of type 2 diabetes (T2D). We aimed to explore the long-term trajectories of meat intake and determine its association with T2D risk in Chinese [...] Read more.
Few articles have investigated the impact of long-term meat intake trends and their changes during follow-up on the risk of type 2 diabetes (T2D). We aimed to explore the long-term trajectories of meat intake and determine its association with T2D risk in Chinese adults. This study used seven rounds of data from the China Health and Nutrition Survey (1997, 2000, 2004, 2006, 2009, 2015, and 2018), and 4464 adults aged 18 years or older were analyzed. The group-based trajectory modeling was used to identify meat intake trajectories over 21 years. Multivariate Cox proportional hazard and restricted cubic spline models were used to analyze the association and dose–response relationship between meat intake and T2D. Four trajectory groups were identified: “low-increase intake group” (Group 1), “moderate-increase intake group” (Group 2), “medium-stable intake group” (Group 3), and “high intake group” (Group 4). Compared with Group 2, Group 4 was associated with a higher risk of developing T2D (hazard ratio 2.37 [95% CI 1.41–3.98]). After adjusting for demographic characteristics, lifestyle, total energy intake, waist circumference, and systolic blood pressure, and using the third quintile as a reference, the risk of T2D was increased by 46% in the lowest quintile with meat intake (hazard ratio 1.46 [95% CI 1.07–2.01]) and by 41% in the highest quintile with meat intake (HR 1.41 [95% CI 1.03–1.94]). A U-shape was observed between meat intake and T2D risk (p for nonlinear < 0.001). When the intake was lower than 75 g/day, the risk of T2D was negatively correlated with meat intake, while the risk of T2D was positively correlated with meat intake when the intake was higher than 165 g/day. We identified four trajectory groups of meat intake from 1997 to 2018, which were associated with different risks of developing T2D. A U-shaped association was observed between meat intake and T2D in Chinese adults. Full article
(This article belongs to the Special Issue Diet, Weight Control, and Cardiometabolic Risks in Adults)
Show Figures

Figure 1

Figure 1
<p>Flowchart of participants included in the analysis.</p>
Full article ">Figure 2
<p>Estimated trajectory groups of meat intake among Chinese adults.</p>
Full article ">Figure 3
<p>Dose–response relationship of dietary meat intake with type 2 diabetes.</p>
Full article ">
8 pages, 595 KiB  
Brief Report
A Double-Blind, Randomized, Placebo-Controlled Trial of the Effect of 1-Kestose on Defecation Habits in Constipated Kindergarten Children: A Pilot Study
by Mayuko Takahashi, Yoshihiro Kadota, Yuki Shiko, Yohei Kawasaki, Kenichi Sakurai, Chisato Mori and Naoki Shimojo
Nutrients 2023, 15(14), 3276; https://doi.org/10.3390/nu15143276 - 24 Jul 2023
Viewed by 1369
Abstract
Constipation is common in children and can significantly affect quality of life. Prebiotics are reportedly helpful for constipation in adults, but few studies have examined their use in young children. In this study, the effect of 1-kestose (kestose), which has excellent bifidobacterial growth [...] Read more.
Constipation is common in children and can significantly affect quality of life. Prebiotics are reportedly helpful for constipation in adults, but few studies have examined their use in young children. In this study, the effect of 1-kestose (kestose), which has excellent bifidobacterial growth properties, on constipation in kindergarten children (n = 11) was compared with that of maltose (n = 12) in a randomized, double-blind study. Three grams of kestose per day for 8 weeks did not affect stool properties, but significantly increased the number of defecations per week (Median; 3 → 4 times/week, p = 0.017, effect size = 0.53). A significant decrease in Intestinibacter, a trend toward increased bifidobacteria, and a trend toward decreased Clostridium sensu stricto were observed after kestose ingestion, while concentrations of short-chain fatty acids in stools were unchanged. Full article
(This article belongs to the Special Issue Probiotics and Prebiotics in Pediatrics)
Show Figures

Figure 1

Figure 1
<p>Summary of participants’ defecation habits at the beginning and end of the study. Color points are outliers (values greater than 1.5 times the interquartile range). (<b>a</b>) Total weekly number of defecations (minimum: 0 times); (<b>b</b>) number of days with defecation in a week (minimum: 0 days, maximum: 7 days); (<b>c</b>) median weekly stool volume (1 = size of chicken egg); (<b>d</b>) total stool volume per week.</p>
Full article ">
25 pages, 556 KiB  
Article
A Randomized, Double-Blind, Controlled Trial Assessing If Medium-Chain Triglycerides in Combination with Moderate-Intensity Exercise Increase Muscle Strength in Healthy Middle-Aged and Older Adults
by Keiichi Kojima, Haruna Ishikawa, Shinji Watanabe, Naohisa Nosaka and Tatsushi Mutoh
Nutrients 2023, 15(14), 3275; https://doi.org/10.3390/nu15143275 - 24 Jul 2023
Cited by 6 | Viewed by 4117
Abstract
An adequate nutritional intake is recommended for the prevention of physical frailty and sarcopenia. In particular, medium-chain fatty acids (MCFAs) are reportedly important for muscle strength in nursing home residents. However, the effects of MCFAs on healthy adults at risk for frailty remain [...] Read more.
An adequate nutritional intake is recommended for the prevention of physical frailty and sarcopenia. In particular, medium-chain fatty acids (MCFAs) are reportedly important for muscle strength in nursing home residents. However, the effects of MCFAs on healthy adults at risk for frailty remain unknown. Hence, a randomized, placebo-controlled study was conducted to investigate the effects of 12 weeks of medium-chain triglycerides (MCTs) intake and walking on muscle mass and function in healthy, sedentary, middle-aged and older adults with a low body mass index. Three MCT intake groups with different amounts of octanoic and decanoic acid intake were compared with a control group. After 12 weeks, knee extension strength increased in all groups, with the increases in all MCT intake groups being significantly higher than those in the control group (p < 0.05). Grip strength significantly increased from baseline in the MCT 6 g/day intake group (p < 0.05). The combination of aerobic exercise and MCT intake may be effective in preventing decline in muscle strength and promoting increase in muscle strength as they can improve muscle energy production, thereby contributing to the maintenance of good health for middle-aged and older adults at high risk for frailty and sarcopenia. Full article
Show Figures

Figure 1

Figure 1
<p>Flowchart of study subjects.</p>
Full article ">
11 pages, 466 KiB  
Article
Associations between Total and Added Sugar Intake and Diabetes among Chinese Adults: The Role of Body Mass Index
by Yan Liu, Jing Cheng, Lijin Wan and Wei Chen
Nutrients 2023, 15(14), 3274; https://doi.org/10.3390/nu15143274 - 24 Jul 2023
Viewed by 2257
Abstract
Sugar intake has been linked to the global rise in diabetes. However, the unique diabetogenic effect of sugar, independent of weight gain, remains controversial. This study aimed to investigate the associations between total and added sugar intake and diabetes status, and to test [...] Read more.
Sugar intake has been linked to the global rise in diabetes. However, the unique diabetogenic effect of sugar, independent of weight gain, remains controversial. This study aimed to investigate the associations between total and added sugar intake and diabetes status, and to test whether the sugar–diabetes associations were moderated or mediated by the body mass index (BMI). We performed a nationwide cross-sectional study on 12,889 Chinese adults who were enrolled in the China Health and Nutrition Survey (CHNS) 2011. The data for the total and added sugar intake were measured using three consecutive 24 h recalls, and determined based on the U.S. Department of Agriculture (USDA) National Nutrient Database for Standard Reference, Release 28 (SR28), the Food Patterns Equivalents Database (FPED) 2015–2016, and the labeled ingredients and nutrient contents. A multivariable logistic regression model was used to analyze the associations between the total and added sugar intake and diabetes. A nutrient density model was used to adjust for the total energy intake. A mediation analysis for significant sugar–diabetes associations shown in multivariable logistic analysis (p < 0.05), and a subgroup analysis according to the BMI category were performed, to examine the mediating and moderating effects of the BMI on the sugar–diabetes association, respectively. We included 12,800 individuals, with a mean age of 50.5, in the final analysis. The means of the total and added sugar intake, total sugar (%E), and added sugar (%E) were 28.2 ± 0.2 g/d, 5.0 ± 0.1 g/d, 6.0 ± 0.0%, and 1.0 ± 0.0%, respectively. The overall prevalence of self-reported physician-diagnosed diabetes was 4.0%. A significant association between the total sugar intake and an increased risk of diabetes was found (odds ratio [OR] =1.008, 95% CI 1.001–1.016). The mediation analysis showed a significant mediation effect through the BMI of the effect of the total sugar on diabetes status (p < 0.001), where 11.7% (95% CI: 4.7–35.7%) of the effect of the total sugar on diabetes was mediated through the BMI. The total sugar intake had a significant direct effect on diabetes around the BMI (estimated coefficient = 0.0004, p < 0.001). The overall total-sugar-intake–diabetes association remained significant in normal-weight participants in the subgroup analysis (OR =1.012, 1.000–1.024). In conclusion, although the BMI moderated and mediated the association between the total sugar intake and diabetes, the total sugar still showed some unique weight-independent diabetogenic effects. Our findings call for efforts to prevent and control diabetes by reducing sugar intake, and losing weight appropriately. Full article
(This article belongs to the Section Nutrition and Diabetes)
Show Figures

Figure 1

Figure 1
<p>Mediation analysis between the total sugar intake and diabetes using the BMI <sup>1</sup>, CHNS 2011. <sup>1</sup> BMI: body mass index; CHNS: China Health and Nutrition Survey.</p>
Full article ">
21 pages, 2950 KiB  
Article
An Okinawan-Based Nordic Diet Leads to Profound Effects on Gut Microbiota and Plasma Metabolites Linked to Glucose and Lipid Metabolism
by Lokeshwaran Manoharan, Bodil Roth, Corinna Bang, Hans Stenlund and Bodil Ohlsson
Nutrients 2023, 15(14), 3273; https://doi.org/10.3390/nu15143273 - 24 Jul 2023
Cited by 3 | Viewed by 2862
Abstract
Dietary interventions modify gut microbiota and clinical outcomes. Weight reduction and improved glucose and lipid homeostasis were observed after adopting an Okinawan-based Nordic diet (O-BN) in individuals with type 2 diabetes. The aim of the present study was to explore changes in metabolomics [...] Read more.
Dietary interventions modify gut microbiota and clinical outcomes. Weight reduction and improved glucose and lipid homeostasis were observed after adopting an Okinawan-based Nordic diet (O-BN) in individuals with type 2 diabetes. The aim of the present study was to explore changes in metabolomics and gut microbiota during O-BN and correlate changes with clinical outcomes. A total of 30 patients (17 women), aged 57.5 ± 8.2 years, diabetes duration 10.4 ± 7.6 years, 90% over-weight, were included. Participants were provided an O-BN for 12 weeks. Before and after intervention, and 16 weeks afterwards, anthropometry and clinical data were estimated and questionnaires were collected, as well as samples of blood and stool. Plasma metabolomics were determined by gas- (GC-MS) or liquid- (LC-MS) chromatography-based mass spectrometry and fecal microbiota determination was based on 16S rRNA amplicons from regions V1–V2. During the intervention, weight (6.8%), waist circumference (6.1%), and levels of glucose, HbA1c, insulin, triglycerides, and cholesterol were decreased. Of 602 metabolites, 323 were changed for any or both periods; 199 (101 lipids) metabolites were decreased while 58 (43 lipids) metabolites were increased during the intervention. Changes in glucose homeostasis were linked to changes in, e.g., 1,5-anhydroglucitol, thyroxine, and chiro-inositol. Changes of microbe beta diversity correlated positively with food components and negatively with IL-18 (p = 0.045). Abundance differences at phylum and genus levels were found. Abundances of Actinobacteria, Bacteroidetes, Firmicutes, and Verrucomicrobia correlated with anthropometry, HbA1c, lipids, inflammation, and food. Changes in metabolites and microbiota were reversed after the intervention. The O-BN-induced changes in metabolomics and gut microbiota correspond to clinical outcomes of reduced weight and inflammation and improved glucose and lipid metabolism. Full article
(This article belongs to the Section Nutrition and Metabolism)
Show Figures

Figure 1

Figure 1
<p>Flow chart of the recruitment process and study design.</p>
Full article ">Figure 2
<p>All the different metabolites measured using both GC-MS and LC-MS are plotted on this figure. The adjusted <span class="html-italic">p</span>-values (<span class="html-italic">p</span>) multiplied with their sign of fold-change (FC) (negative for downregulation and positive for upregulation) from the differential expression analysis are plotted on the axes. The differential expression analysis “during intervention (week-12 vs. baseline)” is plotted on the <span class="html-italic">x</span>-axis while the differential expression analysis “after intervention (week-28 vs. week-12)” is plotted on the <span class="html-italic">y</span>-axis. The metabolites that are differentially expressed in both comparisons are highlighted in red while the metabolites that are differentially expressed only in one comparison are highlighted in blue. The metabolites that are not differentially expressed in either comparison are in gray.</p>
Full article ">Figure 3
<p>Significant correlations between beta diversity at ASV levels according to Bray–Curtis and breakfast contents (gram) (<b>a</b>) and according to weighted UniFrac and IL-18 (<b>b</b>). Significant correlations between beta diversity at genus levels according to Bray–Curtis and butyric acid and visfatin (<b>c</b>).</p>
Full article ">Figure 4
<p>Abundance of different phyla at baseline, week-12, and week-28.</p>
Full article ">Figure 5
<p>Significant differences in phylum abundance between baseline, week-12, and week-28. Kruskal–Wallis test. Patescibacteria was excluded in the figure due to very low abundance. **** = <span class="html-italic">p</span> &lt; 0.0001, * = <span class="html-italic">p</span> &lt; 0.05. <span class="html-italic">p</span> &lt; 0.05 was considered statistically significant.</p>
Full article ">Figure 6
<p>(<b>a</b>) Significant genera at week-12 compared to baseline. The microbes above the 0 line on the <span class="html-italic">y</span> axis are more abundant at week-12 and the ones below the 0 line on the <span class="html-italic">y</span> axis are more abundant at baseline. (<b>b</b>) Significant genera at week-28 compared to week-12. The microbes above the 0 line on the <span class="html-italic">y</span> axis are more abundant at week-28 and the ones below the 0 line on the <span class="html-italic">y</span> axis are more abundant at week-12.</p>
Full article ">Figure 7
<p>Significant amplicon sequence variants (ASV) at week-12 compared to baseline. The microbes above the 0 line on the <span class="html-italic">y</span> axis are more abundant at week-12 and the ones below the 0 line on the <span class="html-italic">y</span> axis are more abundant at baseline.</p>
Full article ">
10 pages, 297 KiB  
Article
Correlations between Nutritional Status and Quality of Life of People with Parkinson’s Disease
by Raissa Dias Fernandez, Graziela Maria Benevenuto Bezerra, Lane Viana Krejcová and Daniela Lopes Gomes
Nutrients 2023, 15(14), 3272; https://doi.org/10.3390/nu15143272 - 24 Jul 2023
Cited by 2 | Viewed by 1356
Abstract
Parkinson’s disease (PD) is a neurodegenerative condition that can impact the nutritional status, and such impact seems to be related to the quality of life (QoL). Objective: To evaluate the correlation between anthropometric variables and the QoL of people with Parkinson’s disease (PD). [...] Read more.
Parkinson’s disease (PD) is a neurodegenerative condition that can impact the nutritional status, and such impact seems to be related to the quality of life (QoL). Objective: To evaluate the correlation between anthropometric variables and the QoL of people with Parkinson’s disease (PD). Methods: This is a cross-sectional, descriptive, and analytical study, carried out through the collection of anthropometric data and application of the Parkinson’s Disease Questionnaire PDQ-39. Results: 33 individuals (23 male) diagnosed with PD participated in the research, with a mean age of 58.9 ± 11.6 years. We observed overweight in 45.4% of participants. The perception of QoL showed lower scores for the subjects in the dimensions of body discomfort (75.3 ± 16.6), social support (62.7 ± 15.7), and mobility (61.0 ± 23.6). The correlation between the total QoL score and age (model 1, B = 0.347; CI 0.004–0.902; p = 0.048), which remained statistically significant in the multiple linear regression, regardless of gender (model 2, B = 0.365; CI 0.016–0.937; p = 0.043) and BMI (model 3, B = 0.363; CI 0.006–0.943; p = 0.047), suggests that, in the participants of this study, this relationship does not depend on gender and nutritional status. Conclusion: The perception of QoL was worse in the dimensions of body discomfort, social support, and mobility, worsening with advanced age. Correlations between the worst scores in QoL dimensions and nutritional status were observed. A positive correlation was also identified between age and overall PDQ-39 score, regardless of gender and nutritional status. Full article
(This article belongs to the Section Nutrition Methodology & Assessment)
15 pages, 3184 KiB  
Article
Mumefural Improves Recognition Memory and Alters ERK-CREB-BDNF Signaling in a Mouse Model of Chronic Cerebral Hypoperfusion
by Min-Soo Kim, Bu-Yeo Kim, Jung Im Kim, Joungbok Lee and Won Kyung Jeon
Nutrients 2023, 15(14), 3271; https://doi.org/10.3390/nu15143271 - 24 Jul 2023
Cited by 5 | Viewed by 1566
Abstract
Cognitive impairment resulting from chronic cerebral hypoperfusion (CCH) is known as vascular dementia (VaD) and is associated with cerebral atrophy and cholinergic deficiencies. Mumefural (MF), a bioactive compound found in a heated fruit of Prunus mume Sieb. et Zucc, was recently found to [...] Read more.
Cognitive impairment resulting from chronic cerebral hypoperfusion (CCH) is known as vascular dementia (VaD) and is associated with cerebral atrophy and cholinergic deficiencies. Mumefural (MF), a bioactive compound found in a heated fruit of Prunus mume Sieb. et Zucc, was recently found to improve cognitive impairment in a rat CCH model. However, additional evidence is necessary to validate the efficacy of MF administration for treating VaD. Therefore, we evaluated MF effects in a mouse CCH model using unilateral common carotid artery occlusion (UCCAO). Mice were subjected to UCCAO or sham surgery and orally treated with MF daily for 8 weeks. Behavioral tests were used to investigate cognitive function and locomotor activity. Changes in body and brain weights were measured, and levels of hippocampal proteins (brain-derived neurotrophic factor (BDNF), extracellular signal-regulated kinase (ERK), cyclic AMP-response element-binding protein (CREB), and acetylcholinesterase (AChE)) were assessed. Additionally, proteomic analysis was conducted to examine the alterations in protein profiles induced by MF treatment. Our study showed that MF administration significantly improved cognitive deficits. Brain atrophy was attenuated and MF treatment reversed the increase in AChE levels. Furthermore, MF significantly upregulated p-ERK/ERK, p-CREB/CREB, and BDNF levels after UCCAO. Thus, MF treatment ameliorates CCH-induced cognitive impairment by regulating ERK/CREB/BDNF signaling, suggesting that MF is a therapeutic candidate for treating CCH. Full article
(This article belongs to the Section Phytochemicals and Human Health)
Show Figures

Figure 1

Figure 1
<p>Study design. Mice were subjected to sham or UCCAO surgery after 2 weeks of acclimatization. They were orally treated with MF or vehicle (saline) for two months following the recovery period. Behavioral tests were conducted between 9 and 10 weeks after surgery, and all mice were sacrificed 10 weeks after surgery. Brain samples were collected for further analyses. VEH, vehicle; MF, mumefural; NOR, novel object recognition test; NLR, novel location recognition test; OF, open field test.</p>
Full article ">Figure 2
<p>Effects of MF on body weight. All mice were weighed every week. The body weight (<b>A</b>), changes in body weight (<b>B</b>), and body weight gain (<b>C</b>) are shown. The number in parentheses denotes the number of samples. Each point represents mean ± SEM. # <span class="html-italic">p</span> &lt; 0.05 compared with SHAM + VEH; ** <span class="html-italic">p</span> &lt; 0.01 compared with UCCAO + VEH. VEH, vehicle; MF, mumefural.</p>
Full article ">Figure 3
<p>Effects of MF on general behavior and cognition. (<b>A</b>–<b>C</b>) Locomotor behavior was assessed using an open field test. (<b>A</b>) Representative movement tracking of each group in the open field. The inner bold box indicates the center zone of the open field. Total distance that the mice moved (<b>B</b>) and the time spent in the center (<b>C</b>) were examined in the open field. (<b>D</b>,<b>E</b>) Short-term working memory was assessed in a Y-maze test. Total number of arm entries (<b>D</b>) and the calculated rate of spontaneous alternation (<b>E</b>) for 8 min in the Y-maze test. (<b>F</b>–<b>H</b>) Episodic memory was assessed in a novel object/location recognition (NOR/NLR) test. (<b>F</b>) Behavioral procedure for the (NOR/NLR) test. Time spent exploring during the sample phase (<b>G</b>) and recognition index during two test phases of the test (NOR and NLR phases) (<b>H</b>). The numbers shown in the bar group correspond to the number of samples included in the analysis. Data are presented as mean ± SEM. Statistical significance was indicated as follows: # <span class="html-italic">p</span> &lt; 0.05, and ### <span class="html-italic">p</span> &lt; 0.001 when compared with the SHAM + VEH group. * <span class="html-italic">p</span> &lt; 0.05 compared with the UCCAO + VEH group. VEH, vehicle; MF, mumefural; n.s., not significant.</p>
Full article ">Figure 4
<p>Effects of MF on brain weight. (<b>A</b>) Weight of the whole brain and ipsilateral/contralateral ischemic hemisphere in each group. (<b>B</b>) Weight of the cerebellum and hippocampal tissue in the ipsilateral/contralateral sides. (<b>C</b>) Weight ratio of the ipsilateral side to the total in the whole, hippocampus, and cerebellum tissue. The numbers shown in the bar group correspond to the number of samples included in the analysis. Data are presented as mean ± SEM. Statistical significance was indicated as follows: # <span class="html-italic">p</span> &lt; 0.05 and ### <span class="html-italic">p</span> &lt; 0.001 when compared with the SHAM + VEH group; ** <span class="html-italic">p</span> &lt; 0.01 compared with UCCAO + VEH group. VEH, vehicle; MF, mumefural; n.s., not significant.</p>
Full article ">Figure 5
<p>Effects of MF on the glucose transporters (GLUT) and acetylcholinesterase (AChE) levels. (<b>A</b>) Upper: the GLUT1, GLUT2, and GLUT3 levels in the hippocampus. Lower: GLUT quantification. (<b>B</b>) Upper: AChE levels in the hippocampus. Lower: AChE quantification. Bands were normalized to β-actin loading control with the SHAM + VEH group value set as 100. The resulting bar graph is presented as the percentage relative to the SHAM + VEH group. The numbers shown in the bar group correspond to the number of samples included in the analysis. Data are presented as mean ± SEM. Statistical significance was indicated as follows: # <span class="html-italic">p</span> &lt; 0.05 and ## <span class="html-italic">p</span> &lt; 0.01 when compared with the SHAM + VEH group. * <span class="html-italic">p</span> &lt; 0.05 compared with the UCCAO + VEH group. VEH, vehicle; MF, mumefural; n.s., not significant.</p>
Full article ">Figure 6
<p>Effects of MF on the levels of ERK/CREB/BDNF signaling. (<b>A</b>) Left: the BDNF and TrkB levels in the hippocampus. Right: BDNF and p-TrkB/TrkB quantification. (<b>B</b>) Left: ERK and CREB levels in the hippocampus. Right: p-ERK/ERK and p-CREB/CREB quantification. Bands were normalized to β-actin loading control with the SHAM + VEH group value set as 100. The resulting bar graph was presented as the percentage relative to the SHAM + VEH group. The numbers shown in the bar group correspond to the number of samples included in the analysis. Data are presented as mean ± SEM. Statistical significance was indicated as follows: # <span class="html-italic">p</span> &lt; 0.05 and ## <span class="html-italic">p</span> &lt; 0.01 when compared with the SHAM + VEH group. * <span class="html-italic">p</span> &lt; 0.05 and ** <span class="html-italic">p</span> &lt; 0.01 compared with the UCCAO + VEH group. VEH, vehicle; MF, mumefural; n.s., not significant.</p>
Full article ">Figure 7
<p>Effects of MF on protein expression in UCCAO mice. (<b>A</b>) In the experimental group, 1188 proteins showing a difference in the expression level of more than 1.5 times compared to the control group were selected, and clustering analysis was performed according to their expression level pattern. As shown in the scale bar at the bottom, proteins with increased or decreased expression are indicated in red or green, respectively. (<b>B</b>) After isolating the differentially expressed proteins in each sample or between samples (UCCAO-MF), their distributions were compared. (<b>C</b>) Functions of the differentially expressed proteins in the samples were measured in the pathway.</p>
Full article ">
11 pages, 1763 KiB  
Article
Cholesterol Paradox in Older People with Type 2 Diabetes Mellitus Regardless of Lipid-Lowering Drug Use: A Cross-Sectional Cohort Study
by Tzu-Yuan Wang, Wei-Lun Chang, Cheng-Yu Wei, Chung-Hsiang Liu, Ray-Chang Tzeng and Pai-Yi Chiu
Nutrients 2023, 15(14), 3270; https://doi.org/10.3390/nu15143270 - 24 Jul 2023
Cited by 3 | Viewed by 2322
Abstract
Lipid-lowering drugs (LLDs) have protective effects against coronary artery disease (CAD) and cerebrovascular disease (CVD); however, a paradoxical association with cholesterol has been identified in several diseases, such as diabetes, dementia, and atrial fibrillation. We aimed to analyze the association between LLDs and [...] Read more.
Lipid-lowering drugs (LLDs) have protective effects against coronary artery disease (CAD) and cerebrovascular disease (CVD); however, a paradoxical association with cholesterol has been identified in several diseases, such as diabetes, dementia, and atrial fibrillation. We aimed to analyze the association between LLDs and cholesterol levels in older adults with type 2 diabetes mellitus (T2DM). This cross-sectional study enrolled consecutive patients aged ≥50 years from three centers in Taiwan. A multiple logistic regression model was used, and odds ratios (ORs) for different levels of total cholesterol (TC) or low-density-lipoprotein cholesterol (LDL-C) compared with the highest level were adjusted for age, triglyceride level, sex, comorbidities, and medications. Among the 3688 participants, 572 with and 676 without T2DM used LLDs. After adjusting for age and sex, the non-T2DM group demonstrated better medical conditions, cognition, and daily function than the T2DM group, regardless of LLD use. Compared to the highest TC level (≥240 mg/dL), ORs were significantly increased as TC levels decreased. A similar pattern of T2DM prevalence was observed in LDL-C levels. Older people with T2DM demonstrated low cognitive and daily functions. Significantly reduced TC and LDL levels were associated with a higher T2DM prevalence in older adults regardless of LLD use. T2DM was associated with impaired cognitive and daily functioning. A higher prevalence of T2DM in older people with low cholesterol levels raises doubt surrounding cognition and daily function being jeopardized when the “lower is better” strategy is applied for the secondary prevention of CAD or CVD. Full article
Show Figures

Figure 1

Figure 1
<p>Flowchart of participant selection.</p>
Full article ">Figure 2
<p>Percentage frequency of type 2 diabetes mellitus (T2DM) according to total cholesterol (TC) levels of participants with or without using lipid-lowering drugs. Multiple logistic regression analysis was adopted for investigating the contribution of TC levels to prevalence of T2DM. Odds ratios (ORs) for different levels compared to the highest (≥240) were adjusted for age, sex, Montreal Cognitive Assessment, Instrumental Activities of Daily Living, triglycerides, cerebrovascular diseases, hypertension, dyslipidemia, coronary artery diseases, congestive heart failure, atherosclerosis, smoking, exercise, and use of antihypertensives, antiplatelets, and anticoagulants. ns: nonsignificance, <span class="html-italic">p</span> &gt; 0.05.</p>
Full article ">Figure 3
<p>Percentage frequency of T2DM according to low-density-lipoprotein cholesterol (LDL-C) levels of participants with or without using lipid-lowering drugs. Multiple logistic regression analysis was adopted for investigating the contribution of LDL-C levels to prevalence of T2DM. Odds ratios (ORs) for different levels compared to the highest (≥160) were adjusted for age, sex, MoCA, IADL, triglyceride, cerebrovascular diseases, hypertension, dyslipidemia, coronary artery diseases, congestive heart failure, atherosclerosis, smoking, exercise, antihypertensives, lipid-lowering drugs, antiplatelets, and anticoagulants. <span class="html-italic">ns</span>: nonsignificance, <span class="html-italic">p</span> &gt; 0.05.</p>
Full article ">Figure 4
<p>Percentage frequency of T2DM according to total cholesterol (TC) levels among participants in different centers. Multiple logistic regression analysis was adopted for investigating the contribution of TC levels to prevalence of T2DM. Odds ratios (ORs) for different levels compared to the highest (≥240) were adjusted for age, sex, MoCA, IADL, triglyceride, cerebrovascular diseases, hypertension, dyslipidemia, coronary artery diseases, congestive heart failure, atherosclerosis, smoking, exercise, antihypertensives, lipid-lowering drugs, antiplatelets, and anticoagulants. ns: nonsignificance, <span class="html-italic">p</span> &gt; 0.05. SCMH: Show Chwan Memorial Hospital; CBSCMH: Chang Bin Show Chwan Memorial Hospital; TMH: Tainan Municipal Hospital.</p>
Full article ">Figure 5
<p>Percentage frequency of T2DM according to low-density lipoprotein cholesterol (LDL-C) levels among participants in different centers. Multiple logistic regression analysis was adopted for investigating the contribution of TC levels to prevalence of T2DM. Odds ratios (ORs) for different levels compared to the highest (≥160) were adjusted for age, sex, MoCA, IADL, triglyceride, cerebrovascular diseases, hypertension, dyslipidemia, coronary artery diseases, congestive heart failure, atherosclerosis, smoking, exercise, antihypertensives, lipid-lowering drugs, antiplatelets, and anticoagulants. ns: nonsignificance, <span class="html-italic">p</span> &gt; 0.05. SCMH: Show Chwan Memorial Hospital; CBSCMH: Chang Bin Show Chwan Memorial Hospital; TMH: Tainan Municipal Hospital.</p>
Full article ">
18 pages, 3823 KiB  
Article
Food Order and Timing Effects on Glycaemic and Satiety Responses to Partial Fruit-for-Cereal Carbohydrate Exchange: A Randomized Cross-Over Human Intervention Study
by Suman Mishra, Andrew McLaughlin and John Monro
Nutrients 2023, 15(14), 3269; https://doi.org/10.3390/nu15143269 - 24 Jul 2023
Cited by 4 | Viewed by 1968
Abstract
Postprandial glycaemic response amplitude plays a critical role in diabetic complications, but is subject to food order and temporal separation within a meal. Effects of partial fruit-for-cereal carbohydrate exchange on glycaemic and appetite responses, as affected by food order and separation, were examined [...] Read more.
Postprandial glycaemic response amplitude plays a critical role in diabetic complications, but is subject to food order and temporal separation within a meal. Effects of partial fruit-for-cereal carbohydrate exchange on glycaemic and appetite responses, as affected by food order and separation, were examined using kiwifruit (KF) and wheaten breakfast cereal biscuit (WB). In a randomized cross-over intervention study, 20 subjects ingested 51.7 g of available carbohydrate as 74 g WB alone, or as 200 g KF and 37 g WB, each delivering 25.85 g of available carbohydrate. The 200 g KF was partially exchanged for 37 g of WB, at 90 min and 30 min before, at the same time as, or 30 min after, ingesting WB. Incremental satiety responses were derived from appetite scores measured using a visual analogue scale, and capillary blood glucose responses were monitored. In all exchanges, KF reduced the glycaemic response (iAUC) by 20–30% with no loss of total satiation. The incremental glycaemic and satiety responses to food ingestion followed each other closely. Glycaemic response amplitudes were reduced almost 50% compared with 74 g WB when KF ingestion preceded WB ingestion by 30 min, and less when the KF was ingested with or 30 min after the cereal. The results suggest that fruit most effectively suppresses the digestion of cereal carbohydrates if ingested long enough before the cereal to prevent overlap of the glycaemic responses, but close enough for fruit components that impede carbohydrate digestion or uptake to interact with the ingested cereal in the gut. Ethics approval was obtained from the Human and Disabilities Ethics Committee (HDEC) of the New Zealand Ministry of Health. The trial was registered with the Australian New Zealand Clinical Trials Registry (Trial ID: ACTRN12615000744550). Full article
(This article belongs to the Special Issue High Carbohydrate Diet and Diabetes in Human Health)
Show Figures

Figure 1

Figure 1
<p>Blood glucose concentrations with time after ingesting flaked wheat biscuit (WB) alone or partially substituted by kiwifruit (KF). In all treatments, total available carbohydrate intake was 51.7 g, and in treatments in which KF was partially exchanged for WB, the WB and KF components each contributed 25.85 g. The dashed line is the Time 0 baseline. The treatments are described in <a href="#nutrients-15-03269-t001" class="html-table">Table 1</a>. Means ± sem.</p>
Full article ">Figure 2
<p>Total incremental area under the blood glucose response curves in response to kiwifruit (KF) and flaked wheat biscuit. Responses to meal types differed significantly (<span class="html-italic">p</span> &lt; 0.001). Meals are summarized in <a href="#nutrients-15-03269-t001" class="html-table">Table 1</a>. LSD = least significant difference (unfilled bar in graph). Means ± sem. Means with a letter in common do not differ significantly.</p>
Full article ">Figure 3
<p>Mean peak glucose concentration increase over baseline (response amplitude) induced by kiwifruit (KF) and flaked wheat biscuit (WB) alone and in various combinations. Where a treatment caused two glycaemic response peaks, they are labelled (a) and (b). Peak blood glucose response differed significantly between meals (<span class="html-italic">p</span> &lt; 0.001). LSD = least significant difference (5%) (unfilled bar in graph). Means ± sem. Means with a letter in common do not differ significantly. Values and % change from WB74 are given in <a href="#app1-nutrients-15-03269" class="html-app">Appendix A</a> <a href="#nutrients-15-03269-t0A1" class="html-table">Table A1</a>.</p>
Full article ">Figure 4
<p>Changes in satiety with time in response to the ingestion of kiwifruit (KF) and flaked wheat biscuit (WB) in the various combinations described in <a href="#nutrients-15-03269-t001" class="html-table">Table 1</a>. The times of ingestion of the KF and WB components of the meals are shown along the X-axis. Means ± sem.</p>
Full article ">Figure 5
<p>Area under the satiety curves (<a href="#nutrients-15-03269-f004" class="html-fig">Figure 4</a>) for the treatments described in <a href="#nutrients-15-03269-t001" class="html-table">Table 1</a>. Mean incremental satiety did not differ among meal types (<span class="html-italic">p</span> = 0.65). Mean ± sem. The values are given in <a href="#nutrients-15-03269-t0A1" class="html-table">Table A1</a>.</p>
Full article ">Figure A1
<p>CONSORT diagram for the study of effects of order and temporal separation of fruit and cereal in a meal on glycaemic response and appetite.</p>
Full article ">Figure A2
<p>Changes in the four dimensions of appetite (all in grey) and their mean (bold black) plotted against time. The treatments are described in <a href="#nutrients-15-03269-t001" class="html-table">Table 1</a>. For clarity, only the mean of the sem for all points and dimensions in a treatment is shown, and the four dimensions of appetite are so closely superimposed and similar in profile that there was no benefit in identifying them separately.</p>
Full article ">Figure A3
<p>Correspondence between increments in blood glucose concentration (dotted line, mmol/L) and satiety (solid line, cm). Means ± sem.</p>
Full article ">Figure A4
<p>Glycaemic response to kiwifruit (KF) and wheat biscuit (WB), with KF ingested 30 min before wheat biscuit (WB) (treatment KF-30/WB; bold, black markers), at the same time as (KF/WB), or 30 min after WB (WB/KF+30), compared with wheat biscuit alone (WB74). All meals delivered 51.7 g of available carbohydrate. Order and timing have substantially reduced response amplitude in the KF-30/WB treatment. Treatments are summarized in <a href="#nutrients-15-03269-t001" class="html-table">Table 1</a>. Means ± sem.</p>
Full article ">Figure A5
<p>Blood glucose response to WB alone at an intake of 51.7 g of carbohydrate (WB74), to 37 g of wheaten biscuit (WB), to 200 g of kiwifruit (KF200), each delivering 25.85 g available carbohydrate, to the sum of the two (KF200+WB; theoretical), and to 200 g KF ingested 30 min before 37 g WB (KF-30/WB). WB starts at 30 min to coincide with its ingestion in the KF-30/WB treatment. KF has suppressed the response to WB in the KF-30/WB treatment compared with the response to WB alone. Treatments are summarized in <a href="#nutrients-15-03269-t001" class="html-table">Table 1</a>. Means ± sem.</p>
Full article ">
14 pages, 475 KiB  
Article
Factors Associated with Dietary Habit Changes in Korean Stomach Cancer Survivors after Cancer Treatment
by Junhee Park, Jiyoung Kim, Dong Wook Shin, Jinyoung Shin, Belong Cho and Yun-Mi Song
Nutrients 2023, 15(14), 3268; https://doi.org/10.3390/nu15143268 - 24 Jul 2023
Cited by 1 | Viewed by 2197
Abstract
The current nutritional guidelines for stomach cancer survivors (SCSs) mainly focus on the influence of the surgical resection of the stomach, with limited guidance regarding a wider range of food options. We aimed to investigate the factors associated with healthier dietary changes in [...] Read more.
The current nutritional guidelines for stomach cancer survivors (SCSs) mainly focus on the influence of the surgical resection of the stomach, with limited guidance regarding a wider range of food options. We aimed to investigate the factors associated with healthier dietary changes in Korean adult SCSs. This cross-sectional study assessed dietary pattern changes after cancer treatment for 11 food categories, using a self-administered questionnaire. A ‘healthier dietary change’ was operationally defined as a reduced consumption of red and processed meat, grains, salt, and burnt food, and an increased consumption of poultry, fish, vegetables, fruits, legumes, and dairy products. Among a total of 624 SCSs, approximately 60% of participants reported dietary changes in a healthier direction in three or more food categories, while 9.1% reported no changes. There was no significant difference in dietary habit changes between surgery types. Multivariable adjusted analysis showed that elderly and long-term survivors were inversely associated with a healthier dietary change. SCSs with a higher level of educational achievement and income were more likely to make healthier changes in their intake of processed meat, vegetables, fruits, burnt food, or salt. SCSs with higher levels of fear of cancer recurrence, anxiety, or depression were more likely to follow healthier dietary changes regarding fish, meat, fruits, grains, or burnt food. Change in dietary pattern varied across different food items, and was associated with various characteristics of SCSs. It is crucial to repeatedly provide SCSs with information about healthier dietary patterns, considering their sociodemographic, clinical, and psychological characteristics. Full article
(This article belongs to the Section Nutritional Policies and Education for Health Promotion)
Show Figures

Figure 1

Figure 1
<p>Dietary habit changes after cancer diagnosis in 624 Korean stomach cancer survivors.</p>
Full article ">
14 pages, 2866 KiB  
Article
Blood Microbiota Profile Is Associated with the Responsiveness of Postprandial Lipemia to Platycodi radix Beverage: A Randomized Controlled Trial in Healthy Subjects
by Seunghee Kang, Inhye Lee, Soo-yeon Park, Ji Yeon Kim, Youjin Kim, Jeong-Sook Choe and Oran Kwon
Nutrients 2023, 15(14), 3267; https://doi.org/10.3390/nu15143267 - 24 Jul 2023
Cited by 1 | Viewed by 1565
Abstract
Prolonged postprandial hyperlipidemia may cause the development of cardiovascular diseases. This study explored whether postprandial triglyceride-rich lipoprotein (TRL) clearance responsiveness to Platycodi radix beverage (PR) is associated with changes in blood microbiota profiles. We conducted an 8-week randomized controlled clinical trial involving normolipidemic [...] Read more.
Prolonged postprandial hyperlipidemia may cause the development of cardiovascular diseases. This study explored whether postprandial triglyceride-rich lipoprotein (TRL) clearance responsiveness to Platycodi radix beverage (PR) is associated with changes in blood microbiota profiles. We conducted an 8-week randomized controlled clinical trial involving normolipidemic adults with low fruit and vegetable intakes. Participants underwent an oral fat tolerance test and 16S amplicon sequencing analysis of blood microbiota. Using the Qualitative Interaction Trees, we identified responders as those with higher baseline dietary fat intake (>38.5 g/day) and lipoprotein lipase levels (>150.6 ng/mL), who showed significant reductions in AUC for triglyceride (TG) and chylomicron-TG after the oral fat tolerance test. The LEfSe analysis showed differentially abundant blood microbiota between responders and non-responders. A penalized logistic regression algorithm was employed to predict the responsiveness to intervention on the TRL clearance based on the background characteristics, including the blood microbiome. Our findings suggest that PR intake can modulate postprandial TRL clearance in adults consuming higher fat intake over 38.5 g/day and low fruit and vegetable intake through shared links to systemic microbial signatures. Full article
Show Figures

Figure 1

Figure 1
<p>The HPLC chromatogram and chemical structure of platycoside E from <span class="html-italic">Platycodi radix</span> beverage. HPLC, high-performance liquid chromatography.</p>
Full article ">Figure 2
<p>CONSORT diagram for the flow of all participants from recruitment to the end of the study.</p>
Full article ">Figure 3
<p>Partitioning tree and descriptive statistics of QUINT. (<b>a</b>) Partitioning tree with LPL mass (split point 150.61 ng/mL) and dietary fat intake (split point 38.5 g/day) as moderator variables. Leaf 1 and 2 (orange) represent non-responders, while leaf 3 (green) represents responders to the reduction of TG AUC after 8-week PR intake. (<b>b</b>) Descriptive statistics for TG and CM-TG AUCs, demonstrating that responders (green) benefit from PR treatment (blue dot) in contrast to placebo treatment (white dot). A linear mixed-effect model for treatment × period interaction terms was used to evaluate the <span class="html-italic">p</span>-values, and statistical significance is denoted by * (<span class="html-italic">p</span> &lt; 0.05). The box and thick bar show the interquartile range and median, respectively, with the mean depicted by the red diamond. AUC, area under the curve; CM, chylomicron; LPL, lipoprotein lipase; PR, <span class="html-italic">Platycodi radix</span> beverage; QUINT, qualitative interaction trees; TG, triglyceride.</p>
Full article ">Figure 4
<p>Differential abundance of blood microbiota between responder and non-responder groups after the 8-week intervention. (<b>a</b>) Pie chart representing dominant phyla composition (%) in plasma sample of all subjects. (<b>b</b>) LDA score histogram and LEfSe cladogram for individual taxa, highlighting the taxonomic differences between responders and non-responders. The orange and green highlighted taxa and nodes were significantly more abundant in the responder and non-responder groups, respectively. (<b>c</b>) Spearman’s correlation between the differential taxa abundance and clinical outcomes in each responder (green) and non-responder groups (orange). LDA, linear discriminant analysis; LEfSe, LDA effect size.</p>
Full article ">Figure 4 Cont.
<p>Differential abundance of blood microbiota between responder and non-responder groups after the 8-week intervention. (<b>a</b>) Pie chart representing dominant phyla composition (%) in plasma sample of all subjects. (<b>b</b>) LDA score histogram and LEfSe cladogram for individual taxa, highlighting the taxonomic differences between responders and non-responders. The orange and green highlighted taxa and nodes were significantly more abundant in the responder and non-responder groups, respectively. (<b>c</b>) Spearman’s correlation between the differential taxa abundance and clinical outcomes in each responder (green) and non-responder groups (orange). LDA, linear discriminant analysis; LEfSe, LDA effect size.</p>
Full article ">Figure 5
<p>Background characteristics for predicting responsiveness of postprandial TRL clearance to PR intervention. (<b>a</b>) Visualization of the coefficient profiles for fitting the LASSO penalized logistic regression model. (<b>b</b>) ROC analysis of the prediction model. The diagonal line represents the reference line of 0.5. The light blue area represents the 95% confidence interval of the ROC curve estimate. (<b>c</b>) Calibration of the prediction model. A Student’s <span class="html-italic">t</span>-test determined the <span class="html-italic">p</span>-value. LASSO, least absolute shrinkage and selection operator; PR, <span class="html-italic">Platycodi radix</span> beverage; ROC, receiver operating characteristic; TRL, triglyceride-rich lipoprotein.</p>
Full article ">
41 pages, 7730 KiB  
Review
Protective Effects of Medicinal Plant-Based Foods against Diabetes: A Review on Pharmacology, Phytochemistry, and Molecular Mechanisms
by Prawej Ansari, Jannatul F. Samia, Joyeeta T. Khan, Musfiqur R. Rafi, Md. Sifat Rahman, Akib B. Rahman, Yasser H. A. Abdel-Wahab and Veronique Seidel
Nutrients 2023, 15(14), 3266; https://doi.org/10.3390/nu15143266 - 24 Jul 2023
Cited by 5 | Viewed by 5405
Abstract
Diabetes mellitus (DM) comprises a range of metabolic disorders characterized by high blood glucose levels caused by defects in insulin release, insulin action, or both. DM is a widespread condition that affects a substantial portion of the global population, causing high morbidity and [...] Read more.
Diabetes mellitus (DM) comprises a range of metabolic disorders characterized by high blood glucose levels caused by defects in insulin release, insulin action, or both. DM is a widespread condition that affects a substantial portion of the global population, causing high morbidity and mortality rates. The prevalence of this major public health crisis is predicted to increase in the forthcoming years. Although several drugs are available to manage DM, these are associated with adverse side effects, which limits their use. In underdeveloped countries, where such drugs are often costly and not widely available, many people continue to rely on alternative traditional medicine, including medicinal plants. The latter serves as a source of primary healthcare and plant-based foods in many low- and middle-income countries. Interestingly, many of the phytochemicals they contain have been demonstrated to possess antidiabetic activity such as lowering blood glucose levels, stimulating insulin secretion, and alleviating diabetic complications. Therefore, such plants may provide protective effects that could be used in the management of DM. The purpose of this article was to review the medicinal plant-based foods traditionally used for the management of DM, including their therapeutic effects, pharmacologically active phytoconstituents, and antidiabetic mode of action at the molecular level. It also presents future avenues for research in this field. Full article
(This article belongs to the Special Issue Nutrition, Dietary Intervention and Glycemic Control in Diabetes)
Show Figures

Figure 1

Figure 1
<p>Antidiabetic effects of 20 medicinal plant-based foods on body weight and cells and organs (pancreas, blood vessels, intestine, liver, skeletal muscle, adipose tissue, and β-cells) associated with diabetes. Medicinal plants decrease body weight and body fat by initiating lipolysis; decrease glucose production by inhibiting gluconeogenesis and glycolysis in liver; decrease blood glucose levels by binding to insulin receptor substrate (IRS-1); decrease blood lipid levels by inhibiting HMG-CoA reductase; promote glucose uptake and enhance GLUT-4 expression by activating the AMPK pathway in skeletal muscles; inhibit α-glucosidase and α-amylase enzymes and decrease glucose absorption in the small intestine; improve insulin sensitivity/secretion, improve β-cell function, and lower insulin resistance by activating PPAR-γ expression in the pancreas; decrease IL-6/TNF-α and enhance glucose uptake by activating AMPK in adipose tissues; decrease ROS/free radicals/AGEs, oxidative stress, and inflammatory cytokines in β-cells via antioxidant/radical scavenging activity.</p>
Full article ">
19 pages, 1286 KiB  
Review
Liposomal Epigallocatechin-3-Gallate for the Treatment of Intestinal Dysbiosis in Children with Autism Spectrum Disorder: A Comprehensive Review
by Jose Enrique de la Rubia Ortí, Costanza Moneti, Pilar Serrano-Ballesteros, Gloria Castellano, Raquel Bayona-Babiloni, Ana Belén Carriquí-Suárez, María Motos-Muñoz, Belén Proaño and María Benlloch
Nutrients 2023, 15(14), 3265; https://doi.org/10.3390/nu15143265 - 24 Jul 2023
Cited by 2 | Viewed by 2766
Abstract
Autism Spectrum Disorder (ASD) is characterized by varying degrees of difficulty in social interaction and communication. These deficits are often associated with gastrointestinal symptoms, indicating alterations in both intestinal microbiota composition and metabolic activities. The intestinal microbiota influences the function and development of [...] Read more.
Autism Spectrum Disorder (ASD) is characterized by varying degrees of difficulty in social interaction and communication. These deficits are often associated with gastrointestinal symptoms, indicating alterations in both intestinal microbiota composition and metabolic activities. The intestinal microbiota influences the function and development of the nervous system. In individuals with ASD, there is an increase in bacterial genera such as Clostridium, as well as species involved in the synthesis of branched-chain amino acids (BCAA) like Prevotella copri. Conversely, decreased amounts of Akkermansia muciniphila and Bifidobacterium spp. are observed. Epigallocatechin-3-gallate (EGCG) is one of the polyphenols with the greatest beneficial activity on microbial growth, and its consumption is associated with reduced psychological distress. Therefore, the objective of this review is to analyze how EGCG and its metabolites can improve the microbial dysbiosis present in ASD and its impact on the pathology. The analysis reveals that EGCG inhibits the growth of pathogenic bacteria like Clostridium perfringens and Clostridium difficile. Moreover, it increases the abundance of Bifidobacterium spp. and Akkermansia spp. As a result, EGCG demonstrates efficacy in increasing the production of metabolites involved in maintaining epithelial integrity and improving brain function. This identifies EGCG as highly promising for complementary treatment in ASD. Full article
(This article belongs to the Section Nutrition and Metabolism)
Show Figures

Figure 1

Figure 1
<p>EGCG impact in patients with ASD. Alterations in the intestinal microbiota in ASD and its implications on the left; EGCG impact on both the intestinal microbiota and variables directly related to the microbiota such as metabolites, inflammation, and oxidative stress on the right. (↑) means increase and (↓) means decrease.</p>
Full article ">Figure 2
<p>Mechanism of EGCG metabolite generation in the intestinal microbiota. Reciprocal interactions between EGCG and human gut microbiota in vitro [<a href="#B65-nutrients-15-03265" class="html-bibr">65</a>].</p>
Full article ">
23 pages, 2466 KiB  
Review
How Do Minerals, Vitamins, and Intestinal Microbiota Affect the Development and Progression of Heart Disease in Adult and Pediatric Patients?
by Peet Brecht, James Curtis Dring, Felipe Yanez, Agnieszka Styczeń, Paulina Mertowska, Sebastian Mertowski and Ewelina Grywalska
Nutrients 2023, 15(14), 3264; https://doi.org/10.3390/nu15143264 - 24 Jul 2023
Cited by 3 | Viewed by 5317
Abstract
Cardiovascular diseases (CVDs) are the leading cause of death worldwide, far ahead of cancer. Epidemiological data emphasize the participation of many risk factors that increase the incidence of CVDs, including genetic factors, age, and sex, but also lifestyle, mainly nutritional irregularities and, connected [...] Read more.
Cardiovascular diseases (CVDs) are the leading cause of death worldwide, far ahead of cancer. Epidemiological data emphasize the participation of many risk factors that increase the incidence of CVDs, including genetic factors, age, and sex, but also lifestyle, mainly nutritional irregularities and, connected with them, overweight and obesity, as well as metabolic diseases. Despite the importance of cardiovascular problems in the whole society, the principles of prevention of CVDs are not widely disseminated, especially among the youngest. As a result, nutritional neglect, growing from childhood and adolescence, translates into the occurrence of numerous disease entities, including CVDs, in adult life. This review aimed to draw attention to the role of selected minerals and vitamins in health and the development and progression of CVDs in adults and children. Particular attention was paid to the effects of deficiency and toxicity of the analyzed compounds in the context of the cardiovascular system and to the role of intestinal microorganisms, which by interacting with nutrients, may contribute to the development of cardiovascular disorders. We hope this article will draw the attention of society and the medical community to emphasize promoting healthy eating and proper eating habits in children and adults, translating into increased awareness and a reduced risk of CVD. Full article
(This article belongs to the Special Issue Diet and Cardiovascular Risk: Novel Insights)
Show Figures

Figure 1

Figure 1
<p>Functions of nutrients in the human body based on [<a href="#B32-nutrients-15-03264" class="html-bibr">32</a>].</p>
Full article ">Figure 2
<p>Classification of nutrients based on [<a href="#B33-nutrients-15-03264" class="html-bibr">33</a>,<a href="#B34-nutrients-15-03264" class="html-bibr">34</a>].</p>
Full article ">Figure 3
<p>The role of selected minerals in maintaining the health of the human body based on [<a href="#B29-nutrients-15-03264" class="html-bibr">29</a>,<a href="#B35-nutrients-15-03264" class="html-bibr">35</a>].</p>
Full article ">Figure 4
<p>The influence of selected vitamins and minerals on the human intestinal microflora based on [<a href="#B196-nutrients-15-03264" class="html-bibr">196</a>,<a href="#B197-nutrients-15-03264" class="html-bibr">197</a>,<a href="#B198-nutrients-15-03264" class="html-bibr">198</a>,<a href="#B199-nutrients-15-03264" class="html-bibr">199</a>,<a href="#B200-nutrients-15-03264" class="html-bibr">200</a>,<a href="#B201-nutrients-15-03264" class="html-bibr">201</a>,<a href="#B202-nutrients-15-03264" class="html-bibr">202</a>,<a href="#B203-nutrients-15-03264" class="html-bibr">203</a>,<a href="#B204-nutrients-15-03264" class="html-bibr">204</a>,<a href="#B205-nutrients-15-03264" class="html-bibr">205</a>].</p>
Full article ">Figure 5
<p>Interactions between the gut microbiome and CVD based on [<a href="#B206-nutrients-15-03264" class="html-bibr">206</a>,<a href="#B207-nutrients-15-03264" class="html-bibr">207</a>,<a href="#B208-nutrients-15-03264" class="html-bibr">208</a>,<a href="#B211-nutrients-15-03264" class="html-bibr">211</a>,<a href="#B212-nutrients-15-03264" class="html-bibr">212</a>,<a href="#B213-nutrients-15-03264" class="html-bibr">213</a>,<a href="#B214-nutrients-15-03264" class="html-bibr">214</a>,<a href="#B215-nutrients-15-03264" class="html-bibr">215</a>,<a href="#B216-nutrients-15-03264" class="html-bibr">216</a>].</p>
Full article ">
16 pages, 11837 KiB  
Article
Dietary Folic Acid Supplementation Attenuates Maternal High-Fat Diet-Induced Fetal Intrauterine Growth Retarded via Ameliorating Placental Inflammation and Oxidative Stress in Rats
by Huaqi Zhang, Xinyu Zhang, Yutong Wang, Xuenuo Zhao, Li Zhang, Jing Li, Yabin Zhang, Peng Wang and Hui Liang
Nutrients 2023, 15(14), 3263; https://doi.org/10.3390/nu15143263 - 24 Jul 2023
Cited by 4 | Viewed by 1802
Abstract
The placenta is particularly susceptible to inflammation and oxidative stress, leading to placental vascular dysfunction and placental insufficiency, which is associated with fetal intrauterine growth restriction (IUGR). It is unknown whether folic acid (FA) supplementation can alleviate high-fat diet-induced IUGR in rats by [...] Read more.
The placenta is particularly susceptible to inflammation and oxidative stress, leading to placental vascular dysfunction and placental insufficiency, which is associated with fetal intrauterine growth restriction (IUGR). It is unknown whether folic acid (FA) supplementation can alleviate high-fat diet-induced IUGR in rats by improving placental function. In this study, pregnant rats were randomized into one of four diet-based groups: (1) control diet (CON), (2) control diet supplemented with FA, (3) high-fat diet (HFD), and (4) high-fat diet supplemented with FA (HFD + FA). Dams were sacrificed at gestation day 18.5 (GD18.5). The results indicated that dietary FA supplementation normalized a maternal HFD-induced decrease in fetal weight. The decrease in placental efficiency, labyrinth zone (LZ) area, blood sinusoid area, vascular density, and the levels of angiogenesis factors induced by a maternal HFD were alleviated by the addition of FA, suggesting that FA supplementation can alleviate placental vascular dysplasia. Furthermore, FA supplementation increased the protein expressions of SIRT1, inhibited NF-κB transcriptional activation, attenuated the levels of NF-κB/downstream pro-inflammatory cytokines, induced Nrf2 activation, and increased downstream target protein expression. In conclusion, we found that dietary FA supplementation during pregnancy could improve maternal HFD-induced IUGR by alleviating placental inflammation and oxidative stress, which may be associated with the regulation of SIRT1 and its mediated NF-κB and Nrf2 signaling pathways. Full article
(This article belongs to the Section Pediatric Nutrition)
Show Figures

Figure 1

Figure 1
<p>Design of the study. (<b>A</b>) Grouping of the study. (<b>B</b>) Flow chart of the study.</p>
Full article ">Figure 2
<p>Maternal body weight, liver weight, and adipose tissue weight. (<b>A</b>) Maternal body weight. (<b>B</b>) Rate of body weight gain. (<b>C</b>) Liver weight. (<b>D</b>) Liver index. (<b>E</b>) Intraperitoneal fat weight. (<b>F</b>) Intraperitoneal fat index. Data are represented as means ± SD (<span class="html-italic">n</span> = 8). A significant difference (<span class="html-italic">p</span> &lt; 0.05) is denoted by different letters: a vs. the CON group; b vs. the FA group; c vs. the HFD group.</p>
Full article ">Figure 3
<p>Maternal serum biochemical index. (<b>A</b>) Serum TG; (<b>B</b>) Serum TC; (<b>C</b>) Serum HDL-C; (<b>D</b>) Serum LDL-C; (<b>E</b>) Serum glucose; (<b>F</b>) Serum insulin; (<b>G</b>) HOMA-IR; data are represented as means ± SD (<span class="html-italic">n</span> = 8). A significant difference (<span class="html-italic">p</span> &lt; 0.05) is denoted by different letters: a vs. the CON group; b vs. the FA group; c vs. the HFD group.</p>
Full article ">Figure 4
<p>Fetal and placental development. (<b>A</b>) Litter size. (<b>B</b>) Fetal weight. (<b>C</b>) Fetal crown-rump length. (<b>D</b>) Placental weight. (<b>E</b>) Placental diameter. (<b>F</b>) Placental efficiency (fetal/placental weight ratio). (<b>G</b>) Placental TG. (<b>H</b>) Placental TC. (<b>I</b>) The morphology of the placentas; scale bar 1 mm; LZ, labyrinth zone; JZ, junction zone. (<b>J</b>) Placenta area. (<b>K</b>) LZ area. (<b>L</b>) JZ area. Data are represented as means ± SD (<span class="html-italic">n</span> = 8). A significant difference (<span class="html-italic">p</span> &lt; 0.05) is denoted by different letters: a vs. the CON group; b vs. the FA group; c vs. the HFD group.</p>
Full article ">Figure 5
<p>Morphological observation of the placenta. (<b>A</b>) Placental cross-sections stained with H&amp;E. (<b>B</b>) Blood sinusoids area percentage. (<b>C</b>) Immuno-histochemical analysis for CD31 staining (brown). (<b>D</b>) The IOD of CD31 in LZ. Data are represented as means ± SD (<span class="html-italic">n</span> = 8). A significant difference (<span class="html-italic">p</span> &lt; 0.05) is denoted by different letters: a vs. the CON group; b vs. the FA group; c vs. the HFD group.</p>
Full article ">Figure 6
<p>Functional parameters of the placenta. (<b>A</b>) Placental PLGF. (<b>B</b>) Placental sFlt-1. (<b>C</b>) Placental sFlt-1/PLGF ratio. (<b>D</b>) Placental VEGF-A. (<b>E</b>) Placental VEGFR2. (<b>F</b>) Placental VCAM-1. Data are represented as means ± SD (<span class="html-italic">n</span> = 8). A significant difference (<span class="html-italic">p</span> &lt; 0.05) is denoted by different letters: a vs. the CON group; b vs. the FA group; c vs. the HFD group.</p>
Full article ">Figure 7
<p>Inflammatory cytokine and oxidative stress parameter levels of the placentas. (<b>A</b>) Placental IL-1β. (<b>B</b>) Placental IL-6. (<b>C</b>) Placental TNF-α. (<b>D</b>) Placental COX-2. (<b>E</b>) Placental MDA. (<b>F</b>) Placental SOD. (<b>G</b>) Placental GSH-Px. (<b>H</b>) Placental CAT. Data are represented as means ± SD (<span class="html-italic">n</span> = 8). A significant difference (<span class="html-italic">p</span> &lt; 0.05) is denoted by different letters: a vs. the CON group; b vs. the FA group; c vs. the HFD group.</p>
Full article ">Figure 8
<p>SIRT1/NF-κB and SIRT1/Nrf2 signaling pathway in the placenta. (<b>A</b>) The protein expression of SIRT1. (<b>B</b>) The protein expression of the SIRT1/NF-κB signaling pathway. (<b>C</b>) The protein expression of the SIRT1/ Nrf2 signaling pathway. Data are represented as means ± SD (<span class="html-italic">n</span> = 3). A significant difference (<span class="html-italic">p</span> &lt; 0.05) is denoted by different letters: a vs. the CON group; b vs. the FA group; c vs. the HFD group.</p>
Full article ">
11 pages, 746 KiB  
Article
Health Risk and Underweight
by Ulrich Cuntz, Norbert Quadflieg and Ulrich Voderholzer
Nutrients 2023, 15(14), 3262; https://doi.org/10.3390/nu15143262 - 24 Jul 2023
Cited by 1 | Viewed by 2589
Abstract
Anorexia nervosa is associated with a significant risk of morbidity and mortality. In clinical practice, health risk is assessed and estimated using routinely collected laboratory data. This study will develop a risk score using clinically relevant laboratory parameters. The related question is how [...] Read more.
Anorexia nervosa is associated with a significant risk of morbidity and mortality. In clinical practice, health risk is assessed and estimated using routinely collected laboratory data. This study will develop a risk score using clinically relevant laboratory parameters. The related question is how to estimate the health risk associated with underweight using body weight, height and age. Methods: We used routinely collected laboratory parameters from a total of 4087 patients. The risk score was calculated on the basis of electrolytes, blood count, transaminases and LDH. The nine parameters used were summed as zlog-transformed values. Where appropriate, the scales were inverted so that high values represented higher risk. For statistical prediction of the risk score, weight/height and age reference values from the WHO, the CDC (Center of Disease Control) and representative studies of German children and adults (KIGGS and NNS) were used. Results: The score calculated from nine laboratory parameters already shows a convincing relationship with BMI. Among the weight measures used for height and age, the z-score from the CDC reference population emerged as the best estimate, explaining 34% of the variance in health risk measured by the laboratory score. The percentile rank for each age-specific median weight from the KIGGS/NNS still explained more than 31% of the variance. In contrast, percentiles explained less variance than BMI without age correction. Conclusions: The score we used from routine laboratory parameters appears to be an appropriate measure for assessing the health risk associated with underweight, as measured by the quality of the association with BMI. For estimating health risk based on weight, height and age alone, z-scores and percentages of age-specific median weight, as opposed to percentiles, are appropriate parameters. However, the study also shows that existing age-specific BMI reference values do not represent risk optimally. Improved statistical estimation methods would be desirable. Full article
(This article belongs to the Special Issue Food Intake Disorders: Updates, Trends, and Challenges)
Show Figures

Figure 1

Figure 1
<p>Correlation of health risk (based on laboratory values) with BMI at admission (independent of the respective age). Error bars represent the 95% confidence interval. Patients with a BMI below 9 were subsumed into those with a BMI of 9.</p>
Full article ">Figure 2
<p>Correlation of health risk (based on laboratory values) with the z-score CDC. The error bars represent the 95% confidence interval. Patients with a z-score below −13 were combined, and those with a z-score of −11 and −12 were combined to achieve sufficient cell occupancy.</p>
Full article ">
13 pages, 1587 KiB  
Systematic Review
Adherence to the DASH Diet and Risk of Hypertension: A Systematic Review and Meta-Analysis
by Xenophon Theodoridis, Michail Chourdakis, Lydia Chrysoula, Violeta Chroni, Ilias Tirodimos, Konstantina Dipla, Eugenia Gkaliagkousi and Areti Triantafyllou
Nutrients 2023, 15(14), 3261; https://doi.org/10.3390/nu15143261 - 24 Jul 2023
Cited by 27 | Viewed by 9126
Abstract
The aim of this study was to assess the effect of the level of adherence to the DASH diet on hypertension risk by conducting a systematic review and meta-analysis. A systematic literature search was performed. Two independent investigators performed the study selection, data [...] Read more.
The aim of this study was to assess the effect of the level of adherence to the DASH diet on hypertension risk by conducting a systematic review and meta-analysis. A systematic literature search was performed. Two independent investigators performed the study selection, data abstraction, and assessment of the included studies. The meta-analysis was performed separately with the adjusted hazard (HR) or incident rate ratios (IRR) and the odds ratios (OR) of the highest compared to the lowest DASH diet adherence scores using a random effects model. A total of 12 studies were included in the qualitative and quantitative synthesis. When cohort studies reporting HR were pooled together, high adherence to the DASH diet was associated with a lower risk of hypertension (HR: 0.81, 95% CI 0.73–0.90, I2 = 69%, PI 0.61–1.08) compared to the low adherence. When cross-sectional studies reporting OR were combined, high adherence to the DASH diet was also related to a lower risk of hypertension (OR: 0.80, 95% CI 0.70–0.91, I2 = 81%, PI 0.46–1.39). The findings suggest that high adherence to the DASH diet has a positive effect on reducing hypertension risk compared to low adherence. These data strengthen and are in line with all hypertension guidelines, indicating that lifestyle changes should start early even in populations with normal blood pressure. Full article
(This article belongs to the Special Issue Diet Quality and Risk of Cardiometabolic and Diabetes)
Show Figures

Figure 1

Figure 1
<p>Flow diagram of the eligibility process.</p>
Full article ">Figure 2
<p>Forest plot for the hypertension risk when cohort studies were pooled together. Bai et al., 2017 [<a href="#B22-nutrients-15-03261" class="html-bibr">22</a>], Camões et al., 2010 [<a href="#B23-nutrients-15-03261" class="html-bibr">23</a>], Folsom et al., 2007 [<a href="#B24-nutrients-15-03261" class="html-bibr">24</a>], Francisco et al., 2020 [<a href="#B25-nutrients-15-03261" class="html-bibr">25</a>], Jiang et al., 2015 [<a href="#B14-nutrients-15-03261" class="html-bibr">14</a>], Lelong et al., 2017 [<a href="#B26-nutrients-15-03261" class="html-bibr">26</a>], Li et al., 2016 [<a href="#B27-nutrients-15-03261" class="html-bibr">27</a>], Schulze et al., 2003 [<a href="#B28-nutrients-15-03261" class="html-bibr">28</a>], Toledo et al., 2010 [<a href="#B29-nutrients-15-03261" class="html-bibr">29</a>].</p>
Full article ">Figure 3
<p>Forest plot for the hypertension risk when cross-sectional studies were pooled together. Cherfan et al., 2019 (M) [<a href="#B30-nutrients-15-03261" class="html-bibr">30</a>], Cherfan et al., 2019 (W) [<a href="#B30-nutrients-15-03261" class="html-bibr">30</a>], Kanauchi &amp; Kanauchi, 2015 [<a href="#B15-nutrients-15-03261" class="html-bibr">15</a>], Yang et al., 2022 [<a href="#B31-nutrients-15-03261" class="html-bibr">31</a>].</p>
Full article ">
12 pages, 607 KiB  
Article
Precarious Young Adults’ Mental Health during the Pandemic: The Major Impact of Food Insecurity Independently of COVID-19 Diagnosis
by Aziz Essadek, Gérard Shadili, Pablo Bergami Goulart Barbosa, Adèle Assous, Frédéric Widart, Ségolène Payan, Thomas Rabeyron, Emmanuelle Corruble, Bruno Falissard and Florence Gressier
Nutrients 2023, 15(14), 3260; https://doi.org/10.3390/nu15143260 - 24 Jul 2023
Viewed by 1858
Abstract
The COVID-19 pandemic had a major impact on mental health across populations, especially young and precarious people. Furthermore, COVID-19 diagnosis itself has been associated with psychiatric symptoms. However, only a few studies have assessed the mental health of precarious youth, and examined a [...] Read more.
The COVID-19 pandemic had a major impact on mental health across populations, especially young and precarious people. Furthermore, COVID-19 diagnosis itself has been associated with psychiatric symptoms. However, only a few studies have assessed the mental health of precarious youth, and examined a possible association with food insecurity, while including COVID-19 diagnosis in their analyses. We aimed to determine the prevalence of poor mental health in precarious youth during the COVID-19 pandemic, and to investigate its possible association with food insecurity, independently of COVID-19 diagnosis. In a cross-sectional study conducted in the context of an employment program for precarious youth (18–25 years) living in Paris, France, 823 individuals were assessed for depression, anxiety, subjective distress and food insecurity during the second lockdown of 2020. A directed acyclic graph (DAG)-based approach was used to identify confounders for inclusion in a multivariate regression model. Of the 823 precarious youth, 45.93% reported significant symptoms of depression, 36.69% anxiety, 39% distress and 25.39% suicidal ideation. In the multivariate analysis based on DAG, food insecurity (less than one meal per day) was associated with depression (OR = 2.30; CI%: 1.19–4.51), anxiety (OR = 2.51; CI%: 1.29–4.88), distress (OR = 2.36; CI%: 1.23–4.57) and suicidal ideation (OR = 4.81; CI%: 2.46–9.44), independently of age, gender, education, COVID-19 contact and COVID-19 diagnosis. This study highlights the importance of food insecurity on mental health among young precarious people during the COVID-19 pandemic. Reducing food insecurity is essential to help reduce psychological distress. Full article
(This article belongs to the Special Issue The Impact of Nutrition on Mental Health during COVID-19)
Show Figures

Figure 1

Figure 1
<p>Directed acyclic graph representing the causal assumptions used for covariate selection.</p>
Full article ">
23 pages, 1927 KiB  
Article
Milk-Fat-Globule-Membrane-Enriched Dairy Milk Compared with a Soy-Lecithin-Enriched Beverage Did Not Adversely Affect Endotoxemia or Biomarkers of Gut Barrier Function and Cardiometabolic Risk in Adults with Metabolic Syndrome: A Randomized Controlled Crossover Trial
by Avinash Pokala, William R. Quarles, Joana Ortega-Anaya, Rafael Jimenez-Flores, Sisi Cao, Min Zeng, Joanna K. Hodges and Richard S. Bruno
Nutrients 2023, 15(14), 3259; https://doi.org/10.3390/nu15143259 - 23 Jul 2023
Cited by 4 | Viewed by 2830
Abstract
Full-fat dairy milk may protect against cardiometabolic disorders, due to the milk fat globule membrane (MFGM), through anti-inflammatory and gut-health-promoting activities. We hypothesized that a MFGM-enriched milk beverage (MEB) would alleviate metabolic endotoxemia in metabolic syndrome (MetS) persons by improving gut barrier function [...] Read more.
Full-fat dairy milk may protect against cardiometabolic disorders, due to the milk fat globule membrane (MFGM), through anti-inflammatory and gut-health-promoting activities. We hypothesized that a MFGM-enriched milk beverage (MEB) would alleviate metabolic endotoxemia in metabolic syndrome (MetS) persons by improving gut barrier function and glucose tolerance. In a randomized crossover trial, MetS persons consumed for two-week period a controlled diet with MEB (2.3 g/d milk phospholipids) or a comparator beverage (COMP) formulated with soy phospholipid and palm/coconut oil. They then provided fasting blood and completed a high-fat/high-carbohydrate test meal challenge for evaluating postprandial metabolism and intestinal permeability. Participants had no adverse effects and achieved high compliance, and there were no between-trial differences in dietary intakes. Compared with COMP, fasting endotoxin, glucose, incretins, and triglyceride were unaffected by MEB. The meal challenge increased postprandial endotoxin, triglyceride, and incretins, but were unaffected by MEB. Insulin sensitivity; fecal calprotectin, myeloperoxidase, and short-chain fatty acids; and small intestinal and colonic permeability were also unaffected by MEB. This short-term study demonstrates that controlled administration of MEB in MetS persons does not affect gut barrier function, glucose tolerance, and other cardiometabolic health biomarkers, which contradicts observational evidence that full-fat milk heightens cardiometabolic risk. Registered at ClinicalTrials.gov (NCT03860584). Full article
(This article belongs to the Special Issue The Contribution of Dairy Foods to Human Health and Wellness)
Show Figures

Figure 1

Figure 1
<p>Flow of persons with metabolic syndrome through the randomized controlled trial examining two-week daily consumption of MEB or COMP. Participants completed the study with no adverse events, but 4 were lost to follow-up and 2 were dismissed due to non-compliance to study procedures. Abbreviations: COMP, comparator beverage; MEB, milk fat globule membrane-enriched beverage.</p>
Full article ">Figure 2
<p>Compliance to test beverage consumption in persons with metabolic syndrome who consumed three daily servings (250 mL) of MEB or COMP for 2 weeks. PABA was added to all test beverages, and urinary PABA was assessed 5 times during each study arm from spot urine samples. Urinary PABA at &gt;30 mg/L was the threshold for compliance based on a prior report [<a href="#B29-nutrients-15-03259" class="html-bibr">29</a>]. Data (means ± SE, <span class="html-italic">n</span> = 24) were analyzed by two-way repeated measures ANOVA. <span class="html-italic">p</span> ≤ 0.05 was considered statistically significant. Abbreviations: COMP, comparator beverage; MEB, milk-fat-globule-membrane-enriched beverage; PABA, para-aminobenzoic acid.</p>
Full article ">Figure 3
<p>Postprandial serum endotoxin and plasma triglyceride in persons with metabolic syndrome who consumed MEB or COMP for 2 weeks prior to ingesting a high-fat/high-carbohydrate test meal challenge. Data (means ± SE, <span class="html-italic">n</span> = 24) are expressed as change from baseline (fasting) concentrations during the three-hour postprandial period. AUC<sub>0–180min</sub> was calculated using the trapezoidal rule. Two-way repeated measures ANOVA was used to evaluate effects due to time, treatment, and their interaction during the postprandial period. Means not sharing a common letter are significantly different from each other based on post hoc analysis following a main effect due to time. A paired Student’s <span class="html-italic">t</span>-test was used to evaluate between-treatment effects on AUC<sub>0–180min</sub>. <span class="html-italic">p</span> ≤ 0.05 was considered statistically significant. (<b>A</b>) Serum endotoxin was unaffected by MEB but increased over time, regardless of treatment. (<b>B</b>) Endotoxin AUC<sub>0–180min</sub> was not different between treatments. (<b>C</b>) Plasma triglyceride increased postprandially, regardless of test beverage, and was unaffected by MEB. (<b>D</b>) Triglyceride AUC<sub>0–180min</sub> did not differ between MEB and COMP. Abbreviations: AUC, area under the concentration curve; COMP, comparator beverage; MEB, milk-fat-globule-membrane-enriched beverage.</p>
Full article ">Figure 4
<p>Postprandial plasma glucose, insulin, and Matsuda index in persons with metabolic syndrome who consumed MEB or COMP for 2 weeks prior to ingesting a high-fat/high-carbohydrate test meal challenge. Data (means ± SE, <span class="html-italic">n</span> = 24) are expressed as change from baseline (fasting) concentrations during the three-hour postprandial period. AUC<sub>0–180min</sub> was calculated using the trapezoidal rule. Two-way repeated measures ANOVA was used to evaluate effects due to time, treatment, and their interaction during the postprandial period. Means not sharing a common letter are significantly different from each other based on post hoc analysis following a main effect due to time. A main effect due to treatment was also detected, and <span>$</span> indicates a significant difference following post hoc analysis. A paired Student’s <span class="html-italic">t</span>-test was used to evaluate between-treatment effects on AUC<sub>0–180min</sub> (*, <span class="html-italic">p</span> &lt; 0.05). <span class="html-italic">p</span> ≤ 0.05 was considered statistically significant. (<b>A</b>) Plasma glucose and insulin increased over time but were unaffected by MEB. (<b>B</b>) Glucose and insulin AUC<sub>0–180min</sub> were higher in MEB compared to COMP. (<b>C</b>) Matsuda Index Score did not differ between MEB and COMP. Abbreviations: AUC, area under the concentration curve; COMP, comparator beverage; MEB, milk-fat-globule-membrane-enriched beverage.</p>
Full article ">Figure 5
<p>Postprandial plasma GIP and GLP-1 in persons with metabolic syndrome who consumed MEB or COMP for 2 weeks prior to ingesting a high-fat/high-carbohydrate test meal challenge. Data (means ± SE, <span class="html-italic">n</span> = 24) are expressed as change from baseline (fasting) concentrations during the three-hour postprandial period. AUC<sub>0–180min</sub> was calculated using the trapezoidal rule. Two-way repeated measures ANOVA was used to evaluate time, treatment, and interactive effects during the postprandial period. Means not sharing a common letter are significantly different from each other based on post hoc analysis following a main effect due to time. A paired Student’s <span class="html-italic">t</span>-test was used to evaluate between-treatment effects on AUC<sub>0–180min</sub>. <span class="html-italic">p</span> ≤ 0.05 was considered statistically significant. (<b>A</b>) Plasma GIP was unaffected by MEB but increased over time, regardless of treatment. (<b>B</b>) GIP AUC<sub>0–180min</sub> did not differ between treatments. (<b>C</b>) Plasma GLP-1 increased postprandially, regardless of test beverage, and was unaffected by MEB. (<b>D</b>) GLP-1 AUC<sub>0–180min</sub> did not differ between MEB and COMP. Abbreviations: AUC, area under the concentration curve; COMP, comparator beverage; GIP, glucose-dependent insulinotropic polypeptide; GLP-1, glucagon-like peptide; MEB, milk-fat-globule-membrane-enriched beverage.</p>
Full article ">Figure 6
<p>Gut permeability, inflammation, and SCFAs in persons with metabolic syndrome who consumed MEB or COMP for 2 weeks prior to ingesting a high-fat/high-carbohydrate test meal challenge. Data (means ± SE, <span class="html-italic">n</span> = 24) were analyzed by a paired Student’s <span class="html-italic">t</span>-test. <span class="html-italic">p</span> &lt; 0.05 was considered statistically significant. (<b>A</b>) Urinary 0–5 h L/M and 5–24 h S/E did not differ between treatments. (<b>B</b>) Bristol stool scores, (<b>C</b>) fecal myeloperoxidase, and (<b>D</b>) fecal calprotectin did not differ between MEB and COMP. (<b>E</b>) Fecal straight-chain and branched-chain SCFAs did not differ between treatments. Abbreviations: COMP, comparator beverage; L/M, lactulose/mannitol; MEB, milk-fat-globule-membrane-enriched beverage; SCFA, short-chain fatty acids; S/E, sucralose/erythritol.</p>
Full article ">Figure 7
<p>Whole blood expression of inflammatory genes in persons with metabolic syndrome who consumed MEB or COMP for 2 weeks prior to ingesting a high-fat/high-carbohydrate test meal challenge. Data (means ± SE, <span class="html-italic">n</span> = 24) were normalized to β-actin and analyzed by two-way RM ANOVA. (<b>A</b>) TLR4, (<b>B</b>) MCP1, (<b>C</b>) TNFα, (<b>D</b>) IL-8, (<b>E</b>) IL-6, and (<b>F</b>) p65 showed no effects due to time, treatment, or their interaction (<span class="html-italic">p</span> &gt; 0.05 for all). Abbreviations: COMP, comparator beverage; IL, interleukin; MEB, milk-fat-globule-membrane-enriched beverage; MCP1, monocyte chemoattractant protein; TLR4, Toll-like receptor-4; TNFα, tumor necrosis factor-α.</p>
Full article ">
20 pages, 1563 KiB  
Review
The Role of Gut Microbiota in Anxiety, Depression, and Other Mental Disorders as Well as the Protective Effects of Dietary Components
by Ruo-Gu Xiong, Jiahui Li, Jin Cheng, Dan-Dan Zhou, Si-Xia Wu, Si-Yu Huang, Adila Saimaiti, Zhi-Jun Yang, Ren-You Gan and Hua-Bin Li
Nutrients 2023, 15(14), 3258; https://doi.org/10.3390/nu15143258 - 23 Jul 2023
Cited by 34 | Viewed by 22150
Abstract
The number of individuals experiencing mental disorders (e.g., anxiety and depression) has significantly risen in recent years. Therefore, it is essential to seek prevention and treatment strategies for mental disorders. Several gut microbiota, especially Firmicutes and Bacteroidetes, are demonstrated to affect mental health [...] Read more.
The number of individuals experiencing mental disorders (e.g., anxiety and depression) has significantly risen in recent years. Therefore, it is essential to seek prevention and treatment strategies for mental disorders. Several gut microbiota, especially Firmicutes and Bacteroidetes, are demonstrated to affect mental health through microbiota–gut–brain axis, and the gut microbiota dysbiosis can be related to mental disorders, such as anxiety, depression, and other mental disorders. On the other hand, dietary components, including probiotics (e.g., Lactobacillus and Bifidobacterium), prebiotics (e.g., dietary fiber and alpha-lactalbumin), synbiotics, postbiotics (e.g., short-chain fatty acids), dairy products, spices (e.g., Zanthoxylum bungeanum, curcumin, and capsaicin), fruits, vegetables, medicinal herbs, and so on, could exert protective effects against mental disorders by enhancing beneficial gut microbiota while suppressing harmful ones. In this paper, the mental disorder-associated gut microbiota are summarized. In addition, the protective effects of dietary components on mental health through targeting the gut microbiota are discussed. This paper can be helpful to develop some dietary natural products into pharmaceuticals and functional foods to prevent and treat mental disorders. Full article
(This article belongs to the Special Issue Effects of Diet–Microbiome Interactions on Chronic Diseases)
Show Figures

Figure 1

Figure 1
<p>The relationships of gut microbiota and mental disorders. ↑ represents positive association, ↓ represents negative association. ASD, autism spectrum disorder.</p>
Full article ">Figure 2
<p>The effects of natural products on mental disorders. ↑ represents increase, ↓ represents decrease.</p>
Full article ">Figure 3
<p>The effects and mechanisms of natural dietary products on mental disorders by targeting gut microbiota. Abbreviations: ACTH, adrenocorticotropic hormone; BDNF, brain-derived neurotrophic factor; CORT, cortisol; CRF, corticotropin releasing factor; DA, dopamine; GABA, glutamate–glutamine–gamma-aminobutyric acid; HPA, hypothalamic–pituitary–adrenal; SCFAs, short-chain fatty acids; TrkB, tyrosine kinase receptor B; TNF-α, tumor necrosis factor alpha; and 5-HT, 5-hydroxytryptamine.</p>
Full article ">
12 pages, 1025 KiB  
Article
Impact of Chronotype and Mediterranean Diet on the Risk of Liver Fibrosis in Patients with Non-Alcoholic Fatty Liver Disease
by Gabriele Castelnuovo, Nuria Perez-Diaz-del-Campo, Chiara Rosso, Marta Guariglia, Angelo Armandi, Aurora Nicolosi, Gian Paolo Caviglia and Elisabetta Bugianesi
Nutrients 2023, 15(14), 3257; https://doi.org/10.3390/nu15143257 - 23 Jul 2023
Cited by 1 | Viewed by 1898
Abstract
Late chronotype, the individual’s aptitude to perform daily activities late in the day, has been associated with low adherence to the Mediterranean diet (MedDiet) and metabolic syndrome. The aim of this work was to investigate the potential association of chronotype and adherence to [...] Read more.
Late chronotype, the individual’s aptitude to perform daily activities late in the day, has been associated with low adherence to the Mediterranean diet (MedDiet) and metabolic syndrome. The aim of this work was to investigate the potential association of chronotype and adherence to the MedDiet with the liver fibrosis risk in patients with non-alcoholic fatty liver disease (NAFLD). Liver stiffness was assessed in 126 patients by FibroScan®530. Significant (F ≥ 2) and advanced (F ≥ 3) hepatic fibrosis were defined according to liver stiffness values ≥7.1 kPa and ≥8.8 kPa, respectively. Chronotype (MSFsc) was defined by the Munich Chronotype Questionnaire, and adherence to the MedDiet was defined by the Mediterranean diet score (MDS). Overall, the median age was 55 (46–63) years, and 57.9% of participants were male. The principal comorbidities were type-2 diabetes mellitus (T2DM) (26.1%), arterial hypertension (53.1%), dyslipidaemia (63.4%), obstructive sleep apnoea (5.5%) and depression (5.5%). Most subjects (65.0%) had intermediate + late chronotype and showed higher mid-sleep on workdays (p < 0.001) and on work-free days (p < 0.001) compared to those with early chronotype. In the logistic regression model, intermediate + late chronotype (p = 0.024), MDS (p = 0.019) and T2DM (p = 0.004) were found to be significantly and independently associated with the risk of both F ≥ 2 And F ≥ 3. We observed that the intermediate + late chronotype and low adherence to the MedDiet were associated with both significant and advanced liver fibrosis in patients with NAFLD. Full article
(This article belongs to the Special Issue Nutrition Therapy: Personal Diet and Lifestyle and Human Health)
Show Figures

Figure 1

Figure 1
<p>Multidisciplinary management of NAFLD. Environmental factors such as nutrient intake and exposure or physical activity, genetics, epigenetics or microbiota composition have been shown to be associated with NAFLD. Similarly, an individual’s chronotype influences the development of this disease, being important to consider it along with the aforementioned factors for an accurate and comprehensive management of these patients. Abbreviations: NAFLD, non-alcoholic fatty liver disease.</p>
Full article ">Figure 2
<p>Recruitment flowchart. Abbreviations: MCTQ, Munich Chronotype Questionnaire; MDS, Mediterranean Diet Score; US, Ultrasound; VCTE + CAP, Vibration controlled transient elastography with assessment of Controlled attenuation parameter.</p>
Full article ">
31 pages, 1846 KiB  
Article
Identifying Novel Data-Driven Dietary Patterns via Dimensionality Reduction and Associations with Socioeconomic Profile and Health Outcomes in Ireland
by Daniel T. Burke, Annemarie E. Bennett, Paul Hynds and Anushree Priyadarshini
Nutrients 2023, 15(14), 3256; https://doi.org/10.3390/nu15143256 - 23 Jul 2023
Cited by 1 | Viewed by 2862
Abstract
Dietary patterns and body mass index (BMI) play a significant role in the development of noncommunicable diseases (NCDs), which are the leading cause of mortality worldwide, including Ireland. A cross-sectional survey was conducted across Ireland to collate respondents’ socioeconomic profiles, health status, and [...] Read more.
Dietary patterns and body mass index (BMI) play a significant role in the development of noncommunicable diseases (NCDs), which are the leading cause of mortality worldwide, including Ireland. A cross-sectional survey was conducted across Ireland to collate respondents’ socioeconomic profiles, health status, and dietary patterns with a representative sample size of 957 adult respondents. Principal component analysis (PCA) and statistical analyses were subsequently employed. To the author’s knowledge, this is the first study to use recent (2021) nationally representative data to characterise dietary patterns in Ireland via dimensionality reduction. Five distinct dietary patterns (“meat-focused”, “dairy/ovo-focused”, “vegetable-focused”, “seafood-focused”, and “potato-focused”) were identified and statistically characterised. The “potato-focused” group exhibited the highest mean BMI (26.88 kg/m2), while the “vegetable-focused” group had the lowest (24.68 kg/m2). “Vegetable-focused” respondents were more likely to be associated with a categorically healthy BMI (OR = 1.90) and urban residency (OR = 2.03). Conversely, “meat-focused” respondents were more likely to have obesity (OR = 1.46) and rural residency (OR = 1.72) along with the “potato-focused” group (OR = 2.15). Results show that data-derived dietary patterns may better predict health outcomes than self-reported dietary patterns, and transitioning to diets focusing on vegetables, seafood, and lower meat consumption may improve health. Full article
(This article belongs to the Section Nutrition and Public Health)
Show Figures

Figure 1

Figure 1
<p>Membership to principal component of dietary patterns according to self-reported dietary pattern. Significant difference between omnivores (<span class="html-italic">n</span> = 606), flexitarians (<span class="html-italic">n</span> = 218), pescatarians (<span class="html-italic">n</span> = 32), vegetarians (<span class="html-italic">n</span> = 76), and vegans (<span class="html-italic">n</span> = 25) in each PC (chi-squared test; <span class="html-italic">p</span> &lt; 0.001).</p>
Full article ">Figure 2
<p>Membership to principal component (PC) of dietary patterns according to settlement pattern. Significant difference between urban (<span class="html-italic">n</span> = 678) and rural (<span class="html-italic">n</span> = 279) in each PC (chi-squared test; <span class="html-italic">p</span> &lt; 0.001).</p>
Full article ">Figure 3
<p>Box and whisker chart for each PCA-derived and self-reported diet with the global median (25.89 kg/m<sup>2</sup>) shown as a horizontal red line.</p>
Full article ">Figure 4
<p>Membership of BMI weight class delineated by PCA-derived diet. Significant difference between underweight (<span class="html-italic">n</span> = 31), healthy (<span class="html-italic">n</span> = 366), overweight (<span class="html-italic">n</span> = 302), and obese (<span class="html-italic">n</span> = 221) for each PC dietary pattern (chi-squared test <span class="html-italic">p</span> &lt; 0.001).</p>
Full article ">
19 pages, 2970 KiB  
Review
Study of the Effect of Intestinal Microbes on Obesity: A Bibliometric Analysis
by Zehao Su, Chenyu Tian, Guan Wang, Jingjing Guo and Xiaoyan Yang
Nutrients 2023, 15(14), 3255; https://doi.org/10.3390/nu15143255 - 23 Jul 2023
Cited by 5 | Viewed by 2127
Abstract
Obesity is a serious public health problem. According to statistics, there are millions of obese people worldwide. Research studies have discovered a complex and intricate relationship between the gut microbiota and obesity. Probing and summarizing the relationship between intestinal microbes and obesity has [...] Read more.
Obesity is a serious public health problem. According to statistics, there are millions of obese people worldwide. Research studies have discovered a complex and intricate relationship between the gut microbiota and obesity. Probing and summarizing the relationship between intestinal microbes and obesity has important guiding significance for the accurate control of the research direction and expanding the choice of obesity treatment methods. We used bibliometric analysis to analyze the published literature with the intention to reveal the research hotspots and development trends on the effects of intestinal microbes on obesity from a visualization perspective, both qualitatively and quantitatively. The results showed that current research is focusing on related mechanisms of the effects of intestinal microbes on obesity and therapeutic methods for obesity. Several noteworthy hotspots within this field have garnered considerable attention and are expected to remain the focal points of future research. Of particular interest are the mechanisms by which intestinal microbes potentially regulate obesity through metabolite interactions, as well as the role of microbiomes as metabolic markers of obesity. These findings strongly suggest that gut microbes continue to be a key target in the quest for effective obesity treatments. Co-operation and communication between countries and institutions should be strengthened to promote development in this field to benefit more patients with obesity. Full article
(This article belongs to the Section Nutrition and Metabolism)
Show Figures

Figure 1

Figure 1
<p>Global publication trend and country or region analysis for the effect of intestinal microbes on obesity research. (<b>a</b>) Annual worldwide publication output. (<b>b</b>) Growth trends in publication output from the top 10 most productive countries. (<b>c</b>) Top 10 publishers according to their contribution to the total number of articles on the effect of intestinal microbes on obesity research.</p>
Full article ">Figure 1 Cont.
<p>Global publication trend and country or region analysis for the effect of intestinal microbes on obesity research. (<b>a</b>) Annual worldwide publication output. (<b>b</b>) Growth trends in publication output from the top 10 most productive countries. (<b>c</b>) Top 10 publishers according to their contribution to the total number of articles on the effect of intestinal microbes on obesity research.</p>
Full article ">Figure 2
<p>CiteSpace network visualization map of countries/regions and institutions. (<b>a</b>) CiteSpace network visualization map of countries/regions involved in the effect of intestinal microbes on obesity research (node label: by citation, label font size: proportional). (<b>b</b>) CiteSpace network visualization map of institutions involved in the effect of intestinal microbes on obesity research (node label: by citation, label font size: proportional).</p>
Full article ">Figure 3
<p>CiteSpace network visualization map of authors and co-cited authors. (<b>a</b>) CiteSpace network visualization map of authors involved in the effect of intestinal microbes on obesity research (node label: by citation, label font size: proportional). (<b>b</b>) CiteSpace network visualization map of co-cited authors involved in the effect of intestinal microbes on obesity research (node label: by centrality, label font size: proportional).</p>
Full article ">Figure 4
<p>CiteSpace network visualization map of co-cited journals involved in the effect of intestinal microbes on obesity research (node label: by centrality, label font size: proportional).</p>
Full article ">Figure 5
<p>Keywords co-occurrence network for the effect of intestinal microbes on obesity research (node label: by centrality, label font size: uniformed).</p>
Full article ">Figure 6
<p>Keywords clusters for the effect of intestinal microbes on obesity research.</p>
Full article ">
Previous Issue
Next Issue
Back to TopTop