[go: up one dir, main page]

Next Issue
Volume 14, February-2
Previous Issue
Volume 14, January-2
 
 
nutrients-logo

Journal Browser

Journal Browser

Nutrients, Volume 14, Issue 3 (February-1 2022) – 324 articles

Cover Story (view full-size image): 
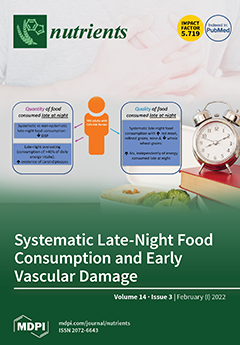
Limited data exist regarding the association between late-night habits of systematic food consumption, overeating, and eating poor-quality food with subclinical vascular damage that precedes the onset of CVD. This study aimed to investigate the above associations in a large sample of adults, free of established CVD, with one or more CVD risk factors. Systematic late-night eating (the systematic consumption of food after 19:00 hrs) is associated with lower diastolic blood pressure, while systematic late-night overeating (>40% of daily total energy intake after 19:00hrs) and the consumption of poor-quality food late at night are positively associated with atheromatosis and arterial stiffness. View this paper
  • Issues are regarded as officially published after their release is announced to the table of contents alert mailing list.
  • You may sign up for e-mail alerts to receive table of contents of newly released issues.
  • PDF is the official format for papers published in both, html and pdf forms. To view the papers in pdf format, click on the "PDF Full-text" link, and use the free Adobe Reader to open them.
Order results
Result details
Section
Select all
Export citation of selected articles as:
15 pages, 3351 KiB  
Article
Lipoteichoic Acid from Lacticaseibacillus rhamnosus GG Modulates Dendritic Cells and T Cells in the Gut
by Adrián D. Friedrich, Juliana Leoni, Mariela L. Paz and Daniel H. González Maglio
Nutrients 2022, 14(3), 723; https://doi.org/10.3390/nu14030723 - 8 Feb 2022
Cited by 12 | Viewed by 3303
Abstract
Lipoteichoic acid (LTA) from Gram-positive bacteria exerts different immune effects depending on the bacterial source from which it is isolated. Lacticaseibacillus rhamnosus GG LTA (LGG-LTA) oral administration reduces UVB-induced immunosuppression and skin tumor development in mice. In the present work, we evaluate the [...] Read more.
Lipoteichoic acid (LTA) from Gram-positive bacteria exerts different immune effects depending on the bacterial source from which it is isolated. Lacticaseibacillus rhamnosus GG LTA (LGG-LTA) oral administration reduces UVB-induced immunosuppression and skin tumor development in mice. In the present work, we evaluate the immunomodulatory effect exerted by LGG-LTA in dendritic cells (DC) and T cells, both in vitro and in the gut-associated lymphoid tissue (GALT). During cell culture, LTA-stimulated BMDC increased CD86 and MHC-II expression and secreted low levels of pro and anti-inflammatory cytokines. Moreover, LTA-treated BMDC increased T cell priming capacity, promoting the secretion of IL-17A. On the other hand, in orally LTA-treated mice, a decrease in mature DC (lamina propria and Peyer’s patches) was observed. Concomitantly, an increase in IL-12p35 and IFN-γ transcription was presented (lamina propria and Peyer’s Patches). Finally, an increase in the number of CD103+ DC was observed in Peyer’s patches. Together, our data demonstrate that LGG-LTA activates DC and T cells. Moreover, we show that a Th1-biased immune response is triggered in vivo after oral LTA administration. These effects justify the oral LTA activity previously observed. Full article
(This article belongs to the Section Prebiotics and Probiotics)
Show Figures

Graphical abstract

Graphical abstract
Full article ">Figure 1
<p>LTA activates BMDC by inducing co-stimulatory molecule expression and cytokines release. (<b>A</b>) Gating strategy to identify DC for their expression of MHC class II (PECy7-IAb Ab) and CD11c (FITC-CD11c Ab). (<b>B</b>) Representative histograms corresponding to CD86 and MHC class II surface expression levels on BMDC after control (PBS), LTA, and LPS treatment. (<b>C</b>) Bar diagrams are mean fluorescence intensity (MFI) ± SD. (<b>D</b>) Cytokines (IL-6, TNF-α, IL-1β, and IL-10) production measured by ELISA in cell culture supernatants after 24 h of LTA, LPS, or control treatment. Bar diagrams are means ± SD. (<span class="html-italic">n</span> = 2/group). ** <span class="html-italic">p</span> &lt; 0.01, *** <span class="html-italic">p</span> &lt; 0.001 vs. PBS (ordinary ANOVA and Tukey’s multiple comparisons test).</p>
Full article ">Figure 2
<p>LTA-treated BMDC show an increased priming capacity and induce T cells to secrete IL-17A in vitro. (<b>A</b>) Gating strategy to identify FVD- (fixable viability dye) viable CD4<sup>+</sup> cells (APC-CD4 Ab). Representative histograms of CFSE dilution of viable OT-II CD4+ T cells co-cultured for four days with control (solid), LTA (blue line), and LPS (red line)-treated BMDC. Proliferated cells are indicated as CFSElow. Bar diagrams are means ± SD. (<span class="html-italic">n</span> = 3/group). * <span class="html-italic">p</span> &lt; 0.05, ** <span class="html-italic">p</span> &lt; 0.01, *** <span class="html-italic">p</span>&lt; 0.001 (ordinary ANOVA and Kruskal–Wallis post-test). (<b>B</b>) Cytokines (IFN-γ, IL-5, IL-13, and IL-17A) production measured by ELISA in co-culture supernatants.</p>
Full article ">Figure 3
<p>Orally administered LTA modulates cytokine transcription in the GALT. Cytokine mRNA transcription levels were evaluated in small intestine homogenates after mice were orally administered with 100 µg of LTA. Measurements were performed at 16, 24, and 48 h after stimuli. The control group was treated with PBS, and the measurement was performed at 24 h. (<b>A</b>) TNF-α transcription, (<b>B</b>) IL-1β transcription and (<b>C</b>) IL-10 transcription. The results are shown relative to GAPDH and expressed as mean ± SD (<span class="html-italic">n</span> = 5/group). * <span class="html-italic">p</span> &lt; 0.05, ** <span class="html-italic">p</span> &lt; 0.01 (ordinary ANOVA and Dunnett’s post-test comparing each experimental group against control group). ● = PBS-treated mice (control group), ■ = LTA-treated mice sacrificed 16 hs after administration, ▲ = LTA-treated mice sacrificed 24 hs after administration, ▼ = LTA-treated mice sacrificed 48 hs after administration.</p>
Full article ">Figure 4
<p>Orally administered LTA modulates cytokine transcription in the GALT. Cytokine mRNA transcription levels were evaluated in Peyer’s patch homogenates after mice were orally administered with 100 µg of LTA. Measurements were performed at 16, 24, and 48 h after stimuli. The control group was treated with PBS, and the measurement was performed at 24 h. (<b>A</b>) TNF-α transcription, (<b>B</b>) IL-12p35 transcription, and (<b>C</b>) IFN-γ transcription. The results are shown relative to GAPDH and expressed as mean ± SD (<span class="html-italic">n</span> = 5/group). * <span class="html-italic">p</span> &lt; 0.05, ** <span class="html-italic">p</span> &lt; 0.01 (ordinary ANOVA and Dunnett’s post-test comparing each experimental group against the control group). ● = PBS-treated mice (control group), ■ = LTA-treated mice sacrificed 16 h after administration, ▲ = LTA-treated mice sacrificed 24 h after administration, ▼ = LTA-treated mice sacrificed 48 h after administration.</p>
Full article ">Figure 5
<p>Orally administered LTA modulates cytokine transcription in the GALT. Cytokine mRNA transcription levels were evaluated in mesenteric lymph nodes homogenates after mice were orally administered with 100 µg of LTA. Measurements were performed at 16, 24, and 48 h after stimuli. The control group was treated with PBS, and the measurement was performed at 24 h. (<b>A</b>) IL-12p35 transcription, (<b>B</b>) IFN-γ transcription, and (<b>C</b>) IL-10 transcription. The results are shown relative to GAPDH and expressed as mean ± SD (<span class="html-italic">n</span> = 5/group). * <span class="html-italic">p</span> &lt; 0.05 (ordinary ANOVA and Dunnett’s post-test comparing each experimental group against control group). ● = PBS-treated mice (control group), ■ = LTA-treated mice sacrificed 16 h after administration, ▲ = LTA-treated mice sacrificed 24 hs after administration, ▼ = LTA-treated mice sacrificed 48 h after administration.</p>
Full article ">Figure 6
<p>LTA promotes mature DC reduction in the lamina propria whereas it increases CD103<sup>+</sup> DC presence in the Peyer´s patches. Representative dot-plots of pre-gated viable single CD11c<sup>+</sup> (PE-CD11c Ab) and MHC class II (Alexa647-IA/IE Ab) with high expression (IA/IEhigh) mature DC in LTA-treated and control (PBS) mice (<b>A</b>) lamina propria (LP) and (<b>C</b>) Peyers’s patches (PP). Bar diagram shows mean percentages of mature DC ± SD. (<b>B</b>) Representative overlaid histograms of CD86 (FITC-CD86 Ab) surface expression on mature DC in the lamina propria of control and LTA-treated mice. Results are expressed as mean fluorescence intensity ± SD. (<b>D</b>) Representative overlaid histograms of CD103 (Biotin-Stp-PE-Cy7-CD103 Ab) surface expression on mature DC in the Peyer’s patches of control and LTA-treated mice. Bar diagram shows mean percentage of CD103<sup>+</sup> DC ± SD (<span class="html-italic">n</span> = 7/group). ** <span class="html-italic">p</span> &lt; 0.01 *** <span class="html-italic">p</span> &lt; 0.001 Student’s <span class="html-italic">t</span>-test. ● = PBS-treated mice (control group), ■ = LTA-treated mice sacrificed.</p>
Full article ">
14 pages, 1348 KiB  
Article
Gut Seasons: Photoperiod Effects on Fecal Microbiota in Healthy and Cafeteria-Induced Obese Fisher 344 Rats
by Verónica Arreaza-Gil, Iván Escobar-Martínez, Manuel Suárez, Francisca Isabel Bravo, Begoña Muguerza, Anna Arola-Arnal and Cristina Torres-Fuentes
Nutrients 2022, 14(3), 722; https://doi.org/10.3390/nu14030722 - 8 Feb 2022
Cited by 15 | Viewed by 3120
Abstract
Gut microbiota and biological rhythms are emerging as key factors in the modulation of several physiological and metabolic processes. However, little is known about their interaction and how this may affect host physiology and metabolism. Several studies have shown oscillations of gut microbiota [...] Read more.
Gut microbiota and biological rhythms are emerging as key factors in the modulation of several physiological and metabolic processes. However, little is known about their interaction and how this may affect host physiology and metabolism. Several studies have shown oscillations of gut microbiota that follows a circadian rhythmicity, but, in contrast, variations due to seasonal rhythms have not been sufficiently investigated yet. Thus, the goal of this study was to investigate the impact of different photoperiods, which mimic seasonal changes, on fecal microbiota composition and how this interaction affects diet-induced obesity development. To this aim, Fisher 344 male rats were housed under three photoperiods (L6, L12 and L18) and fed with standard chow diet or cafeteria diet (CAF) for 9 weeks. The 16S ribosomal sequencing of collected fecal samples was performed. The photoperiod exposure significantly altered the fecal microbiota composition under L18, especially in CAF-fed rats. Moreover, these alterations were associated with changes in body weight gain and different fat parameters. These findings suggest a clear impact of seasonal rhythms on gut microbiota, which ultimately translates into different susceptibilities to diet-induced obesity development. This is the first time to our knowledge that the photoperiod impact on gut microbiota composition has been described in an obesity context although further studies are needed in order to elucidate the mechanisms involved. Full article
(This article belongs to the Special Issue Nutrigenomics and Biological Rhythms: Impact on Human Health)
Show Figures

Figure 1

Figure 1
<p>Animal experimental design. 13-week-old male STD- or CAF-fed Fischer 344 rats were pair-housed under three different photoperiods (6, 12 or 18 h of light per day) for 9 weeks. (<span class="html-italic">n</span> = 7–8). ♂: represents male sex; L6: short photoperiod (6 h light/18 h dark); L12: standard photoperiod (12 h light/12 h dark); L18: long photoperiod (18 h light/6 h dark); STD: standard chow diet; CAF: cafeteria diet.</p>
Full article ">Figure 2
<p>Effects of photoperiods on body weight gain in STD- and CAF-fed rats. (<b>a</b>) Body weight gain under short (L6), standard (L12) and long (L18) photoperiods across the 9 weeks of the experiment. * indicates significant CAF effect and <span class="html-italic">a,b</span> letters indicate significant CAF and photoperiod effects respectively, analyzed by repeated measures ANOVA followed by LSD post hoc test (<span class="html-italic">p</span> &lt; 0.05). (<b>b</b>) Area under the curve (AUC) of body weight gain. * indicates significant CAF effect and <span class="html-italic">a,b</span> letters indicate photoperiod effect, analyzed by 2-way ANOVA followed by LSD post hoc test (<span class="html-italic">p</span> &lt; 0.05). Data are plotted as the mean ± SD (<span class="html-italic">n</span> = 7–8). L6: short photoperiod (6 h light/18 h dark); L12: standard photoperiod (12 h light/12 h dark); L18: long photoperiod (18 h light/6 h dark); STD: standard chow diet; CAF: cafeteria diet.</p>
Full article ">Figure 3
<p>Effect of photoperiods (Ph) on both fecal microbial diversity and bacteria phyla relative abundance. Principal coordinates analysis (PCoA) 2D plot (PERMANOVA, <span class="html-italic">p</span> &lt; 0.001) of fecal microbiota beta diversity based on Bray–Curtis distances in (<b>a</b>) STD- and in (<b>b</b>) CAF-fed rats; (<b>c</b>) alpha diversity calculated by chao-1 index in STD- and CAF-fed rats under the three different Ph conditions. Data are plotted as box and whiskers (median with interquartile ranges). * Indicates significant diet effect between STD and CAF-fed rats under same photoperiod conditions, analyzed by U-Mann–Whitney (<span class="html-italic">p</span> &lt; 0.05); <span class="html-italic">a,b</span> letters indicate significant photoperiod effect analyzed by Kruskal–Wallis test followed by Bonferroni correction for multiple comparisons (<span class="html-italic">p</span> &lt; 0.016); (<b>d</b>) relative abundance of different bacteria taxa at phylum level. (<span class="html-italic">n</span> = 7–8). L6: short photoperiod (6 h light/18 h dark); L12: standard photoperiod (12 h light/12 h dark); L18: long photoperiod (18 h light/6 h dark); STD: standard chow diet; CAF: cafeteria diet.</p>
Full article ">Figure 4
<p>Relative abundance at genus level of the most abundant genera significantly altered by photoperiods. Stacked bar plots showing the relative abundance of each taxa at genus level. (<span class="html-italic">n</span> = 7–8). L6: short photoperiod (6 h light/18 h dark); L12: standard photoperiod (12 h light/12 h dark); L18: long photoperiod (18 h light/6 h dark); STD: standard chow diet; CAF: cafeteria diet.</p>
Full article ">Figure 5
<p>Correlations between fecal microbiota and body weight gain and fat parameters analyzed by Spearman’s rank correlation coefficient (rho) at phylum level. Heat map with hierarchical clustering based on correlation coefficient between bacteria and biometric parameters at phylum level. Positive and negative correlations are represented in red and blue respectively. The higher the color intensity the higher the degree of correlation.</p>
Full article ">Figure 6
<p>Correlations between fecal microbiota and fat parameters analyzed by Spearman’s rank correlation coefficient (rho) at genus level. (<b>a</b>) Heat map with hierarchical clustering based on correlation coefficient between bacteria and fat parameters at genus level. Positive and negative correlations are represented in red and blue, respectively. The higher the color intensity the higher the degree of correlation. (<b>b</b>) Locally weighted linear regression (Lowess model) analysis of the strongest observed correlation in several bacteria genera affected by photoperiod.</p>
Full article ">
15 pages, 1933 KiB  
Article
Additional Resistant Starch from One Potato Side Dish per Day Alters the Gut Microbiota but Not Fecal Short-Chain Fatty Acid Concentrations
by Peter DeMartino, Emily A. Johnston, Kristina S. Petersen, Penny M. Kris-Etherton and Darrell W. Cockburn
Nutrients 2022, 14(3), 721; https://doi.org/10.3390/nu14030721 - 8 Feb 2022
Cited by 7 | Viewed by 5102
Abstract
The composition of the gut microbiota and their metabolites are associated with cardiometabolic health and disease risk. Intake of dietary fibers, including resistant starch (RS), has been shown to favorably affect the health of the gut microbiome. The aim of this research was [...] Read more.
The composition of the gut microbiota and their metabolites are associated with cardiometabolic health and disease risk. Intake of dietary fibers, including resistant starch (RS), has been shown to favorably affect the health of the gut microbiome. The aim of this research was to measure changes in the gut microbiota and fecal short-chain fatty acids as part of a randomized, crossover supplemental feeding study. Fifty participants (68% female, aged 40 ± 13 years, BMI 24.5 ± 3.6 kg/m2) completed this study. Potato dishes (POT) contained more RS than refined grain dishes (REF) (POT: 1.31% wet basis (95% CI: 0.94, 1.71); REF: 0.73% wet basis (95% CI: 0.34, 1.14); p = 0.03). Overall, potato dish consumption decreased alpha diversity, but beta diversity was not impacted. Potato dish consumption was found to increase the abundance of Hungatella xylanolytica, as well as that of the butyrate producing Roseburia faecis, though fecal butyrate levels were unchanged. Intake of one potato-based side dish per day resulted in modest changes in gut microbiota composition and diversity, compared to isocaloric intake of refined grains in healthy adults. Studies examining foods naturally higher in RS are needed to understand microbiota changes in response to dietary intake of RS and associated health effects. Full article
(This article belongs to the Section Carbohydrates)
Show Figures

Figure 1

Figure 1
<p>Study design. A randomized cross-over study was conducted where participants consumed a refined grain side dish and a non-fried potato side dish in random order daily for 4 weeks each, with a 2–3-week washout period in between conditions. Up arrows signify fecal sample collection days at baseline and at the midpoint and end of each condition (weeks 2 and 4).</p>
Full article ">Figure 2
<p>Alpha diversity analysis. The microbiotas of all participants were assessed for microbial diversity at baseline and during each diet condition. Shannon diversity, Inverse Simpson diversity, and Faith’s Phylogenetic Diversity were assessed for each. Statistical comparisons were made between the potato and refined grain conditions by a mixed effects model with participants used as a random effect. * indicates <span class="html-italic">p</span> &lt; 0.05, ** indicates <span class="html-italic">p</span> &lt; 0.01.</p>
Full article ">Figure 3
<p>Beta diversity analysis. The microbiotas of all participants were assessed for between sample microbial diversity at baseline and during each diet condition. Bray–Curtis dissimilarity, Aitchison distance, and Weighted-UniFrac were used to assess the differences between the communities via principal coordinate analysis. Statistical comparison was made via PERMANOVA analysis. <span class="html-italic">p</span> &lt; 0.05 was considered significant.</p>
Full article ">Figure 4
<p>Differential abundance analysis. The heatmap is colored by the standardized change in the relative abundance of the taxon between the baseline and each of the diet conditions. Significant differences were calculated by three methods: LEfSe, DESeq2, and ANCOM-II. Significance is indicated by * for one method finding the taxon significantly different between that treatment and the control, *** for all three methods detecting a significant change. For LEfSe and DESeq2, adjusted <span class="html-italic">p</span>-values of 0.05 were used as the cutoff for significance, while for ANCOM-II, which does not generate <span class="html-italic">p</span>-values, the default cutoff threshold of 0.7 was used.</p>
Full article ">
19 pages, 3183 KiB  
Article
Choline Kinetics in Neonatal Liver, Brain and Lung—Lessons from a Rodent Model for Neonatal Care
by Wolfgang Bernhard, Marco Raith, Anna Shunova, Stephan Lorenz, Katrin Böckmann, Michaela Minarski, Christian F. Poets and Axel R. Franz
Nutrients 2022, 14(3), 720; https://doi.org/10.3390/nu14030720 - 8 Feb 2022
Cited by 8 | Viewed by 2303
Abstract
Choline requirements are high in the rapidly growing fetus and preterm infant, mainly serving phosphatidylcholine (PC) synthesis for parenchymal growth and one-carbon metabolism via betaine. However, choline metabolism in critical organs during rapid growth is poorly understood. Therefore, we investigated the kinetics of [...] Read more.
Choline requirements are high in the rapidly growing fetus and preterm infant, mainly serving phosphatidylcholine (PC) synthesis for parenchymal growth and one-carbon metabolism via betaine. However, choline metabolism in critical organs during rapid growth is poorly understood. Therefore, we investigated the kinetics of D9-choline and its metabolites in the liver, plasma, brain and lung in 14 d old rats. Animals were intraperitoneally injected with 50 mg/kg D9-choline chloride and sacrificed after 1.5 h, 6 h and 24 h. Liver, plasma, lungs, cerebrum and cerebellum were analyzed for D9-choline metabolites, using tandem mass spectrometry. In target organs, D9-PC and D9-betaine comprised 15.1 ± 1.3% and 9.9 ± 1.2% of applied D9-choline at 1.5 h. D9-PC peaked at 1.5 h in all organs, and decreased from 1.5–6 h in the liver and lung, but not in the brain. Whereas D9-labeled PC precursors were virtually absent beyond 6 h, D9-PC increased in the brain and lung from 6 h to 24 h (9- and 2.5-fold, respectively) at the expense of the liver, suggesting PC uptake from the liver via plasma rather than local synthesis. Kinetics of D9-PC sub-groups suggested preferential hepatic secretion of linoleoyl-PC and acyl remodeling in target organs. D9-betaine showed rapid turnover and served low-level endogenous (D3-)choline synthesis. In conclusion, in neonatal rats, exogenous choline is rapidly metabolized to PC by all organs. The liver supplies the brain and lung directly with PC, followed by organotypic acyl remodeling. A major fraction of choline is converted to betaine, feeding the one-carbon pool and this must be taken into account when calculating choline requirements. Full article
(This article belongs to the Section Micronutrients and Human Health)
Show Figures

Graphical abstract

Graphical abstract
Full article ">Figure 1
<p>Metabolism of D9-choline. Filled fat arrows indicate de novo synthesis of D9-phosphatidylcholine (D9-PC) and its degradation products D9-Lyso-PC and D9-glycerophosphocholine (D9-GPC). D9-choline recycling is indicated by thin solid arrows. Dotted fat arrows indicate downstream metabolism of D9-choline via D9-betaine synthesis and that of D3-methionine (D3-Meth) from homocysteine. This is followed by D3-S-adenosylmethionine (D3-SAM) synthesis, serving 3-fold methylation of phosphatidylethanolamine (PE), predominantly resulting in D3-PC. The latter can undergo hydrolysis in analogy to D9-PC catabolism, resulting in free D3-choline. Striped fat arrows show the synthesis of D9-sphingomyelin (D9-SPH) from ceramide, using D9-PC as a donor of a D9-phosphocholine group. Further abbreviations: DAG, diacylglycerol; D6-DMG, D6-dimethylglycine. For further details and enzymes/micronutrients involved see ref [<a href="#B25-nutrients-14-00720" class="html-bibr">25</a>].</p>
Full article ">Figure 2
<p>Fraction of administered D9-choline (<b>A</b>) and deuterium enrichment (<b>B</b>) in water-soluble components of the sum of all investigated organs. Fractions of administered D9-choline (<b>A</b>) were corrected for the number of deuterated methyl groups in the respective components, which are 2 for D6-dimethylglycine (D6-DMG), and 1 for D3-methionine and D3-choline. Data are means ± SE of 8–10 data points per time point (1.5 h, 6 h, 24 h). Abbreviations: ††, <span class="html-italic">p</span> &lt; 0.01, †††, <span class="html-italic">p</span> &lt; 0.001 vs. 1.5 h; ‡‡, <span class="html-italic">p</span> &lt; 0.01, ‡‡‡, <span class="html-italic">p</span> &lt; 0.001 vs. 6 h.</p>
Full article ">Figure 3
<p>Kinetics of D9-choline (<b>A</b>) and its deuterated water-soluble metabolites (<b>B</b>–<b>F</b>) in individual organs. Data are expressed as total pools of compounds in individual organs and total plasma volume and are means ± SE of 8–10 data points per time point (1.5 h, 6 h, 24 h) after intraperitoneal injection of 50 mg/kg D9-choline chloride. Abbreviations: ∅, not significant; †, <span class="html-italic">p</span> &lt; 0.05, ††, <span class="html-italic">p</span> &lt; 0.01, †††, <span class="html-italic">p</span> &lt; 0.001 vs. 1.5 h; ‡, <span class="html-italic">p</span> &lt; 0.05, ‡‡, <span class="html-italic">p</span> &lt; 0.01, ‡‡‡, <span class="html-italic">p</span> &lt; 0.001 vs. 6 h.</p>
Full article ">Figure 4
<p>Fractions of administered D9-choline (<b>A</b>) and enrichment of D9-choline (<b>B</b>) and D3-choline (<b>C</b>) labeled phospholipids in the sum of all investigated organs (liver, lung, lung lavage fluid, cerebrum, cerebellum) and total plasma. For fractions of D3-labeled components (<b>A</b>), absolute values were divided by 3 as only one of 3 D3-methyl groups of the administered D9-choline are present in the target molecules. Data are means ± SE of 8–10 experiments and indicate the kinetics from 1.5 h to 24 h after 50 mg/kg intraperitoneal D9-choline chloride injection. Abbreviations: D9/3-PC, D<sub>9/3</sub>- phosphatidylcholine; D<sub>9/3</sub>-Lyso-PC, D<sub>9/3</sub>-lyso-phosphatidylcholine; D<sub>9/3</sub>-SPH, D<sub>9/3</sub>-sphingomyelin. ∅, not significant; †, <span class="html-italic">p</span> &lt; 0.05, ††, <span class="html-italic">p</span> &lt; 0.01, †††, <span class="html-italic">p</span> &lt; 0.001 vs. 1.5 h; ‡‡, <span class="html-italic">p</span> &lt; 0.01, ‡‡‡, <span class="html-italic">p</span> &lt; 0.001 vs. 6 h.</p>
Full article ">Figure 5
<p>Pool size kinetics of D9-PC (<b>A</b>,<b>E</b>), D9-lyso-PC (<b>B</b>,<b>F</b>), D9-SPH (<b>C</b>,<b>G</b>) and D3-PC (<b>D</b>,<b>H</b>) in different organs. Data are means ± SE of 8–10 data points at 1.5 h, 6 h and 24 h, respectively, after intraperitoneal administration of 50 mg/kg D9-choline chloride. Abbreviations: D<sub>9/3</sub>-PC, D<sub>9/3</sub>-phosphatidylcholine; D9-Lyso-PC, D9-lyso-phosphatidylcholine; D9-SPH, D9-sphingomyelin, LLF, lung lavage fluid; ∅, not significant, ††, <span class="html-italic">p</span> &lt; 0.01, †††, <span class="html-italic">p</span> &lt; 0.001 vs. 1.5 h; ‡‡, <span class="html-italic">p</span> &lt; 0.01, ‡‡‡, <span class="html-italic">p</span> &lt; 0.001 vs. 6 h.</p>
Full article ">Figure 6
<p>The absolute decrease in poly-unsaturated D9-labeled PC subgroups in the liver (<b>A</b>), and their fractions in D9-labeled versus endogenous PC in the liver (<b>B</b>), plasma (<b>C</b>), lung (<b>D</b>), cerebrum (<b>E</b>) and cerebellum (<b>F</b>). C18:2-PC (■), C20:4-PC (●) and C22:6-PC (♦) represent the endogenous PC sub-groups containing a linoleic (C18:2n-6), arachidonic (C20:4n-6) or docosahexaenoic (C22:6n-3) acid residue, respectively, of all time points (N = 27), whereas their D9-choline-labeled analogues are indicated by open symbols (D9-C18:2-PC [□], D9-C20:4-PC [○] and D9-C22:6-PC [◊], respectively). Data are means ± SE at the respective time points (N = 8–10). †††, <span class="html-italic">p</span> &lt; 0.001 vs. 1.5 h; ‡‡, <span class="html-italic">p</span> &lt; 0.01, ‡‡‡, <span class="html-italic">p</span> &lt; 0.001 vs. 6 h.</p>
Full article ">Figure 7
<p>Choline trafficking in neonatal target organs. Arrows indicate the flux directions of choline and its metabolites between the lung, brain, intestine and liver via plasma and lymph fluid. Abbreviations: Chyl, chylomicron; PC, phosphatidylcholine; HDL, high-density lipoproteins, VLDL, very-low-density lipoproteins.</p>
Full article ">
11 pages, 316 KiB  
Article
Changes in Sugar Sweetened Beverage Intake Are Associated with Changes in Body Composition in Mexican Adolescents: Findings from the ELEMENT Cohort
by Lindsey English, Yanelli R. Carmona, Karen E. Peterson, Erica C. Jansen, Martha María Téllez Rojo, Libni Torres Olascoaga and Alejandra Cantoral
Nutrients 2022, 14(3), 719; https://doi.org/10.3390/nu14030719 - 8 Feb 2022
Cited by 5 | Viewed by 3542
Abstract
Changes in consumption of sugar sweetened beverage (SSBs) have been associated with increased body mass index (BMI), but little work has evaluated the effect on waist circumference (WC) and body fat percentage during adolescence, a period characterized by rapid growth and change in [...] Read more.
Changes in consumption of sugar sweetened beverage (SSBs) have been associated with increased body mass index (BMI), but little work has evaluated the effect on waist circumference (WC) and body fat percentage during adolescence, a period characterized by rapid growth and change in dietary behaviors. We examined the relationship of changes in SSB intake and changes in adiposity over two years in 464 Mexican adolescents. Food frequency questionnaires were used to sum intake of regular soda, coffee with sugar, tea with sugar, sweetened water with fruit, chocolate milk, corn atole, and a sweetened probiotic milk beverage. Linear regression models were used to estimate the associations of changes in SSBs with changes in BMI, body fat percentage, and WC, adjusting for sex, socioeconomic status, screen time, physical activity, age, and change in age. Adolescents who increased their daily SSB intake by >2 serving had a −2.72% higher body fat percentage (95% CI: 0.61, 4.82); a 1–2 serving increase was associated with a 2.49 cm increase (95% CI: 0.21, 4.76) in WC compared with those with no change in intake. Within an adolescent sample, changes in SSB intake were related to concomitant changes in body fat percentage and WC, but not BMI. Full article
14 pages, 2894 KiB  
Article
Betaine Supplementation Attenuates S-Adenosylhomocysteine Hydrolase-Deficiency-Accelerated Atherosclerosis in Apolipoprotein E-Deficient Mice
by Xin Dai, Si Liu, Lokyu Cheng, Ting Huang, Honghui Guo, Dongliang Wang, Min Xia, Wenhua Ling and Yunjun Xiao
Nutrients 2022, 14(3), 718; https://doi.org/10.3390/nu14030718 - 8 Feb 2022
Cited by 8 | Viewed by 3033
Abstract
S-adenosylhomocysteine (SAH) is a risk factor of cardiovascular diseases and atherosclerosis. However, the causal association between SAH and atherosclerosis is still uncertain. In the present study, heterozygous SAH hydrolase (SAHH+/−) knockout mice were bred with apolipoprotein E-deficient mice to produce ApoE [...] Read more.
S-adenosylhomocysteine (SAH) is a risk factor of cardiovascular diseases and atherosclerosis. However, the causal association between SAH and atherosclerosis is still uncertain. In the present study, heterozygous SAH hydrolase (SAHH+/−) knockout mice were bred with apolipoprotein E-deficient mice to produce ApoE−/−/SAHH+/− mice. At 8 weeks of age, these mice were fed on AIN-93G diets added with or without betaine (4 g betaine/100 g diet) for 8 weeks. Compared with ApoE−/−/SAHHWT mice, SAHH deficiency caused an accumulation of plasma SAH concentration and a decrease in S-adenosylmethionine (SAM)/SAH ratio as well as plasma homocysteine levels. Betaine supplementation lowered SAH levels and increased SAM/SAH ratio and homocysteine levels in ApoE−/−/SAHH+/− mice. Furthermore, SAHH deficiency promoted the development of atherosclerosis, which was reduced by betaine supplementation. The atheroprotective effects of betaine on SAHH-deficiency-promoted atherosclerosis were associated with inhibition of NFκB inflammation signaling pathway and inhibition of proliferation and migration of smooth muscle cells. In conclusion, our results suggest that betaine supplementation lowered plasma SAH levels and protected against SAHH-deficiency-promoted atherosclerosis through repressing inflammation and proliferation and migration of smooth muscle cells. Full article
(This article belongs to the Section Phytochemicals and Human Health)
Show Figures

Figure 1

Figure 1
<p>The body weight and daily intake of food and plasma lipids levels of ApoE<sup>−/−</sup>/SAHH<sup>WT</sup> and ApoE<sup>−/−</sup>/SAHH<sup>+/−</sup> mice with or without betaine supplementation. At 8 weeks of age, ApoE<sup>−/−</sup>/SAHH<sup>+/−</sup> mice and their littermate ApoE<sup>−/−</sup>/SAHH<sup>WT</sup> mice were fed with AIN-93G diets with or without added betaine (4 g betaine/100 g diet) for 8 weeks. (<b>A</b>) Change of body weights throughout the whole study among the three groups mice, <span class="html-italic">n</span> = 10 for each group. (<b>B</b>) Daily food intake of the three groups mice, <span class="html-italic">n</span> = 10 for each group. (<b>C</b>–<b>F</b>) The plasma lipids levels, <span class="html-italic">n</span> = 6 for each group. Values are mean ± SEM. <span class="html-italic">p</span> &gt; 0.05 (determined by one-way ANOVA).</p>
Full article ">Figure 2
<p>Betaine supplementation lowered SAHH deficiency-accumulated plasma SAH in ApoE<sup>−/−</sup>/SAHH<sup>+/−</sup> mice. Plasma SAH (<b>A</b>) and SAM (<b>B</b>) levels were assessed by HPLC-MS/MS, <span class="html-italic">n</span> = 6 for each group. (<b>C</b>) The ratio of plasma SAM/SAH, <span class="html-italic">n</span> = 6 for each group. (<b>D</b>) The plasma levels of tHcy were measured by HPLC-FD, <span class="html-italic">n</span> = 6 for each group. Values are mean ± SEM; * <span class="html-italic">p</span> &lt; 0.05 vs. WT; <sup>#</sup> <span class="html-italic">p</span> &lt; 0.05 vs. Control (determined with one-way ANOVA).</p>
Full article ">Figure 3
<p>Betaine supplementation alleviated atherosclerotic lesions in ApoE<sup>−/−</sup>/SAHH<sup>+/−</sup> mice. (<b>A</b>) Representative sections of aortic sinuses were stained by Oil Red O among the three groups of mice and (<b>B</b>) quantitative analyses of atherosclerotic lesions areas in aortic sinuses in three groups of mice, magnification 100×, <span class="html-italic">n</span> = 10 for each group. Values are mean ± SEM; * <span class="html-italic">p</span> &lt; 0.05 vs. WT; <sup>#</sup> <span class="html-italic">p</span> &lt; 0.05 vs. Control (determined with one-way ANOVA).</p>
Full article ">Figure 4
<p>Betaine supplementation lowered SAH levels by increasing the expression of BHMT in ApoE<sup>−/−</sup>/SAHH<sup>+/−</sup> mice. (<b>A</b>) Western blot analyses; the protein expression of betaine homocysteine S-methyltransferase (BHMT) in the aortas of the three groups, <span class="html-italic">n</span> = 6 for each group. (<b>B</b>) Mouse artery endothelial cells (MAECs) isolated from aortas of ApoE<sup>−/−</sup>/SAHH<sup>+/−</sup> mice were transfected with BHMT siRNA or scrambled siRNA; the protein expression of BHMT was determined by Western blot; <span class="html-italic">n</span> = 3 for each group. (<b>C</b>) Intracellular SAH levels were measured by HPLC-MS/MS in MAECs and vascular smooth muscle cells (VSMCs) isolated from aortas of ApoE<sup>−/−</sup>/SAHH<sup>+/−</sup> mice and treated with betaine (1 mmol/L) in the presence or absence of BHMT siRNA transfection, <span class="html-italic">n</span> = 3 for each group. Values are mean ± SEM; * <span class="html-italic">p</span> &lt; 0.05 vs. WT; # <span class="html-italic">p</span> &lt; 0.05 vs. Control or scrambled siRNA (determined with one-way ANOVA).</p>
Full article ">Figure 5
<p>The effect of SAHH deficiency and betaine supplementation on atherosclerotic phenotype in ApoE<sup>−/−</sup>/SAHH<sup>+/−</sup> mice. (<b>A</b>) Representative sections and quantitative analyses of aortic sinuses stained with antibodies specific for CD68<sup>+</sup> macrophages, <span class="html-italic">n</span> = 6, 7, 7 for three groups, respectively; smooth muscle actin (SMA) for smooth muscle cells, <span class="html-italic">n</span> = 7 for each group; proliferating cells were stained with anti-proliferating cell nuclear antigen (PCNA) monoclonal antibody, <span class="html-italic">n</span> = 8 for each group. Scale bars = 100 μm, magnification 200×. (<b>B</b>) The protein expression of CD68, SMA, and PCNA were measured by Western blot in the aortas of the three groups, <span class="html-italic">n</span> = 6 for each group. Results are presented as mean ± SEM; * <span class="html-italic">p</span> &lt; 0.05 vs. ApoE<sup>−/−</sup>/SAHH<sup>WT</sup>; <sup>#</sup> <span class="html-italic">p</span> &lt; 0.05 vs. control group (determined by one-way ANOVA).</p>
Full article ">Figure 6
<p>The effect of SAHH deficiency and betaine supplementation on expression of inflammatory markers in ApoE<sup>−/−</sup>/SAHH<sup>+/−</sup> mice. (<b>A</b>) Representative photomicrographs and quantitative analyses of immunohistochemical staining for expression of MCP-1 (<span class="html-italic">n</span> = 7 for each group), VCAM-1 (<span class="html-italic">n</span> = 8 for each group), and ICAM-1 (<span class="html-italic">n</span> = 8 for each group) in atherosclerotic lesions of aortic sinuses from ApoE<sup>−/−</sup>/SAHH<sup>+/−</sup> mice with or without betaine supplementation. Scale bars = 50 μm, magnification 400×. (<b>B</b>) The protein expression of MCP-1, VCAM-1, ICAM-1, and p-NFκB/p65 were measured by Western blot in the aortas of the three groups, <span class="html-italic">n</span> = 6 for each group. Results are presented as mean ± SEM; * <span class="html-italic">p</span> &lt; 0.05 vs. ApoE<sup>−/−</sup>/SAHH<sup>WT</sup>; <sup>#</sup> <span class="html-italic">p</span> &lt; 0.05 vs. Control; (determined by one-way ANOVA).</p>
Full article ">Figure 7
<p>The effect of SAHH deficiency and betaine supplementation on the proliferation and migration of VSMCs isolated from aortas of ApoE<sup>−/−</sup>/SAHH<sup>+/−</sup> mice. (<b>A</b>,<b>B</b>) The proliferation and migration of VSMCs isolated from aortas of ApoE<sup>−/−</sup>/SAHH<sup>+/−</sup> mice were detected by WST-1 and wound healing and transwell assay; <span class="html-italic">n</span> = 3 independent experiments, magnification 100×. (<b>C</b>) The mRNA expression of MMP2 and MMP9 were measured by RT-qPCR in aortas of the three groups, <span class="html-italic">n</span> = 6 for each group; (<b>D</b>) The protein expression of p-ERK and total ERK were measured by Western blot in the aortas of the three groups, <span class="html-italic">n</span> = 6 for each group. Results are presented as mean ± SEM; * <span class="html-italic">p</span> &lt; 0.05 vs. ApoE<sup>−/−</sup>/SAHH<sup>WT</sup>; <sup>#</sup> <span class="html-italic">p</span> &lt; 0.05 vs. Control; (determined by one-way ANOVA).</p>
Full article ">
14 pages, 1194 KiB  
Article
A Rapid and Cheap Method for Extracting and Quantifying Lycopene Content in Tomato Sauces: Effects of Lycopene Micellar Delivery on Human Osteoblast-Like Cells
by Rosario Mare, Samantha Maurotti, Yvelise Ferro, Angelo Galluccio, Franco Arturi, Stefano Romeo, Antonio Procopio, Vincenzo Musolino, Vincenzo Mollace, Tiziana Montalcini and Arturo Pujia
Nutrients 2022, 14(3), 717; https://doi.org/10.3390/nu14030717 - 8 Feb 2022
Cited by 8 | Viewed by 3664
Abstract
Identifying and quantifying the beneficial molecules contained in nutraceuticals is essential to predict the effects derived from their consumption. This study explores a cheap and rapid method for quantifying lycopene content from a semi-solid matrix. In addition, it compares the in vitro effects [...] Read more.
Identifying and quantifying the beneficial molecules contained in nutraceuticals is essential to predict the effects derived from their consumption. This study explores a cheap and rapid method for quantifying lycopene content from a semi-solid matrix. In addition, it compares the in vitro effects of the extracts obtained from different tomato sauces available on the local market with Osteocol®, a patented tomato sauce from southern Italy. We performed a liquid extraction of lycopene using suitable solvents. The lycopene extracted was encapsulated in surfactant micelles and finally tested in vitro on Saos-2 cells. The effects exerted by lycopene on ALP and Wnt/β-catenin pathways were investigated by Western blotting. Hexane was found to be the best solvent for lycopene extraction. Spectrophotometrical and HPLC analyses showed similar trends. Osteocol® contained 39 ± 4 mg lycopene per 100 g of sauce, while the best commercial product contained 19 ± 1 mg/100 g. The Osteocol® lycopene extract increased ALP and β-catenin protein expressions in a dose-dependent manner, also showing statistically significant results (p < 0.05 respectively). In conclusion, despite both techniques showing similar final results, UV/VIS spectrophotometer is preferable to HPLC due to its cheap, rapid, and accurate results, as well as for the opportunity to analyze lycopene-loaded micelles. The extraction and release of lycopene to bone cells positively influences the differentiation of osteoblasts and increases the expression of the ALP and β-catenin proteins. As a consequence, as a lycopene-rich sauce, Osteocol® represents a useful supplement in the prevention of osteoporosis compared to its commercial competitors. Full article
(This article belongs to the Section Phytochemicals and Human Health)
Show Figures

Graphical abstract

Graphical abstract
Full article ">Figure 1
<p>Influence of solvent ratio and incubation time in lycopene extraction. All data are the mean of three different experiments ± standard deviation.</p>
Full article ">Figure 2
<p>Lycopene content (mg/100 g sauce) in Osteocol and Sauce#1 ((<b>A</b>)—<b>left</b>) and data adjusted ((<b>A</b>)—<b>right</b>) as a function of the water content in each sauce (<b>B</b>). All data are the means of three different experiments ± standard deviation (Student’s <span class="html-italic">t</span>-test **** <span class="html-italic">p</span> &lt; 0.001).</p>
Full article ">Figure 3
<p>Spectrophotometric scansions between 300 and 650 nm in wavelength. Lycopene standard characteristic peaks were ~472 nm and ~502 nm. Lycopene-based nanoparticles all had a new characteristic peak at ~350 nm, not obtained with empty micelles.</p>
Full article ">Figure 4
<p>(<b>A</b>) Influence exerted by lycopene loaded micelles on β-catenin pathways protein levels; (<b>B</b>) influence exerted by lycopene loaded micelles on ALP protein expression. Cell proteins were analyzed by Western blotting with specific antibodies for each pathway. All data are the means of three different experiments ± standard deviation. Statistical analysis: Student’s <span class="html-italic">t</span>-test vs. 0 * <span class="html-italic">p</span> &lt; 0.05; linear regression <sup>#</sup> <span class="html-italic">p</span> &lt; 0.05.</p>
Full article ">
19 pages, 6803 KiB  
Article
Simvastatin Improves Microcirculatory Function in Nonalcoholic Fatty Liver Disease and Downregulates Oxidative and ALE-RAGE Stress
by Evelyn Nunes Goulart da Silva Pereira, Beatriz Peres de Araujo, Karine Lino Rodrigues, Raquel Rangel Silvares, Carolina Souza Machado Martins, Edgar Eduardo Ilaquita Flores, Caroline Fernandes-Santos and Anissa Daliry
Nutrients 2022, 14(3), 716; https://doi.org/10.3390/nu14030716 - 8 Feb 2022
Cited by 17 | Viewed by 3537
Abstract
Increased reactive oxidative stress, lipid peroxidation, inflammation, and fibrosis, which contribute to tissue damage and development and progression of nonalcoholic liver disease (NAFLD), play important roles in microcirculatory disorders. We investigated the effect of the modulatory properties of simvastatin (SV) on the liver [...] Read more.
Increased reactive oxidative stress, lipid peroxidation, inflammation, and fibrosis, which contribute to tissue damage and development and progression of nonalcoholic liver disease (NAFLD), play important roles in microcirculatory disorders. We investigated the effect of the modulatory properties of simvastatin (SV) on the liver and adipose tissue microcirculation as well as metabolic and oxidative stress parameters, including the advanced lipoxidation end product–receptors of advanced glycation end products (ALE-RAGE) pathway. SV was administered to an NAFLD model constructed using a high-fat–high-carbohydrate diet (HFHC). HFHC caused metabolic changes indicative of nonalcoholic steatohepatitis; treatment with SV protected the mice from developing NAFLD. SV prevented microcirculatory dysfunction in HFHC-fed mice, as evidenced by decreased leukocyte recruitment to hepatic and fat microcirculation, decreased hepatic stellate cell activation, and improved hepatic capillary network architecture and density. SV restored basal microvascular blood flow in the liver and adipose tissue and restored the endothelium-dependent vasodilatory response of adipose tissue to acetylcholine. SV treatment restored antioxidant enzyme activity and decreased lipid peroxidation, ALE-RAGE pathway activation, steatosis, fibrosis, and inflammatory parameters. Thus, SV may improve microcirculatory function in NAFLD by downregulating oxidative and ALE-RAGE stress and improving steatosis, fibrosis, and inflammatory parameters. Full article
Show Figures

Figure 1

Figure 1
<p>SV protects against nonalcoholic fatty liver disease (NAFLD)-induced metabolic changes. Schematic representation of the experimental protocol used to assess the effect of SV on NAFLD (<b>A</b>). Hemodynamic and metabolic parameters of mice fed control diet (CTL+Veh), control diet plus SV (CTL+SV), high-fat–high-carbohydrate (HFHC) diet (HFHC+Veh), or HFHC diet plus Simvastatin treatment (HFHC+SV) are show as: Body weight (<b>B</b>), fat content (<b>D</b>), liver weight (<b>E</b>) and biochemical parameters (<b>F</b>). * <span class="html-italic">p</span> &lt; 0.05 vs. CTL+Veh; ** <span class="html-italic">p</span> &lt; 0.01 vs. CTL+Veh; *** <span class="html-italic">p</span> &lt; 0.001 vs. CTL+Veh; <sup>#</sup> <span class="html-italic">p</span> &lt; 0.05 CTL+SV; <sup>##</sup> <span class="html-italic">p</span> &lt; 0.01 CTL+SV; <sup>###</sup> <span class="html-italic">p</span> &lt; 0.001 vs. CTL+SV; <sup>†</sup> <span class="html-italic">p</span> &lt; 0.05 HFHC+SV; <sup>††</sup> <span class="html-italic">p</span> &lt; 0.01 HFHC+SV. Oral glucose tolerance test (OGTT) is demonstrated in (<b>C</b>). Area under the curve (AUC) of glucose was calculated using the trapezoidal rule (<b>C</b>). * <span class="html-italic">p</span> &lt; 0.05 CTL+Veh vs. HFHC+Veh; ** <span class="html-italic">p</span> &lt; 0.01 CTL+Veh vs. HFHC+Veh; <sup>#</sup> <span class="html-italic">p</span> &lt; 0.05 CTL+Veh vs. HFHC+SV; <sup>##</sup> <span class="html-italic">p</span> &lt; 0.01 CTL+Veh vs. HFHC+SV; <sup>&amp;</sup> <span class="html-italic">p</span> &lt; 0.05 CTL+SV vs. HFHC+Veh; <sup><span>$</span></sup> <span class="html-italic">p</span> &lt; 0.05 CTL+SV vs. HFHC+SV.</p>
Full article ">Figure 2
<p>SV protects against HFHC-induced hepatic steatosis and fibrosis progression. Representative images of histological analyses via hematoxylin-eosin staining of the livers from mice fed control diet (CTL+Veh), control diet plus SV (CTL+SV), HFHC diet (HFHC+Veh), or HFHC diet plus SV treatment (HFHC+SV) (<b>A</b>). Quantification of percentage of hepatic steatosis is represented in (<b>B</b>) and NAFLD activity score (NAS) in (<b>C</b>). Real-time PCR analyses of mRNA transcript levels of gene encoding liver-type fatty acid-binding protein (<span class="html-italic">L-FABP</span>) is shown in (<b>D</b>). Representative images of histological analyses via Masson’s trichrome staining of the livers from the CTL+Veh, CTL+SV, HFHC+Veh or HFHC+SV group (<b>E</b>). (<b>F</b>) Demonstration of quantification of percentage of hepatic fibrosis area. Real-time PCR analyses of mRNA transcript levels of gene encoding collagen type I alpha 1 (<span class="html-italic">COL1A1</span>) is shown in (<b>G</b>). Arrow: Lipid vacuoles; Letter B: Hydropic degeneration. * <span class="html-italic">p</span> &lt; 0 vs. CTL+Veh; *** <span class="html-italic">p</span> &lt; 0.001 vs. CTL+Veh; <sup>#</sup> <span class="html-italic">p</span> &lt; 0.05 CTL+SV; <sup>##</sup> <span class="html-italic">p</span> &lt; 0.01 CTL+SV; <sup>###</sup> <span class="html-italic">p</span> &lt; 0.001 vs. CTL+SV; <sup>††</sup> <span class="html-italic">p</span> &lt; 0.01 HFHC+SV; <sup>†††</sup> <span class="html-italic">p</span> &lt; 0.001 HFHC+SV.</p>
Full article ">Figure 3
<p>SV prevents microcirculatory dysfunction in HFHC-fed mice. Liver (<b>A</b>) and adipose tissue (<b>B</b>) microcirculation assessed via intravital microscopy following intravenous administering of rhodamine 6G with quantification of adhesion and rolling of leukocytes. Representative immunohistochemical staining of liver sections showing expression of alpha smooth muscle actin (α-SMA) in mice fed with control diet (CTL+Veh), control diet plus SV (CTL+SV), HFHC diet (HFHC+Veh), or HFHC plus SV treatment (HFHC+SV) (<b>C</b>). Quantification of the percentage of α-SMA-positive area is represented in (<b>D</b>). In vivo distribution (<b>E</b>) and quantification (<b>F</b>) of vitamin A-positive cells indicative of retinoid storage in cytoplasmic droplets of hepatic stellate cells. Representative intravital fluorescence microscopic images (<b>G</b>) and quantification (<b>H</b>) of sinusoidal perfusion density in the liver following intravenous administering of fluorescein isothiocyanate-labeled dextran. ** <span class="html-italic">p</span> &lt; 0.01 vs. CTL+Veh; *** <span class="html-italic">p</span> &lt; 0.001 vs. CTL+Veh; <sup>##</sup> <span class="html-italic">p</span> &lt; 0.01 CTL+SV; <sup>###</sup> <span class="html-italic">p</span> &lt; 0.001 vs. CTL+SV; <sup>†</sup> <span class="html-italic">p</span> &lt; 0.05 HFHC+SV; <sup>††</sup> <span class="html-italic">p</span> &lt; 0.01 HFHC+SV; <sup>†††</sup> <span class="html-italic">p</span> &lt; 0.001 HFHC+SV.</p>
Full article ">Figure 4
<p>Effect of SV on hepatic and visceral adipose tissue microvascular perfusion. Liver and epididymal adipose tissue microvascular blood flow assessed by laser speckle contrast imaging (LSCI). Representative images of LSCI and microvascular blood flow quantification in the left lateral hepatic lobe (LLL) (<b>A</b>) or epididymal fat deposit (<b>B</b>) in mice fed with control diet (CTL+Veh), control diet plus SV (CTL+SV), HFHC diet (HFHC+Veh), or HFHC diet plus SV treatment (HFHC+SV). The color scale represents blood flow in arbitrary perfusion units (APUs). Percentage of change in adipose tissue blood flow following topical administering of crescent doses of 2% acetylcholine (Ach) is demonstrated in (<b>C</b>). * <span class="html-italic">p</span> &lt; 0.05 vs. CTL+Veh; ** <span class="html-italic">p</span> &lt; 0.01 vs. CTL+Veh; *** <span class="html-italic">p</span> &lt; 0.001 vs. CTL+Veh; <sup>#</sup> <span class="html-italic">p</span> &lt; 0.05 CTL+SV; <sup>###</sup> <span class="html-italic">p</span> &lt; 0.001 vs. CTL+SV; <sup>†††</sup> <span class="html-italic">p</span> &lt; 0.001 vs. HFHC+SV.</p>
Full article ">Figure 5
<p>SV protects against NAFLD-induced oxidative damage and inflammation. Levels of malondialdehyde (MDA) indicating lipid peroxidation assessed by thiobarbituric acid reactive species (TBARs) (<b>A</b>,<b>D</b>), catalase enzyme activity (<b>B</b>,<b>E</b>) and superoxide dismutase enzyme activity (<b>C</b>,<b>F</b>) in the liver and epidydimal adipose tissues in mice fed with control diet (CTL+Veh), control diet plus SV (CTL+SV), HFHC diet (HFHC+Veh), or HFHC diet plus SV treatment (HFHC+SV). Hepatic advanced lipoxidation end product (ALE) deposition (<b>G</b>), receptors of advanced glycation end products (RAGE) protein expression in the liver (<b>H</b>), nitrite levels indicative of NO (<b>I</b>), and iNOS protein expression (<b>J</b>). Pearson’s correlation analysis between ALE deposition in the liver and metabolic and microcirculatory parameters (<b>K</b>). * <span class="html-italic">p</span> &lt; 0.05 vs. CTL+Veh; ** <span class="html-italic">p</span> &lt; 0.01 vs. CTL+Veh; *** <span class="html-italic">p</span> &lt; 0.001 vs. CTL+Veh; <sup>#</sup> <span class="html-italic">p</span> &lt; 0.05 vs. CTL+SV; <sup>##</sup> <span class="html-italic">p</span> &lt; 0.01 vs. CTL+SV; <sup>###</sup> <span class="html-italic">p</span> &lt; 0.001 vs. CTL+SV; <sup>†</sup> <span class="html-italic">p</span> &lt; 0.05 vs. HFHC+SV; <sup>††</sup> <span class="html-italic">p</span> &lt; 0.01 vs. HFHC+SV; <sup>†††</sup> <span class="html-italic">p</span> &lt; 0.001 vs. HFHC+SV.</p>
Full article ">Figure 6
<p>The impact of oral treatment with SV on the development of NAFLD. SV acts on multiple key insults that together contribute to the onset and progression of NAFLD. In this context, SV protects against NAFLD-induced (i) metabolic changes, (ii) microcirculatory dysfunction, and (iii) oxidative damage and inflammation. HSC: Hepatic stellate cells; RBC: Red blood cell; PMN: Polymorphonuclear leukocytes; KC: Kupffer cells; SEC: Liver sinusoidal endothelial cells; HC: Hepatocytes.</p>
Full article ">
13 pages, 2818 KiB  
Article
Molecular Iodine Supplement Prevents Streptozotocin-Induced Pancreatic Alterations in Mice
by Julia Rodríguez-Castelán, Evangelina Delgado-González, Valentin Varela-Floriano, Brenda Anguiano and Carmen Aceves
Nutrients 2022, 14(3), 715; https://doi.org/10.3390/nu14030715 - 8 Feb 2022
Cited by 5 | Viewed by 2403
Abstract
Pancreatitis has been implicated in the development and progression of type 2 diabetes and cancer. The pancreas uptakes molecular iodine (I2), which has anti-inflammatory and antioxidant effects. The present work analyzes whether oral I2 supplementation prevents the pancreatic alterations promoted [...] Read more.
Pancreatitis has been implicated in the development and progression of type 2 diabetes and cancer. The pancreas uptakes molecular iodine (I2), which has anti-inflammatory and antioxidant effects. The present work analyzes whether oral I2 supplementation prevents the pancreatic alterations promoted by low doses of streptozotocin (STZ). CD1 mice (12 weeks old) were divided into the following groups: control; STZ (20 mg/kg/day, i.p. for five days); I2 (0.2 mg/Kg/day in drinking water for 15 days); and combined (STZ + I2). Inflammation (Masson’s trichrome and periodic acid–Schiff stain), hyperglycemia, decreased β-cells and increased α-cells in pancreas were observed in male and female animals with STZ. These animals also showed pancreatic increases in immune cells and inflammation markers as tumor necrosis factor-alpha, transforming growth factor-beta and inducible nitric oxide synthase with a higher amount of activated pancreatic stellate cells (PSCs). The I2 supplement prevented the harmful effect of STZ, maintaining normal pancreatic morphometry and functions. The elevation of the nuclear factor erythroid-2 (Nrf2) and peroxisome proliferator-activated receptor type gamma (PPARγ) contents was associated with the preservation of normal glycemia and lipoperoxidation. In conclusion, a moderated supplement of I2 prevents the deleterious effects of STZ in the pancreas, possibly through antioxidant and antifibrotic mechanisms including Nrf2 and PPARγ activation. Full article
(This article belongs to the Section Micronutrients and Human Health)
Show Figures

Figure 1

Figure 1
<p>Body weight change, food and water consumption and glucose levels in male and female rats. Results are expressed as mean ± SEM. Different letters indicate statistical differences between groups (one-way ANOVA, Tukey’s test; <span class="html-italic">p</span> &lt; 0.05).</p>
Full article ">Figure 2
<p>Histological characteristics of pancreatic acinus: (<b>a</b>) micrographs showing the presence of proteoglycans (black arrows, in Periodic Acid-Schiff stain), edema (black arrows, in PAS stain) and inflammatory cell infiltration (yellow arrows, in PAS stain) and collagen (black arrows in Masson’s trichrome). Scale: PAS stain 100 µm (first row); and 20 µm (second row); Masson’s t. 20 µm; and (<b>b</b>) representative micrographs of pancreas damage (20 µm) and quantitative analysis of the histological score. Data are expressed as the mean ± SEM, and different letters indicate a statistical difference between groups (one-way ANOVA, Tukey’s test; <span class="html-italic">p</span> &lt; 0.05).</p>
Full article ">Figure 3
<p>Morphological pancreatic islets and vasculature: (<b>a</b>) PAS stain micrography showing proteoglycans and immune cell infiltration (black arrows, in PAS stain) and collagen (black arrows, in Masson’s stain) in pancreatic islets. Quantitative analysis (% of islet) of the degree of insulitis according to the histological characteristics; (<b>b</b>) microphotography of vessels (CD34+ protein) and quantification (Western blot); and VEGF quantification (Western blot). Scale = 50 µm. Data are expressed as mean ± SEM, and different letters indicate a statistical difference between groups (one-way ANOVA, Tukey’s test; <span class="html-italic">p</span> &lt; 0.05), STZ, streptozotocin.</p>
Full article ">Figure 4
<p>Localization and quantification of α- and β-cells and Pancreatic stellate cells (PSC )activation. The characteristics of pancreatic islets: (<b>a</b>) the number and area of islets; (<b>b</b>) the microphotography of insulin and glucagon immune stain (50 µm, black arrows) and α-cells and β-cells quantification (%); and (<b>c</b>) microphotography (20 µm) of quiescent PSCs (glial fibrillary acidic protein (GFAP)+, immunohistochemistry, black arrows), active PSCs (α-smooth muscle actin α-SMA, black arrows) and quantifications per field. Data are expressed as the mean ± SEM, and different letters indicate a statistical difference between groups (one-way ANOVA, Tukey’s test; <span class="html-italic">p</span> &lt; 0.05). Pancreatic stellate cells (PCS), glial fibrillary acidic protein (GFAP), α-smooth muscle actin (α-SMA).</p>
Full article ">Figure 5
<p>Inflammation markers in pancreas: (<b>a</b>) tumor necrosis factor alpha (TNFα), IL10, transforming growth factor-beta (TGFβ) and CD8-a protein (CD8-a) quantification; (<b>b</b>) microphotography of representative iNOS (50 µm, black arrows) and quantification. Data are expressed as mean ± SEM, and different letters indicate a statistical difference between groups (one-way ANOVA, Tukey’s test; <span class="html-italic">p</span> &lt; 0.05).</p>
Full article ">Figure 6
<p>Pancreatic antioxidant status and peroxisome proliferator-activated receptor type gamma PPARγ phosphorylation. Lipoperoxidation (expressed as micromoles of malondialdehyde (MDA) per micrograms of protein), superoxide dismutase type 1 (Sod1) and catalase (Cat) expression (qRT-PCR). Amount (Western blot) of NF-E2-related factor 2 (Nrf2) and PPARγ. The deactivated PPARγ amount was calculated by the phosphorylated PPARγ/active PPARγ ratio. Data are expressed as the mean ± SEM, and different letters indicate a statistical difference between groups (one-way ANOVA, Tukey’s test; <span class="html-italic">p</span> &lt; 0.05). PPAR: peroxisome proliferator-activated receptor type gamma.</p>
Full article ">
4 pages, 187 KiB  
Editorial
Magnesium in Type 2 Diabetes Mellitus, Obesity, and Metabolic Syndrome
by Mario Barbagallo, Nicola Veronese and Ligia J. Dominguez
Nutrients 2022, 14(3), 714; https://doi.org/10.3390/nu14030714 - 8 Feb 2022
Cited by 19 | Viewed by 5179
Abstract
Metabolic syndrome is a constellation of risk factors, including obesity, hypertension, insulin resistance, and altered lipid profile, which, if left untreated, will often progress to type 2 diabetes, which frequently complicates the syndrome [...] Full article
(This article belongs to the Section Nutrition and Metabolism)
7 pages, 1373 KiB  
Article
Boosting Whole-Grain Utilization in the Consumer Market: A Case Study of the Oldways Whole Grains Council’s Stamped Product Database
by Caroline Sluyter, Kelly LeBlanc and Kristen Hicks-Roof
Nutrients 2022, 14(3), 713; https://doi.org/10.3390/nu14030713 - 8 Feb 2022
Cited by 8 | Viewed by 4282
Abstract
Whole grains are a vital part of a healthy diet, yet there are insufficient data on the whole-grain content of commercial food products. The purpose of this research is to examine the long-term change in (1) measured whole grains in food products, (2) [...] Read more.
Whole grains are a vital part of a healthy diet, yet there are insufficient data on the whole-grain content of commercial food products. The purpose of this research is to examine the long-term change in (1) measured whole grains in food products, (2) Whole Grain Stamp usage and (3) the prominence of whole-grain ingredients and product categories, across the United States and Latin America. These changes were quantified by analyzing the Oldways Whole Grains Council’s (WGC) Stamped Product Database from 2007 to 2020. Mean whole grains increased 36–76%, from 19 grams to 25.8 grams per serving in the U.S. and 18.1 grams to 31.9 grams per serving in Latin America. Whole Grain Stamp usage worldwide has increased from 250 products in 2005 to more than 13,000 products in 2020. These findings suggest that manufacturers are increasing the percentage of the grain that is whole in their products and developing more whole-grain products for consumers, thus providing an opportunity for consumers to meet national-level whole-grain recommendations. Full article
(This article belongs to the Section Nutrition and Public Health)
Show Figures

Figure 1

Figure 1
<p>Whole Grain Stamps.</p>
Full article ">Figure 2
<p>Whole-grain gram content of Whole Grain Stamped products.</p>
Full article ">Figure 3
<p>Whole Grain Stamp growth in the U.S. and internationally.</p>
Full article ">Figure 4
<p>Whole Grain Stamp growth in Latin America.</p>
Full article ">
21 pages, 2212 KiB  
Article
Co-Administration of Iron and Bioavailable Curcumin Reduces Levels of Systemic Markers of Inflammation and Oxidative Stress in a Placebo-Controlled Randomised Study
by Helena Tiekou Lorinczova, Gulshanara Begum, Lina Temouri, Derek Renshaw and Mohammed Gulrez Zariwala
Nutrients 2022, 14(3), 712; https://doi.org/10.3390/nu14030712 - 8 Feb 2022
Cited by 18 | Viewed by 5072
Abstract
Ferrous sulphate (FS) is widely used as an iron supplement to treat iron deficiency (ID), but is known to induce inflammation causing gastric side-effects resulting in poor adherence to supplement regimens. Curcumin, a potent antioxidant, has been reported to suppress inflammation via down [...] Read more.
Ferrous sulphate (FS) is widely used as an iron supplement to treat iron deficiency (ID), but is known to induce inflammation causing gastric side-effects resulting in poor adherence to supplement regimens. Curcumin, a potent antioxidant, has been reported to suppress inflammation via down regulation of NF-κB. The aim of the present double blind, placebo-controlled randomised trial was to assess whether co-administration of FS with a formulated, bioavailable form of curcumin (HydroCurc™) could reduce systemic inflammation and/or gastrointestinal side-effects. This study recruited 155 healthy participants (79 males; 26.42 years ± 0.55 and 76 females; 25.82 years ± 0.54), randomly allocated to one of five different treatment groups: iron and curcumin placebo (FS0_Plac), low dose (18 mg) iron and curcumin placebo (FS18_Plac), low dose iron and curcumin (FS18_Curc), high dose (65 mg) iron and curcumin placebo (FS65_Plac), and high dose iron and curcumin (FS65_Curc). Completed questionnaires and blood samples were collected from all participants at baseline (day 1), mid-point (day 21), and at end-point (day 42). Results showed a significant reduction in IL-6 in the FS65_Curc group (0.06 pg/mL ± 0.02, p = 0.0073) between the mid-point and end-point. There was also a significant reduction in mean plasma TNF levels in the FS65_Curc (0.65 pg/mL ± 0.17, p = 0.0018), FS65_Plac (0.39 pg/mL ± 0.15, p = 0.0363), and FS18_Curc (0.35 pg/mL ± 0.13, p = 0.0288) groups from mid-point to end-point. A significant increase was observed in mean plasma TBARS levels (0.10 µM ± 0.04, p = 0.0283) in the F18_Plac group from baseline to end-point. There was a significant association with darker stools between FS0_Plac vs. FS65_Plac (p = 0.002, Fisher’s exact test) suggesting that high iron dose in the absence of curcumin leads to darker stools. A reduction in inflammation-related markers in response to co-administering supplemental iron alongside formulated curcumin suggests a reduction in systemic inflammation. This supplementation approach may therefore be a more cost effective and convenient alternative to current oral iron-related treatments, with further research to be conducted. Full article
(This article belongs to the Section Phytochemicals and Human Health)
Show Figures

Figure 1

Figure 1
<p>Overview of study. Participants meeting study inclusion criteria during screening were randomly assigned to one of the five treatment groups. At baseline (day 1) anthropometric measurements, blood samples, and questionnaires were obtained from the participants. At mid-point (day 21) and end-point (day 42), blood samples and questionnaires were collected from the study volunteers.</p>
Full article ">Figure 2
<p>Effect of supplementation on plasma IL-6 levels for participants with ferritin ≥ 30 ng/mL at baseline (<span class="html-italic">n</span> = 17–22 per group). Plasma IL-6 was collected and analysed at baseline (day 1), midpoint (day 21), and end-point (day 42). Results are presented as mean ± SEM IL-6 levels (pg/mL). * represents significance values when comparing each condition and time points within the same condition. (* <span class="html-italic">p</span> &lt; 0.05, ** <span class="html-italic">p</span> &lt; 0.01).</p>
Full article ">Figure 3
<p>Effect of supplementation on plasma TNF levels (<span class="html-italic">n</span> = 29–31 per group). Plasma TNF was collected and analysed at baseline (day 1), mid-point (day 21), and end-point (day 42). Results are presented as mean ± SEM TNF levels (pg/mL). * represents significance values when comparing each condition and time points within the same condition. (* <span class="html-italic">p</span> &lt; 0.05, ** <span class="html-italic">p</span> &lt; 0.01).</p>
Full article ">Figure 4
<p>Effect of supplementation on plasma TBARS levels. Plasma TBARS was analysed at baseline (day 1), mid-point (day 21), and end-point (day 42). Results are presented as mean ± SEM TBARS levels (µM) in (<b>A</b>) whole group analysis (<span class="html-italic">n</span> = 28–30/group), (<b>B</b>) participants with ferritin ≥30 ng/mL at baseline (<span class="html-italic">n</span> = 17–22/group), and (<b>C</b>) participants with ferritin ≥ 50 ng/mL at baseline (<span class="html-italic">n</span> = 11–16/group). * represents significance values when comparing each condition and time points within the same condition (* <span class="html-italic">p</span> &lt; 0.05, ** <span class="html-italic">p</span> &lt; 0.01).</p>
Full article ">Figure 5
<p>Effect of supplementation on serum ferritin levels. Serum ferritin was collected and analysed at baseline (day 1), mid-point (day 21), and end-point (day 42). Results are presented as mean ± SEM ferritin levels (ng/mL) in (<b>A</b>) participants with ferritin &lt; 30 ng/mL at baseline (<span class="html-italic">n</span> = 7–13 per group) and (<b>B</b>) participants with ferritin &lt; 50 ng/mL at baseline (<span class="html-italic">n</span> = 14–21/group). * represents significance values when comparing each condition and time points within the same condition (* <span class="html-italic">p</span> &lt; 0.05, ** <span class="html-italic">p</span> &lt; 0.01, *** <span class="html-italic">p</span> &lt; 0.001, **** <span class="html-italic">p</span> &lt; 0.0001).</p>
Full article ">Figure 6
<p>Effect of supplementation on serum TIBC levels. Results are presented as mean ± SEM TIBC levels (µmol/L) in whole group analysis (<span class="html-italic">n</span> = 29–31 per group). Serum TIBC was collected and analysed at baseline (day 1), mid-point (day 21), and end-point (day 42). * represents significance values when comparing each condition and time points within the same condition. (* <span class="html-italic">p</span> &lt; 0.05).</p>
Full article ">
13 pages, 274 KiB  
Article
A Sample of Female Adolescent Self-Identified Vegetarians in New Zealand Consume Less Protein and Saturated Fat, but More Fiber than Their Omnivorous Peers
by Meredith Peddie, Tessa Scott, Chaya Ranasinghe, Elizabeth Fleming, Kirsten Webster, Rachel Brown, Lisa Houghton and Jillian Haszard
Nutrients 2022, 14(3), 711; https://doi.org/10.3390/nu14030711 - 8 Feb 2022
Cited by 3 | Viewed by 2271
Abstract
This study aimed to describe the intake and food sources of macronutrients in vegetarian and non-vegetarian adolescent females. Cross-sectional data was collected between February and September 2019. Adolescent females, aged 15 to 18 years old, were recruited throughout New Zealand. Intakes were assessed [...] Read more.
This study aimed to describe the intake and food sources of macronutrients in vegetarian and non-vegetarian adolescent females. Cross-sectional data was collected between February and September 2019. Adolescent females, aged 15 to 18 years old, were recruited throughout New Zealand. Intakes were assessed via two 24-h diet recalls, adjusted to represent usual intake using the multiple source method. Of the 254 participants, 38 self-identified as vegetarian. Vegetarians had similar carbohydrate and fat intakes compared to non-vegetarians; however, their protein intakes were 2.1% kJ lower (95% confidence interval (CI) −3.0 to −1.1%). Vegetarians also consumed 1.1% kJ less saturated fat (95% CI –2.1 to −0.1%), 1.3% kJ (95% CI 0.7 to 1.9) more polyunsaturated fat, and 5 g/day (95% CI 1.8 to 8.0) more fiber than non-vegetarians. When consumed, bread-based dishes and discretionary foods were the highest sources of energy, fat, and carbohydrate in both vegetarians and non-vegetarians. This suggests that some adolescents, including vegetarians, were obtaining high amounts of fat and carbohydrate from food groups associated with poorer dietary quality. We recommend further research to assess how the changing food environment is influencing vegetarian eating patterns and their associations with health outcomes in the wider population. Full article
Show Figures

Graphical abstract

Graphical abstract
Full article ">
14 pages, 2159 KiB  
Article
Effects of Thiamin Restriction on Exercise-Associated Glycogen Metabolism and AMPK Activation Level in Skeletal Muscle
by Akiko Sato, Shinji Sato, Go Omori and Keiichi Koshinaka
Nutrients 2022, 14(3), 710; https://doi.org/10.3390/nu14030710 - 8 Feb 2022
Cited by 2 | Viewed by 2731
Abstract
This study aimed to investigate the direct influence of a decrease in the cellular thiamin level, before the onset of anorexia (one of the symptoms of thiamin deficiency) on glycogen metabolism and the AMP-activated protein kinase (AMPK) activation levels in skeletal muscle at [...] Read more.
This study aimed to investigate the direct influence of a decrease in the cellular thiamin level, before the onset of anorexia (one of the symptoms of thiamin deficiency) on glycogen metabolism and the AMP-activated protein kinase (AMPK) activation levels in skeletal muscle at rest and in response to exercise. Male Wistar rats were classified as the control diet (CON) group or the thiamin-deficient diet (TD) group and consumed the assigned diets for 1 week. Skeletal muscles were taken from the rats at rest, those that underwent low-intensity swimming (LIS), or high-intensity intermittent swimming (HIS) conducted immediately before dissection. There were no significant differences in food intake, locomotive activity, or body weight between groups, but thiamin pyrophosphate in the skeletal muscles of the TD group was significantly lower than that of the CON group. Muscle glycogen and lactate levels in the blood and muscle were equivalent between groups at rest and in response to exercise. The mitochondrial content was equal between groups, and AMPK in the skeletal muscles of TD rats was normally activated by LIS and HIS. In conclusion, with a lowered cellular thiamin level, the exercise-associated glycogen metabolism and AMPK activation level in skeletal muscle were normally regulated. Full article
(This article belongs to the Special Issue The Effect of Exercise and Diet on Energy Metabolism)
Show Figures

Figure 1

Figure 1
<p>Effects of 1-week thiamin-deficient diet on food intake, locomotor activity, and body weight. Daily food intake (<b>A</b>), total locomotor activity (<b>B</b>), and body weight (<b>C</b>) were measured during the experimental period. In locomotor activity, hatched areas of the bars show values during nighttime (18:00–6:00) and clear areas show that during daytime (6:00–18:00). Values are the means ± SE (<span class="html-italic">n</span> = 6–7). CON: control diet, TD: thiamin-deficient diet.</p>
Full article ">Figure 2
<p>Effects of the 1-week thiamin-deficient diet on the muscle thiamin content and thiamin transporter. Thiamin pyrophosphate content (<b>A</b>) and the protein level of thiamin transporter (THTR) 1 (<b>B</b>) in skeletal muscle were measured. Representative blots are shown above the figure. Values are the means ± SE (<span class="html-italic">n</span> = 4–6). The THTR1 values were normalized by glyceraldehyde-3-phosphate dehydrogenase (GAPDH) abundance. CON, C: control diet, TD, T: thiamin-deficient diet. * <span class="html-italic">p</span> &lt; 0.05 vs. TD group.</p>
Full article ">Figure 3
<p>Effects of 1-week thiamin-deficient diet on muscle glycogen and blood parameters at rest and immediately after exercise. Muscle glycogen content (<b>A</b>), blood glucose concentration (<b>B</b>) and plasma insulin level (<b>C</b>) at rest and immediately after low-intensity swimming (LIS) and high- intensity intermittent swimming (HIS) are shown. Values are the means ± SE (<span class="html-italic">n</span> = 5–8). CON: control diet, TD: thiamin-deficient diet.</p>
Full article ">Figure 4
<p>Effects of 1-week thiamin-deficient diet on glucose transport and glucose transporter in skeletal muscle. Glucose transport of skeletal muscle (<b>A</b>) was measured under the basal, insulin-, and hypoxia-stimulated conditions. The protein level of glucose transporter (GLUT) 4 (<b>B</b>) in skeletal muscle were analyzed by Western blotting, and representative blots are shown above the figure. Values are the means ± SE (<span class="html-italic">n</span> = 6–7). The GLUT4 values were normalized by GAPDH abundance. CON: control diet, TD: thiamin-deficient diet.</p>
Full article ">Figure 5
<p>Effects of 1-week thiamin-deficient diet on metabolic molecules related to the mitochondria content in skeletal muscle. The protein levels of citrate synthase (CS) (<b>A</b>), cytochrome c oxidase (COX) IV (<b>B</b>), and peroxisome proliferator-activated receptor gamma coactivator (PGC)-1α (<b>C</b>) were analyzed. CS and COX IV were measured with the same membrane by reprobing. Representative blot are shown above each figure. Values are the means ± SE (<span class="html-italic">n</span> = 12). All values were normalized by GAPDH abundance. CON, C: control diet, TD, T: thiamin-deficient diet.</p>
Full article ">Figure 6
<p>Effects of a 1-week thiamin-deficient diet on lactate and monocarboxylate transporters. Lactate level in the blood (<b>A</b>) and in the skeletal muscle (<b>B</b>) were measured as well as the protein levels of monocarboxylate transporter (MCT) 1 (<b>C</b>), and MCT4 (<b>D</b>). MCT1 and MCT4 were measured with the same membrane by reprobing. Representative blots of MCT1 and MCT4 are shown above the figures. Values are the means ± SE (<span class="html-italic">n</span> = 5–8). All values were normalized by GAPDH abundance. CON, C: control diet, TD, T: thiamin-deficient diet. LIS: low-intensity swimming, HIS: high-intensity intermittent swimming.</p>
Full article ">Figure 7
<p>Effects of 1-week thiamin-deficient diet on AMP-activated kinase (AMPK) phosphorylation at rest and immediately after exercise in the skeletal muscle. The values of p-AMPK were normalized by AMPK abundance. Representative blots are shown above the figure. Values are the means ± SE (<span class="html-italic">n</span> = 5–7). CON, C: control diet, TD, T: thiamin-deficient diet. LIS: low-intensity swimming, and HIS: high-intensity intermittent swimming.</p>
Full article ">
22 pages, 701 KiB  
Article
The Biology of Veganism: Plasma Metabolomics Analysis Reveals Distinct Profiles of Vegans and Non-Vegetarians in the Adventist Health Study-2 Cohort
by Fayth L. Miles, Michael J. Orlich, Andrew Mashchak, Paulette D. Chandler, Johanna W. Lampe, Penelope Duerksen-Hughes and Gary E. Fraser
Nutrients 2022, 14(3), 709; https://doi.org/10.3390/nu14030709 - 8 Feb 2022
Cited by 12 | Viewed by 5342
Abstract
It is unclear how vegetarian dietary patterns influence plasma metabolites involved in biological processes regulating chronic diseases. We sought to identify plasma metabolic profiles distinguishing vegans (avoiding meat, eggs, dairy) from non-vegetarians (consuming ≥28 g/day red meat) of the Adventist Health Study-2 cohort [...] Read more.
It is unclear how vegetarian dietary patterns influence plasma metabolites involved in biological processes regulating chronic diseases. We sought to identify plasma metabolic profiles distinguishing vegans (avoiding meat, eggs, dairy) from non-vegetarians (consuming ≥28 g/day red meat) of the Adventist Health Study-2 cohort using global metabolomics profiling with ultra-performance liquid chromatography mass spectrometry (UPLC-MS/MS). Differences in abundance of metabolites or biochemical subclasses were analyzed using linear regression models, adjusting for surrogate and confounding variables, with cross-validation to simulate results from an independent sample. Random forest was used as a learning tool for classification, and principal component analysis was used to identify clusters of related metabolites. Differences in covariate-adjusted metabolite abundance were identified in over 60% of metabolites (586/930), after adjustment for false discovery. The vast majority of differentially abundant metabolites or metabolite subclasses showed lower abundance in vegans, including xanthine, histidine, branched fatty acids, acetylated peptides, ceramides, and long-chain acylcarnitines, among others. Many of these metabolite subclasses have roles in insulin dysregulation, cardiometabolic phenotypes, and inflammation. Analysis of metabolic profiles in vegans and non-vegetarians revealed vast differences in these two dietary groups, reflecting differences in consumption of animal and plant products. These metabolites serve as biomarkers of food intake, many with potential pathophysiological consequences for cardiometabolic diseases. Full article
(This article belongs to the Section Nutrition and Public Health)
Show Figures

Figure 1

Figure 1
<p>Random forest variable importance. Mean decrease accuracy from random forest analysis classifying vegans and non-vegetarians represents average decrease in accuracy in model prediction after permutation of each indicated variable.</p>
Full article ">Figure 2
<p>PCA plot of scores for vegan and non-vegetarian participants for principal components 1 and 3. Individual scores were obtained from covariance matrix of 930 log-transformed metabolites and plotted to analyze variation explained by diet group.</p>
Full article ">
8 pages, 275 KiB  
Article
Consumption of Ultra-Processed Foods Is Associated with Free Sugars Intake in the Canadian Population
by Virginie Hamel, Milena Nardocci, Nadia Flexner, Jodi Bernstein, Marie R. L’Abbé and Jean-Claude Moubarac
Nutrients 2022, 14(3), 708; https://doi.org/10.3390/nu14030708 - 8 Feb 2022
Cited by 9 | Viewed by 2819
Abstract
Excess sugar consumption can lead to noncommunicable diseases (NCDs) such as type 2 diabetes. Increasingly, ultra-processed foods (UPF) are suspected to be great contributors to free sugars intake in the population’s diet. Thus, the aim of this study was to investigate the association [...] Read more.
Excess sugar consumption can lead to noncommunicable diseases (NCDs) such as type 2 diabetes. Increasingly, ultra-processed foods (UPF) are suspected to be great contributors to free sugars intake in the population’s diet. Thus, the aim of this study was to investigate the association between UPF consumption and free sugars intake in the Canadian population. We used data from one 24 h-recall of the nationally representative 2015 Canadian Community Health Survey–Nutrition (CCHS). Food items were classified according to the NOVA system, and to estimate free sugars intake, we used the University of Toronto’s Food Label Information Program (FLIP) 2017 database. Results: Almost half of the population’s energy intake (45.7%) came from UPF. On average, 221.5 kcal/day came from free sugars, and most of these calories (71.5%) came from UPF. Public health policies aiming to decrease consumption of UPF should be a priority considering their important contribution to sugar intake in the population. Full article
(This article belongs to the Section Nutrition and Public Health)
2 pages, 180 KiB  
Editorial
Nutrition in Gynecologic Disease
by Pasquapina Ciarmela
Nutrients 2022, 14(3), 707; https://doi.org/10.3390/nu14030707 - 8 Feb 2022
Viewed by 2092
Abstract
The pathologies concerning the gynecological organs are very varied and range from tumoral pathologies to hormonal dysfunctions [...] Full article
(This article belongs to the Special Issue Nutrition in Gynecologic Disease)
12 pages, 1357 KiB  
Article
Differential Glycemic Effects of Low- versus High-Glycemic Index Mediterranean-Style Eating Patterns in Adults at Risk for Type 2 Diabetes: The MEDGI-Carb Randomized Controlled Trial
by Robert E. Bergia, Rosalba Giacco, Therese Hjorth, Izabela Biskup, Wenbin Zhu, Giuseppina Costabile, Marilena Vitale, Wayne W. Campbell, Rikard Landberg and Gabriele Riccardi
Nutrients 2022, 14(3), 706; https://doi.org/10.3390/nu14030706 - 8 Feb 2022
Cited by 26 | Viewed by 8448
Abstract
A Mediterranean-style healthy eating pattern (MED-HEP) supports metabolic health, but the utility of including low-glycemic index (GI) foods to minimize postprandial glucose excursions remain unclear. Therefore, we investigated the relative contribution of GI towards improvements in postprandial glycemia and glycemic variability after adopting [...] Read more.
A Mediterranean-style healthy eating pattern (MED-HEP) supports metabolic health, but the utility of including low-glycemic index (GI) foods to minimize postprandial glucose excursions remain unclear. Therefore, we investigated the relative contribution of GI towards improvements in postprandial glycemia and glycemic variability after adopting a MED-HEP. We conducted a randomized, controlled dietary intervention, comparing high- versus low-GI diets in a multi-national (Italy, Sweden, and the United States) sample of adults at risk for type 2 diabetes. For 12 weeks, participants consumed either a low-GI or high-GI MED-HEP. We assessed postprandial plasma glucose and insulin responses to high- or low-GI meals, and daily glycemic variability via continuous glucose monitoring at baseline and post-intervention. One hundred sixty adults (86 females, 74 males; aged 55 ± 11 y, BMI 31 ± 3 kg/m2, mean ± SD) with ≥two metabolic syndrome traits completed the intervention. Postprandial insulin concentrations were greater after the high-GI versus the low-GI test meals at baseline (p = 0.004), but not post-intervention (p = 0.17). Postprandial glucose after the high-GI test meal increased post-intervention, being significantly higher than that after the low-GI test meal (35%, p < 0.001). Average daily glucose concentrations decreased in both groups post-intervention. Indices of 24-h glycemic variability were reduced in the low-GI group as compared to baseline and the high-GI intervention group. These findings suggest that low-GI foods may be an important feature within a MED-HEP. Full article
(This article belongs to the Special Issue The Effect of the Mediterranean Diet on Metabolic Health)
Show Figures

Figure 1

Figure 1
<p>CONSORT participant flow diagram.</p>
Full article ">Figure 2
<p>Insulin (<b>a</b>) and glucose (<b>b</b>) responses to a low-GI and high-GI 8-h meal glucose tolerance test at baseline and after a 12-week dietary intervention. Inset bar graphs display average postprandial insulin and glucose elevations above fasting concentrations over the 8-h period. Data are means ± SEM. * Statistically significant, <span class="html-italic">p</span> &lt; 0.05. ns, no significance.</p>
Full article ">Figure 3
<p>24-h continuous glucose monitor-derived measures of glycemic variability at baseline and after a 12-week dietary intervention. (<b>a</b>) Average 24-h glucose concentration, (<b>b</b>) standard deviation (SD), (<b>c</b>) continuous overall net glycemic action (CONGA), (<b>d</b>) lability index, (<b>e</b>) mean amplitude of glucose excursions (MAGE), and (<b>f</b>) mean absolute glucose (MAG). Presented data are means ± SEM. * Statistically significant, <span class="html-italic">p</span> &lt; 0.05. ns, no significance.</p>
Full article ">
3 pages, 199 KiB  
Editorial
The Paradox of the Mediterranean Diet in Pediatric Age during the COVID-19 Pandemic
by Elvira Verduci, Giulia Fiore, Elisabetta Di Profio and Gian Vincenzo Zuccotti
Nutrients 2022, 14(3), 705; https://doi.org/10.3390/nu14030705 - 8 Feb 2022
Viewed by 2040
Abstract
The outbreak of the COVID-19 pandemic, whose causative agent is Severe Acute Respiratory Syndrome Coronavirus 2, has caused a global crisis that has had a major impact on the health of the global population [...] Full article
(This article belongs to the Section Pediatric Nutrition)
13 pages, 1052 KiB  
Article
Different Types of Long-Term Milk Consumption and Mortality in Adults with Cardiovascular Disease: A Population-Based Study in 7236 Australian Adults over 8.4 Years
by Xiaoyue Xu, Alamgir Kabir, Margo L. Barr and Aletta E. Schutte
Nutrients 2022, 14(3), 704; https://doi.org/10.3390/nu14030704 - 8 Feb 2022
Cited by 9 | Viewed by 3572
Abstract
Most studies disregard long-term dairy consumption behaviour and how it relates to mortality. We examined four different types of long-term milk consumption, namely whole milk, reduced fat milk, skim milk and soy milk, in relation to mortality among adults diagnosed with cardiovascular disease [...] Read more.
Most studies disregard long-term dairy consumption behaviour and how it relates to mortality. We examined four different types of long-term milk consumption, namely whole milk, reduced fat milk, skim milk and soy milk, in relation to mortality among adults diagnosed with cardiovascular disease (CVD). A retrospective population-based study was conducted in Australia (the 45 and Up Study) linking baseline (2006–2009) and follow-up data (2012–2015) to hospitalisation and mortality data up to 30 September 2018. A total of 1,101 deaths occurred among 7236 participants with CVD over a mean follow-up of 8.4 years. Males (Hazard Ratio, HR = 0.69, 95% CI (0.54; 0.89)) and females (HR = 0.59 (0.38; 0.91)) with long-term reduced fat milk consumption had the lowest risk of mortality compared to counterparts with long-term whole milk consumption. Among participants with ischemic heart disease, males with a long-term reduced fat milk consumption had the lowest risk of mortality (HR = 0.63, 95% CI: 0.43; 0.92). We conclude that among males and females with CVD, those who often consume reduced fat milk over the long-term present with a 31–41% lower risk of mortality than those who often consume whole milk, supporting dairy advice from the Heart Foundation of replacing whole milk with reduced fat milk to achieve better health. Full article
(This article belongs to the Section Nutritional Epidemiology)
Show Figures

Figure 1

Figure 1
<p>Study flow-chart.</p>
Full article ">Figure 2
<p>Kaplan–Meier survival estimates for different types of long-term milk consumption and survival by males and females.</p>
Full article ">
16 pages, 571 KiB  
Article
Changes in Bone Mineral Density and Serum Lipids across the First Postpartum Year: Effect of Aerobic Fitness and Physical Activity
by Erin M. Kyle, Hayley B. Miller, Jessica Schueler, Michelle Clinton, Brenda M. Alexander, Ann Marie Hart and D. Enette Larson-Meyer
Nutrients 2022, 14(3), 703; https://doi.org/10.3390/nu14030703 - 8 Feb 2022
Cited by 1 | Viewed by 3178
Abstract
This study evaluated the changes in bone mineral density (BMD) and serum lipids across the first postpartum year in lactating women compared to never-pregnant controls, and the influence of physical activity (PA). The study also explored whether N-telopeptides, pyridinoline, and deoxypyridinoline in urine [...] Read more.
This study evaluated the changes in bone mineral density (BMD) and serum lipids across the first postpartum year in lactating women compared to never-pregnant controls, and the influence of physical activity (PA). The study also explored whether N-telopeptides, pyridinoline, and deoxypyridinoline in urine serve as biomarkers of bone resorption. A cohort of 18 initially lactating postpartum women and 16 never pregnant controls were studied. BMD (dual energy X-ray absorptiometry), serum lipid profiles, and PA (Baecke PA Questionnaire) were assessed at baseline (4–6 weeks postpartum), 6 months, and 12 months. Postpartum women lost 5.2 ± 1.4 kg body weight and BMD decreased by 1.4% and 3.1% in the total body and dual-femur, respectively. Furthermore, BMDdid not show signs of rebound. Lipid profiles improved, with increases in high-density lipoprotein-cholesterol (HDL-C) and decreases in low-density lipoprotein cholesterol (LDL-C) and the cholesterol/HDL-C ratio at 12 months (vs. baseline). These changes were not influenced by lactation, but the fall the Cholesterol/HDL-C ratio was influenced by leisure-time (p = 0.051, time X group) and sport (p = 0.028, time effect) PA. The decrease in BMD from baseline to 12 months in total body and dual femur, however, was greater in those who continued to breastfeed for a full year compared to those who stopped at close to 6 months. Urinary markers of bone resorption, measured in a subset of participants, reflect BMD loss, particularly in the dual-femur, and may reflect changes bone resorption before observed changes in BMD. Results provide support that habitual postpartum PA may favorably influence changes in serum lipids but not necessarily BMD. The benefit of exercise and use of urinary biomarkers of bone deserves further exploration. Full article
Show Figures

Graphical abstract

Graphical abstract
Full article ">Figure 1
<p>The change in total body (panel A), dual-femur panel B) and lumbar spine (panel C) BMD in lactating verses never-pregnant controls. BMD in total body (time X group interaction, <span class="html-italic">p</span> = 0.011) and dual femur (time effect, <span class="html-italic">p</span> = 0.014) decreased from 4 to 6 weeks (baseline) to 12 months postpartum. No differences across time were observed for BMD of the spine. * <span class="html-italic">p</span> &lt; 0.025 vs. baseline by paired <span class="html-italic">t</span>-test.</p>
Full article ">
14 pages, 945 KiB  
Systematic Review
Timing of Complementary Feeding, Growth, and Risk of Non-Communicable Diseases: Systematic Review and Meta-Analysis
by Maria Carmen Verga, Immacolata Scotese, Marcello Bergamini, Giovanni Simeone, Barbara Cuomo, Giuseppe D’Antonio, Iride Dello Iacono, Giuseppe Di Mauro, Lucia Leonardi, Vito Leonardo Miniello, Filomena Palma, Giovanna Tezza, Andrea Vania and Margherita Caroli
Nutrients 2022, 14(3), 702; https://doi.org/10.3390/nu14030702 - 8 Feb 2022
Cited by 7 | Viewed by 3860
Abstract
No consensus currently exists on the appropriate age for the introduction of complementary feeding (CF). In this paper, a systematic review is conducted that investigates the effects of starting CF in breastfed and formula-fed infants at 4, 4–6, or 6 months of age [...] Read more.
No consensus currently exists on the appropriate age for the introduction of complementary feeding (CF). In this paper, a systematic review is conducted that investigates the effects of starting CF in breastfed and formula-fed infants at 4, 4–6, or 6 months of age (i) on growth at 12 months of age, (ii) on the development of overweight/obesity at 3–6 years of age, (iii) on iron status, and (iv) on the risk of developing (later in life) type 2 diabetes mellitus (DM2) and hypertension. An extensive literature search identified seven studies that evaluated the effects of the introduction of CF at the ages in question. No statistically significant differences related to the age at which CF is started were observed in breastfed or formula-fed infants in terms of the following: iron status, weight, length, and body mass index Z-scores (zBMI) at 12 months, and development of overweight/obesity at 3 years. No studies were found specifically focused on the age range for CF introduction and risk of DM2 and hypertension. Introducing CF before 6 months in healthy term-born infants living in developed countries is essentially useless, as human milk (HM) and formulas are nutritionally adequate up to 6 months of age. Full article
Show Figures

Figure 1

Figure 1
<p>GLs search flow diagram.</p>
Full article ">Figure 2
<p>SRs search flow diagram.</p>
Full article ">Figure 3
<p>Studies search flow diagram.</p>
Full article ">
8 pages, 6887 KiB  
Article
The Dietary Supplement Creatyl-l-Leucine Does Not Bioaccumulate in Muscle, Brain or Plasma and Is Not a Significant Bioavailable Source of Creatine
by Robin P. da Silva
Nutrients 2022, 14(3), 701; https://doi.org/10.3390/nu14030701 - 8 Feb 2022
Cited by 3 | Viewed by 4607
Abstract
Creatine is an important energy metabolite that is concentrated in tissues such as the muscles and brain. Creatine is reversibly converted to creatine phosphate through a reaction with ATP or ADP, which is catalyzed by the enzyme creatine kinase. Dietary supplementation with relatively [...] Read more.
Creatine is an important energy metabolite that is concentrated in tissues such as the muscles and brain. Creatine is reversibly converted to creatine phosphate through a reaction with ATP or ADP, which is catalyzed by the enzyme creatine kinase. Dietary supplementation with relatively large amounts of creatine monohydrate has been proven as an effective sports supplement that can enhances athletic performance during acute high-energy demand physical activity. Some side effects have been reported with creatine monohydrate supplementation, which have stimulated research into new potential molecules that could be used as supplements to potentially provide bioavailable creatine. Recently, a popular supplement, creatyl-l-leucine, has been proposed as a potential dietary ingredient that may potentially provide bioavailable creatine. This study tests whether creatyl-l-leucine is a bioavailable compound and determines whether it can furnish creatine as a dietary supplement. Rats were deprived of dietary creatine for a period of two weeks and then given one of three treatments: a control AIN-93G creatine-free diet, AIN-93G supplemented with creatine monohydrate or AIN-93G with an equimolar amount of creatyl-l-leucine supplement in the diet for one week. When compared to the control and the creatine monohydrate-supplemented diet, creatyl-l-leucine supplementation resulted in no bioaccumulation of either creatyl-l-leucine or creatine in tissue. Full article
(This article belongs to the Special Issue Creatine Supplementation for Health and Clinical Diseases)
Show Figures

Figure 1

Figure 1
<p>Chemical structures of (<b>A</b>) creatyl-<span class="html-small-caps">l</span>-leucine and (<b>B</b>) creatine.</p>
Full article ">Figure 2
<p>Body weight over the course of the feeding trial. Open circles represent weights for rats fed creatine-free AIN-93G diet for the entire 21 days; open triangles represent weights for rats fed creatine-free diet for 14 days and then switched to AIN-93G diet supplemented with 0.4% (<span class="html-italic">w</span>/<span class="html-italic">w</span>) creatine monohydrate for the remaining 7 days; black circles represent weights for rats fed creatine-free diet for 14 days and then switched to AIN-93G diet supplemented with 0.656% (<span class="html-italic">w</span>/<span class="html-italic">w</span>) creatyl-<span class="html-small-caps">l</span>-leucine (CLL) for the remaining 7 days. Values are presented as the mean ± one standard deviation, n = 8 per group.</p>
Full article ">Figure 3
<p>Food intake for all groups. Panel (<b>A</b>) Data for all days of experiment and panel (<b>B</b>) expanded data for days 15–21. Open circles represent the average daily food intake for rats fed creatine-free AIN-93G diet for the entire 21 days; open triangles represent average daily food intake for rats fed creatine-free diet for 14 days and then switched to AIN-93G diet supplemented with 0.4% (<span class="html-italic">w</span>/<span class="html-italic">w</span>) creatine monohydrate for days 15–21; black circles represent average daily food intake for rats fed creatine-free diet for 14 days and then switched to AIN-93G diet supplemented with 0.656% (<span class="html-italic">w</span>/<span class="html-italic">w</span>) creatyl-<span class="html-small-caps">l</span>-leucine (CLL) for days 15–21. Values are presented as the mean ± one standard deviation, n = 8 per group.</p>
Full article ">Figure 4
<p>Plasma concentrations of creatine and guanidinoacetate. Panel (<b>A</b>) arterial plasma concentration of creatine; panel (<b>B</b>) portal venous plasma concentration of creatine; panel (<b>C</b>) arterial plasma concentration of guanidinoacetate; panel (<b>D</b>) portal venous concentration of guanidinoacetate. The open bar represents rats fed creatine-free diet (CON), light gray bar represents rats fed 0.4% <span class="html-italic">w</span>/<span class="html-italic">w</span> creatine monohydrate supplemented diet, dark gray bar represents rats fed 0.656% CLL supplemented diet. Values are presented as the mean ± one standard deviation, n = 8 per group. Asterisks indicate significance by <span class="html-italic">p</span>-value; <span class="html-italic">p</span> &lt; 0.0001 = ****, <span class="html-italic">p</span> &lt; 0.001 = ***, <span class="html-italic">p</span> &lt; 0.01 = **, ns = not significant.</p>
Full article ">Figure 5
<p>Muscle and brain creatine content. Panel (<b>A</b>) Creatine content of quadricep muscle; panel (<b>B</b>); creatine content of whole brain. The open bar represents rats fed creatine-free diet (CON), light gray bar represents rats fed 0.4% <span class="html-italic">w</span>/<span class="html-italic">w</span> creatine monohydrate-supplemented diet, dark gray bar represents rats fed 0.656% CLL supplemented diet. Values are presented as the mean ± one standard deviation, n = 8 per group. Asterisks indicate significance by <span class="html-italic">p</span>-value; <span class="html-italic">p</span> &lt; 0.01 = **, <span class="html-italic">p</span> &lt; 0.05 = *, ns = not significant.</p>
Full article ">
21 pages, 743 KiB  
Review
An Emerging Role of Defective Copper Metabolism in Heart Disease
by Yun Liu and Ji Miao
Nutrients 2022, 14(3), 700; https://doi.org/10.3390/nu14030700 - 7 Feb 2022
Cited by 37 | Viewed by 6162
Abstract
Copper is an essential trace metal element that significantly affects human physiology and pathology by regulating various important biological processes, including mitochondrial oxidative phosphorylation, iron mobilization, connective tissue crosslinking, antioxidant defense, melanin synthesis, blood clotting, and neuron peptide maturation. Increasing lines of evidence [...] Read more.
Copper is an essential trace metal element that significantly affects human physiology and pathology by regulating various important biological processes, including mitochondrial oxidative phosphorylation, iron mobilization, connective tissue crosslinking, antioxidant defense, melanin synthesis, blood clotting, and neuron peptide maturation. Increasing lines of evidence obtained from studies of cell culture, animals, and human genetics have demonstrated that dysregulation of copper metabolism causes heart disease, which is the leading cause of mortality in the US. Defects of copper homeostasis caused by perturbed regulation of copper chaperones or copper transporters or by copper deficiency resulted in various types of heart disease, including cardiac hypertrophy, heart failure, ischemic heart disease, and diabetes mellitus cardiomyopathy. This review aims to provide a timely summary of the effects of defective copper homeostasis on heart disease and discuss potential underlying molecular mechanisms. Full article
(This article belongs to the Section Micronutrients and Human Health)
Show Figures

Figure 1

Figure 1
<p>Copper-binding proteins and intracellular copper transportation. Copper is exclusively absorbed by enterocytes in the small intestine via CTR1. CTR2 is a low-affinity copper importer that localizes to endosomes and lysosomes. Intracellular copper-binding proteins include COX, SCO, SOD, MT, CP, and LOX. ATP7A and ATP7B are copper exporters. Under normal conditions, ATP7A and ATP7B localize to TGN, where they supply copper to copper-dependent enzymes in the secretory pathway. When the cytosolic copper level rises, ATP7A or ATP7B interacts with DNCT4 and traffics to endosome-like vesicles and then to the plasma membrane, pumping excess copper into the extracellular space, or into bile in the case of the liver, to reduce intracellular copper levels. By contrast, when the intracellular copper level is low, ATP7A or ATP7B recycles to the TGN and transports copper from the cytoplasm into the Golgi. ATOX1: antioxidant 1 copper chaperone; ATP7A: copper-transporting ATPase 1; ATP7B: copper-transporting ATPase 2; CTR1: copper transporter 1; CTR2: copper transporter 2; CCO: cytochrome c oxidase; COX: cytochrome c oxidase copper chaperone; CP: ceruloplasmin, DNCT4: p62 subunit of dynactin; LOX: lysyl oxidase; MT: metallothionein; SCO: synthesis of cytochrome c oxidase; SOD: superoxide dismutase; TGN: trans-Golgi network.</p>
Full article ">
16 pages, 657 KiB  
Review
Molecular Basis of Resveratrol-Induced Resensitization of Acquired Drug-Resistant Cancer Cells
by Chul Yung Choi, Sung-Chul Lim, Tae-Bum Lee and Song Iy Han
Nutrients 2022, 14(3), 699; https://doi.org/10.3390/nu14030699 - 7 Feb 2022
Cited by 18 | Viewed by 3498
Abstract
Multidrug resistance (MDR) to anticancer drugs remains a serious obstacle to the success of cancer chemotherapy. Resveratrol, a polyphenol, present in natural products exerts anticancer activity and acts as a potential MDR inhibitor in various drug-resistant cancer cells. In the process of resensitization [...] Read more.
Multidrug resistance (MDR) to anticancer drugs remains a serious obstacle to the success of cancer chemotherapy. Resveratrol, a polyphenol, present in natural products exerts anticancer activity and acts as a potential MDR inhibitor in various drug-resistant cancer cells. In the process of resensitization of drug-resistant cancer cells, resveratrol has been shown to interfere with ABC transporters and drug-metabolizing enzymes, increase DNA damage, inhibit cell cycle progression, and induce apoptosis and autophagy, as well as prevent the induction of epithelial to mesenchymal transition (EMT) and cancer stem cells (CSCs). This review summarizes the mechanisms by which resveratrol counteracts MDR in acquired drug-resistant cancer cell lines and provides a critical basis for understanding the regulation of MDR as well as the development of MDR-inhibiting drugs. Full article
(This article belongs to the Topic Applied Sciences in Functional Foods)
Show Figures

Figure 1

Figure 1
<p>A schematic model of RES function in drug-resistant cancer cells.</p>
Full article ">
4 pages, 208 KiB  
Editorial
Medical Nutrition Therapy in Diabetes Mellitus: New Insights to an Old Problem
by Maria G. Grammatikopoulou and Dimitrios G. Goulis
Nutrients 2022, 14(3), 698; https://doi.org/10.3390/nu14030698 - 7 Feb 2022
Cited by 4 | Viewed by 3763
Abstract
The management of all types of diabetes mellitus (DM) has transformed during the past decade [...] Full article
(This article belongs to the Special Issue Advances in the Nutrition of Diabetes and Gestational Diabetes)
13 pages, 1234 KiB  
Article
Randomized Controlled Trial of Two Timepoints for Introduction of Standardized Complementary Food in Preterm Infants
by Nadja Haiden, Margarita Thanhaeuser, Fabian Eibensteiner, Mercedes Huber-Dangl, Melanie Gsoellpointner, Robin Ristl, Bettina Kroyer, Sophia Brandstetter, Margit Kornsteiner-Krenn, Christoph Binder, Alexandra Thajer and Bernd Jilma
Nutrients 2022, 14(3), 697; https://doi.org/10.3390/nu14030697 - 7 Feb 2022
Cited by 9 | Viewed by 2263
Abstract
In term infants it is recommended to introduce solids between the 17th and 26th week of life, whereas data for preterm infants are missing. In a prospective, two-arm interventional study we investigated longitudinal growth of VLBW infants after early (10–12th) or late (16–18th) [...] Read more.
In term infants it is recommended to introduce solids between the 17th and 26th week of life, whereas data for preterm infants are missing. In a prospective, two-arm interventional study we investigated longitudinal growth of VLBW infants after early (10–12th) or late (16–18th) week of life, corrected for term, introduction of standardized complementary food. Primary endpoint was height at one year of age, corrected for term, and secondary endpoints were other anthropometric parameters such as weight, head circumference, BMI, and z-scores. Among 177 infants who underwent randomization, the primary outcome could be assessed in 83 (93%) assigned to the early and 83 (94%) to the late group. Mean birthweight was 941 (SD ± 253) g in the early and 932 (SD ± 256) g in the late group, mean gestational age at birth was 27 + 1/7 weeks in both groups. Height was 74.7 (mean; SD ± 2.7) cm in the early and 74.4 cm (mean; SD ± 2.8; n.s.) cm in the late group at one year of age, corrected for term. There were no differences in anthropometric parameters between the study groups except for a transient effect on weight z-score at 6 months. In preterm infants, starting solids should rather be related to neurological ability than to considerations of nutritional intake and growth. Full article
(This article belongs to the Special Issue Complementary Feeding for Preterm Newborns)
Show Figures

Figure 1

Figure 1
<p>Trial profile.</p>
Full article ">Figure 2
<p>Study flow chart. This figure shows the timeline for randomization, study visits, and the introduction time points of complementary food for early and late study group. The content of feeding boxes is represented by symbols for nutrient groups.</p>
Full article ">Figure 3
<p>Time precision of anthropometric measurements. Plot A: The Kernel density plot shows the distribution of the time point of anthropometric measurement (<span class="html-italic">y</span>-axis) of all study participants for the scheduled visits during the first year of life, corrected for term (<span class="html-italic">x</span>-axis). Plot B: Error bars for time point deviation (in days) of effective visits of the study population. Data are given in mean (SD).</p>
Full article ">Figure 4
<p>Anthropometric data of the study population. Plot A: This plot shows the weight gain in kilogram and corresponding z-scores of the study population during the first year of life including data from birth to date of expected term. The asterisks mark a significant <span class="html-italic">p</span>-value &lt; 0.05. Plot B: This plot shows the height growth in cm and corresponding z-scores of the study population during the first year of life, including data from birth to date of expected term. Plot C: This plot shows the gain in head circumference weight gain in cm and corresponding z-scores of the study population during the first year of life, including data from birth to date of expected term. Plot D: This plot shows the changes in BMI (body mass index) and corresponding z-scores of the study population during the first year of life, including data from birth to date of expected term. Reference values are only available for infants after term; therefore, data before expected date of term are missing.</p>
Full article ">
13 pages, 291 KiB  
Article
Analysis of the Correlation between Meal Frequency and Obesity among Chinese Adults Aged 18–59 Years in 2015
by Xiaoqi Wei, Dongmei Yu, Lahong Ju, Qiya Guo, Hongyun Fang and Liyun Zhao
Nutrients 2022, 14(3), 696; https://doi.org/10.3390/nu14030696 - 7 Feb 2022
Cited by 2 | Viewed by 2677
Abstract
This study aimed to investigate the relationship between meal frequency and obesity in Chinese adults aged 18 to 59 years. The data came from the 2015 Chinese Adult Chronic Disease and Nutrition Surveillance (CACDNS 2015) and provincial dietary environment data from the 2015 [...] Read more.
This study aimed to investigate the relationship between meal frequency and obesity in Chinese adults aged 18 to 59 years. The data came from the 2015 Chinese Adult Chronic Disease and Nutrition Surveillance (CACDNS 2015) and provincial dietary environment data from the 2015 National Statistical Yearbook. A total of 34,206 adults aged 18 to 59 who took part in the diet survey were selected as the study participants. A two-level multivariate logistic regression model was used to adjust for the socioeconomic and nutritional status of individuals. For parameter estimation, a numerical integral approach was used to analyze the relationship between meal frequency (including meals at home, the workplace or school dining halls, and eating away from home) and obesity. A two-level “provincial–individual” logistic multivariate regression analysis was performed with obesity as the dependent variable. The two-level multivariate analysis of variance model fitting results showed that after adjusting for the effects of gender, age, occupation, education, marital status, family per capita annual income, provincial gross domestic product (GDP), restaurant industry turnover, consumer price index of EAFH food, and energy intake, the frequency of eating at home was not associated with obesity (all p > 0.05); the frequency of eating at dining halls ≥1 to <2 times per day (OR = 0.784, p = 0.0122) showed a negative association with obesity; the frequency of eating away from home < 1 times per day and ≥1 to <2 times per day were positively correlated with obesity (<1 time per day: OR = 1.123, p = 0.0419; ≥1 to <2 times per day: OR = 1.249, p = 0.0022). The results of the two-level random-intercept logistic multivariate mixed-effects prediction model for obesity in adults aged 18 to 59 years showed that no statistical association was noticed between the frequency of eating at home and obesity in adults aged 18 to 59 years. However, adults who ate out < 1 time and ≥1 to <2 times a day showed higher risks of obesity than those who did not eat out, with OR = 1.131 (95% CI 1.012–1.264) and OR = 1.258 (95% CI 1.099–1.440), while adults who ate at school and workplace dining halls ≥1 to <2 times a day may have a reduced risk of obesity, with OR = 0.790 (95% CI 0.656–0.951). This result could not be found based on the definition of eating out in previous studies. Therefore, it is recommended to exclude nonprofit collective canteens such as school and workplace dining halls from the definition of eating away from home, and to redefine eating out in terms of health effects. At the same time, it is also recommended to strengthen collective nutritional interventions around canteens, improve the nutritious meal system in school and workplace canteens, and create healthy canteens. Full article
(This article belongs to the Special Issue Meal Frequency and Timing in Health and Disease)
16 pages, 1892 KiB  
Article
Beneficial Activities of Alisma orientale Extract in a Western Diet-Induced Murine Non-Alcoholic Steatohepatitis and Related Fibrosis Model via Regulation of the Hepatic Adiponectin and Farnesoid X Receptor Pathways
by Seung Ho Jeon, Eungyeong Jang, Geonha Park, Yeongae Lee, Young Pyo Jang, Kyung-Tae Lee, Kyung-Soo Inn, Jong Kil Lee and Jang-Hoon Lee
Nutrients 2022, 14(3), 695; https://doi.org/10.3390/nu14030695 - 7 Feb 2022
Cited by 9 | Viewed by 2970
Abstract
The hepatic adiponectin and farnesoid X receptor (FXR) signaling pathways play multiple roles in modulating lipid and glucose metabolism, reducing hepatic inflammation and fibrosis, and altering various metabolic targets for the management of non-alcoholic fatty liver disease (NAFLD). Alisma orientale (AO, Ze xie [...] Read more.
The hepatic adiponectin and farnesoid X receptor (FXR) signaling pathways play multiple roles in modulating lipid and glucose metabolism, reducing hepatic inflammation and fibrosis, and altering various metabolic targets for the management of non-alcoholic fatty liver disease (NAFLD). Alisma orientale (AO, Ze xie in Chinese and Taeksa in Korean) is an herbal plant whose tubers are enriched with triterpenoids, which have been reported to exhibit various bioactive properties associated with NAFLD. Here, the present study provides a preclinical evaluation of the biological functions and related signaling pathways of AO extract for the treatment of NAFLD in a Western diet (WD)-induced mouse model. The findings showed that AO extract significantly reversed serum markers (liver function, lipid profile, and glucose) and improved histological features in the liver sections of mice fed WD for 52 weeks. In addition, it also reduced hepatic expression of fibrogenic markers in liver tissue and decreased the extent of collagen-positive areas, as well as inhibited F4/80 macrophage aggregation and inflammatory cytokine secretion. The activation of adiponectin and FXR expression in hepatic tissue may be a major mechanistic signaling cascade supporting the promising role of AO in NAFLD pharmacotherapy. Collectively, our results demonstrated that AO extract improves non-alcoholic steatohepatitis (NASH) resolution, particularly with respect to NASH-related fibrosis, along with the regulation of liver enzymes, postprandial hyperglycemia, hyperlipidemia, and weight loss, probably through the modulation of the hepatic adiponectin and FXR pathways. Full article
(This article belongs to the Section Phytochemicals and Human Health)
Show Figures

Figure 1

Figure 1
<p>UHPLC chromatogram of the AO extract and UV spectrums of the seven peaks.</p>
Full article ">Figure 2
<p>Administration of <span class="html-italic">Alisma orientale</span> (AO) extract decreases WD-induced body and liver weight gain and prevents hepatomegaly (<b>a</b>–<b>f</b>). (<b>a</b>) The food intake of mice was measured during the experiment period. (<b>b</b>) The body weight changes in mice following Western diet-induced nonalcoholic steatohepatitis (NASH). (<b>c</b>) The body weight gain was calculated. After the mice were sacrificed, (<b>d</b>) epididymis fat weights and (<b>e</b>) liver weights were measured. (<b>f</b>) Representative images of liver tissues. The data were analyzed by one-way analysis of variance (ANOVA) and (B) two-way ANOVA. *** <span class="html-italic">p</span> &lt; 0.001 vs. control group; <sup>#</sup> <span class="html-italic">p</span> &lt; 0.05, <sup>##</sup> <span class="html-italic">p</span> &lt; 0.01 vs. WD-treated group (<span class="html-italic">n</span> = 12 per group). Plus sign (+) and minus sign (−) indicate the presence and absence of oral administration of WD or AO extract in male C57BL/6 mice, respectively.</p>
Full article ">Figure 3
<p>Administration of AO extract improves serum liver function, lipid profile, and glucose level (<b>a</b>–<b>f</b>). The levels of (<b>a</b>) alanine transaminase (ALT), (<b>b</b>) aspartate transaminase (AST), (<b>c</b>) cholesterol, (<b>d</b>) triglycerides (TG), and (<b>e</b>) low-density lipoprotein in serum. (<b>f</b>) Oral glucose tolerance test was assessed. * <span class="html-italic">p</span> &lt; 0.05, ** <span class="html-italic">p</span> &lt; 0.01, *** <span class="html-italic">p</span> &lt; 0.001 vs. control group; <sup>#</sup> <span class="html-italic">p</span> &lt; 0.05, <sup>##</sup> <span class="html-italic">p</span> &lt; 0.01, <sup>###</sup> <span class="html-italic">p</span> &lt; 0.001 vs. WD-treated group (<span class="html-italic">n</span> = 12 per group). Plus sign (+) and minus sign (−) indicate the presence and absence of oral administration of WD or AO extract in male C57BL/6 mice, respectively.</p>
Full article ">Figure 4
<p>AO extract intervention resolves histological injury of NASH with fibrosis (<b>a</b>–<b>i</b>). (<b>a</b>) Representative images of H&amp;E, picro sirius red (PSR) (<span class="html-italic">n</span> = 6 per groups), and F4/80 staining (<span class="html-italic">n</span> = 4 per groups) of mice liver tissues (scale bar = 50 μm; arrow: steatosis; bold arrow: lobular inflammation; dotted line arrow: ballooning). (<b>b</b>) NAFLD activity scores and (<b>c</b>) fibrosis scores were evaluated. The mRNA expression of (<b>d</b>) TIMP metallopeptidase inhibitor 1 (TIMP1), (<b>e</b>) platelet-derived growth factor (PDGF), (<b>f</b>) transforming growth factor beta 1 (TGFβ1), (<b>g</b>) F4/80, and the protein production of (<b>h</b>) tumor necrosis factor-α (TNF-α) as well as (<b>i</b>) interleukin-1β (IL-1β) in the liver (<span class="html-italic">n</span> = 6 per group) were evaluated. * <span class="html-italic">p</span> &lt; 0.05, ** <span class="html-italic">p</span> &lt; 0.01, *** <span class="html-italic">p</span> &lt; 0.001 vs. control group; <sup>#</sup> <span class="html-italic">p</span> &lt; 0.05, <sup>##</sup> <span class="html-italic">p</span> &lt; 0.01, <sup>###</sup> <span class="html-italic">p</span> &lt; 0.001 vs. WD-induced group. Plus sign (+) and minus sign (−) indicate the presence and absence of oral administration of WD or AO extract in male C57BL/6 mice, respectively.</p>
Full article ">Figure 5
<p>Administration of AO extract affects adiponectin and farnesoid X receptor (FXR) activation. (<b>a</b>) Representative immunoblotting images and quantitative protein expressions for (<b>b</b>) adiponectin and (<b>c</b>) AMP-activated protein kinase (AMPK) in mice liver. (<b>d</b>) Representative immunoblotting images and quantitative protein expressions for (<b>e</b>) FXR, (<b>f</b>) osteopontin (OPN), (<b>g</b>) focal adhesion kinase (FAK), and (<b>h</b>) protein kinase B (AKT). The mRNA expressions of (<b>i</b>) phosphoenolpyruvate carboxykinase-cytosolic (PEPCK-c), (<b>j</b>) PEPCK-mitochondrial (PEPCK-m), (<b>k</b>) OPN, and (<b>l</b>) CYP7A1 in the mice liver. * <span class="html-italic">p</span> &lt; 0.05, ** <span class="html-italic">p</span> &lt; 0.01, *** <span class="html-italic">p</span> &lt; 0.001 vs. control group; <sup>#</sup> <span class="html-italic">p</span> &lt; 0.05, <sup>##</sup> <span class="html-italic">p</span> &lt; 0.01, <sup>###</sup> <span class="html-italic">p</span> &lt; 0.001 vs. WD-treated group (<span class="html-italic">n</span> = 6 per group). Plus sign (+) and minus sign (−) indicate the presence and absence of oral administration of WD or AO extract in male C57BL/6 mice, respectively.</p>
Full article ">
18 pages, 2095 KiB  
Article
Unfavorable Dietary Quality Contributes to Elevated Risk of Ischemic Stroke among Residents in Southwest China: Based on the Chinese Diet Balance Index 2016 (DBI-16)
by Yingying Wang, Xu Su, Yun Chen, Yiying Wang, Jie Zhou, Tao Liu, Na Wang and Chaowei Fu
Nutrients 2022, 14(3), 694; https://doi.org/10.3390/nu14030694 - 7 Feb 2022
Cited by 11 | Viewed by 2771
Abstract
Background: Little is known about the effects of dietary quality on the risk of ischemic stroke among Southwest Chinese, and evidence from prospective studies is needed. We aimed to evaluate the associations of ischemic stroke with dietary quality assessed by the Chinese Diet [...] Read more.
Background: Little is known about the effects of dietary quality on the risk of ischemic stroke among Southwest Chinese, and evidence from prospective studies is needed. We aimed to evaluate the associations of ischemic stroke with dietary quality assessed by the Chinese Diet Balance Index 2016 (DBI-2016). Methods: The Guizhou Population Health Cohort Study (GPHCS) recruited 9280 residents aged 18 to 95 years from 12 areas in Guizhou Province, Southwest China. Baseline investigations, including information collections of diet and demographic characteristics, and anthropometric measurements were performed from 2010 to 2012. Dietary quality was assessed by using DBI-2016. The primary outcome was incident ischemic stroke diagnosed according to the International Classification of Diseases 10th revision (ICD-10) until December 2020. Data analyzed in the current study was from 7841 participants with complete information of diet assessments and ischemic stroke certification. Cox proportional hazards models were used to estimate the risk of ischemic stroke associated with dietary quality. Results: During a median follow-up of 6.63 years (range 1.11 to 9.53 years), 142 participants were diagnosed with ischemic stroke. Participants with ischemic stroke had a more excessive intake of cooking oils, alcoholic beverages, and salt, and had more inadequacy in meats than those without ischemic stroke. (p < 0.05). Compared with participants in the lowest quartile (Q1), those in the highest quartile (Q4) of the higher bound score (HBS) and of the dietary quality distance (DQD) had an elevated risk for ischemic stroke, with the corresponding hazard ratios (HRs) of 3.31 (95%CI: 1.57–6.97) and 2.26 (95%CI: 1.28–4.00), respectively, after adjustment for age, ethnic group, education level, marriage status, smoking and waist circumference, and the medical history of diabetes and hypertension at baseline. In addition, excessive intake levels (score 1–6) of cooking oils, excessive intake levels (score 1–6) of salt, and inadequate intake levels (score −12 to −7) of dietary variety were positively associated with an increased risk for ischemic stroke, with the multiple HRs of 3.00 (95%CI: 1.77–5.07), 2.03 (95%CI: 1.33–3.10) and 5.40 (95%CI: 1.70–17.20), respectively. Conclusions: Our results suggest that unfavorable dietary quality, including overall excessive consumption, excessive intake of cooking oils and salt, or under adequate dietary diversity, may increase the risk for ischemic stroke. Full article
Show Figures

Figure 1

Figure 1
<p>Flow chart of the study.</p>
Full article ">Figure 2
<p>Distribution of the diet quality stratified by area (urban/rural) and ethnic group (ethnic Han/minority): (<b>A</b>,<b>B</b>) for the lower bound score (LBS); (<b>C</b>,<b>D</b>) for the higher bound score (HBS); (<b>E</b>,<b>F</b>) for the diet quality distance (DQD).</p>
Full article ">Figure 3
<p>Adjusted hazard ratios (HRs) and 95% confidence intervals (95%CIs) for ischemic stroke associated with baseline dietary quality after stratified by the status of diabetes, hypertension, dyslipidemia, obesity, medication use and nutraceutical intake: (<b>A</b>) for the lower bound score (LBS); (<b>B</b>) for the higher bound score (HBS); (<b>C</b>) for the diet quality distance (DQD).</p>
Full article ">Figure 3 Cont.
<p>Adjusted hazard ratios (HRs) and 95% confidence intervals (95%CIs) for ischemic stroke associated with baseline dietary quality after stratified by the status of diabetes, hypertension, dyslipidemia, obesity, medication use and nutraceutical intake: (<b>A</b>) for the lower bound score (LBS); (<b>B</b>) for the higher bound score (HBS); (<b>C</b>) for the diet quality distance (DQD).</p>
Full article ">Figure 4
<p>Adjusted hazard ratios (HRs) and 95% confidence intervals (95%CIs) for ischemic stroke associated with baseline dietary quality after stratified by age, sex, area, and ethnic group: (<b>A</b>) for the lower bound score (LBS); (<b>B</b>) for the higher bound score (HBS); (<b>C</b>) for the diet quality distance (DQD); * <span class="html-italic">p</span> &lt; 0.05; ** <span class="html-italic">p</span> &lt; 0.01; *** <span class="html-italic">p</span> &lt; 0.001.</p>
Full article ">Figure 4 Cont.
<p>Adjusted hazard ratios (HRs) and 95% confidence intervals (95%CIs) for ischemic stroke associated with baseline dietary quality after stratified by age, sex, area, and ethnic group: (<b>A</b>) for the lower bound score (LBS); (<b>B</b>) for the higher bound score (HBS); (<b>C</b>) for the diet quality distance (DQD); * <span class="html-italic">p</span> &lt; 0.05; ** <span class="html-italic">p</span> &lt; 0.01; *** <span class="html-italic">p</span> &lt; 0.001.</p>
Full article ">
Previous Issue
Back to TopTop