[go: up one dir, main page]

Next Issue
Volume 25, September-2
Previous Issue
Volume 25, August-2
 
 
molecules-logo

Journal Browser

Journal Browser

Molecules, Volume 25, Issue 17 (September-1 2020) – 269 articles

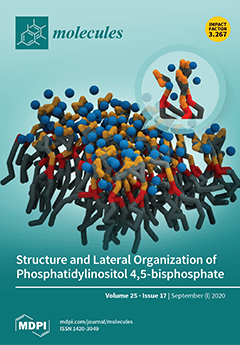
Cover Story (view full-size image): Phosphatidylinositol 4,5-bisphosphate (PI(4,5)P2) stands out from other plasma membrane lipids as one of the most important regulators of membrane-associated signaling events. PI(4,5)P2 is able to engage in a multitude of simultaneous cellular functions that are temporally and spatially regulated through the presence of localized transient pools of PI(4,5)P2 in the membrane. These pools are crucial for the recruitment, activation, and organization of signaling proteins and consequent regulation of downstream signaling. This review showcases some of the most important molecular and biophysical properties of PI(4,5)P2 as well as their impact on its membrane dynamics, lateral organization, and interactions with other biochemical partners. View this paper.
  • Issues are regarded as officially published after their release is announced to the table of contents alert mailing list.
  • You may sign up for e-mail alerts to receive table of contents of newly released issues.
  • PDF is the official format for papers published in both, html and pdf forms. To view the papers in pdf format, click on the "PDF Full-text" link, and use the free Adobe Reader to open them.
Order results
Result details
Section
Select all
Export citation of selected articles as:
17 pages, 21039 KiB  
Article
Evaluation of Self-Assembly Pathways to Control Crystallization-Driven Self-Assembly of a Semicrystalline P(VDF-co-HFP)-b-PEG-b-P(VDF-co-HFP) Triblock Copolymer
by Enrique Folgado, Matthias Mayor, Vincent Ladmiral and Mona Semsarilar
Molecules 2020, 25(17), 4033; https://doi.org/10.3390/molecules25174033 - 3 Sep 2020
Cited by 7 | Viewed by 3522
Abstract
To date, amphiphilic block copolymers (BCPs) containing poly(vinylidene fluoride-co-hexafluoropropene) (P(VDF-co-HFP)) copolymers are rare. At moderate content of HFP, this fluorocopolymer remains semicrystalline and is able to crystallize. Amphiphilic BCPs, containing a P(VDF-co-HFP) segment could, thus be appealing for the [...] Read more.
To date, amphiphilic block copolymers (BCPs) containing poly(vinylidene fluoride-co-hexafluoropropene) (P(VDF-co-HFP)) copolymers are rare. At moderate content of HFP, this fluorocopolymer remains semicrystalline and is able to crystallize. Amphiphilic BCPs, containing a P(VDF-co-HFP) segment could, thus be appealing for the preparation of self-assembled block copolymer morphologies through crystallization-driven self-assembly (CDSA) in selective solvents. Here the synthesis, characterization by 1H and 19F NMR spectroscopies, GPC, TGA, DSC, and XRD; and the self-assembly behavior of a P(VDF-co-HFP)-b-PEG-b-P(VDF-co-HFP) triblock copolymer were studied. The well-defined ABA amphiphilic fluorinated triblock copolymer was self-assembled into nano-objects by varying a series of key parameters such as the solvent and the non -solvent, the self-assembly protocols, and the temperature. A large range of morphologies such as spherical, square, rectangular, fiber-like, and platelet structures with sizes ranging from a few nanometers to micrometers was obtained depending on the self-assembly protocols and solvents systems used. The temperature-induced crystallization-driven self-assembly (TI-CDSA) protocol allowed some control over the shape and size of some of the morphologies. Full article
(This article belongs to the Special Issue Organofluorine Chemistry)
Show Figures

Graphical abstract

Graphical abstract
Full article ">Figure 1
<p>Normalized SEC chromatograms (viscometer detector) of P(VDF-<span class="html-italic">co</span>-HFP)-XA (black trace), PEGDA (red trace), P(VDF-<span class="html-italic">co</span>-HFP)-<span class="html-italic">b</span>-PEG-<span class="html-italic">b</span>-P(VDF-<span class="html-italic">co</span>-HFP) (blue trace), and chemical structure of the precursor polymers and final triblock copolymer.</p>
Full article ">Figure 2
<p>TEM images of the P(VDF-<span class="html-italic">co</span>-HFP)-<span class="html-italic">b</span>-PEG-<span class="html-italic">b</span>-P(VDF-<span class="html-italic">co</span>-HFP) triblock copolymer aggregates formed by thin-film rehydration with water after one week in pure water. Images (<b>a</b>) and (<b>b</b>) show the aggregates at two different magnifications.</p>
Full article ">Figure 3
<p>TEM images of self-assembled structures obtained by micellization of 1 mg mL<sup>−1</sup> solutions of the P(VDF-<span class="html-italic">co</span>-HFP)-<span class="html-italic">b</span>-PEG-<span class="html-italic">b</span>-P(VDF-<span class="html-italic">co</span>-HFP) triblock copolymer in (<b>a</b>) DMF, (<b>b</b>) acetone, employing ethanol as a selective solvent for PEG; and (<b>c</b>) DMF, (<b>d</b>) acetone, employing water as the selective solvent for PEG. Final concentration of all samples = 0.14 mg mL<sup>−1</sup>, solvent: selective solvent final ratio = 1:6.</p>
Full article ">Figure 4
<p>TEM images of self-assembled structures obtained by nanoprecipitation of 1 mg mL<sup>−1</sup> solutions of the P(VDF-<span class="html-italic">co</span>-HFP)-<span class="html-italic">b</span>-PEG-<span class="html-italic">b</span>-P(VDF-<span class="html-italic">co</span>-HFP) triblock copolymer in: (<b>a</b>) DMF, (<b>b</b>) acetone, (<b>c</b>) THF, employing ethanol as the selective solvent for PEG and (<b>d</b>) DMF, (<b>e</b>) acetone, (<b>f</b>) THF, employing water as the selective solvent for PEG. Final concentration of all samples = 0.09 mg mL<sup>−1</sup>. Solvent: selective-solvent final ratio = 1:10.</p>
Full article ">Figure 5
<p>TEM images of the self-assembled structures obtained after micellization and thermal annealing: Images (<b>a</b>–<b>c</b>) correspond to samples 3a, 3c, and 3d, respectively.</p>
Full article ">Figure 6
<p>TEM images of self-assembled P(VDF-<span class="html-italic">co</span>-HFP)-<span class="html-italic">b</span>-PEG-<span class="html-italic">b</span>-P(VDF-<span class="html-italic">co</span>-HFP) triblock copolymer using nanoprecipitation in octanol from a 1 mg mL<sup>−1</sup> THF solution: (<b>a</b>) Final concentration 0.1 mg mL<sup>−1</sup>. The solution was heated to 180 °C for 1 h and slowly cooled down to room temperature. Structures observed after: (<b>b</b>) 0 h, (<b>c</b>,<b>d</b>) 12 h, and (<b>e</b>,<b>f</b>) one week.</p>
Full article ">Scheme 1
<p>Synthesis of P(VDF-<span class="html-italic">co</span>-HFP) copolymer by RAFT.</p>
Full article ">
27 pages, 1355 KiB  
Review
Ethiopian Medicinal Plants Traditionally Used for the Treatment of Cancer, Part 2: A Review on Cytotoxic, Antiproliferative, and Antitumor Phytochemicals, and Future Perspective
by Solomon Tesfaye, Kaleab Asres, Ermias Lulekal, Yonatan Alebachew, Eyael Tewelde, Mallika Kumarihamy and Ilias Muhammad
Molecules 2020, 25(17), 4032; https://doi.org/10.3390/molecules25174032 - 3 Sep 2020
Cited by 13 | Viewed by 5439
Abstract
This review provides an overview on the active phytochemical constituents of medicinal plants that are traditionally used to manage cancer in Ethiopia. A total of 119 articles published between 1968 and 2020 have been reviewed, using scientific search engines such as ScienceDirect, PubMed, [...] Read more.
This review provides an overview on the active phytochemical constituents of medicinal plants that are traditionally used to manage cancer in Ethiopia. A total of 119 articles published between 1968 and 2020 have been reviewed, using scientific search engines such as ScienceDirect, PubMed, and Google Scholar. Twenty-seven medicinal plant species that belong to eighteen families are documented along with their botanical sources, potential active constituents, and in vitro and in vivo activities against various cancer cells. The review is compiled and discusses the potential anticancer, antiproliferative, and cytotoxic agents based on the types of secondary metabolites, such as terpenoids, phenolic compounds, alkaloids, steroids, and lignans. Among the anticancer secondary metabolites reported in this review, only few have been isolated from plants that are originated and collected in Ethiopia, and the majority of compounds are reported from plants belonging to different areas of the world. Thus, based on the available bioactivity reports, extensive and more elaborate ethnopharmacology-based bioassay-guided studies have to be conducted on selected traditionally claimed Ethiopian anticancer plants, which inherited from a unique and diverse landscape, with the aim of opening a way forward to conduct anticancer drug discovery program. Full article
Show Figures

Graphical abstract

Graphical abstract
Full article ">Figure 1
<p>Major plant families (in %) of reviewed plants species vegetation zone of Ethiopia [<a href="#B18-molecules-25-04032" class="html-bibr">18</a>] (the unmarked blocks are other species).</p>
Full article ">Figure 2
<p>Structures of anticancer terpenoids reported from plants available in Ethiopia.</p>
Full article ">Figure 2 Cont.
<p>Structures of anticancer terpenoids reported from plants available in Ethiopia.</p>
Full article ">Figure 3
<p>Structures of anticancer phenolic compounds reported from plants available in Ethiopia.</p>
Full article ">Figure 4
<p>Structures of anticancer alkaloids reported from plants present in Ethiopia.</p>
Full article ">Figure 5
<p>Structures of anticancer steroids and lignans reported from plants available in Ethiopia.</p>
Full article ">
31 pages, 5989 KiB  
Review
Peptidyl Fluoromethyl Ketones and Their Applications in Medicinal Chemistry
by Andrea Citarella and Nicola Micale
Molecules 2020, 25(17), 4031; https://doi.org/10.3390/molecules25174031 - 3 Sep 2020
Cited by 24 | Viewed by 5276
Abstract
Peptidyl fluoromethyl ketones occupy a pivotal role in the current scenario of synthetic chemistry, thanks to their numerous applications as inhibitors of hydrolytic enzymes. The insertion of one or more fluorine atoms adjacent to a C-terminal ketone moiety greatly modifies the physicochemical [...] Read more.
Peptidyl fluoromethyl ketones occupy a pivotal role in the current scenario of synthetic chemistry, thanks to their numerous applications as inhibitors of hydrolytic enzymes. The insertion of one or more fluorine atoms adjacent to a C-terminal ketone moiety greatly modifies the physicochemical properties of the overall substrate, especially by increasing the reactivity of this functionalized carbonyl group toward nucleophiles. The main application of these peptidyl α-fluorinated ketones in medicinal chemistry relies in their ability to strongly and selectively inhibit serine and cysteine proteases. These compounds can be used as probes to study the proteolytic activity of the aforementioned proteases and to elucidate their role in the insurgence and progress on several diseases. Likewise, if the fluorinated methyl ketone moiety is suitably connected to a peptidic backbone, it may confer to the resulting structure an excellent substrate peculiarity and the possibility of being recognized by a specific subclass of human or pathogenic proteases. Therefore, peptidyl fluoromethyl ketones are also currently highly exploited for the target-based design of compounds for the treatment of topical diseases such as various types of cancer and viral infections. Full article
(This article belongs to the Section Medicinal Chemistry)
Show Figures

Figure 1

Figure 1
<p>Schematic representation of the possible inhibitory mechanisms of action of all types of peptidyl fluoromethyl ketones (PFMKs).</p>
Full article ">Figure 2
<p>Chemical structure, Cat-B inhibitory potency, and most relevant modifications of the first synthesized m-PFMK.</p>
Full article ">Figure 3
<p>Chemical structures, progressive structure–activity relationship (SAR) analysis, and some biological results of the most relevant m-PFMKs developed by Wang Y. et al.</p>
Full article ">Figure 4
<p>Main interactions observed for Ac-DVAD-FMK with Casp-3. The inhibitor was found covalently bound to the enzyme via formation of a thioether linkage with the side chain of Cys163.</p>
Full article ">Figure 5
<p>Chemical structure and some relevant biological data of the most representative tripeptidyl m-FMK (i.e., Z-VAD-fmk) and tetrapeptidyl m-FMK (i.e., Z-DEVD-fmk).</p>
Full article ">Figure 6
<p>Chemical structure, SAR analysis, and biological activity of the most relevant m-PFMKs developed by Chatterjee S. et al. mainly as calpain I inhibitors.</p>
Full article ">Figure 7
<p>Chemical structure and biological activity of the biotinylated activity-based probe bearing a m-FMK <span class="html-italic">C</span>-terminal warhead developed by Funeriu’s research group.</p>
Full article ">Figure 8
<p>Chemical structure of the most relevant m-PFMK as protozoan cysteine protease inhibitor (Z-Phe-Arg-CH<sub>2</sub>F), together with biological activity and chemical modifications in relation to its antimalarial activity.</p>
Full article ">Figure 9
<p>The 2D structure of Z-Tyr-Ala-CH<sub>2</sub>F in complex with cruzain. The 2D plot was generated by LigPlot+ (2.1, EMBL-EBI, Wellcome Genome Campus, Hinxton, Cambridgeshire, United Kingdom); hydrogen bonds are shown as green dotted lines, while the spoked arcs represent residues making nonbonded contacts with the ligand.</p>
Full article ">Figure 10
<p>Chemical structures, SAR analysis, and biological results (protection from cytopathic effect in infected cells) of the most relevant m-PFMKs developed by Zhang H.-Z. et al.</p>
Full article ">Figure 11
<p>Chemical structures, biological activity, and comparative analysis of most relevant d-PFMKs developed by Imperiali B. and Abeles R.H.</p>
Full article ">Figure 12
<p>Chemical structure and biological activity of the symmetrical pseudo-peptide developed by Sham H.L. et al. as inhibitor of HIV-1 protease.</p>
Full article ">Figure 13
<p>Chemical structures, progressive SAR analysis, and <span class="html-italic">K</span><sub>i</sub> values towards human leukocyte elastase (HLE) of the most relevant t-PFMKs developed by Brown F.J. and co-workers.</p>
Full article ">Figure 14
<p>A stereo view of the inhibitor Ac-Ala-Pro-Val-CF<sub>3</sub> in the extended binding site of porcine pancreatic elastase [<a href="#B116-molecules-25-04031" class="html-bibr">116</a>].</p>
Full article ">Figure 15
<p>Chemical structures and <span class="html-italic">K</span><sub>i</sub> values towards HLE of the two most relevant t-PFMKs developed by Peet N.P. et al.</p>
Full article ">Figure 16
<p>Chemical structure, partial SAR analysis, and <span class="html-italic">K</span><sub>i</sub> values towards human chymase of the t-PFMKs developed by Akahoshi F. and co-workers.</p>
Full article ">Figure 17
<p>Structures and activity of the t-PFMKs developed as HDAC inhibitors.</p>
Full article ">Figure 18
<p>Structure and activity of the t-PFMK developed by Yin Z. et al. as Dengue virus NS3 inhibitor.</p>
Full article ">Figure 19
<p>Chemical structure, SAR analysis, and activity against SARS-CoV 3CL<sup>pro</sup> of the most relevant t-PFMK developed by Bacha U. et al.</p>
Full article ">
19 pages, 9056 KiB  
Article
Construction of Molecular Model and Adsorption of Collectors on Bulianta Coal
by He Zhang, Peng Xi, Qiming Zhuo and Wenli Liu
Molecules 2020, 25(17), 4030; https://doi.org/10.3390/molecules25174030 - 3 Sep 2020
Cited by 17 | Viewed by 2979
Abstract
To study the effects of different oxygen functional groups on the quality of flotation clean low-rank coal, two kinds of collectors with different oxygen-containing functional groups, methyl laurate, and dodecanol, were selected and their flotation behaviors were investigated. The Bulianta coal was the [...] Read more.
To study the effects of different oxygen functional groups on the quality of flotation clean low-rank coal, two kinds of collectors with different oxygen-containing functional groups, methyl laurate, and dodecanol, were selected and their flotation behaviors were investigated. The Bulianta coal was the typical sub-bituminous coal in China, and the coal molecular model of which was constructed based on proximate analysis, ultimate analysis, 13C-NMR, and XPS. The chemical structure model of the coal molecule was optimized, and the periodic boundary condition was added via the method of molecular dynamics methods. The different combined systems formed by collectors, water, and a model surface of Bulianta coal have been studied using molecular dynamics simulation. The simulation results of dodecanol and methyl laurate on the surface of Bulianta coal show that dodecanol molecules are not evenly adsorbed on the surface of coal, and have higher adsorption capacity near carboxyl and hydroxyl groups, but less adsorption capacity near carbonyl and ether bonds. Methyl laurate can completely cover the oxygen-containing functional groups on the coal surface. Compared with dodecanol, methyl laurate can effectively improve the hydrophobicity of the Bulianta coal surface, which is consistent with the results of the XPS test and the flotation test. Full article
Show Figures

Figure 1

Figure 1
<p>XPS O 1s spectrum of Bulianta coal.</p>
Full article ">Figure 2
<p>XPS N 1s spectrum of Bulianta coal.</p>
Full article ">Figure 3
<p>Experimental and calculated <sup>13</sup>C-NMR spectrum of the Bulianta coal.</p>
Full article ">Figure 4
<p>The plane structure model of the Bulianta coal.</p>
Full article ">Figure 5
<p>Change of calculated density with time.</p>
Full article ">Figure 6
<p>The 3D structure model of Bulianta coal (45 Å × 45 Å × 45 Å).</p>
Full article ">Figure 7
<p>The structures of the selected collectors: (<b>a</b>) methyl laurate and (<b>b</b>) dodecanol. The representation of gray, white, and red is the C, H, and O atom, respectively.</p>
Full article ">Figure 8
<p>The equilibrium adsorption configuration on the surface of Bulianta coal in an aqueous environment: (<b>a</b>) Water/methyl laurate/coal system and (<b>b</b>) water/dodecanol/coal. For clarity, the coal surface models are shown as black.</p>
Full article ">Figure 9
<p>The spatial equilibrium structures of collectors adsorbed on Bulianta coal. (<b>a</b>) Methyl laurate; (<b>b</b>) dodecanol.</p>
Full article ">Figure 10
<p>Mass density distributions of coal, collectors, and water: (<b>a</b>) Water/coal, (<b>b</b>) water/methyl laurate/coal, and (<b>c</b>) water/dodecanol/coal system.</p>
Full article ">Figure 11
<p>Density profiles of hydrophobic tails and hydrophilic head groups of collectors: (<b>a</b>) Methyl laurate; (<b>b</b>) dodecanol.</p>
Full article ">Figure 12
<p>RDFs between the collector oxygen atoms and functional groups of Bulianta coal. (<b>a</b>) Carboxyl; (<b>b</b>) hydroxyl; (<b>c</b>) carbonyl; (<b>d</b>) ether bond.</p>
Full article ">Figure 12 Cont.
<p>RDFs between the collector oxygen atoms and functional groups of Bulianta coal. (<b>a</b>) Carboxyl; (<b>b</b>) hydroxyl; (<b>c</b>) carbonyl; (<b>d</b>) ether bond.</p>
Full article ">Figure 13
<p>Mean square displacement (MSD) curves of water molecules.</p>
Full article ">Figure 14
<p>XPS C 1s spectrum of (<b>a</b>) raw coal, (<b>b</b>) the coal surface after the adsorption of methyl laurate, (<b>c</b>) the coal surface after the adsorption of dodecanol.</p>
Full article ">Figure 15
<p>Effect of two kinds of collectors on Bulianta coal flotation. (<b>a</b>) Clean coal yield, (<b>b</b>) concentrate ash content.</p>
Full article ">
13 pages, 1641 KiB  
Article
On Viscous Flow in Glass-Forming Organic Liquids
by Michael I. Ojovan
Molecules 2020, 25(17), 4029; https://doi.org/10.3390/molecules25174029 - 3 Sep 2020
Cited by 9 | Viewed by 2792
Abstract
The two-exponential Sheffield equation of viscosity η(T) = A1·T·[1 + A2·exp(Hm/RT)]·[1 + C·exp(Hd/RT)], where A1, A2, Hm, C, and Hm are material-specific constants, is used to analyze the [...] Read more.
The two-exponential Sheffield equation of viscosity η(T) = A1·T·[1 + A2·exp(Hm/RT)]·[1 + C·exp(Hd/RT)], where A1, A2, Hm, C, and Hm are material-specific constants, is used to analyze the viscous flows of two glass-forming organic materials—salol and α-phenyl-o-cresol. It is demonstrated that the viscosity equation can be simplified to a four-parameter version: η(T) = A·T·exp(Hm/RT)]·[1 + C·exp(Hd/RT)]. The Sheffield model gives a correct description of viscosity, with two exact Arrhenius-type asymptotes below and above the glass transition temperature, whereas near the Tg it gives practically the same results as well-known and widely used viscosity equations. It is revealed that the constants of the Sheffield equation are not universal for all temperature ranges and may need to be updated for very high temperatures, where changes occur in melt properties leading to modifications of A and Hm for both salol and α-phenyl-o-cresol. Full article
(This article belongs to the Special Issue Physical Chemistry of Aqueous Solutions and Glass Forming Systems)
Show Figures

Graphical abstract

Graphical abstract
Full article ">Figure 1
<p>The activation energy of the viscosity Q(T) for vitreous and molten B<sub>2</sub>O<sub>3</sub>. Experimental data are taken from [<a href="#B23-molecules-25-04029" class="html-bibr">23</a>]. The orange circle indicates the position of glass transition temperature T<sub>g</sub> = 580 K.</p>
Full article ">Figure 2
<p>The viscosity of vitreous and molten salol. The theoretical curve was calculated using the two Sheffield equations (Equations (1) and (2)). Experimental data were taken from [<a href="#B33-molecules-25-04029" class="html-bibr">33</a>], with the red circle indicating the T<sub>g</sub> = 220 K [<a href="#B33-molecules-25-04029" class="html-bibr">33</a>]. The inset shows the temperature dependence of factor [1 + C·exp(H<sub>d</sub>/RT)] in Equations (1) and (2).</p>
Full article ">Figure 3
<p>The viscosity of vitreous and molten salol over a wide temperature range. The theoretical curve was calculated using Equation (2), with the same parameters A, H<sub>m</sub>, C, and H<sub>d</sub> used at all temperatures. Experimental data were taken from [<a href="#B33-molecules-25-04029" class="html-bibr">33</a>] for lower temperatures (T &lt; 280 K) and from [<a href="#B37-molecules-25-04029" class="html-bibr">37</a>] for the high temperature range (T &gt; 320 K). The inset shows the viscosity curve by VFT approximation [<a href="#B33-molecules-25-04029" class="html-bibr">33</a>].</p>
Full article ">Figure 4
<p>The viscosity of vitreous and molten α-phenyl-<span class="html-italic">o</span>-cresol using the two Sheffield equations (Equations (1) and (2)). Experimental data were taken from [<a href="#B33-molecules-25-04029" class="html-bibr">33</a>], with the red circle indicating T<sub>g</sub> = 220 K [<a href="#B33-molecules-25-04029" class="html-bibr">33</a>]. The inset shows the temperature dependence of factor [1 + C·exp(H<sub>d</sub>/RT)] in Equations (1) and (2).</p>
Full article ">
35 pages, 3248 KiB  
Review
Interacting Quantum Atoms—A Review
by José Manuel Guevara-Vela, Evelio Francisco, Tomás Rocha-Rinza  and Ángel Martín Pendás
Molecules 2020, 25(17), 4028; https://doi.org/10.3390/molecules25174028 - 3 Sep 2020
Cited by 74 | Viewed by 5216
Abstract
The aim of this review is threefold. On the one hand, we intend it to serve as a gentle introduction to the Interacting Quantum Atoms (IQA) methodology for those unfamiliar with it. Second, we expect it to act as an up-to-date reference of [...] Read more.
The aim of this review is threefold. On the one hand, we intend it to serve as a gentle introduction to the Interacting Quantum Atoms (IQA) methodology for those unfamiliar with it. Second, we expect it to act as an up-to-date reference of recent developments related to IQA. Finally, we want it to highlight a non-exhaustive, yet representative set of showcase examples about how to use IQA to shed light in different chemical problems. To accomplish this, we start by providing a brief context to justify the development of IQA as a real space alternative to other existent energy partition schemes of the non-relativistic energy of molecules. We then introduce a self-contained algebraic derivation of the methodological IQA ecosystem as well as an overview of how these formulations vary with the level of theory employed to obtain the molecular wavefunction upon which the IQA procedure relies. Finally, we review the several applications of IQA as examined by different research groups worldwide to investigate a wide variety of chemical problems. Full article
(This article belongs to the Special Issue Electron Density Analysis Tools)
Show Figures

Figure 1

Figure 1
<p>Regions of definition of the <math display="inline"><semantics> <mrow> <msubsup> <mi>D</mi> <mrow> <msub> <mi>l</mi> <mn>1</mn> </msub> <msub> <mi>m</mi> <mn>1</mn> </msub> </mrow> <mrow> <msub> <mi>l</mi> <mn>2</mn> </msub> <msub> <mi>m</mi> <mn>2</mn> </msub> </mrow> </msubsup> <mrow> <mo stretchy="false">(</mo> <msub> <mi>r</mi> <mn>1</mn> </msub> <mo>,</mo> <msub> <mi>r</mi> <mn>2</mn> </msub> <mo>,</mo> <mi mathvariant="bold-italic">R</mi> <mo stretchy="false">)</mo> </mrow> </mrow> </semantics></math> function.</p>
Full article ">Figure 2
<p>Biphenyl representations. Schematic (<b>left</b>) and non-overlapping topological atoms bounded by interatomic surfaces (<b>right</b>). Figure from reference [<a href="#B80-molecules-25-04028" class="html-bibr">80</a>].</p>
Full article ">Figure 3
<p>Interacting quantum atoms (IQA) allows for the individual changes in IQA interaction components accompanying the formation of the different hydrogen bonds. Figure from reference [<a href="#B98-molecules-25-04028" class="html-bibr">98</a>] shows systems with insaturations and intramolecular HBs (<b>a</b>,<b>b</b>), along with their non-conjugated counterparts (<b>c</b>,<b>d</b>). Figure reproduced by permission of the PCCP Owner Societies.</p>
Full article ">Figure 4
<p>IQA energy partition of the FB<sub>r</sub> ⋯ NH<math display="inline"><semantics> <msub> <mrow/> <mn>3</mn> </msub> </semantics></math> complex. (<b>Top</b>) changes intra-atomic energies (red) and intermolecular interactions (classical and exchange terms in blue and green, respectively). (<b>Bottom</b>) Change in interatomic energies within each fragment upon complex formation. Figure reprinted (adapted) with permission from reference [<a href="#B98-molecules-25-04028" class="html-bibr">98</a>]. Copyright 2020 American Chemical Society.</p>
Full article ">Figure 5
<p>Diagram representing the changes in the strength of the different bonds. The greens arrows represent bond strengthening/forming and while the red ones bond weakening/breaking. Figure taken from Reference [<a href="#B125-molecules-25-04028" class="html-bibr">125</a>].</p>
Full article ">Figure 6
<p>Atomic volume of one of the congested hydrogen atoms in tetra- cyclododecane at a H...H distance of 2.4 Å (<b>top</b>), the equilibrium distance of 1.831 Å (<b>middle</b>), and 0.5 Å (<b>bottom</b>). Figure taken from reference [<a href="#B141-molecules-25-04028" class="html-bibr">141</a>].</p>
Full article ">Figure 7
<p>Flowchart representing the different stages in the training (first four steps) and execution (DL_POLY) of the, detailing the programs involved and summaries of their tasks. Figure taken from reference [<a href="#B147-molecules-25-04028" class="html-bibr">147</a>].</p>
Full article ">
12 pages, 2789 KiB  
Article
IgY Targeting Bacterial Quorum-Sensing Molecules in Implant-Associated Infections
by Ulrike Dapunt, Birgit Prior, Christopher Oelkrug and Jan Philippe Kretzer
Molecules 2020, 25(17), 4027; https://doi.org/10.3390/molecules25174027 - 3 Sep 2020
Cited by 7 | Viewed by 3029
Abstract
Background: Implant-associated infections are still a major complication in the field of orthopedics. Bacteria can form biofilms on implant surfaces, making them more difficult to detect and treat. Since standard antibiotic therapy is often impaired in biofilm infections, particular interest is directed [...] Read more.
Background: Implant-associated infections are still a major complication in the field of orthopedics. Bacteria can form biofilms on implant surfaces, making them more difficult to detect and treat. Since standard antibiotic therapy is often impaired in biofilm infections, particular interest is directed towards finding treatment alternatives. Biofilm-formation is a well-organized process during which bacteria communicate via quorum-sensing molecules (QSM). The aim of this study was to inhibit bacterial communication by directing avian IgY against specific QSM. Methods: Chicken were immunized against the following QSM: (1) AtlE, a member of the autolysin family which mediates attachment to a surface in Staphylococcus epidermidis; (2) GroEL, the bacterial heat shock protein; (3) PIA (polysaccharide intercellular adhesion), which is essential for cell–cell adhesion in biofilms. Staphylococcus epidermidis biofilms were grown and inhibition of biofilm-formation by IgYs was evaluated. Additionally, human osteoblasts were cultivated and biocompatibility of IgYs was tested. Results: We were able to demonstrate that all IgYs reduced biofilm-formation, also without prior immunization. Therefore, the response was probably not specific with regard to the QSM. Osteoblasts were activated by all IgYs which was demonstrated by microscopy and an increased release of IL-8. Conclusions: In conclusion, avian IgY inhibits biofilm-formation, though the underlying mechanism is not yet clear. However, adverse effects on local tissue cells (osteoblasts) were also observed. Full article
Show Figures

Figure 1

Figure 1
<p>Staining of Staphylococcus epidermidis biofilms with Mira-2-ton after 6, 24 and 48 h. Bacteria were adjusted to a concentration of 3 × 10<sup>6</sup>/2 mL and incubated at 37 °C, shaking at 60 rpm.</p>
Full article ">Figure 2
<p>Staining of <span class="html-italic">Staphylococcus</span> epidermidis biofilms after 24 h incubation with IgY3 (10 µg/mL). Biofilm formation was significantly reduced when compared to results after 24 h incubation without antibodies as shown in <a href="#molecules-25-04027-f001" class="html-fig">Figure 1</a>.</p>
Full article ">Figure 3
<p>Inhibition of biofilm formation in % after 24 h incubation with 5, 10 and 20 µg/mL IgY1.</p>
Full article ">Figure 4
<p>Inhibition of biofilm formation in % after 24 h incubation with 5, 10 and 20 µg/mL IgY2.</p>
Full article ">Figure 5
<p>Inhibition of biofilm formation in % after 24 h incubation with 5, 10 and 20 µg/mL IgY3.</p>
Full article ">Figure 6
<p>Inhibition of biofilm formation in % after 24 h incubation with 5, 10 and 20 µg/mL IgY without prior immunization.</p>
Full article ">Figure 7
<p>Human osteoblasts were cultivated from human bone marrow which was collected during surgery from patients who required an autologous bone graft. Cells were cultivated in osteoblast growth medium and after 10–14 days homogenous cell layers were seen. Osteoblasts were used for a maximum of two passages.</p>
Full article ">Figure 8
<p>After incubation with avian IgYs for 24 h, osteoblasts were partially detached from the surface which indicates activation.</p>
Full article ">Figure 9
<p>Osteoblasts were incubated with IgY1-3 and IgYcontrol at various concentrations. After 24 h supernatants were collected for IL-8 ELISA analysis. Experiments were carried out with multiple donors (<span class="html-italic">n</span> = 4). Individual results varied widely, but an increased release of IL-8 could be seen in all donors. This figure shows the results of one donor as an example.</p>
Full article ">
69 pages, 6280 KiB  
Review
Review of Chromatographic Methods Coupled with Modern Detection Techniques Applied in the Therapeutic Drugs Monitoring (TDM)
by Tomasz Tuzimski and Anna Petruczynik
Molecules 2020, 25(17), 4026; https://doi.org/10.3390/molecules25174026 - 3 Sep 2020
Cited by 70 | Viewed by 9696
Abstract
Therapeutic drug monitoring (TDM) is a tool used to integrate pharmacokinetic and pharmacodynamics knowledge to optimize and personalize various drug therapies. The optimization of drug dosing may improve treatment outcomes, reduce toxicity, and reduce the risk of developing drug resistance. To adequately implement [...] Read more.
Therapeutic drug monitoring (TDM) is a tool used to integrate pharmacokinetic and pharmacodynamics knowledge to optimize and personalize various drug therapies. The optimization of drug dosing may improve treatment outcomes, reduce toxicity, and reduce the risk of developing drug resistance. To adequately implement TDM, accurate and precise analytical procedures are required. In clinical practice, blood is the most commonly used matrix for TDM; however, less invasive samples, such as dried blood spots or non-invasive saliva samples, are increasingly being used. The choice of sample preparation method, type of column packing, mobile phase composition, and detection method is important to ensure accurate drug measurement and to avoid interference from matrix effects and drug metabolites. Most of the reported procedures used liquid chromatography coupled with tandem mass spectrometry (LC-MS/MS) techniques due to its high selectivity and sensitivity. High-performance chromatography with ultraviolet detection (HPLC-UV) methods are also used when a simpler and more cost-effective methodology is desired for clinical monitoring. The application of high-performance chromatography with fluorescence detection (HPLC-FLD) with and without derivatization processes and high-performance chromatography with electrochemical detection (HPLC-ED) techniques for the analysis of various drugs in biological samples for TDM have been described less often. Before chromatographic analysis, samples were pretreated by various procedures—most often by protein precipitation, liquid–liquid extraction, and solid-phase extraction, rarely by microextraction by packed sorbent, dispersive liquid–liquid microextraction. The aim of this article is to review the recent literature (2010–2020) regarding the use of liquid chromatography with various detection techniques for TDM. Full article
Show Figures

Graphical abstract

Graphical abstract
Full article ">Figure 1
<p>Multiple reaction monitoring (MRM) chromatograms of the immunosuppressants: cyclosporine A (CsA), Tacrolimus (TcR), Sirolimus (SiR), and Everolimus (EvE) in the whole blood of four patients taking different immunosuppressive drugs. The measured concentration was 42.2 for CsA, 6.5 for TrC, 11.1 for SiR, and 7.0 ng mL<sup>−1</sup> for EvE [<a href="#B15-molecules-25-04026" class="html-bibr">15</a>].</p>
Full article ">Figure 2
<p>Representative HPLC-UV chromatograms of (<b>A</b>) blank human plasma, (<b>B</b>) lower limit of quantification of enzalutamide and <span class="html-italic">N</span>-desmethyl enzalutamide (0.50 μg/mL for both) and nilutamide (internal standard), (<b>C</b>) plasma from a metastatic castration-resistant prostate cancer patient treated with 160 mg of enzalutamide once daily (plasma concentration of enzalutamide and <span class="html-italic">N</span>-desmethylenzalutamide: 10.9 μg/mL and 12.4 μg/mL, respectively) [<a href="#B35-molecules-25-04026" class="html-bibr">35</a>].</p>
Full article ">Figure 2 Cont.
<p>Representative HPLC-UV chromatograms of (<b>A</b>) blank human plasma, (<b>B</b>) lower limit of quantification of enzalutamide and <span class="html-italic">N</span>-desmethyl enzalutamide (0.50 μg/mL for both) and nilutamide (internal standard), (<b>C</b>) plasma from a metastatic castration-resistant prostate cancer patient treated with 160 mg of enzalutamide once daily (plasma concentration of enzalutamide and <span class="html-italic">N</span>-desmethylenzalutamide: 10.9 μg/mL and 12.4 μg/mL, respectively) [<a href="#B35-molecules-25-04026" class="html-bibr">35</a>].</p>
Full article ">Figure 3
<p>The profiles of epirubicin concentrations in plasma samples from a 19-year-old patient with metastatic alveolar rhabdomyosarcoma after a 6-hour intravenous infusion of epirubicin (150 mg/m<sup>2</sup>) [<a href="#B37-molecules-25-04026" class="html-bibr">37</a>].</p>
Full article ">Figure 4
<p>MS/MS mass spectra of sunitinib (SUN) (<b>a</b>) and <span class="html-italic">N</span>-desethyl SUN (<b>b</b>) with chemical structures and identification of the main fragment ions (CE = 30 V); the 238 m/z fragment was obtained with CE = 60 V for both the analytes [<a href="#B40-molecules-25-04026" class="html-bibr">40</a>].</p>
Full article ">Figure 5
<p>Correlation of daptomycin dose through serum level (C min) and clinical outcome [<a href="#B59-molecules-25-04026" class="html-bibr">59</a>].</p>
Full article ">Figure 6
<p>Scatterplots with linear mixed modeling to assess the agreement between voriconazole concentrations in saliva and unbound (<b>a</b>) and total (<b>b</b>) plasma voriconazole concentrations, and the agreement between unbound and total plasma voriconazole concentrations (<b>c</b>). The identity lines are presented as dashed lines, and the regression lines are depicted as solid lines. In panel (<b>b</b>), the dashed–dotted line represents the regression line when total plasma voriconazole concentrations above 10 mg/L are excluded [<a href="#B82-molecules-25-04026" class="html-bibr">82</a>].</p>
Full article ">Figure 7
<p>Time-course of the drug levels (measured both in liquid plasma and dried plasma spot (DPS) samples) in a patient under therapy. Time course of drug through concentrations in plasma samples from four different patients receiving different combined interferon-free antiviral therapies. Concentration of the drugs (ng/mL) are plotted vs. time (days) since the beginning of therapy. TDM was performed every other week for three months. (<b>A</b>). Blue diamond = liquid plasma ribavirin (RBV), purple cross = dried plasma spot (DPS) RBV, red square = liquid plasma sofosbuvir (SOF), light blue star = DPS SOF, green triangle = liquid plasma metabolite GS 331007 (SOFM) and orange circle = DPS SOFM concentration, respectively. (<b>B</b>). Blue diamond = liquid plasma RBV, red square = DPS RBV, green triangle = liquid plasma Daclatasvir (DAC), purple cross = DPS DAC, light blue star = liquid plasma Simeprevir (SIM) and orange circle = DPS SIM concentration respectively. (<b>C</b>). Blue diamond = liquid plasma RBV, red square = DPS RBV, green triangle = liquid plasma Boceprevir (BOC), purple cross = DPS BOC concentration, respectively. (<b>D</b>). Blue diamond = liquid plasma RBV, red square = DPS RBV, green triangle = liquid plasma Telaprevir (TVR), purple cross = DPS TVR concentration, respectively [<a href="#B94-molecules-25-04026" class="html-bibr">94</a>].</p>
Full article ">Figure 8
<p>Milrinone serum concentration time profiles for 3 patients post-cardiac surgery (marked in orange, blue, grey). Solid black line at 150 and 300 μg/L indicate therapeutic range [<a href="#B105-molecules-25-04026" class="html-bibr">105</a>].</p>
Full article ">Figure 9
<p>Chromatograms of plasma samples from patients subjected to therapy with tricyclic antidepressants. Stationary phase: C8 column (150 × 4.6 mm particle size (id), 5 μm); mobile phase: ACN/pH 3.0, 50 mM phosphate buffer (32:68 <span class="html-italic">v</span>/<span class="html-italic">v</span>); flow rate: 1 mL/min; detection: 220 nm; loop: 50 μL [<a href="#B113-molecules-25-04026" class="html-bibr">113</a>]. Abbreviations: 8-hydroxyamoxapine (OH-CLM), internal standard (IS), nortriptyline (NORTRP), <span class="html-italic">N,N</span>-didesmethylclomipramine (DINORCLM), amitriptyline (TRP), triprolidine N-oxide (NOX-TRP), <span class="html-italic">N</span>-desmethylclomipramine (NORCLM), clomipramine (CLM) (<b>A</b>). Chromatogram obtained for plasma samples from a patient undergoing polypharmacy with triprolidine and clomipramine; (<b>B</b>). chromatogram obtained for plasma samples from a patient undergoing monotherapy with clomipramine [<a href="#B112-molecules-25-04026" class="html-bibr">112</a>].</p>
Full article ">Figure 10
<p>Extraction procedure of fluoxetine by stir bar sorptive extraction (SBSE) in plasma [<a href="#B115-molecules-25-04026" class="html-bibr">115</a>].</p>
Full article ">Figure 11
<p>Dried blood spot extraction and sample purification workflow [<a href="#B111-molecules-25-04026" class="html-bibr">111</a>].</p>
Full article ">Figure 12
<p>Concentration–time profiles of lamotrigine (LTG) obtained from plasma and saliva samples collected at 2, 4, 8, and 12 h post-dose (taking as reference the morning dose) in two patients (ID1 and ID2) under oral LTG therapy (ID1, 100 mg once-daily in the morning; ID2, 150 mg in the morning, and 200 mg at night in cotherapy with valproic acid). The corresponding salivary to plasma LTG concentration ratios were also calculated at 2, 4, 8, and 12 h post-dose and graphically represented for both patients [<a href="#B131-molecules-25-04026" class="html-bibr">131</a>].</p>
Full article ">Figure 13
<p>Representative chromatogram with retention times of dabigatran, <sup>13</sup>C<sub>6</sub>-dabigatran, rivaroxaban, <sup>13</sup>C<sub>6</sub>-rivaroxaban, apixaban, and <sup>13</sup>C, <sup>2</sup>H<sub>7</sub> apixaban [<a href="#B148-molecules-25-04026" class="html-bibr">148</a>].</p>
Full article ">Figure 14
<p>Gliflozin’s pharmacokinetic profile in association with metformin (1000 mg). The gliflozin doses were 100, 10, and 10 mg for canagliflozin, dapagliflozin, and empagliflozin, respectively. Data are presented as a mean ± standard deviation and n = 6 for each group [<a href="#B150-molecules-25-04026" class="html-bibr">150</a>].</p>
Full article ">
25 pages, 8035 KiB  
Article
Mechanistic Insights into the Chaperoning of Human Lysosomal-Galactosidase Activity: Highly Functionalized Aminocyclopentanes and C-5a-Substituted Derivatives of 4-epi-Isofagomine
by Patrick Weber, Martin Thonhofer, Summer Averill, Gideon J. Davies, Andres Gonzalez Santana, Philipp Müller, Seyed A. Nasseri, Wendy A. Offen, Bettina M. Pabst, Eduard Paschke, Michael Schalli, Ana Torvisco, Marion Tschernutter, Christina Tysoe, Werner Windischhofer, Stephen G. Withers, Andreas Wolfsgruber, Tanja M. Wrodnigg and Arnold E. Stütz
Molecules 2020, 25(17), 4025; https://doi.org/10.3390/molecules25174025 - 3 Sep 2020
Cited by 7 | Viewed by 3405
Abstract
Glycosidase inhibitors have shown great potential as pharmacological chaperones for lysosomal storage diseases. In light of this, a series of new cyclopentanoid β-galactosidase inhibitors were prepared and their inhibitory and pharmacological chaperoning activities determined and compared with those of lipophilic analogs of the [...] Read more.
Glycosidase inhibitors have shown great potential as pharmacological chaperones for lysosomal storage diseases. In light of this, a series of new cyclopentanoid β-galactosidase inhibitors were prepared and their inhibitory and pharmacological chaperoning activities determined and compared with those of lipophilic analogs of the potent β-d-galactosidase inhibitor 4-epi-isofagomine. Structure-activity relationships were investigated by X-ray crystallography as well as by alterations in the cyclopentane moiety such as deoxygenation and replacement by fluorine of a “strategic” hydroxyl group. New compounds have revealed highly promising activities with a range of β-galactosidase-compromised human cell lines and may serve as leads towards new pharmacological chaperones for GM1-gangliosidosis and Morquio B disease. Full article
(This article belongs to the Special Issue Targeting Carbohydrate–Protein Interactions)
Show Figures

Figure 1

Figure 1
<p>Galactosidase inhibitors as potential therapeutic chaperones for mutation induced deficiencies of lysosomal β-galactosidase.</p>
Full article ">Figure 2
<p>Inhibitors <b>15</b>–<b>17</b>.</p>
Full article ">Figure 3
<p>Crystal structure of compound <b>33</b> (CCDC 2018297).</p>
Full article ">Figure 4
<p>Overlay of DGJ in structures with human β-gal and <span class="html-italic">Cj</span>GH35. Side-chains, and main-chain for Ala128 in human β-gal, forming hydrogen bonds (shown as dashed lines) with DGJ in 3THD.pdb and 4D1J.pdb respectively are shown, as well as the catalytic acid/base residues (Glu188 and 205 respectively). NB Active sites are from molecules A, but Asp550 is from molecule C in <span class="html-italic">Cj</span>GH35. C atoms are colored lilac for human β-gal and lawn green for <span class="html-italic">Cj</span>GH35 (with ligand C atoms in orchid and green respectively). The label for Asn135 for <span class="html-italic">Cj</span>GH35 is omitted for clarity. Figure was made using <span class="html-italic">CCP</span>4<span class="html-italic">mg</span> [<a href="#B60-molecules-25-04025" class="html-bibr">60</a>].</p>
Full article ">Figure 5
<p>Illustration of ligand complexes with <span class="html-italic">Cj</span>GH35, showing hydrogen-bonding interactions (as dashed lines) between the modelled ligand atoms and protein side-chains, and ligand electron density (calculated as omit difference density maps contoured at 2 rmsd). For <b>17</b>, side-chains involved in aromatic interactions within 3.8 Å of the NH-dansyl group are also shown. The side-chain of Asn135 is omitted from the interactions figure for <b>17</b>, and the electron density pictures to aid clarity.</p>
Full article ">Figure 5 Cont.
<p>Illustration of ligand complexes with <span class="html-italic">Cj</span>GH35, showing hydrogen-bonding interactions (as dashed lines) between the modelled ligand atoms and protein side-chains, and ligand electron density (calculated as omit difference density maps contoured at 2 rmsd). For <b>17</b>, side-chains involved in aromatic interactions within 3.8 Å of the NH-dansyl group are also shown. The side-chain of Asn135 is omitted from the interactions figure for <b>17</b>, and the electron density pictures to aid clarity.</p>
Full article ">Figure 6
<p>Overlay of inhibitors.</p>
Full article ">Figure 7
<p>Activity enhancements of R201C mutant lysosomal β-galactosidase with compounds <b>11</b>, <b>14</b>, <b>16</b>, <b>17</b>, <b>22</b>, <b>31</b> and <b>37</b>.</p>
Full article ">Figure 8
<p>Activity enhancements of various lysosomal β-galactosidase mutants with compounds <b>1</b>, <b>11</b>, <b>17</b>.</p>
Full article ">Scheme 1
<p>Synthesis of inhibitor <b>22</b>. <b>a</b>: Ph<sub>3</sub>P(CH<sub>2</sub>)<sub>3</sub>CN Br, LDA, THF<sub>(abs)</sub>, N<sub>2</sub>, −78 °C to r.t., 66%; <b>b</b>: Raney-Ni, H<sub>2</sub>, MeOH, 84%; <b>c</b>: dansyl chloride, NaHCO<sub>3</sub>, MeOH, 61%; d: HCl/MeOH, 74%.</p>
Full article ">Scheme 2
<p>Synthesis of 2-deoxy intermediate <b>26</b>. <b>a</b>: (1) Tf<sub>2</sub>O, pyridine, CH<sub>2</sub>Cl<sub>2</sub>, 0 °C; (2) NaBr, DMF, 53% (2 steps); <b>b</b>: Raney-Ni, H<sub>2,</sub> MeOH, 66%; <b>c</b>: HCl/MeOH, 88%.</p>
Full article ">Scheme 3
<p>Synthesis of compound <b>31</b>. <b>a</b>: Br(CH<sub>2</sub>)<sub>5</sub>CN, NaHCO<sub>3</sub>, DMF, 70 °C, 62%; <b>b</b>: Raney-Ni, H<sub>2</sub>, MeOH, 78%; <b>c</b>: (1) dansyl chloride, Et<sub>3</sub>N, CH<sub>2</sub>Cl<sub>2</sub>-DMF (3:1); <b>d</b>: HCl/MeOH, 84% (2 steps).</p>
Full article ">Scheme 4
<p>Synthesis of 2-deoxy-2-fluoro compound <b>37</b>. <b>a</b>: DAST, pyridine, CH<sub>2</sub>Cl<sub>2</sub>, 0 °C, 82%; <b>b</b>: Pd/C, H<sub>2</sub>, MeOH, 98%; <b>c</b>: HCl/MeOH, 92%; <b>d</b>: HCO(CH<sub>2</sub>)<sub>6</sub>NHCbz, NaCNBH<sub>3</sub>, AcOH, MeOH, 60%; <b>e</b>: Pd/C, H<sub>2</sub>, MeOH; <b>f</b>: dansyl chloride, Et<sub>3</sub>N, CH<sub>3</sub>CN–H<sub>2</sub>O (5:1), 53%.</p>
Full article ">
21 pages, 6860 KiB  
Article
Qualitative and Quantitative Study of Glycosphingolipids in Human Milk and Bovine Milk Using High Performance Liquid Chromatography–Data-Dependent Acquisition–Mass Spectrometry
by Lin Ma, Bertram Y. Fong, Alastair K. H. MacGibbon and Gillian Norris
Molecules 2020, 25(17), 4024; https://doi.org/10.3390/molecules25174024 - 3 Sep 2020
Cited by 11 | Viewed by 3008
Abstract
Cerebrosides (Crb; including glucosylceramide and galactosylceramide) and lactosylceramide (LacCer) are structurally complex lipids found in many eukaryotic cell membranes, where they play important roles in cell growth, apoptosis, cell recognition and signaling. They are also found in mammalian milk as part of the [...] Read more.
Cerebrosides (Crb; including glucosylceramide and galactosylceramide) and lactosylceramide (LacCer) are structurally complex lipids found in many eukaryotic cell membranes, where they play important roles in cell growth, apoptosis, cell recognition and signaling. They are also found in mammalian milk as part of the milk fat globule membrane (MFGM), making milk an important dietary component for the rapidly growing infant. This study reports the development of a robust analytical method for the identification and characterization of 44 Crb and 23 LacCer molecular species in milk, using high performance liquid chromatography–tandem mass spectrometry in data-dependent acquisition mode. For the first time, it also compares the distributions of these species in human and bovine milks, a commercial MFGM-enriched dairy ingredient (MFGM Lipid 100) and commercial standards purified from bovine milk. A method for quantifying Crb and LacCer in milk using mass spectrometry in neutral loss scan mode was developed and validated for human milk, bovine milk and MFGM Lipid 100. Human milk was found to contain approximately 9.9–17.4 µg Crb/mL and 1.3–3.0 µg LacCer/mL, whereas bovine milk (pooled milk from a Friesian herd) contained 9.8–12.0 and 14.3–16.2 µg/mL of these lipids, respectively. The process used to produce MFGM Lipid 100 was shown to have enriched these components to 448 and 1036 µg/g, respectively. No significant changes in the concentrations of both Crb and LacCer were observed during lactation. Full article
Show Figures

Figure 1

Figure 1
<p>Schematic structures of glucosylceramide (GluCer) (d18:1/23:0, <b>A</b>) and lactosylceramide (LacCer) (d18:1/22:0, <b>B</b>).</p>
Full article ">Figure 2
<p>Typical mass spectra showing the total ion counts (TICs) of GluCer (<b>A</b>) and LacCer (<b>E</b>), commercial standards purified from buttermilk, separated using hydrophilic interaction liquid chromatography (HILIC) and detected in positive ion mode as protonated molecules. Corresponding mass spectra are presented in (<b>B</b>) and (<b>F</b>), respectively. The tandem mass spectrometry (MS<sup>2</sup>) fragmentation of the GluCer <span class="html-italic">m/z</span> 798.71 amu ion (<b>C</b>) and the LacCer <span class="html-italic">m/z</span> 946.59 amu ion (<b>G</b>) are shown, followed by the corresponding three-stage mass spectrometry (MS<sup>3</sup>) fragmentations of the daughter ions with <span class="html-italic">m/z</span> 618.68 amu (<b>D</b>) and <span class="html-italic">m/z</span> 604.66 amu (<b>H</b>), respectively.</p>
Full article ">Figure 3
<p>TICs of the HILIC separation of Crb (<b>A</b>) and LacCer (<b>B</b>) for human milk, bovine milk (<b>C</b>,<b>D</b>) and MFGM Lipid 100 (<b>E</b>,<b>F</b>). The first and second Crb peaks in each sample (<b>A</b>,<b>C</b>,<b>E</b>) are labeled as ① and ②, respectively.</p>
Full article ">Figure 4
<p>Mass spectra (positive mode) of Crb peak 1 (<b>A</b>), Crb peak 2 (<b>C</b>) and LacCer (<b>E</b>) from bovine milk and the MS<sup>2</sup> spectra of the 798.73 amu ion from Crb peak 1 (<b>B</b>), the 814.56 amu ion from Crb peak 2 (<b>D</b>) and the 960.73 amu ion from LacCer (<b>F</b>).</p>
Full article ">Figure 5
<p>Proportional distribution of the major molecular species (indicated as the “d” number) of Crbs (<b>A</b>) and LacCer (<b>B</b>) in bovine milk, MFGM Lipid 100 and human milk.</p>
Full article ">Figure 6
<p>Chromatograms of five synthetic Crb standards characterized by different fatty acyl chains, different monosaccharide head groups and different stereochemistries.</p>
Full article ">Figure 7
<p>MS response of five different species of GluCer (<b>A</b>) and three different species of LacCer (<b>B</b>).</p>
Full article ">Figure 8
<p>Lactational changes in the concentration of Crb (top panel) and LacCer (bottom panel) in human milk from cohorts of Chinese and Malaysian mothers. The results are at 95% confidence. Data with the same letter indicate no statistically significant difference by one-way analysis of variance or two-sample t-test analysis (<span class="html-italic">p</span> &gt; 0.05).</p>
Full article ">
23 pages, 8252 KiB  
Article
Spatial Metagenomics of Three Geothermal Sites in Pisciarelli Hot Spring Focusing on the Biochemical Resources of the Microbial Consortia
by Roberta Iacono, Beatrice Cobucci-Ponzano, Federica De Lise, Nicola Curci, Luisa Maurelli, Marco Moracci and Andrea Strazzulli
Molecules 2020, 25(17), 4023; https://doi.org/10.3390/molecules25174023 - 3 Sep 2020
Cited by 13 | Viewed by 3633
Abstract
Terrestrial hot springs are of great interest to the general public and to scientists alike due to their unique and extreme conditions. These have been sought out by geochemists, astrobiologists, and microbiologists around the globe who are interested in their chemical properties, which [...] Read more.
Terrestrial hot springs are of great interest to the general public and to scientists alike due to their unique and extreme conditions. These have been sought out by geochemists, astrobiologists, and microbiologists around the globe who are interested in their chemical properties, which provide a strong selective pressure on local microorganisms. Drivers of microbial community composition in these springs include temperature, pH, in-situ chemistry, and biogeography. Microbes in these communities have evolved strategies to thrive in these conditions by converting hot spring chemicals and organic matter into cellular energy. Following our previous metagenomic analysis of Pisciarelli hot springs (Naples, Italy), we report here the comparative metagenomic study of three novel sites, formed in Pisciarelli as result of recent geothermal activity. This study adds comprehensive information about phylogenetic diversity within Pisciarelli hot springs by peeking into possible mechanisms of adaptation to biogeochemical cycles, and high applicative potential of the entire set of genes involved in the carbohydrate metabolism in this environment (CAZome). This site is an excellent model for the study of biodiversity on Earth and biosignature identification, and for the study of the origin and limits of life. Full article
(This article belongs to the Special Issue From Molecules to Origin of Life: The Astrobiology Network)
Show Figures

Figure 1

Figure 1
<p>(<b>A</b>) View of the sampling site in July 2019. The sites A, B, and C are labeled by badges. (<b>B</b>) Agarose gel mDNA extraction from Site A. Lane M, Marker StoS 1Kb DNA Ladder (Genespin), lane A: mDNA from Site A. (<b>C</b>) Agarose gel of mDNA extractions from sites B and C. Lane M, Marker StoS 1Kb DNA Ladder (Genespin); lane B, mDNA from Site B; lane C, mDNA from Site C.</p>
Full article ">Figure 2
<p>Taxonomic assignment of the reads at the kingdom level.</p>
Full article ">Figure 3
<p>Taxonomic assignment of the reads at the genus level. Taxa showing less than 1% of assigned reads are grouped as “others”.</p>
Full article ">Figure 4
<p>Taxonomic assignment of the reads at the species level. Taxa showing less than 1% of assigned reads are grouped as “others”.</p>
Full article ">Figure 5
<p>(<b>A</b>) Number of reads in Sites A, B, and C assigned to bacteria. Black and grey indicate the reads assigned to the genera <span class="html-italic">Shigella</span> and <span class="html-italic">Escherichia</span>, respectively, and filtered as contaminants. In blue the number of validated reads used for the bacteria community analysis. (<b>B</b>) Bacteria community profile, relative abundances, and diversity: hyperthermophiles (red), thermophiles (orange), mesophiles (blue), others (each relative abundance % &lt; 7, green).</p>
Full article ">Figure 6
<p>COG analysis of the metagenomes in Pisciarelli hot springs. Sites A, B, and C are compared according to COG functional categories.</p>
Full article ">Figure 7
<p>Functional annotation according to the SEED database of the metagenomes in Pisciarelli sites A, B, and C.</p>
Full article ">Figure 8
<p>Taxonomic assignment of the CAZymes identified in sites A, B, and C. The filled area of the rectangle indicates, on a logarithmic scale, the number of ORFs assigned to each taxon.</p>
Full article ">Figure 9
<p>Identity percentages of the CAZymes annotated in the sites A, B, and C against homologs in the Refseq Protein Database.</p>
Full article ">Figure 10
<p>Distribution of glycosidases among the sites A, B, and C. The ORF number assigned to GHs from each sample is displayed.</p>
Full article ">Figure 11
<p>Distribution of the (<b>A</b>) glycosyltransferase, (<b>B</b>) carbohydrate esterases, (<b>C</b>) carbohydrate-binding modules, (<b>D</b>) auxiliary activities and polysaccharide lyases among the Pisciarelli sites. The ORFs number assigned to each family from the three samples is displayed.</p>
Full article ">
18 pages, 3659 KiB  
Article
Colorimetry of Luminescent Lanthanide Complexes
by Julien Andres and Anne-Sophie Chauvin
Molecules 2020, 25(17), 4022; https://doi.org/10.3390/molecules25174022 - 3 Sep 2020
Cited by 9 | Viewed by 3596
Abstract
Europium, terbium, dysprosium, and samarium are the main trivalent lanthanide ions emitting in the visible spectrum. In this work, the potential of these ions for colorimetric applications and colour reproduction was studied. The conversion of spectral data to colour coordinates was undertaken for [...] Read more.
Europium, terbium, dysprosium, and samarium are the main trivalent lanthanide ions emitting in the visible spectrum. In this work, the potential of these ions for colorimetric applications and colour reproduction was studied. The conversion of spectral data to colour coordinates was undertaken for three sets of Ln complexes composed of different ligands. We showed that Eu is the most sensitive of the visible Ln ions, regarding ligand-induced colour shifts, due to its hypersensitive transition. Further investigation on the spectral bandwidth of the emission detector, on the wavelengths’ accuracy, on the instrumental correction function, and on the use of incorrect intensity units confirm that the instrumental correction function is the most important spectrophotometric parameter to take into account in order to produce accurate colour values. Finally, we established and discussed the entire colour range (gamut) that can be generated by combining a red-emitting Eu complex with a green-emitting Tb complex and a blue fluorescent compound. The importance of choosing a proper white point is demonstrated. The potential of using different sets of complexes with different spectral fingerprints in order to obtain metameric colours suitable for anti-counterfeiting is also highlighted. This work answers many questions that could arise during a colorimetric analysis of luminescent probes. Full article
(This article belongs to the Special Issue Luminescent Lanthanide Complexes)
Show Figures

Graphical abstract

Graphical abstract
Full article ">Figure 1
<p>Spectral data in normalised counts per second (measured) and final cropped relative spectral irradiances (processed) for the 3 series of complexes.</p>
Full article ">Figure 2
<p>Chromaticity diagrams CIE-xy (<b>a</b>) and CIE 1976 UCS (<b>b</b>) of the 3 series of Ln complexes (circle = dipic, square = L<sup>c2</sup>, diamond = do3a) with the blue fluorescent colours of [Lu<sub>2</sub>(L<sup>c2</sup>)<sub>3</sub>], D65 and E illuminants and the Planckian locus showing the colours of black body radiations from 1000 K to ∞.</p>
Full article ">Figure 3
<p>(<b>a</b>) Simulated relative spectral irradiances for broadened Ln spectra (Gaussian function with <span class="html-italic">σ</span> = 10 nm) and (<b>b</b>) corresponding colours (crosses) compared to the colours obtained from the original spectrum shown in <a href="#molecules-25-04022-f001" class="html-fig">Figure 1</a> (squares).</p>
Full article ">Figure 4
<p>Miscalibration effects on the UCS of the [Ln<sub>2</sub>(L<sup>c2</sup>)<sub>3</sub>] series for unapplied instrumental correction function (red circles), wavelength shifts of ±2.5 nm (magenta triangles), and spectral data in normalised photon counts (blue diamonds) compared to the correct values (black squares).</p>
Full article ">Figure 5
<p>(<b>a</b>–<b>c</b>) Relative spectral irradiances of the tested R, G, and B primaries and (<b>d</b>) resulting (1; 1; 1) white points on the UCS insert for the N white points of the dipic (circle), L<sup>c2</sup> (square), and do3a (diamond) series.</p>
Full article ">Figure 6
<p>CIELAB projection of the full 3-D gamuts onto the <span class="html-italic">a</span>*<span class="html-italic">b</span>* plane for different white points (N, E, D65) of the dipic series.</p>
Full article ">Figure 7
<p>(<b>a</b>) CIELAB projection of the full 3-D gamuts (sRGB <b>—</b>, dipic <b>·····</b>, L<sup>c2</sup> <b>– – –</b>, do3a <b>– · – ·</b>) onto the <span class="html-italic">a</span>*<span class="html-italic">b</span>* plane for the three series of Ln complexes with primaries combining to a D65 white point, and (<b>b</b>) corresponding hue cuts in CIELCh (cylindrical representation of CIELAB).</p>
Full article ">Figure 7 Cont.
<p>(<b>a</b>) CIELAB projection of the full 3-D gamuts (sRGB <b>—</b>, dipic <b>·····</b>, L<sup>c2</sup> <b>– – –</b>, do3a <b>– · – ·</b>) onto the <span class="html-italic">a</span>*<span class="html-italic">b</span>* plane for the three series of Ln complexes with primaries combining to a D65 white point, and (<b>b</b>) corresponding hue cuts in CIELCh (cylindrical representation of CIELAB).</p>
Full article ">Figure 8
<p>(<b>a</b>) Overlapping gamuts of the dipic and L<sup>c2</sup> sets with the white points matched to have the same luminance <span class="html-italic">Y</span> and to have the same chromaticity as a D65 illuminant. (<b>b</b>) Corresponding white relative spectral irradiances where all the primaries of the L<sup>c2</sup> set were scaled by a factor of 0.6989 in order to match the luminance of the dipic white spectrum.</p>
Full article ">Scheme 1
<p>Structure of dipicolinic acid (H<sub>2</sub><b>dipic</b>) of the helicate ligand (H<sub>2</sub><b>L<sup>c2</sup></b>) and of the do3a ligand (H<sub>3</sub><b>do3a-c</b>) forming 1:3, 2:3, and 1:1 (Ln/L) complexes with a D<sub>3h</sub>, D<sub>3</sub>, and C<sub>4v</sub> symmetry around the Ln ion, respectively (Δ enantiomer shown).</p>
Full article ">
10 pages, 4056 KiB  
Article
Enhancing the Performance of Dye Sensitized Solar Cells Using Silver Nanoparticles Modified Photoanode
by Faizah Saadmim, Taseen Forhad, Ahmed Sikder, William Ghann, Meser M. Ali, Viji Sitther, A. J. Saleh Ahammad, Md. Abdus Subhan and Jamal Uddin
Molecules 2020, 25(17), 4021; https://doi.org/10.3390/molecules25174021 - 3 Sep 2020
Cited by 26 | Viewed by 4217
Abstract
In this study, silver nanoparticles were synthesized, characterized, and applied to a dye-sensitized solar cell (DSSC) to enhance the efficiency of solar cells. The synthesized silver nanoparticles were characterized with UV–Vis spectroscopy, dynamic light scattering, transmission electron microscopy, and field emission scanning electron [...] Read more.
In this study, silver nanoparticles were synthesized, characterized, and applied to a dye-sensitized solar cell (DSSC) to enhance the efficiency of solar cells. The synthesized silver nanoparticles were characterized with UV–Vis spectroscopy, dynamic light scattering, transmission electron microscopy, and field emission scanning electron microscopy. The silver nanoparticles infused titanium dioxide film was also characterized by Fourier transform infrared and Raman spectroscopy. The performance of DSSC fabricated with silver nanoparticle-modified photoanode was compared with that of a control group. The current and voltage characteristics of the devices as well as the electrochemical impedance measurements were also carried out to assess the performance of the fabricated solar cells. The solar-to-electric efficiency of silver nanoparticles based DSSC was 1.76%, which is quite remarkable compared to the 0.98% realized for DSSC fabricated without silver nanoparticles. Full article
(This article belongs to the Special Issue Photosensitizer: Design, Characteriazation and Application)
Show Figures

Figure 1

Figure 1
<p>Absorption Spectra of Silver Nanoparticles (AgNPs) showing the SPR band.</p>
Full article ">Figure 2
<p>Dynamic light scattering measurement of synthesized silver nanoparticles.</p>
Full article ">Figure 3
<p>Field emission scanning electron microscopy imaging (<b>a</b>) and the corresponding energy dispersive X-ray spectroscopy (<b>b</b>) of the synthesized silver nanoparticles.</p>
Full article ">Figure 4
<p>Transmission electron microscopy of Silver Nanoparticles (AgNPs) (<b>a</b>) and AgNPs with titanium dioxide nanoparticles (<b>b</b>).</p>
Full article ">Figure 5
<p>FTIR spectra of Silver Nanoparticles (AgNPs) infused titanium dioxide and bare titanium dioxide.</p>
Full article ">Figure 6
<p>Raman spectra of Silver Nanoparticles (AgNPs) infused titanium dioxide and bare titanium dioxide.</p>
Full article ">Figure 7
<p>Current and voltage graph of DSSCs fabricated with only N719, N719, with AgNPs treatment, and N719 with AgNPs and TiCl<sub>4</sub> treatment.</p>
Full article ">Figure 8
<p>Nyquist plot of DSSCs fabricated with only N719, N719 with AgNPs treatment, and N719 with AgNP and TiCl<sub>4</sub> treatment.</p>
Full article ">Figure 9
<p>Bode plot of DSSCs fabricated with only N719, N719 with AgNPs treatment, and N719 with AgNPs and TiCl<sub>4</sub> treatment.</p>
Full article ">
14 pages, 1932 KiB  
Article
Unveiling the Differential Antioxidant Activity of Maslinic Acid in Murine Melanoma Cells and in Rat Embryonic Healthy Cells Following Treatment with Hydrogen Peroxide
by Khalida Mokhtari, Amalia Pérez-Jiménez, Leticia García-Salguero, José A. Lupiáñez and Eva E. Rufino-Palomares
Molecules 2020, 25(17), 4020; https://doi.org/10.3390/molecules25174020 - 3 Sep 2020
Cited by 22 | Viewed by 2716
Abstract
Maslinic acid (MA) is a natural triterpene from Olea europaea L. with multiple biological properties. The aim of the present study was to examine MA’s effect on cell viability (by the MTT assay), reactive oxygen species (ROS levels, by flow cytometry) and key [...] Read more.
Maslinic acid (MA) is a natural triterpene from Olea europaea L. with multiple biological properties. The aim of the present study was to examine MA’s effect on cell viability (by the MTT assay), reactive oxygen species (ROS levels, by flow cytometry) and key antioxidant enzyme activities (by spectrophotometry) in murine skin melanoma (B16F10) cells compared to those on healthy cells (A10). MA induced cytotoxic effects in cancer cells (IC50 42 µM), whereas no effect was found in A10 cells treated with MA (up to 210 µM). In order to produce a stress situation in cells, 0.15 mM H2O2 was added. Under stressful conditions, MA protected both cell lines against oxidative damage, decreasing intracellular ROS, which were higher in B16F10 than in A10 cells. The treatment with H2O2 and without MA produced different responses in antioxidant enzyme activities depending on the cell line. In A10 cells, all the enzymes were up-regulated, but in B16F10 cells, only superoxide dismutase, glutathione S-transferase and glutathione peroxidase increased their activities. MA restored the enzyme activities to levels similar to those in the control group in both cell lines, highlighting that in A10 cells, the highest MA doses induced values lower than control. Overall, these findings demonstrate the great antioxidant capacity of MA. Full article
(This article belongs to the Special Issue Anticancer Properties of Natural and Derivative Products)
Show Figures

Graphical abstract

Graphical abstract
Full article ">Figure 1
<p>Schedule chemical structure of maslinic acid from pomace olive (<span class="html-italic">Olea europaea</span> L.) (PubChem).</p>
Full article ">Figure 2
<p>Cytotoxicity curves of maslinic acid (MA) for B16F10 murine melanoma cells (<b>A</b>) and A10 rat embryonic healthy cells (<b>B</b>) and of hydrogen peroxide (H<sub>2</sub>O<sub>2</sub>) for B16F10 murine melanoma cells (<b>C</b>) and A10 rat embryonic healthy cells (<b>D</b>). Cell proliferation was determined by the MTT assay. Values are expressed as means ± SEM (<span class="html-italic">n</span> = 9).</p>
Full article ">Figure 3
<p>Positive fluorescent Rh123 on B16F10 cells (<b>A</b>) and A10 cells (<b>B</b>) with (+) or without (−) H<sub>2</sub>O<sub>2</sub> and MA treatment at different doses: IC<sub>50/4</sub>, IC<sub>50/2</sub>, IC<sub>50</sub> and 2·IC<sub>50</sub> (10.6, 21.6, 42.3 and 84.6 μM, respectively). Values are expressed as means ± SEM (<span class="html-italic">n</span> = 9). Different letters indicate significant differences (<span class="html-italic">p</span> &lt; 0.05).</p>
Full article ">Figure 4
<p>Effect of different maslinic acid doses—IC<sub>50/4</sub>, IC<sub>50/2</sub>, IC<sub>50</sub> and 2·IC<sub>50</sub> (10.6, 21.6, 42.3 and 84.6 μM, respectively)—on the specific activity of superoxide dismutase (SOD) in cancer cells, B16F10 (<b>A</b>), and normal cells, A10 (<b>B</b>), and glutathione S-transferase (GST) in cancer cells, B16F10 (<b>C</b>), and normal cells, A10 (<b>D</b>), subjected to the presence of hydrogen peroxide. Symbols (+) and (−) indicate the presence or absence of incubation with H<sub>2</sub>O<sub>2</sub>, respectively. Enzyme activities (U or mU × mg protein<sup>−1</sup>) are expressed as means ± SEM (<span class="html-italic">n</span> = 9). Different letters indicate significant differences (<span class="html-italic">p</span> &lt; 0.05).</p>
Full article ">Figure 5
<p>Effect of different maslinic acid doses—IC<sub>50/4</sub>, IC<sub>50/2</sub>, IC<sub>50</sub> and 2·IC<sub>50</sub> (10.6, 21.6, 42.3 and 84.6 μM, respectively)—on the specific activity of catalase (CAT) in cancer cells, B16F10 (<b>A</b>), and normal cells, A10 (<b>B</b>), and glucose 6-phosphate dehydrogenase (G6PDH) in cancer cells, B16F10 (<b>C</b>), and normal cells, A10 (<b>D</b>), subjected to the presence of hydrogen peroxide. Symbols (+) and (−) indicate the presence or absence of incubation with H<sub>2</sub>O<sub>2</sub>, respectively. Enzyme activities (U or mU × mg protein<sup>−1</sup>) are expressed as means ± SEM (<span class="html-italic">n</span> = 9). Different letters indicate significant differences (<span class="html-italic">p</span> &lt; 0.05).</p>
Full article ">Figure 6
<p>Effect of different maslinic acid doses—IC<sub>50/4</sub>, IC<sub>50/2</sub>, IC<sub>50</sub> and 2·IC<sub>50</sub> (10.6, 21.6, 42.3 and 84.6 μM, respectively)—on the specific activity of glutathione peroxidase (GPX) in cancer cells, B16F10 (<b>A</b>), and normal cells, A10 (<b>B</b>), and glutathione reductase (GR) in cancer cells, B16F10 (<b>C</b>), and normal cells, A10 (<b>D</b>), subjected to the presence of hydrogen peroxide. Symbols (+) and (−) indicate the presence or absence of incubation with H<sub>2</sub>O<sub>2</sub>, respectively. Enzyme activity (mU × mg protein<sup>−1</sup>) is expressed as means ± SEM (<span class="html-italic">n</span> = 9). Different letters indicate significant differences (<span class="html-italic">p</span> &lt; 0.05)</p>
Full article ">
29 pages, 1454 KiB  
Review
A Review of the Ethnomedicinal Uses, Biological Activities, and Triterpenoids of Euphorbia Species
by Douglas Kemboi, Xolani Peter, Moses Langat and Jacqueline Tembu
Molecules 2020, 25(17), 4019; https://doi.org/10.3390/molecules25174019 - 3 Sep 2020
Cited by 62 | Viewed by 6988
Abstract
The genus Euphorbia is one of the largest genera in the spurge family, with diversity in range, distribution, and morphology. The plant species in this genus are widely used in traditional medicine for the treatment of diseases, ranging from respirational infections, body and [...] Read more.
The genus Euphorbia is one of the largest genera in the spurge family, with diversity in range, distribution, and morphology. The plant species in this genus are widely used in traditional medicine for the treatment of diseases, ranging from respirational infections, body and skin irritations, digestion complaints, inflammatory infections, body pain, microbial illness, snake or scorpion bites, pregnancy, as well as sensory disorders. Their successes have been attributed to the presence of diverse phytochemicals like polycyclic and macrocyclic diterpenes with various pharmacological properties. As a result, Euphorbia diterpenes are of interest to chemists and biochemists with regard to drug discovery from natural products due to their diverse therapeutic applications as well as their great structural diversity. Other chemical constituents such as triterpenoids have also been reported to possess various pharmacological properties, thus supporting the traditional uses of the Euphorbia species. These triterpenoids can provide potential leads that can be developed into pharmaceutical compounds for a wide range of medicinal applications. However, there are scattered scientific reports about the anticancer activities of these constituents. Harnessing such information could provide a database of bioactive pharmacopeia or targeted scaffolds for drug discovery. Therefore, this review presents an updated and comprehensive summary of the ethnomedicinal uses, phytochemistry, and the anticancer activities of the triterpenoids of Euphorbia species. Most of the reported triterpenoids in this review belong to tirucallane, cycloartanes, lupane, oleanane, ursane, and taraxane subclass. Their anticancer activities varied distinctly with the majority of them exhibiting significant cytotoxic and anticancer activities in vitro. It is, therefore, envisaged that the report on Euphorbia triterpenoids with interesting anticancer activities will form a database of potential leads or scaffolds that could be advanced into the clinical trials with regard to drug discovery. Full article
(This article belongs to the Special Issue Bioactive Compounds from Natural Sources (2020, 2021))
Show Figures

Graphical abstract

Graphical abstract
Full article ">Figure 1
<p>Chemical structures of tirucallane triterpenoids isolated from genus <span class="html-italic">Euphorbia.</span></p>
Full article ">Figure 2
<p>Structures of Euphane and some oleanane triterpenoids isolated from genus <span class="html-italic">Euphorbia.</span></p>
Full article ">Figure 3
<p>Chemical structures of cycloartane triterpenoids isolated from genus <span class="html-italic">Euphorbia.</span></p>
Full article ">Figure 4
<p>Structures of cycloartane and lanostane triterpenoids isolated from genus <span class="html-italic">Euphorbia.</span></p>
Full article ">Figure 5
<p>Chemical structures of pentacyclic triterpenoids isolated from genus <span class="html-italic">Euphorbia.</span></p>
Full article ">
20 pages, 2624 KiB  
Article
In Silico, In Vitro, and In Vivo Antitumor and Anti-Inflammatory Evaluation of a Standardized Alkaloid-Enriched Fraction Obtained from Boehmeria caudata Sw. Aerial Parts
by Paula P. de Paiva, Julia H. B. Nunes, Fabiana R. Nonato, Ana L. T. G. Ruiz, Rafael R. T. Zafred, Ilza M. O. Sousa, Márcia Y. Okubo, Daniel F. Kawano, Paula A. Monteiro, Mary A. Foglio and João E. Carvalho
Molecules 2020, 25(17), 4018; https://doi.org/10.3390/molecules25174018 - 3 Sep 2020
Cited by 2 | Viewed by 2620
Abstract
In the context of the cancer-inflammation relationship and the use of natural products as potential antitumor and anti-inflammatory agents, the alkaloid-enriched fraction of Boehmeriacaudata (BcAEF) aerial parts was evaluated. In vitro antiproliferative studies with human tumor cell lines showed high activity at [...] Read more.
In the context of the cancer-inflammation relationship and the use of natural products as potential antitumor and anti-inflammatory agents, the alkaloid-enriched fraction of Boehmeriacaudata (BcAEF) aerial parts was evaluated. In vitro antiproliferative studies with human tumor cell lines showed high activity at low concentrations. Further investigation on NCI-H460 cells showed an irreversible effect on cell proliferation, with cell cycle arrest at G2/M phase and programmed cell death induction. Molecular docking studies of four alkaloids identified in BcAEF with colchicine’s binding site on β-tubulin were performed, suggesting (−)-C (15R)-hydroxycryptopleurine as the main inductor of the observed mitotic death. In vivo studies showed that BcAEF was able to reduce Ehrlich tumor volume progression by 30 to 40%. Checking myeloperoxidase activity, BcAEF reduced neutrophils migration towards the tumor. The in vivo anti-inflammatory activity was evaluated by chemically induced edema models. In croton oil-induced ear edema and carrageenan (CG)-induced paw edema models, BcAEF reduced edema around 70 to 80% together with inhibition of activation and/or migration of neutrophils to the inflammatory area. All together the results presented herein show BcAEF as a potent antitumor agent combining antiproliferative and anti-inflammatory properties, which could be further explored in (pre)clinical studies. Full article
(This article belongs to the Special Issue Current Trends in the Analysis of Medicinal Plants)
Show Figures

Graphical abstract

Graphical abstract
Full article ">Figure 1
<p>Antiproliferative profiles of paclitaxel (0.025 to 25 µg mL<sup>−1</sup>), vincristine (0.025 to 25 µg mL<sup>−1</sup>), colchicine (0.25 to 250 µg mL<sup>−1</sup>), and BcAEF (0.25 to 250 µg mL<sup>−1</sup>) after 48h-exposition over a panel of tumor cell lines. Human tumor cell lines: U251 (glioblatoma); MCF-7 (breast, adenocarcinoma); NCI-ADR/RES (multidrug resistant ovarian adenocarcinoma); 786-0 (kidney, adenocarcinoma); NCI-H460 (lung, large cells carcinoma); PC-3 (prostate, adenocarcinoma); OVCAR-3 (ovarian, adenocarcinoma); HT29 (colon, adenocarcinoma); K562 (chronic myeloid leukemia). For colchicine the PC-3 cell line is not presented due to an experimental error.</p>
Full article ">Figure 2
<p>Inhibitory effects of BcAEF on NCI-H460 cell proliferation and cell cycle. (<b>A</b>) Percentage of colonies in the colony formation assay of untreated cells (control) and cells treated with 0.0025 and 0.025 µg mL<sup>−1</sup> of BcAEF. (<b>B</b>) Influence on NCI-H460 cell cycle. NCI-H460 cells were treated for 30 h with 0.25 µM of colchicine (positive control), 0.0025 and 0.025 µg mL<sup>−1</sup> of BcAEF. Statistical analysis: two-way ANOVA followed by Bonferroni test (*** <span class="html-italic">p</span> &lt; 0.001, relative to untreated cells-control). (<b>C</b>) Histograms of cell cycle analysis (cell count vs. DNA content, Guava Cell Cycle module) of (<b>1</b>) untreated cells—control, (<b>2</b>) 0.25 µM of colchicine, (<b>3</b>) 0.0025 µg mL<sup>−1</sup> and (<b>4</b>) 0.025 µg mL<sup>−1</sup> of BcAEF over NCI-H460 cells (30 h), showing cell population in G1, S and G2/M phases.</p>
Full article ">Figure 3
<p>Superposition between the crystallographic pose of colchicine (yellow) at the corresponding binding site in the <span class="html-italic">β</span>-tubulin monomer (PDB ID: 4O2B) [<a href="#B8-molecules-25-04018" class="html-bibr">8</a>] and the docking poses of the alkaloids <span class="html-italic">R</span>-boehmeriasin A (green), <span class="html-italic">R</span>-boehmeriasin B (purple), <span class="html-italic">R</span>-cryptopleurine (light blue) and (−)-C (15<span class="html-italic">R</span>)-hydroxycryptopleurine (red).</p>
Full article ">Figure 4
<p>Programmed cell death effects of BcAEF on NCI-H460 cells. (<b>A</b>) Influence of BcAEF on phosphatidylserine externalization of NCI-H460 after 36 h of treatment. NCI-H460 cells were treated for 36 h with 0.025, 0.25 and 2.5 µg mL<sup>−1</sup> of BcAEF. (<b>B</b>) Influence of BcAEF on caspases activation of NCI-H460 after 48 h of treatment. NCI-H460 cells were treated for 48 h with 0.025, 0.25 and 2.5 µg mL<sup>−1</sup> of BcAEF. Statistical analysis for PS externalization and caspases activation: two-way ANOVA followed by Bonferroni test (** <span class="html-italic">p</span> &lt; 0.01 and *** <span class="html-italic">p</span> &lt; 0.001, relative to untreated cells - control). (<b>C</b>) Dot-plot graphics of cell distribution after using Annexin-V and 7-AAD dyes over NCI-H460 cells treated for 36 h (Guava Nexin Module): (<b>1</b>) untreated cells (control), (<b>2</b>) 0.025 µg mL<sup>−1</sup>, (<b>3</b>) 0.25 µg mL<sup>−1</sup> and (<b>4</b>) 2.5 µg mL<sup>−1</sup> of BcAEF. (<b>D</b>) Dot-plot graphics of cell distribution after using SR-VAD-FMK and 7-AAD dyes over NCI-H460 cells treated for 48 h (Guava MultiCaspase module): (<b>5</b>) untreated cells (control), (<b>6</b>) 0.025 µg mL<sup>−1</sup>, (<b>7</b>) 0.25 µg mL<sup>−1</sup> and (<b>8</b>) 2.5 µg mL<sup>−1</sup> of BcAEF.</p>
Full article ">Figure 5
<p>Antitumor and anti-inflammatory effects of BcAEF on Ehrlich solid tumor model and CG-induced paw edema model. (<b>A</b>) Mean tumor volume variation (%) in the Ehrlich solid tumor paw model during 15 days of treatment with vehicle (negative control), positive controls, and BcAEF. (<b>B</b>) Myeloperoxidase (MPO) activity expressed as O.D (optical density) per milligram of paw tissue with (vehicle group, positive controls and BcAEF) or without (satellite group) Ehrlich’s solid tumor. (<b>C</b>) Variation of mice body weight during 15 days of experiment of Ehrlich’s solid tumor in the paw. (<b>D</b>) CG-induced paw edema represented by edema variation (%). Results were expressed as mean ± standard error<span class="html-italic">. Groups =</span> vehicle (negative control), doxorubicin (positive control), piroxicam (positive control), BcAEF (3, 10, and 30 mg/kg), satellite (without inoculation of tumor cells and without treatment) and a group treated with the higher dose of BcAEF (30 mg/kg), in which tumor cells were not inoculated. Legend: i.p. intraperitoneal; o.a. oral administration. Statistical analysis: * <span class="html-italic">p &lt;</span> 0.05, ** <span class="html-italic">p &lt;</span> 0.01 and *** <span class="html-italic">p &lt;</span> 0.001, statistically significant difference in relation to the vehicle group (two-way ANOVA followed by Bonferroni test).</p>
Full article ">Figure 6
<p>Anti-inflammatory effect of BcAEF evaluated on croton oil-induced ear edema. (<b>A</b>,<b>C</b>) Results are expressed as the mean ± standard error media; weight difference (mg) = weight differences of equal portions obtained from the treated and untreated ears of the animals from each experimental group. (<b>B</b>,<b>D</b>) Tissue sample evaluated: ear fragment after exposure to croton oil; myeloperoxidase activity expressed as O.D. (optical density) per ear milligram. Groups: negative control (vehicle = acetone 70% to group with application topic or 10 mL kg<sup>−1</sup> of the PBS pH 7 + tween 80 5% to group with oral treatment), positive control (dexamethasone), and experimental group (BcAEF: alkaloid enriched fraction extracted from the aerial parts of <span class="html-italic">Boehmeria caudata Sw</span>). Legend: t.a. topic application; o.a. oral administration. Statistical analysis: * <span class="html-italic">p &lt;</span> 0.05, ** <span class="html-italic">p &lt;</span> 0.01 and *** <span class="html-italic">p &lt;</span> 0.001, significant difference by statistical means according to vehicle group. a: <span class="html-italic">p &lt;</span> 0.001, b: <span class="html-italic">p &lt;</span> 0.01, c: <span class="html-italic">p &lt;</span> 0.05, significant difference by statistical means according to satellite group (one-way ANOVA followed by Tukey test).</p>
Full article ">
19 pages, 3261 KiB  
Review
PET Radiotracers for CNS-Adrenergic Receptors: Developments and Perspectives
by Santosh Reddy Alluri, Sung Won Kim, Nora D. Volkow and Kun-Eek Kil
Molecules 2020, 25(17), 4017; https://doi.org/10.3390/molecules25174017 - 3 Sep 2020
Cited by 4 | Viewed by 3691
Abstract
Epinephrine (E) and norepinephrine (NE) play diverse roles in our body’s physiology. In addition to their role in the peripheral nervous system (PNS), E/NE systems including their receptors are critical to the central nervous system (CNS) and to mental health. Various antipsychotics, antidepressants, [...] Read more.
Epinephrine (E) and norepinephrine (NE) play diverse roles in our body’s physiology. In addition to their role in the peripheral nervous system (PNS), E/NE systems including their receptors are critical to the central nervous system (CNS) and to mental health. Various antipsychotics, antidepressants, and psychostimulants exert their influence partially through different subtypes of adrenergic receptors (ARs). Despite the potential of pharmacological applications and long history of research related to E/NE systems, research efforts to identify the roles of ARs in the human brain taking advantage of imaging have been limited by the lack of subtype specific ligands for ARs and brain penetrability issues. This review provides an overview of the development of positron emission tomography (PET) radiotracers for in vivo imaging of AR system in the brain. Full article
(This article belongs to the Special Issue Radiolabeled Compounds for Diagnosis and Treatment of Cancer)
Show Figures

Figure 1

Figure 1
<p>(<b>A</b>) Earlier PET radiotracers, [<sup>11</sup>C]Prazosin, [<sup>11</sup>C]Bunazosin, and [<sup>11</sup>C]GB67 for cardiac α1-AR imaging. (<b>B</b>) Antagonist PET radiotracers based on sertindole. (<b>C</b>) Antagonist PET radiotracers based on octoclothepin for brain α1-AR imaging.</p>
Full article ">Figure 2
<p>Various classes of α2-ARs antagonist radiotracers.</p>
Full article ">Figure 3
<p>Anti-depressive &amp; antihypertensive based α2-AR PET radiotracers.</p>
Full article ">Figure 4
<p>Parametric maps of <b>16</b> in living porcine brain. (<b>A</b>) Baseline study using <b>16</b> showed regional differences in its distribution. (<b>B</b>) Blocking experiment (yohimbine at 0.07 mg/kg) reduced the scale of distribution volume (<span class="html-italic">V</span><sub>d</sub>) to ~2 mL g<sup>−1</sup> in all the α2-AR bound regions. (<b>C</b>) Increased dose of yohimbine (1.6 mg/kg) had no further significant effect in comparison to the low dose (<span class="html-italic">n</span> = 3) Maps are superimposed on the MR image. Adapted from JNM publication by Jacobsen S, Pedersen, K.; Smith, D.F.; Jensen, S.B.; Munk, O.L.; Cumming P [<a href="#B97-molecules-25-04017" class="html-bibr">97</a>]. Permission obtained from SNMMI.</p>
Full article ">Figure 5
<p>α2A-antagonist (<b>17</b>) and agonist (<b>18</b>) PET radiotracers.</p>
Full article ">Figure 6
<p>PET radiotracers for α2C-ARs.</p>
Full article ">Figure 7
<p>PET/CT images and time-activity curves of <b>21</b> for striatum and cerebellar cortex of (<b>A</b>) α2A KO (<b>B</b>) α2AC KO and (<b>C</b>) WT mice. Brain uptake of <b>21</b> in α2AC KO is negligible and is similar in α2A KO and WT mice with 7.8–8.1% ID/g at 1 min and 1.2% ID/g at 30 min after <b>21</b> injection. The striatum to cerebellar cortex radioactivity ratios (at 5–15 min) for α2AC KO mice did not differ and for α2A KO and WT mice are alike. Adapted from JNM publication by Arponen E.; Helin, S.; Marjamäki, P.; Grönroos, T.; Holm, P.; Löyttyniemi, E.; Någren, K.; Scheinin, M.; Haaparanta-Solin, M.; Sallinen, J.; [<a href="#B36-molecules-25-04017" class="html-bibr">36</a>]. Permission obtained from SNMMI.</p>
Full article ">Figure 8
<p>Early PET radiotracers for cerebral β-ARs.</p>
Full article ">Figure 9
<p>Radiotracers based on various β-AR blockers.</p>
Full article ">Figure 10
<p>Another set of latest β-AR PET radiotracers.</p>
Full article ">
20 pages, 2666 KiB  
Article
Targeting the Initiator Protease of the Classical Pathway of Complement Using Fragment-Based Drug Discovery
by Blake R. Rushing, Denise L. Rohlik, Sourav Roy, D. Andrew Skaff and Brandon L. Garcia
Molecules 2020, 25(17), 4016; https://doi.org/10.3390/molecules25174016 - 3 Sep 2020
Cited by 7 | Viewed by 3447
Abstract
The initiating protease of the complement classical pathway, C1r, represents an upstream and pathway-specific intervention point for complement-related autoimmune and inflammatory diseases. Yet, C1r-targeted therapeutic development is currently underrepresented relative to other complement targets. In this study, we developed a fragment-based drug discovery [...] Read more.
The initiating protease of the complement classical pathway, C1r, represents an upstream and pathway-specific intervention point for complement-related autoimmune and inflammatory diseases. Yet, C1r-targeted therapeutic development is currently underrepresented relative to other complement targets. In this study, we developed a fragment-based drug discovery approach using surface plasmon resonance (SPR) and molecular modeling to identify and characterize novel C1r-binding small-molecule fragments. SPR was used to screen a 2000-compound fragment library for binding to human C1r. This led to the identification of 24 compounds that bound C1r with equilibrium dissociation constants ranging between 160–1700 µM. Two fragments, termed CMP-1611 and CMP-1696, directly inhibited classical pathway-specific complement activation in a dose-dependent manner. CMP-1611 was selective for classical pathway inhibition, while CMP-1696 also blocked the lectin pathway but not the alternative pathway. Direct binding experiments mapped the CMP-1696 binding site to the serine protease domain of C1r and molecular docking and molecular dynamics studies, combined with C1r autoactivation assays, suggest that CMP-1696 binds within the C1r active site. The group of structurally distinct fragments identified here, along with the structure–activity relationship profiling of two lead fragments, form the basis for future development of novel high-affinity C1r-binding, classical pathway-specific, small-molecule complement inhibitors. Full article
(This article belongs to the Special Issue Deep Learning for Molecular Structure Modelling)
Show Figures

Figure 1

Figure 1
<p>(<b>A</b>) Complement is activated by three canonical pathways known as the classical pathway (CP), lectin pathway (LP), or alternative pathway (AP). Activation of the classical pathway is controlled by the C1 complex (i.e., C1qC1r<sub>2</sub>C1s<sub>2</sub>). The pattern recognition protein C1q binds to target surfaces resulting in the autoactivation of the zymogen C1r proteases (shown here as ‘Pro-C1r’) into C1r enzymes, which then proteolytically cleave and activate C1s within the C1 complex. The lectin pathway is activated by lectin pathway-specific pattern recognition proteins in complex with mannan-binding associated serine proteases (MASPs), while the alternative pathway is constitutively activated at low levels by a spontaneous hydrolytic event known as tick-over. Both the classical and lectin pathways converge at the cleavage of C2 and C4 to generate the classical/lectin pathway C3 convertases, C4b2b. Alternative pathway activation results in the formation of C3 convertases in the form of C3bBb. C3 convertases cleave the central molecule of the cascade, C3, into C3a and C3b, resulting in an amplification loop that produces increasing quantities of surface bound C3b. At high surface concentrations of C3b, C3 convertases bind an additional C3b molecule, resulting in a switch of substrate specificity to C5. Cleavage of C5 by these C5 convertases (i.e., C4b2bC3b and C3bBbC3b) results in the release of the anaphylatoxin C5a and the formation of the pore-like lytic structure called the membrane attack complex (i.e., C5b–C9). (<b>B</b>) Fragment-based drug discovery schematic.</p>
Full article ">Figure 2
<p>Direct binding of compounds to full-length C1r by SPR. A 2000-compound library was screened at 500 µM final compound concentration for solubility in SPR buffer and for non-specific binding to a blank sensor chip surface (i.e., ‘clean screen’). A total of 1619 compounds were soluble and exhibited low non-specific binding capacity in our SPR assay system. The ability of each of these compounds to bind directly to C1r was measured by injecting a 500 µM final compound concentration over immobilized full-length C1r. A molecular weight corrected theoretical maximal binding response (R<sub>max</sub>) for each compound was calculated and compounds that exhibited superstoichiometric binding (i.e., &gt; 2 × R<sub>max</sub>) were eliminated from further consideration. In total, 95 compounds exhibited ≥ 60% R<sub>max</sub> (green circles).</p>
Full article ">Figure 3
<p>Dose-dependent binding of full-length C1r by selected hit compounds. Dose-dependent C1r binding for 24 compounds was measured by injecting a two-fold variable concentration series of each compound ranging from 7.8 to 500 µM. Steady-state affinities were calculated from the resulting sensorgrams. A representative set of sensorgrams are shown along with the associated steady-state <span class="html-italic">K</span><sub>D</sub> values. The corresponding steady-state fits are shown in <a href="#app1-molecules-25-04016" class="html-app">Figure S1</a>. <span class="html-italic">K</span><sub>D</sub> values are reported as the mean ± S.D. calculated from three independent injection series.</p>
Full article ">Figure 4
<p>Inhibition of the classical pathway by selected hit compounds. All 24 hit fragments were tested for their ability to block C4 activation in an ELISA-based assay under conditions specific for the classical pathway. Each compound was tested in triplicate at a single concentration of 500 µM. Positive hits (four in total) were defined as any compound that significantly reduced C4b deposition relative to a non-binding control compound (CMP-685), as judged by an unpaired <span class="html-italic">t</span>-test (* <span class="html-italic">p</span> &lt; 0.05).</p>
Full article ">Figure 5
<p>Selectivity and mechanistic analysis of CMP-1611 and CMP-1696. (<b>A</b>) Chemical structure of CMP-1611. (<b>B</b>) Chemical structure of CMP-1696. (<b>C</b>) Dose-dependent inhibition by CMP-1611 and CMP-1696 in a classical pathway-specific ELISA. Data were fit with GraphPad Prism using non-linear regression with a log(inhibitor) vs. response model. For CMP-1611, an IC<sub>50</sub> value of 660 µM with an associated 95% confidence interval of (560–790 µM, <span class="html-italic">n</span> = 9) was calculated. For CMP-1696, an IC<sub>50</sub> value of 520 µM with an associated 95% confidence interval of (410–680 µM, <span class="html-italic">n</span> = 7) was calculated. The CMP-778 inhibitory response could not be fit to a dose–response inhibition model. (<b>D</b>) Complement pathway selectivity of CMP-1611 and CMP-1696. Compounds were assessed for their ability to inhibit activation of complement via the lectin and alternative pathways using single doses of 500 µM compound in triplicate. To ensure only lectin pathway activation, 2% (<span class="html-italic">v</span>/<span class="html-italic">v</span>) C1q-depleted serum (CompTech) was used and mannan was used as the activator. To match serum sources and amounts for this assay, the classical pathway assays were repeated here using serum from CompTech at 2% (<span class="html-italic">v</span>/<span class="html-italic">v</span>) final concentration. Alternative pathway activation assays were performed using 20% (<span class="html-italic">v</span>/<span class="html-italic">v</span>) serum (CompTech), alternative pathway buffers, and C3b detection (see Methods and Materials for details). CMP-1611 had no effect on the lectin or alternative pathway, whereas CMP-1696 blocked lectin but not alternative pathway activation. (<b>E</b>) C1r, C1r-CUB1, and C1r-CCP2-SP, were immobilized on an SPR sensor chip and binding responses for 500 µM CMP-1611 and CMP-1696 or 10 µM Futhan were each injected in duplicate over all surfaces. Binding responses were corrected for the molecular weight of each analyte and the immobilization level and molecular weight of each surface ligand. Measures of statistical significance in (<b>D</b>) were obtained by comparison of vehicle control using an unpaired <span class="html-italic">t</span>-test (* <span class="html-italic">p</span> &lt; 0.05).</p>
Full article ">Figure 6
<p>CMP-1696 structure activity relationship. (<b>A</b>) CMP-1696 was redocked onto C1r-CCP2-SP (PDB: 1MD8, grey surface representation) and the top nine scored poses are shown. All CMP-1696 poses dock into the S1 subsite (cyan) near the catalytic triad (blue). (<b>B</b>) C1r autoactivation assay. C1r proenzyme undergoes time-dependent autoactivation at 37 °C. Autoactivation was measured using a synthetic substrate for C1r enzyme. The reaction progress of vehicle control (dashed line) or in the presence of 10 mM CMP-1696 (solid line) was monitored for 1 h. (<b>C</b>) Molecular dynamics (MD) simulations of CMP-1696/C1r-CCP2-SP. Root mean square deviation (RMSD) in nm for each of the CMP-1696 poses measured over the 10 ns molecular dynamics simulation. (<b>D</b>) MM/PBSA energy calculations for each pose in the 10 ns MD simulations indicate that pose 1 is the most energetically favorable. (<b>E</b>) Hydrogen bonding interactions at the start of the MD simulation are shown as dashed lines. (<b>F</b>) A 50 ns MD simulation (Video S1) was carried out for pose 1 and MM/PBSA was used to calculate total energy. Subcategorized energy contributions are also shown where vDW is van der Waals forces and SASA is solvent-accessible surface area.</p>
Full article ">
16 pages, 1335 KiB  
Article
Free Amino Acids in Three Pleurotus Species Cultivated on Agricultural and Agro-Industrial By-Products
by Dimitra Tagkouli, Andriana Kaliora, Georgios Bekiaris, Georgios Koutrotsios, Margarita Christea, Georgios I. Zervakis and Nick Kalogeropoulos
Molecules 2020, 25(17), 4015; https://doi.org/10.3390/molecules25174015 - 2 Sep 2020
Cited by 22 | Viewed by 3223
Abstract
Previous studies have demonstrated the feasibility of employing by-products of the olive and wine sectors for the production of Pleurotus mushrooms with enhanced functionalities. In this work we investigated the influence of endogenous and exogenous factors on free amino acids (FAAs) profile of [...] Read more.
Previous studies have demonstrated the feasibility of employing by-products of the olive and wine sectors for the production of Pleurotus mushrooms with enhanced functionalities. In this work we investigated the influence of endogenous and exogenous factors on free amino acids (FAAs) profile of Pleurotus ostreatus, P. eryngii and P. nebrodensis mushrooms produced on wheat straw (WS), alone or mixed with grape marc (GM), and on by-products of the olive industry (OL). Overall, 22 FAAs were determined in substrates and mushrooms, including all the essential amino acids, the neurotransmitter γ-aminobutyric acid (GABA) and ornithine. On a dry weight (dw) basis, total FAAs ranged from 17.37 mg/g in P. nebrodensis to 130.12 mg/g in P. ostreatus samples, with alanine, leucine, glutamine, valine and serine predominating. Similar distribution patterns were followed by the monosodium glutamate (MSG)-like, sweet and bitter FAAs. Significant differences in FAAs level were observed among the species examined and among the cultivation substrates used. Principal Component Analysis (PCA) performed on the entire FAAs profile of six Pleurotus strains, clearly separated P. ostreatus from P. eryngii and P. nebrodensis, in accordance to their phylogenetic affinity. This is the first report of FAAs in P. nebrodensis. Full article
(This article belongs to the Special Issue Mushrooms:The Versatile Roles)
Show Figures

Figure 1

Figure 1
<p>Total and individual groups of free amino acids in <span class="html-italic">Pleurotus</span> mushrooms, compared by species in each substrate. (<b>A</b>) Total Amino Acids, (<b>B</b>) Essential Amino Acids, (<b>C</b>) Branched Chain Amino Acids; (<b>D</b>) Monosodium Glutamate (MSG)-like Amino Acids, (<b>E</b>) Bitter Taste Amino Acids, (<b>F</b>) Sweet Taste Amino Acids. Lack of letters in common denotes statistically significant differences in comparisons among species in each substrate by Duncan’s multiple comparison test at <span class="html-italic">p</span> &lt; 0.05. Essential amino acids, Thr + Val + Met + Ile + Leu + Phe + Lys + His+ Trp; BCAA Branched chain amino acids, Val + Ile + Leu; MSG-like, monosodium glutamate-like, Asp + Glu; Bitter, Val + Met + Ile + Leu + Phe + His + Trp; Sweet, Thr + Ser + Gly + Ala + Pro.</p>
Full article ">Figure 2
<p>(<b>a</b>) Score plot of PCA (PC1 vs. PC2) for the discrimination among <span class="html-italic">Pleurotus</span> species (P. os, <span class="html-italic">P. ostreatus</span>; P. er, <span class="html-italic">P. eryngii</span>; P. nb, <span class="html-italic">P. nebrodensis</span>); (<b>b</b>) Plot with the loadings of the amino acids related to the discrimination among <span class="html-italic">Pleurotus</span> species.</p>
Full article ">Figure 2 Cont.
<p>(<b>a</b>) Score plot of PCA (PC1 vs. PC2) for the discrimination among <span class="html-italic">Pleurotus</span> species (P. os, <span class="html-italic">P. ostreatus</span>; P. er, <span class="html-italic">P. eryngii</span>; P. nb, <span class="html-italic">P. nebrodensis</span>); (<b>b</b>) Plot with the loadings of the amino acids related to the discrimination among <span class="html-italic">Pleurotus</span> species.</p>
Full article ">
17 pages, 14683 KiB  
Review
Methods of Purification and Application Procedures of Alpha1 Antitrypsin: A Long-Lasting History
by Simona Viglio, Paolo Iadarola, Maura D’Amato and Jan Stolk
Molecules 2020, 25(17), 4014; https://doi.org/10.3390/molecules25174014 - 2 Sep 2020
Cited by 8 | Viewed by 9515
Abstract
The aim of the present report is to review the literature addressing the methods developed for the purification of alpha1-antitrypsin (AAT) from the 1950s to the present. AAT is a glycoprotein whose main function is to protect tissues from human neutrophil elastase (HNE) [...] Read more.
The aim of the present report is to review the literature addressing the methods developed for the purification of alpha1-antitrypsin (AAT) from the 1950s to the present. AAT is a glycoprotein whose main function is to protect tissues from human neutrophil elastase (HNE) and other proteases released by neutrophils during an inflammatory state. The lack of this inhibitor in human serum is responsible for the onset of alpha1-antitrypsin deficiency (AATD), which is a severe genetic disorder that affects lungs in adults and for which there is currently no cure. Being used, under special circumstances, as a medical treatment of AATD in the so-called “replacement” therapy (consisting in the intravenous infusion of the missing protein), AAT is a molecule with a lot of therapeutic importance. For this reason, interest in AAT purification from human plasma or its production in a recombinant version has grown considerably in recent years. This article retraces all technological advances that allowed the manufacturers to move from a few micrograms of partially purified AAT to several grams of highly purified protein. Moreover, the chronic augmentation and maintenance therapy in individuals with emphysema due to congenital AAT deficiency (current applications in the clinical setting) is also presented. Full article
Show Figures

Figure 1

Figure 1
<p>(<b>A</b>) 12.5% SDS-PAGE showing the protein profile obtained from bronchoalveolar lavage fluid (BALF) samples from patients affected by Bronchilolitis Obliterans Syndrome (BOS). Alpha1-antitrypsin (AAT, database entry ID P01009 according to UniProt) and the AAT–HNE (human neutrophil elastase) complex are represented as single bands with an approximate Mr of 52 kDa and 80 kDa, respectively (unpublished data from our laboratory). Lane 1: standard proteins with known Mrs. (<b>B</b>) 3D structure of AAT. The beta sheets are represented in red while the alpha-helices are represented in green. The reactive center loop (RCL) in the upper pole of the molecule shows the P1–P1′ residues (Met358 and Ser359) recognized by HNE. Asn46, Asn83 and Asn247 are the residues to which the three carbohydrate side chains are linked. The molecular weight (MW) of AAT and its isoelectric point (pI) are 52 kDa and 5.1, respectively. The protein is synthesized in the liver and has a half-life of 4–5 days in healthy conditions.</p>
Full article ">Figure 2
<p>Mechanism of the imbalance between proteases and antiproteases leads to lung parenchyma destruction.</p>
Full article ">Figure 3
<p>Schematic. representation of α1-antitrypsin deficiency (AATD) pathophysiology.</p>
Full article ">
16 pages, 1961 KiB  
Communication
Proteinoid Nanocapsules as Drug Delivery System for Improving Antipsychotic Activity of Risperidone
by Liroy Lugasi, Igor Grinberg, Rivka Sabag, Ravit Madar, Haim Einat and Shlomo Margel
Molecules 2020, 25(17), 4013; https://doi.org/10.3390/molecules25174013 - 2 Sep 2020
Cited by 9 | Viewed by 3022
Abstract
Risperidone (RSP) is an atypical antipsychotic drug widely used to treat schizophrenia and bipolar disorder. Nanoparticles (NPs) are being developed as in vivo targeted drug delivery systems, which cross the blood-brain barrier and improve pharmacokinetics and drug effectiveness. Here, biodegradable proteinoids were synthesized [...] Read more.
Risperidone (RSP) is an atypical antipsychotic drug widely used to treat schizophrenia and bipolar disorder. Nanoparticles (NPs) are being developed as in vivo targeted drug delivery systems, which cross the blood-brain barrier and improve pharmacokinetics and drug effectiveness. Here, biodegradable proteinoids were synthesized by thermal step-growth polymerization from the amino acids l-glutamic acid, l-phenylalanine and l-histidine and poly (l-lactic acid). Proteinoid NPs containing RSP were then formed by self-assembly, overcoming the insolubility of the drug in water, followed by PEGylation (poly ethylene glycol (PEG) conjugation to increase the stability of the NPs in the aqueous continuous phase. These NPs are biodegradable owing to their peptide and ester moieties. They were characterized in terms of diameter, size distribution, drug loading, and long-term storage. Behavioral studies on mice found enhanced antipsychotic activity compared to free RSP. Full article
(This article belongs to the Special Issue Nanotechnology-Drug Delivery Systems)
Show Figures

Figure 1

Figure 1
<p>Chemical structure of risperidone.</p>
Full article ">Figure 2
<p>Proton (<b>A</b>) and carbon (<b>B</b>) NMR spectra of as-obtained P(EFH-PLLA) proteinoid.</p>
Full article ">Figure 3
<p>Hydrodynamic size histograms obtained by dynamic light scattering and cryogenic transmission electron microscope images of P(EFH-PLLA) (<b>A</b>,<b>B</b>) and P(EFH-PLLA)/RSP (<b>C</b>,<b>D</b>).</p>
Full article ">Figure 4
<p>XTT cell viability assay on murine J774A.1 and Neuro-2α cells after 48 h.</p>
Full article ">Figure 5
<p>Release of risperidone (RSP) from PEGylated P(EFH-PLLA)/RSP nanoparticles (NPs) in a phosphate buffered saline (PBS) and human serum at 37 °C over a 24 h period. Each data point represents the mean of three samples.</p>
Full article ">Figure 6
<p>Biodistribution of P(EFH-PLLA) NPs. One hundred µL of Cy7-conjugated NPs (0.2 mg/mL) were injected IV via the tail vein. Mice were sacrificed 4 h post injection, and organs were harvested.</p>
Full article ">Figure 7
<p>Distance analysis using ANOVA (analysis of variance) of open field test with hollow and RSP-loaded NP treatment 0–30 min prior to amphetamine administration and 30–60 min post amphetamine uptake. Asterisks (*) denote statistical significance versus saline and the hashtag (#) signifies the effect of amphetamine administration.</p>
Full article ">Figure 8
<p>Mean speed analysis using ANOVA of open field test with hollow and drug-loaded NPs treated 0–30 min prior to amphetamine administration and 30–60 min post amphetamine uptake. Asterisks (*) denote statistical significance versus saline and the hashtag (#) signifies the effect of amphetamine administration.</p>
Full article ">Figure 9
<p>Center time analysis using ANOVA of open field test with hollow and drug-loaded NP treatment 0–30 min prior to amphetamine administration and 30–60 post amphetamine uptake. Asterisks (*) denote statistical significance versus saline and the hashtag (#) signifies the effect of amphetamine administration.</p>
Full article ">
37 pages, 5184 KiB  
Review
Overview of Radiolabeled Somatostatin Analogs for Cancer Imaging and Therapy
by Romain Eychenne, Christelle Bouvry, Mickael Bourgeois, Pascal Loyer, Eric Benoist and Nicolas Lepareur
Molecules 2020, 25(17), 4012; https://doi.org/10.3390/molecules25174012 - 2 Sep 2020
Cited by 73 | Viewed by 11054
Abstract
Identified in 1973, somatostatin (SST) is a cyclic hormone peptide with a short biological half-life. Somatostatin receptors (SSTRs) are widely expressed in the whole body, with five subtypes described. The interaction between SST and its receptors leads to the internalization of the ligand–receptor [...] Read more.
Identified in 1973, somatostatin (SST) is a cyclic hormone peptide with a short biological half-life. Somatostatin receptors (SSTRs) are widely expressed in the whole body, with five subtypes described. The interaction between SST and its receptors leads to the internalization of the ligand–receptor complex and triggers different cellular signaling pathways. Interestingly, the expression of SSTRs is significantly enhanced in many solid tumors, especially gastro-entero-pancreatic neuroendocrine tumors (GEP-NET). Thus, somatostatin analogs (SSAs) have been developed to improve the stability of the endogenous ligand and so extend its half-life. Radiolabeled analogs have been developed with several radioelements such as indium-111, technetium-99 m, and recently gallium-68, fluorine-18, and copper-64, to visualize the distribution of receptor overexpression in tumors. Internal metabolic radiotherapy is also used as a therapeutic strategy (e.g., using yttrium-90, lutetium-177, and actinium-225). With some radiopharmaceuticals now used in clinical practice, somatostatin analogs developed for imaging and therapy are an example of the concept of personalized medicine with a theranostic approach. Here, we review the development of these analogs, from the well-established and authorized ones to the most recently developed radiotracers, which have better pharmacokinetic properties and demonstrate increased efficacy and safety, as well as the search for new clinical indications. Full article
(This article belongs to the Special Issue Radiolabeled Compounds for Diagnosis and Treatment of Cancer)
Show Figures

Figure 1

Figure 1
<p>Somatostatin receptors (SSTRs) biodistribution in the body (from The Human Protein Atlas <a href="https://www.proteinatlas.org/" target="_blank">https://www.proteinatlas.org/</a>).</p>
Full article ">Figure 2
<p>Schematic representation of the signaling pathways induced by somatostatin receptors activation. Green arrows: activated pathways; red arrows: inhibited pathways. Adapted from [<a href="#B8-molecules-25-04012" class="html-bibr">8</a>].</p>
Full article ">Figure 3
<p>Chemical structures of SRIF-14, SRIF-28, and selected examples of somatostatin analogs.</p>
Full article ">Figure 4
<p>Schematic design of a radiometallated bioconjugate.</p>
Full article ">Figure 5
<p>Representative (but not exhaustive) examples of acyclic and macrocyclic polyamino and polyaminocarboxylic chelator families and their derivatives.</p>
Full article ">Figure 6
<p>Structure of [<sup>111</sup>In]-pentetreotide (Octreoscan<sup>®</sup>).</p>
Full article ">Figure 7
<p>Structures of the three main systems radiolabeled with gallium-68.</p>
Full article ">Figure 8
<p>[<sup>99m</sup>Tc]-labeled somatostatin analogs.</p>
Full article ">Figure 9
<p>[<sup>18</sup>F]-labeled somatostatin analogs.</p>
Full article ">Figure 10
<p>(<b>A</b>) [<sup>68</sup>Ga]-DOTATOC (Somakit<sup>®</sup>) and (<b>B</b>) [<sup>177</sup>Lu]-DOTATATE (Lutathera<sup>®</sup>, cures 1, 2, and 3) imaging of a patient treated for progressive metastatic midgut NET (images courtesy of Centre Eugene Marquis, Rennes, France).</p>
Full article ">Figure 11
<p>[<sup>188</sup>Re]-P2045.</p>
Full article ">Figure 12
<p>[<sup>212</sup>Pb]-DOTAMTATE.</p>
Full article ">Figure 13
<p>Comparison between [<sup>68</sup>Ga]-OPS202 (<b>A</b>,<b>B</b>) and [<sup>68</sup>Ga]-DOTATOC (<b>C</b>,<b>D</b>) PET/CT images of the same patient with ileal neuroendocrine tumours, showing bilobar liver metastases (from Rangger et al. [<a href="#B233-molecules-25-04012" class="html-bibr">233</a>]).</p>
Full article ">
17 pages, 3186 KiB  
Article
Development of a Molecular Snail Xenomonitoring Assay to Detect Schistosoma haematobium and Schistosoma bovis Infections in their Bulinus Snail Hosts
by Tom Pennance, John Archer, Elena Birgitta Lugli, Penny Rostron, Felix Llanwarne, Said Mohammed Ali, Amour Khamis Amour, Khamis Rashid Suleiman, Sarah Li, David Rollinson, Jo Cable, Stefanie Knopp, Fiona Allan, Shaali Makame Ame and Bonnie Lee Webster
Molecules 2020, 25(17), 4011; https://doi.org/10.3390/molecules25174011 - 2 Sep 2020
Cited by 18 | Viewed by 4357
Abstract
Schistosomiasis, a neglected tropical disease of medical and veterinary importance, transmitted through specific freshwater snail intermediate hosts, is targeted for elimination in several endemic regions in sub-Saharan Africa. Multi-disciplinary methods are required for both human and environmental diagnostics to certify schistosomiasis elimination when [...] Read more.
Schistosomiasis, a neglected tropical disease of medical and veterinary importance, transmitted through specific freshwater snail intermediate hosts, is targeted for elimination in several endemic regions in sub-Saharan Africa. Multi-disciplinary methods are required for both human and environmental diagnostics to certify schistosomiasis elimination when eventually reached. Molecular xenomonitoring protocols, a DNA-based detection method for screening disease vectors, have been developed and trialed for parasites transmitted by hematophagous insects, such as filarial worms and trypanosomes, yet few have been extensively trialed or proven reliable for the intermediate host snails transmitting schistosomes. Here, previously published universal and Schistosoma-specific internal transcribed spacer (ITS) rDNA primers were adapted into a triplex PCR primer assay that allowed for simple, robust, and rapid detection of Schistosoma haematobium and Schistosoma bovis in Bulinus snails. We showed this two-step protocol could sensitively detect DNA of a single larval schistosome from experimentally infected snails and demonstrate its functionality for detecting S. haematobium infections in wild-caught snails from Zanzibar. Such surveillance tools are a necessity for succeeding in and certifying the 2030 control and elimination goals set by the World Health Organization. Full article
Show Figures

Figure 1

Figure 1
<p>Singleplex (<b>A</b>); ETTS2 + ETTS1) and multiplex (<b>B</b>); multiplex ETTS2 + ETTS1 + ITS2_Schisto_F, (<b>C</b>); ETTS2 + ETTS1 + ITS2_Schisto_R) PCRs on laboratory-bred <span class="html-italic">Bulinus wrighti</span> (<span class="html-italic">B.w.</span>) and <span class="html-italic">Schistosoma haematobium</span> (<span class="html-italic">S.h.</span>) gDNA separately (1; <span class="html-italic">B.w.</span>, 2; <span class="html-italic">S.h.</span>) and combined (3; <span class="html-italic">B.w.</span> + <span class="html-italic">S.h.</span>). When <span class="html-italic">B.w.</span> and <span class="html-italic">S.h.</span> DNA was combined (A3, B3, C3), two amplicons were produced by the ETTS1 + ETTS2 primers, a larger snail amplicon (Sn) (~1200 bp) and a smaller <span class="html-italic">Schistosoma</span> amplicon (T) (~1000), with the additional <span class="html-italic">Schistosoma-</span>specific primers producing either a 538 bp (B3; ITS2_Schisto_F) or 835 bp (C3; ITS2_Schisto_R) amplicon (S). A larger amplicon (A) (~1400–1600 bp) was also observed to be amplified in some reactions, and this was thought to be a PCR artifact or additional primer targets in the <span class="html-italic">Schistosoma</span> gDNA. L1 = HyperLadder I (Bioline, London, UK). -ve = negative, no template control. ITS = internal transcribed spacer.</p>
Full article ">Figure 2
<p>Multiplex ITS xenomonitoring assay trial at 55 °C (<b>A</b>) and 60 °C (<b>B</b>). Includes gDNA of <span class="html-italic">Bulinus wrighti</span> of both BioSprint (Lane 1 and 5) and DNeasy extractions (Lane 2 and 6) and gDNA of <span class="html-italic">Schistosoma haematobium</span> (Lane 3 and 5) and <span class="html-italic">S. bovis</span> (Lane 4 and 6). Combinations of <span class="html-italic">B. wrighti</span> and <span class="html-italic">S. haematobium</span> (Lane 5) or <span class="html-italic">S. bovis</span> (Lane 6) gDNA shown. Sn = snail amplicon, T = trematode amplicon, S = <span class="html-italic">Schistosoma</span> amplicon, and A = non-specific amplicon or artifact. L1 = HyperLadder I. L2 = HyperLadder IV (Bioline, London, UK). -ve = negative, no template control.</p>
Full article ">Figure 3
<p>Gel showing the secondary singleplex ITS xenomonitoring (SIX) PCR for 1) <span class="html-italic">Schistosoma haematobium</span> gDNA; 2) <span class="html-italic">S. bovis</span> gDNA; 3) <span class="html-italic">S. haematobium</span> + <span class="html-italic">B. wrighti</span> gDNA; 4) <span class="html-italic">S. bovis</span> + <span class="html-italic">B. wrighti</span> gDNA. -ve = non-template negative control. L1 = HyperLadder I (Bioline, London, UK).</p>
Full article ">Figure 4
<p>Sensitivity tests of ITS1-2-F PCR performed with serial dilutions of <span class="html-italic">Schistosoma haematobium</span> and <span class="html-italic">S. bovis</span> gDNA in the presence of <span class="html-italic">Bulinus wrighti</span> gDNA. L1 = HyperLadder I. L2 = HyperLadder IV (Bioline, London, UK).</p>
Full article ">Figure 5
<p>Experimental infections of <span class="html-italic">Bulinus truncatus</span> with <span class="html-italic">Schistosoma haematobium</span> (1–24), field-collected <span class="html-italic">B. globosus</span> infected with <span class="html-italic">Euclinostomum</span> sp. (<span class="html-italic">Euc</span>.) and field-collected <span class="html-italic">B. nasutus</span> shedding <span class="html-italic">Echinostoma</span> sp. cercariae (<span class="html-italic">Ech</span>.). The <span class="html-italic">S. haematobium</span> DNA amplicon was present (+ve) in 13 of the 23 non-patent snails (11 at 24 h post-exposure, and two at 11 weeks post-exposure), highlighted by the arrow. Lane 24 = <span class="html-italic">B. truncatus</span> sample that was shedding <span class="html-italic">S. haematobium</span> cercariae 11 weeks after exposure. The positive control (+ve) is a mix of <span class="html-italic">B. wrighti</span> and <span class="html-italic">S. haematobium</span> control gDNA. L1: HyperLadder I, L2: HyperLadder IV (Bioline, London, UK).</p>
Full article ">Figure 6
<p>Gel images for the multiplex ITS xenomonitoring (MIX) PCR amplicons for 94 non-patent <span class="html-italic">Bulinus globosus</span> collected from Wambaa, Pemba, United Republic of Tanzania. The text under each amplicon denotes the outcome of the <span class="html-italic">Schistosoma</span> sp. targeted sequencing where relevant (i.e., presence of 538 bp amplicon), which resulted in either <span class="html-italic">S. haematobium</span> (<span class="html-italic">S.h</span>.) or sequencing failure (F). The presence of a trematode band without the presence of the <span class="html-italic">Schistosoma</span> band indicated a non-<span class="html-italic">Schistosoma</span> trematode infection (Tr.). Other non-specific bands, in this case, larger bands (NA), were also observed in these snail populations, which did not amplify with the secondary SIX PCR. x = sample failure with no control amplicon. Arrows highlight the presence of the ~1000 bp trematode band when present (<span class="html-italic">n</span> = 8). <span class="html-italic">B. globosus</span> with a patent <span class="html-italic">S. haematobium</span> infection (Cham10.1 see [<a href="#B6-molecules-25-04011" class="html-bibr">6</a>]) was run as a positive control (+ve) and also represented the amplicon profile obtained for the seven patent <span class="html-italic">B. globosus</span> snails (five and two with <span class="html-italic">S. bovis</span> and <span class="html-italic">S. haematobium</span> infections, respectively (see <a href="#sec2dot4-molecules-25-04011" class="html-sec">Section 2.4</a>). -ve = the non-template negative control. L1—HyperLadder IV (Bioline, London, UK).</p>
Full article ">Figure 7
<p>Primer annealing positions flanking and internal to the ITS1 + 2 rDNA targets. Primer positions were mapped to <span class="html-italic">Schistosoma haematobium</span> and <span class="html-italic">S. bovis</span> ITS1 + 2 reference data [<a href="#B59-molecules-25-04011" class="html-bibr">59</a>] and to a <span class="html-italic">Bulinus globosus</span> and <span class="html-italic">B. nasutus</span> DNA reference (Pennance et al., unpublished data). For <span class="html-italic">Schistosoma</span> DNA, the primer combinations produced two fragments; 1) ETTS2–ETTS1 (1005 bp) and either 2) ITS2_Schisto_F-ETTS1 (538 bp) or 3) ITS2_Schisto_R-ETTS2 (835 bp). For <span class="html-italic">Bulinus</span> DNA, the primer combinations produced one fragment, ranging in size between 1232 and 1263 due to interspecies variation. For <span class="html-italic">Schistosoma</span> species identification, four SNPs were present at bp positions 90, 145, 195, and 265 in the ITS2 rDNA region, allowing differentiation of <span class="html-italic">S. haematobium</span> and <span class="html-italic">S. bovis</span> following ITS2 sequencing.</p>
Full article ">
10 pages, 1266 KiB  
Article
A Lanosteryl Triterpene (RA-3) Exhibits Antihyperuricemic and Nephroprotective Effects in Rats
by Nomadlozi Blessings Hlophe, Andrew Rowland Opoku, Foluso Oluwagbemiga Osunsanmi, Trayana Georgieva Djarova-Daniels, Oladipupo Adejumobi Lawal and Rebamang Anthony Mosa
Molecules 2020, 25(17), 4010; https://doi.org/10.3390/molecules25174010 - 2 Sep 2020
Cited by 6 | Viewed by 2516
Abstract
Considering the global health threat posed by kidney disease burden, a search for new nephroprotective drugs from our local flora could prove a powerful strategy to respond to this health threat. In this study we investigated the antihyperuricemic and nephroprotective potential of RA-3, [...] Read more.
Considering the global health threat posed by kidney disease burden, a search for new nephroprotective drugs from our local flora could prove a powerful strategy to respond to this health threat. In this study we investigated the antihyperuricemic and nephroprotective potential of RA-3, a plant-derived lanosteryl triterpene. The antihyperuricemic and nephroprotective effect of RA-3 was investigated using the adenine and gentamicin induced hyperuricemic and nephrotoxicity rat model. Following the induction of hyperuricemia and nephrotoxicity, the experimental model rats (Sprague Dawley) were orally administered with RA-3 at 50 and 100 mg/kg body weight, respectively, daily for 14 days. Treatment of the experimental rats with RA-3, especially at 100 mg/kg, effectively lowered the serum renal dysfunction (blood urea nitrogen and creatinine) and hyperuricemic (uric acid and xanthine oxidase) biomarkers. These were accompanied by increased antioxidant status with decrease in malondialdehyde content. A much improved histomorphological structure of the kidney tissues was also observed in the triterpene treated groups when compared to the model control group. It is evident that RA-3 possesses the antihyperuricemic and nephroprotective properties, which could be vital for prevention and amelioration of kidney disease. Full article
(This article belongs to the Special Issue Biological and Pharmacological Activity of Plant Natural Compounds)
Show Figures

Figure 1

Figure 1
<p>Methyl-3β-hydroxylanosta-9,24-dien-21-oate (RA-3), a lanosteryl triterpene from <span class="html-italic">P. longifolia</span>.</p>
Full article ">Figure 2
<p>Effect of RA-3 on serum levels of creatinine (<b>a</b>), blood urea nitrogen (BUN) (<b>b</b>), and angiotensin converting enzyme (ACE) (<b>c</b>). Data were expressed as mean ± SD (<span class="html-italic">n</span> = 5), * <span class="html-italic">p</span> &lt; 0.05 vs. MC group. NC—normal control, MC—model control, Allo—allopurinol.</p>
Full article ">Figure 3
<p>Effect of RA-3 on the serum levels of uric acid (<b>a</b>), xanthine oxidase (XO) (<b>b</b>) and interleukin-6 (IL-6) (<b>c</b>). Data were expressed as mean ± SD (<span class="html-italic">n</span> = 5), * <span class="html-italic">p</span> &lt; 0.05 vs. MC group. NC—normal control, MC—model control, Allo—allopurinol.</p>
Full article ">Figure 4
<p>Photomicrographs of the kidney sections of the rats. (<b>i</b>) Section of kidney from normal group, showing normal kidney architecture with intact glomerulus (black arrow) and renal tubules (black triangle); (<b>ii</b>) section from model control group, showing glomerular congestion, dilated renal tubules, and epithelial degeneration (red arrow), (<b>iii</b>) section from group treated with allopurinol, showing minimal improved renal architecture; (<b>iv</b>) section from group treated with RA-3 (50 mg/kg), showing regeneration of epithelium, (<b>v</b>) section from group treated with RA-3 (100 mg/kg), showing improved renal architecture characterized by epithelial regeneration and reduced glomerular congestion. The indicator size for each image is 14X-200 µm (H&amp;E).</p>
Full article ">
32 pages, 4896 KiB  
Article
Synthesis of Potential Haptens with Morphine Skeleton and Determination of Protonation Constants
by István Köteles, Károly Mazák, Gergő Tóth, Boglárka Tűz and Sándor Hosztafi
Molecules 2020, 25(17), 4009; https://doi.org/10.3390/molecules25174009 - 2 Sep 2020
Cited by 7 | Viewed by 5165
Abstract
Vaccination could be a promising alternative warfare against drug addiction and abuse. For this purpose, so-called haptens can be used. These molecules alone do not induce the activation of the immune system, this occurs only when they are attached to an immunogenic carrier [...] Read more.
Vaccination could be a promising alternative warfare against drug addiction and abuse. For this purpose, so-called haptens can be used. These molecules alone do not induce the activation of the immune system, this occurs only when they are attached to an immunogenic carrier protein. Hence obtaining a free amino or carboxylic group during the structural transformation is an important part of the synthesis. Namely, these groups can be used to form the requisite peptide bond between the hapten and the carrier protein. Focusing on this basic principle, six nor-morphine compounds were treated with ethyl acrylate and ethyl bromoacetate, while the prepared esters were hydrolyzed to obtain the N-carboxymethyl- and N-carboxyethyl-normorphine derivatives which are considered as potential haptens. The next step was the coupling phase with glycine ethyl ester, but the reactions did not work or the work-up process was not accomplishable. As an alternative route, the normorphine-compounds were N-alkylated with N-(chloroacetyl)glycine ethyl ester. These products were hydrolyzed in alkaline media and after the work-up process all of the derivatives contained the free carboxylic group of the glycine side chain. The acid-base properties of these molecules are characterized in detail. In the N-carboxyalkyl derivatives, the basicity of the amino and phenolate site is within an order of magnitude. In the glycine derivatives the basicity of the amino group is significantly decreased compared to the parent compounds (i.e., morphine, oxymorphone) because of the electron withdrawing amide group. The protonation state of the carboxylate group significantly influences the basicity of the amino group. All of the glycine ester and the glycine carboxylic acid derivatives are currently under biological tests. Full article
(This article belongs to the Special Issue ECSOC-23)
Show Figures

Figure 1

Figure 1
<p>C3-hapten synthesis.</p>
Full article ">Figure 2
<p>C6 ester-hapten synthesis.</p>
Full article ">Figure 3
<p>C6 oxime-hapten synthesis.</p>
Full article ">Figure 4
<p>C8-hapten synthesis.</p>
Full article ">Figure 5
<p>Bridge <span class="html-italic">N</span>-hapten synthesis.</p>
Full article ">Figure 6
<p>HerHap.</p>
Full article ">Figure 7
<p>3-acetamido heroin hapten.</p>
Full article ">Figure 8
<p>PrOxyHap and DiAmHap.</p>
Full article ">Figure 9
<p>6-AcMorHap and MorHap.</p>
Full article ">Figure 10
<p>Normorphine derivatives.</p>
Full article ">Figure 11
<p>The species distribution diagram of <span class="html-italic">N</span>-acetylglycine normorphine.</p>
Full article ">Figure 12
<p>The protonation scheme of tribasic <span class="html-italic">N</span>-carboxyalkyl opioid compounds.</p>
Full article ">Figure 13
<p>The microscopic protonation forms and microspecies of <span class="html-italic">N</span>-carboxyethyl-normorphine ethyl ester (<b>13</b>) and <span class="html-italic">N</span>-carboxyethyl-norcodeine (<b>27</b>).</p>
Full article ">Figure 14
<p>NMR-pH titration curves of the H9 and methylene bridge protons of <span class="html-italic">N</span>-carboxymethyl-noroxymorphone (<b>23</b>). Computer fits for log <span class="html-italic">K</span><sub>3</sub> are shown in solid lines.</p>
Full article ">Figure 15
<p>The microspecies distribution diagram of <span class="html-italic">N</span>-carboxyethyl-normorphine (<b>25</b>).</p>
Full article ">Scheme 1
<p><span class="html-italic">N</span>-demethylation of (dihydro)codeine: (<b>a</b>) α-chloro-ethyl chloroformate, 1,2-dichloroethane; (<b>b</b>) methanol, heating.</p>
Full article ">Scheme 2
<p><span class="html-italic">N</span>-demethylation of (dihydro)morphine: (<b>a</b>) α-chloro-ethyl chloroformate, 1,2-dichloroethane; (<b>b</b>) methanol, heating, acid hydrolysis.</p>
Full article ">Scheme 3
<p><span class="html-italic">N</span>-demethylation of oxymorphone and oxycodone: (<b>a</b>) α-chloro-ethyl chloroformate, 1,2-dichloroethane; (<b>b</b>) methanol, heating, acid hydrolysis.</p>
Full article ">Scheme 4
<p><span class="html-italic">N</span>-alkylation of nor-compounds: ethyl bromoacetate, sodium hydrogen carbonate, acetonitrile or dimethyl formamide, refl. 16 h.</p>
Full article ">Scheme 5
<p><span class="html-italic">N</span>-alkylation of nor-compounds: ethyl acrylate, triethylamine, ethanol, refl. 3 h.</p>
Full article ">Scheme 6
<p>Hydrolysis of esters: 1 M NaOH, ethanol, water, heating, 1 h.</p>
Full article ">Scheme 7
<p>Attempted amino acid coupling: glycine ethyl ester, <span class="html-italic">N</span>,<span class="html-italic">N</span>′-dicyclohexyl carbodiimide (DCCI) or 1-ethyl-3-(3-dimethylaminopropyl)-carbodiimide (EDAC), 1-hydroxybenzotriazole (HOBt), water, room temperature.</p>
Full article ">Scheme 8
<p>Amino acid connected hapten: <span class="html-italic">N</span>-chloroacetlyglycine ethyl ester, sodium hydrogen carbonate, potassium iodide, acetonitrile, 60 °C, 8 h.</p>
Full article ">Scheme 9
<p>Hydrolysis of <span class="html-italic">N</span>-acetylglycine esters: 1 M NaOH, ethanol, water, heating, 1 h.</p>
Full article ">
27 pages, 3272 KiB  
Review
Sunlight-Operated TiO2-Based Photocatalysts
by Irene Barba-Nieto, Uriel Caudillo-Flores, Marcos Fernández-García and Anna Kubacka
Molecules 2020, 25(17), 4008; https://doi.org/10.3390/molecules25174008 - 2 Sep 2020
Cited by 27 | Viewed by 3790
Abstract
Photo-catalysis is a research field with broad applications in terms of potential technological applications related to energy production and managing, environmental protection, and chemical synthesis fields. A global goal, common to all of these fields, is to generate photo-catalytic materials able to use [...] Read more.
Photo-catalysis is a research field with broad applications in terms of potential technological applications related to energy production and managing, environmental protection, and chemical synthesis fields. A global goal, common to all of these fields, is to generate photo-catalytic materials able to use a renewable energy source such as the sun. As most active photocatalysts such as titanium oxides are essentially UV absorbers, they need to be upgraded in order to achieve the fruitful use of the whole solar spectrum, from UV to infrared wavelengths. A lot of different strategies have been pursued to reach this goal. Here, we selected representative examples of the most successful ones. We mainly highlighted doping and composite systems as those with higher potential in this quest. For each of these two approaches, we highlight the different possibilities explored in the literature. For doping of the main photocatalysts, we consider the use of metal and non-metals oriented to modify the band gap energy as well as to create specific localized electronic states. We also described selected cases of using up-conversion doping cations. For composite systems, we described the use of binary and ternary systems. In addition to a main photo-catalyst, these systems contain low band gap, up-conversion or plasmonic semiconductors, plasmonic and non-plasmonic metals and polymers. Full article
(This article belongs to the Section Inorganic Chemistry)
Show Figures

Graphical abstract

Graphical abstract
Full article ">Figure 1
<p>Band gap energy and photoactivity under sunlight-type irradiation vs. doping level for metal-doped TiO<sub>2</sub> systems.</p>
Full article ">Figure 2
<p>Proposed electronic mechanism for Er<sup>3+</sup> doping of TiO<sub>2</sub> occurring under UV excitation (<b>a</b>) and near-infrared (NIR) excitation (<b>b</b>). Reprinted with permission from [<a href="#B38-molecules-25-04008" class="html-bibr">38</a>]: Obregón, S.; et al. <span class="html-italic">J. Catal.</span> <b>2013</b>, <span class="html-italic">299</span>, 298–306. Copyright © 2020 Elsevier. Schematic of the upconversion mechanism in Er<sup>3+</sup>/Yb<sup>3+</sup> co-doped materials (<b>c</b>). Reprinted with permission Naccache, R.; et al. <span class="html-italic">ChemSusChem</span>, <b>2013</b>, <span class="html-italic">6</span>, 1308–1311. Copyright © 2020 Wiley [<a href="#B34-molecules-25-04008" class="html-bibr">34</a>].</p>
Full article ">Figure 2 Cont.
<p>Proposed electronic mechanism for Er<sup>3+</sup> doping of TiO<sub>2</sub> occurring under UV excitation (<b>a</b>) and near-infrared (NIR) excitation (<b>b</b>). Reprinted with permission from [<a href="#B38-molecules-25-04008" class="html-bibr">38</a>]: Obregón, S.; et al. <span class="html-italic">J. Catal.</span> <b>2013</b>, <span class="html-italic">299</span>, 298–306. Copyright © 2020 Elsevier. Schematic of the upconversion mechanism in Er<sup>3+</sup>/Yb<sup>3+</sup> co-doped materials (<b>c</b>). Reprinted with permission Naccache, R.; et al. <span class="html-italic">ChemSusChem</span>, <b>2013</b>, <span class="html-italic">6</span>, 1308–1311. Copyright © 2020 Wiley [<a href="#B34-molecules-25-04008" class="html-bibr">34</a>].</p>
Full article ">Figure 3
<p>Schematic representation of the electronic effects generated by non-metal doping in anatase-based systems.</p>
Full article ">Figure 4
<p>Reaction rate for of the samples (CuO-, Bi<sub>2</sub>O<sub>3</sub>- and CeO<sub>2</sub>-TiO<sub>2</sub>) and TiO<sub>2</sub> reference prepared by microemulsion method under UV (<b>A</b>) and Sunlight-type (<b>B</b>) illumination conditions. Schematic representation of the interface role in the composite samples under UV (<b>C</b>–<b>E</b>) and Visible (<b>F</b>–<b>H</b>) irradiation. Reprinted with permission from [<a href="#B73-molecules-25-04008" class="html-bibr">73</a>]: Muñoz-Batista, M.J.; et al. <span class="html-italic">ACS Appl. Mater. Interfaces.</span> <b>2016</b>, <span class="html-italic">8</span>, 13934–13945. Copyright © 2020 American Chemical Society.</p>
Full article ">Figure 5
<p>(<b>A</b>) EDS-STEM images for W-Ti materials. 10W90Ti and 20W80Ti label doped samples with W/Ti atomic ratio of 0.11, 0.23, respectively. 0.1WO<sub>3</sub>/TiO<sub>2</sub> and 0.25WO<sub>3</sub>/TiO<sub>2</sub> are composite catalysts with 0.11, 0.24 WO<sub>3</sub>/TiO<sub>2</sub> molar ratio, respectively. A dark field STEM image is included at the right-hand top part of each map. (<b>B</b>) toluene and styrene photo-catalytic elimination reaction rate as a function of the W/Ti atomic ratio of the samples. Reprinted with permission from [<a href="#B86-molecules-25-04008" class="html-bibr">86</a>]: Caudillo-Flores, U.; et al. <span class="html-italic">Appl. Catal. B: Environ.</span> <b>2019</b>, <span class="html-italic">245</span>, 49–61. Copyright © 2020 Elsevier.</p>
Full article ">Figure 6
<p>TEM and HRTEM images of: (<b>A</b>,<b>B</b>) TiO<sub>2</sub>-101-G, (<b>C</b>,<b>D</b>) TiO<sub>2</sub>-001-G, and (<b>E</b>,<b>F</b>) TiO<sub>2</sub>-100-G. Reprinted with permission from [<a href="#B97-molecules-25-04008" class="html-bibr">97</a>]: Liu, L.; et al. <span class="html-italic">ChemSusChem</span> <b>2014</b>, <span class="html-italic">7</span>, 618–626. Copyright © 2020 Wiley.</p>
Full article ">Figure 7
<p>(<b>A</b>) Time-dependent H<sub>2</sub> generation from NH<sub>3</sub>BH<sub>3</sub> aqueous solution over different samples upon IR-light irradiation (λ &gt; 750 nm) (the inset shows the corresponding catalytic reaction temperatures); (<b>B</b>) schematic of the catalytic mechanism for H<sub>2</sub> generation from NH<sub>3</sub>BH<sub>3</sub> molecules over the plasmonic W<sub>18</sub>O<sub>49</sub> NWs (the inset shows a TEM image of the W<sub>18</sub>O<sub>49</sub> NWs); (<b>C</b>) catalytic H<sub>2</sub> generation from NH<sub>3</sub>BH<sub>3</sub> aqueous solution at different temperatures for 1 h over different samples without light irradiation; (<b>D</b>) time-dependent H<sub>2</sub> generation from NH<sub>3</sub>BH<sub>3</sub> aqueous solution at 15 °C over different samples upon IR-light irradiation: (a) TiO<sub>2</sub> NFs; (b) W<sub>18</sub>O<sub>49</sub> NWs; (c) W<sub>18</sub>O<sub>49</sub>/TiO<sub>2</sub> branched heterostructure; (d) without a catalyst. Reprinted with permission from [<a href="#B102-molecules-25-04008" class="html-bibr">102</a>]: Zhang, Z.; et al. <span class="html-italic">Adv. Mater.</span> <b>2018</b>, <span class="html-italic">30</span>, 1705221. Copyright © 2020 Wiley.</p>
Full article ">Figure 8
<p>Schematic illustration of preparation method and structure of NaYF<sub>4</sub>@TiO<sub>2</sub> photocatalyst (<b>A</b>). Schematic illustration of energy transfer mechanism from Yb<sup>3+</sup>-Tm<sup>3+</sup> doped hexagonal phase NaYF<sub>4</sub> microrods to {0 0 1} facets dominated UV–vis–NIR driven TiO<sub>2</sub> nanosheets under the 980 nm light irradiation (<b>B</b>). Reprinted with permission from [<a href="#B109-molecules-25-04008" class="html-bibr">109</a>]: Wang, W.; et al. <span class="html-italic">Appl. Catal. B</span> <b>2014</b>, <span class="html-italic">144</span>, 379–385. Copyright © 2020 Elsevier.</p>
Full article ">Figure 9
<p>The effect of calcination temperature on the structure of Au/Pd bimetallic nanoparticles and photoactivity of Au/Pd-TiO<sub>2</sub> nanocomposites. Reprinted with permission from [<a href="#B135-molecules-25-04008" class="html-bibr">135</a>]: Cybula, A.; et al. <span class="html-italic">Appl. Catal. B: Environ.</span> <b>2014</b>, <span class="html-italic">152–153</span>, 202–211. Copyright © 2020 Elsevier.</p>
Full article ">
11 pages, 2010 KiB  
Article
Semi-Synthetic Approach Leading to 8-Prenylnaringenin and 6-Prenylnaringenin: Optimization of the Microwave-Assisted Demethylation of Xanthohumol Using Design of Experiments
by Corinna Urmann and Herbert Riepl
Molecules 2020, 25(17), 4007; https://doi.org/10.3390/molecules25174007 - 2 Sep 2020
Cited by 6 | Viewed by 3707
Abstract
The isomers 8-prenylnaringenin and 6-prenylnaringenin, both secondary metabolites occurring in hops, show interesting biological effects, like estrogen-like, cytotoxic, or neuro regenerative activities. Accordingly, abundant sources for this special flavonoids are needed. Extraction is not recommended due to the very low amounts present in [...] Read more.
The isomers 8-prenylnaringenin and 6-prenylnaringenin, both secondary metabolites occurring in hops, show interesting biological effects, like estrogen-like, cytotoxic, or neuro regenerative activities. Accordingly, abundant sources for this special flavonoids are needed. Extraction is not recommended due to the very low amounts present in plants and different synthesis approaches are characterized by modest yields, multiple steps, the use of expensive chemicals, or an elaborate synthesis. An easy synthesis strategy is the demethylation of xanthohumol, which is available due to hop extraction industry, using lithium chloride and dimethylformamide, but byproducts and low yield did not make this feasible until now. In this study, the demethylation of xanthohumol to 8-prenylnaringenin and 6-prenylnaringenin is described the first time and this reaction was optimized using Design of Experiment and microwave irradiation. With the optimized conditions—temperature 198 °C, 55 eq. lithium chloride, and a reaction time of 9 min, a final yield of 76% of both prenylated flavonoids is reached. Full article
(This article belongs to the Section Natural Products Chemistry)
Show Figures

Graphical abstract

Graphical abstract
Full article ">Figure 1
<p>Structures of prenylated flavanones isoxanthohumol (IX), 8-prenylnaringenin (8PN), 6-prenylnaringenin (6PN), and the prenylated chalcone xanthohumol (XN).</p>
Full article ">Figure 2
<p>Demethylation of xanthohumol (XN) to 8-prenylnaringenin and 6-prenylnaringenin (6PN) using lithium chloride (LiCl), dimethylformamide (DMF), and microwave irradiation (MW).</p>
Full article ">Figure 3
<p>HPLC-chromatogram (λ = 290 nm flavanones; λ = 370 nm chalcones), with byproducts resulting from the reaction of XN with LiCl in DMF using microwave irradiation.</p>
Full article ">Figure 4
<p>Pareto charts of all targets ‘8PN’ (<b>a</b>), ‘6PN’(<b>b</b>), ‘XN’(<b>c</b>) and byproducts (<b>d</b>) with a significance level of 5% concerning the factors ‘temperature’‚ ‘lithium chloride’, and ‘time’ as well as the ‘block factor’, which has to be considered due to the duration of the experiment.</p>
Full article ">Figure 5
<p>Plot of the main effects of target ‘8PN‘ concerning the factors temperature, lithium chloride, and time.</p>
Full article ">Figure 6
<p>Interaction plot of target ‘8PN’ A: factor ‘temperature’ B: factor ‘LiCl’ C: factor ‘time’.</p>
Full article ">Figure 7
<p>Estimated response surface fixing the temperature at 206 °C.</p>
Full article ">Figure 8
<p>Estimated Response Surface; the factor LiCl is fixed at 65.25 mg.</p>
Full article ">
14 pages, 3073 KiB  
Article
Comprehensive Metabolome Analysis of Fermented Aqueous Extracts of Viscum album L. by Liquid Chromatography−High Resolution Tandem Mass Spectrometry
by Evelyn Peñaloza, Carla Holandino, Claudia Scherr, Paula I. P. de Araujo, Ricardo M. Borges, Konrad Urech, Stephan Baumgartner and Rafael Garrett
Molecules 2020, 25(17), 4006; https://doi.org/10.3390/molecules25174006 - 2 Sep 2020
Cited by 33 | Viewed by 4175
Abstract
Fermented aqueous extracts of Viscum album L. are widely used for cancer treatment in complementary medicine. The high molecular weight compounds viscotoxins and lectins are considered to be the main active substances in the extracts. However, a vast number of small molecules (≤1500 [...] Read more.
Fermented aqueous extracts of Viscum album L. are widely used for cancer treatment in complementary medicine. The high molecular weight compounds viscotoxins and lectins are considered to be the main active substances in the extracts. However, a vast number of small molecules (≤1500 Da) is also expected to be present, and few studies have investigated their identities. In this study, a comprehensive metabolome analysis of samples of fermented aqueous extracts of V. album from two host tree species (Malus domestica and Pinus sylvestris), both prepared by two pharmaceutical manufacturing processes, was performed by liquid chromatography−high resolution tandem mass spectrometry (LC-HRMS/MS). A total of 212 metabolites were putatively annotated, including primary metabolites (e.g., amino acids, organic acids, etc.) and secondary metabolites (mostly phenolic compounds). A clear separation between V. album samples according to the host tree species, but not due to manufacturing processes, was observed by principal component analysis. The biomarkers responsible for this discrimination were assessed by partial least squares−discriminant analysis. Because V. album extracts from different host trees have different clinical applications, the present work highlights the possibility of characterizing the metabolome for identification and traceability of V. album fermented aqueous extracts. Full article
(This article belongs to the Special Issue Current Trends in the Analysis of Medicinal Plants)
Show Figures

Figure 1

Figure 1
<p>Metabolites in the fermented aqueous extracts of <span class="html-italic">V. album</span> putatively annotated by LC-HRMS/MS according to the ionization mode and chemical group.</p>
Full article ">Figure 2
<p>Typical LC-HRMS chromatograms of fermented aqueous extracts of <span class="html-italic">V. album</span> from the two host trees (<span class="html-italic">M. domestica</span> and <span class="html-italic">P. sylvestris</span>) and manufacturing processes (APVAE and VAE) in positive (ESI+) and negative (ESI-) electrospray ionization modes. Abbreviations: ISCM: <span class="html-italic">M. domestica</span>/APVAE, HGM: <span class="html-italic">M. domestica</span>/VAE, ISCP: <span class="html-italic">P. sylvestris</span>/APVAE; HGP: <span class="html-italic">P. sylvestris</span>/VAE.</p>
Full article ">Figure 3
<p>PCA (<b>A</b>,<b>B</b>) and PLS-DA (<b>C</b>,<b>D</b>) score plots from data of <span class="html-italic">V. album</span> fermented aqueous extracts analyzed by LC-ESI(±)-HRMS. Abbreviations: QC: pooled quality control samples, ISCM: <span class="html-italic">M. domestica</span>/APVAE, HGM: <span class="html-italic">M. domestica</span>/VAE, ISCP: <span class="html-italic">P. sylvestris</span>/APVAE; HGP: <span class="html-italic">P. sylvestris</span>/VAE.</p>
Full article ">Figure 4
<p>Box plot graphs of annotated metabolites responsible for the discrimination of <span class="html-italic">P. sylvestris</span> group from <span class="html-italic">M. domestica</span> in the PLS-DA model. Abbreviations: ISCM: <span class="html-italic">M. domestica</span>/APVAE, HGM: <span class="html-italic">M. domestica</span>/VAE, ISCP: <span class="html-italic">P. sylvestris</span>/APVAE; HGP: <span class="html-italic">P. sylvestris</span>/VAE. Tukey’s multiple comparison test was performed for significant difference. <b>*</b> <span class="html-italic">p</span> &lt; 0.05; <b>**</b> <span class="html-italic">p</span> &lt; 0.01; <b>***</b> <span class="html-italic">p</span> &lt; 0.001; <b>****</b> <span class="html-italic">p</span> &lt; 0.0001.</p>
Full article ">Figure 5
<p>Box plot graphs of annotated metabolites responsible for the discrimination of <span class="html-italic">M. domestica</span> group from <span class="html-italic">P. sylvestris</span> in the PLS-DA model. Abbreviations: ISCM: <span class="html-italic">M. domestica</span>/APVAE, HGM: <span class="html-italic">M. domestica</span>/VAE, ISCP: <span class="html-italic">P. sylvestris</span>/APVAE; HGM: <span class="html-italic">P. sylvestris</span>/VAE. Tukey’s multiple comparison test was performed for significant difference. <b>*</b> <span class="html-italic">p</span> &lt; 0.05; <b>**</b> <span class="html-italic">p</span> &lt; 0.01; <b>***</b> <span class="html-italic">p</span> &lt; 0.001; <b>****</b> <span class="html-italic">p</span> &lt; 0.0001. <span class="html-italic">n</span>.s. (not significant): <span class="html-italic">p</span> &gt; 0.05.</p>
Full article ">Figure 6
<p>Nodes from the molecular network related to flavonoid structures obtained from fermented aqueous extracts of <span class="html-italic">V. album</span>.</p>
Full article ">Figure 7
<p>Nodes from the molecular network highlighting the compounds with high loading value in PLS-DA analysis and their distribution across different sample groups of fermented aqueous extracts of <span class="html-italic">V. album</span>.</p>
Full article ">
20 pages, 5091 KiB  
Review
Memantine Derivatives as Multitarget Agents in Alzheimer’s Disease
by Giambattista Marotta, Filippo Basagni, Michela Rosini and Anna Minarini
Molecules 2020, 25(17), 4005; https://doi.org/10.3390/molecules25174005 - 2 Sep 2020
Cited by 30 | Viewed by 5884
Abstract
Memantine (3,5-dimethyladamantan-1-amine) is an orally active, noncompetitive N-methyl-D-aspartate receptor (NMDAR) antagonist approved for treatment of moderate-to-severe Alzheimer’s disease (AD), a neurodegenerative condition characterized by a progressive cognitive decline. Unfortunately, memantine as well as the other class of drugs licensed for AD treatment acting [...] Read more.
Memantine (3,5-dimethyladamantan-1-amine) is an orally active, noncompetitive N-methyl-D-aspartate receptor (NMDAR) antagonist approved for treatment of moderate-to-severe Alzheimer’s disease (AD), a neurodegenerative condition characterized by a progressive cognitive decline. Unfortunately, memantine as well as the other class of drugs licensed for AD treatment acting as acetylcholinesterase inhibitors (AChEIs), provide only symptomatic relief. Thus, the urgent need in AD drug development is for disease-modifying therapies that may require approaching targets from more than one path at once or multiple targets simultaneously. Indeed, increasing evidence suggests that the modulation of a single neurotransmitter system represents a reductive approach to face the complexity of AD. Memantine is viewed as a privileged NMDAR-directed structure, and therefore, represents the driving motif in the design of a variety of multi-target directed ligands (MTDLs). In this review, we present selected examples of small molecules recently designed as MTDLs to contrast AD, by combining in a single entity the amantadine core of memantine with the pharmacophoric features of known neuroprotectants, such as antioxidant agents, AChEIs and Aβ-aggregation inhibitors. Full article
(This article belongs to the Special Issue Multitarget Ligands)
Show Figures

Graphical abstract

Graphical abstract
Full article ">Figure 1
<p>Conjugation strategies exploiting memantine’s NMDAR antagonism to tackle AD.</p>
Full article ">Figure 2
<p>Drug design and biological activities of 7-MEOTA-amantadine hybrids <b>1</b> and <b>2</b>.</p>
Full article ">Figure 3
<p>Drug design and biological activities of 6-chlorotacrine-memantine hybrid <b>3</b>.</p>
Full article ">Figure 4
<p>Drug design and biological activities of 6-chlorotacrine-benzohomoadamantane hybrids <b>4</b>–<b>6</b>.</p>
Full article ">Figure 5
<p>Drug design and biological activities of memantine-galantamine hybrids <b>7</b> and <b>8</b>.</p>
Full article ">Figure 6
<p>Drug design and biological activities of carbazole/tetrahydrocarbazole-aminoadamantane hybrids <b>9</b>–<b>11</b>.</p>
Full article ">Figure 7
<p>Drug design and biological activities of ferulic acid-memantine hybrid <b>12</b>.</p>
Full article ">Figure 8
<p>Drug design and biological activities of lipoic acid-memantine hybrid <b>13</b>.</p>
Full article ">Figure 9
<p>Drug design and biological activities of propargyl-amantadine hybrids <b>14</b> and <b>15</b>.</p>
Full article ">Figure 10
<p>Drug design and biological activities of polyamine-memantine hybrids <b>16</b> and <b>17</b>.</p>
Full article ">Figure 11
<p>Drug design and biological activities of memantine prodrug <b>18</b>.</p>
Full article ">Figure 12
<p>Drug design and biological activities of N’-arylcarbohydrazide-aminoadamantane hybrid <b>19</b>.</p>
Full article ">
14 pages, 4308 KiB  
Article
Quercitrin Stimulates Hair Growth with Enhanced Expression of Growth Factors via Activation of MAPK/CREB Signaling Pathway
by Jaeyoon Kim, Soon Re Kim, Yun-Ho Choi, Jae young Shin, Chang Deok Kim, Nae-Gyu Kang, Byung Cheol Park and Sanghwa Lee
Molecules 2020, 25(17), 4004; https://doi.org/10.3390/molecules25174004 - 2 Sep 2020
Cited by 29 | Viewed by 6573
Abstract
The present study aimed to investigate the molecular mechanism of quercitrin, a major constituent of Hottuynia cordata extract, for its hair growth stimulating activities in cultured human dermal papilla cells (hDPCs). Quercitrin enhanced the cell viability and cellular energy metabolism in cultured hDPCs [...] Read more.
The present study aimed to investigate the molecular mechanism of quercitrin, a major constituent of Hottuynia cordata extract, for its hair growth stimulating activities in cultured human dermal papilla cells (hDPCs). Quercitrin enhanced the cell viability and cellular energy metabolism in cultured hDPCs by stimulating the production of NAD(P)H and mitochondrial membrane potential (ΔΨ). The expression of Bcl2, an essential marker for anagen hair follicle and cell survival, was increased by quercitrin treatment. Quercitrin also increased the cell proliferation marker Ki67. The expression of growth factors—such as bFGF, KGF, PDGF-AA, and VEGF—were increased by quercitrin both in mRNA and protein levels. In addition, quercitrin was found to increase the phosphorylation of Akt, Erk, and CREB in cultured hDPCs, while inhibitors of MAPKs reversed the effects of quercitrin. Finally, quercitrin stimulated hair shaft growth in cultured human hair follicles. Our data obtained from present study are in line with those previously reported and demonstrate that quercitrin is (one of) the active compound(s) of Hottuynia cordata extract which showed hair growth promoting effects. It is strongly suggested that the hair growth stimulating activity of quercitrin was exerted by enhancing the cellular energy metabolism, increasing the production of growth factors via activation of MAPK/CREB signaling pathway. Full article
(This article belongs to the Section Medicinal Chemistry)
Show Figures

Graphical abstract

Graphical abstract
Full article ">Figure 1
<p>Quercitrin enhanced cell viability in cultured hDPCs. (<b>a</b>) Quercitrin chemical structure. (<b>b</b>) Cell viability was assessed using CCK-8 assay kit after quercitrin treatment (0.1, 1, 10, 100 nM and 1 µM) for 24 h. The value of non-treated control was taken to be 100%. N.T, non-treated control; MNX, minoxidil. Significantly different compared with N.T (* <span class="html-italic">p</span> &lt; 0.05, ** <span class="html-italic">p</span> &lt; 0.01, *** <span class="html-italic">p</span> &lt; 0.001).</p>
Full article ">Figure 2
<p>Effect of quercitrin on cellular energy metabolism in cultured hDPCs. (<b>a</b>) Mitochondrial membrane potential was measured after quercitrin treatment (1, 10, and 100 nM) for 24 h. The 100 nM minoxidil was used as a positive control. (<b>b</b>) JC-1 monomer form was seen as green and aggregate form as red by fluorescent microscopy. N.T, non-treated control; MNX, minoxidil. Significantly different compared with N.T (* <span class="html-italic">p</span> &lt; 0.05, ** <span class="html-italic">p</span> &lt; 0.01, *** <span class="html-italic">p</span> &lt; 0.001).</p>
Full article ">Figure 3
<p>Effect of quercitrin on mRNA expression levels of proliferative/apoptotic genes and protein level of Bcl2 in cultured hDPCs. The cultured DPCs were harvested after quercitrin treatment (1, 10, and 100 nM) for 24 h. (<b>a</b>) The mRNA expression levels of Bcl2, Bad, Bax and Ki67 genes in cultured hDPCs were measured by real-time PCR. (<b>b</b>) Whole cell lysates (50 µg protein) from DPCs were analyzed by immunoblotting to determine the levels of Bcl2, and (<b>c</b>) the band intensity was quantitated. N.T, non-treated control; MNX, minoxidil. Significantly different compared with N.T (* <span class="html-italic">p</span> &lt; 0.05, ** <span class="html-italic">p</span> &lt; 0.01, *** <span class="html-italic">p</span> &lt; 0.001).</p>
Full article ">Figure 4
<p>Effect of quercitrin on mRNA expression levels of growth factor genes in cultured hDPCs. The cells were harvested after quercitrin treatment (1, 10, 100 nM and 1 µM) for 24 h. The mRNA expression levels of eight genes in cultured hDPCs were measured by real-time PCR. N.T, non-treated control; MNX, minoxidil. Significantly different compared with N.T (* <span class="html-italic">p</span> &lt; 0.05, ** <span class="html-italic">p</span> &lt; 0.01, *** <span class="html-italic">p</span> &lt; 0.001).</p>
Full article ">Figure 5
<p>Effect of quercitrin on the expression of growth factors in cultured hDPCs. The DPCs were treated with quercitrin (0, 100 nM and 1 µM) for 24 h, and then collected. Cells cultured with vehicle medium were used as non-treated control. Total of 41 types of human growth factors were analyzed. (<b>a</b>) The 12 types of growth factors and receptors were displayed and (<b>b</b>) the band intensity was quantitated. N.T, non-treated control. Positive, biotin-conjugated IgG. Significantly different compared with N.T (* <span class="html-italic">p</span> &lt; 0.05, ** <span class="html-italic">p</span> &lt; 0.01, *** <span class="html-italic">p</span> &lt; 0.001).</p>
Full article ">Figure 6
<p>Effect of quercitrin on the protein expression of bFGF and KGF in cultured hDPCs. The DPCs were treated with quercitrin at concentrations of 1, 10, 100 nM and 1 µM for 24 h. Whole cell lysates (<b>a</b>,<b>c</b>) and culture medium (<b>b</b>,<b>d</b>) of each cultured DPCs were analyzed by ELISA to determine the levels of bFGF (a,b) and KGF (c,d). N.T, non-treated control. Significantly different compared with N.T (* <span class="html-italic">p</span> &lt; 0.05, ** <span class="html-italic">p</span> &lt; 0.01, *** <span class="html-italic">p</span> &lt; 0.001).</p>
Full article ">Figure 7
<p>Effect of quercitrin on Akt, Erk, and CREB phosphorylation in cultured hDPCs. Quercitrin was treated for different times (0, 1, 2, 5, 10, and 20 min). (<b>a</b>) Whole cell lysates were analyzed by immunoblotting to determine the levels of Akt, phospho-Akt, Erk, phospho-Erk, CREB and phospho-CREB. As an internal control, GAPDH were used. (<b>b</b>) The ratio of pAkt/Akt, pErk/Erk, and pCREB/CREB was calculated. N.T, non-treated control. The data represent the means of five independent samples. Significantly different compared with N.T (Quercitrin * <span class="html-italic">p</span> &lt; 0.05, ** <span class="html-italic">p</span> &lt; 0.01, *** <span class="html-italic">p</span> &lt; 0.001; Minoxidil # <span class="html-italic">p</span> &lt; 0.05, ## <span class="html-italic">p</span> &lt; 0.01, ### <span class="html-italic">p</span> &lt; 0.001).</p>
Full article ">Figure 8
<p>Effect of Akt inhibitor API-2 and Erk inhibitor U0126 on quercitrin stimulated gene expression. The cultured DPCs were harvested after 100 nM quercitrin treatment with inhibitors (API-2 and U0125) for 24 h. The mRNA expression levels of bFGF, KGF, Bcl2, and Ki67 were measured by real-time PCR. The data represent the means of six independent samples. Significantly different compared with 100 nM quercitrin treatment (API-2 * <span class="html-italic">p</span> &lt; 0.05, ** <span class="html-italic">p</span> &lt; 0.01, *** <span class="html-italic">p</span> &lt; 0.001; U0126 # <span class="html-italic">p</span> &lt; 0.05, ## <span class="html-italic">p</span> &lt; 0.01, ### <span class="html-italic">p</span> &lt; 0.001).</p>
Full article ">Figure 9
<p>Quercitrin stimulated the receptor tyrosine kinases and non-receptor tyrosine kinases in cultured hDPCs. 100 nM of quercitrin was treated for appropriate times (0, 0.5, 1 min). Whole cell lysates were analyzed by immunoblotting to determine the level of phospho-tyrosine following manufacturer’s instruction. Total of 71 types of tyrosine kinase were analyzed. The 8 receptor tyrosine kinases and 10 non-receptors tyrosine kinases were displayed (Significantly different compared with 0 min, <span class="html-italic">p</span> &lt; 0.05). Positive, biotin-conjugated IgG.</p>
Full article ">Figure 10
<p>Effect of quercitrin on hair growth in human hair follicle organ culture. In order to evaluate the effect of quercitrin, the anagen human hair follicle were prepared and cultured for 6 days. Quercitrin was treated at concentrations of 5, 10 µM. (<b>a</b>) At day 4 and 6, the cultured hair follicles were photo-documented. (<b>b</b>) The hair shaft growth was analyzed. Minoxidil was used as a positive control. The data represent the means of sixteen follicles. Significantly different compared with N.T (* <span class="html-italic">p</span> &lt; 0.05, ** <span class="html-italic">p</span> &lt; 0.01, *** <span class="html-italic">p</span> &lt; 0.001).</p>
Full article ">
Previous Issue
Back to TopTop