E. A. TAIWO, Tracer Density Effect on the Dynamic Liquid Hold-up in the Packed …, Chem. Biochem. Eng. Q. 19 (1) 13–16 (2005)
13
Tracer Density Effect on the Dynamic Liquid Hold-up
in the Packed Distillation Column
E. A. Taiwo
Department of Chemical Engineering, Obafemi Awolowo University,
Ile-Ife, Nigeria; Tel.: (234)08038430833;
E-mail: etaiwo@oauife.edu.ng, eataiwo@yahoo.com
Original scientific paper
Received: March 31, 2004
Accepted: November 1, 2004
Tracer density effect on dynamic liquid hold-up in packed distillation column was
investigated, with the view to explore the process hydrodynamics in design of reactive
distillation in packed columns.
An increased dynamic liquid hold-up with tracer density rise was more pronounced
at the lower segment of the packed section, notably for low percentage of aqueous methanol mixtures, to about 55 % increase for 0.1 mole fraction aqueous methanol mixture.
The effect falls with increase in methanol concentration in the feed mixtures. The tracer
concentration distribution across the packed section of the column supports backmixing
of liquid phase in packed distillation operation, with dynamic liquid holdup concentrating at the lower part of the packed section.
Low pressure drop, associated with packed column, would be advantageous to reactive
distillation operation in the column, especially for systems with high specific reaction rates.
Key words:
Tracer density, dynamic liquid hold-up, distillation
Introduction
Although, the application of reactive distillation,
which is an in-situ separation of process fluid, has
increased rapidly in chemical and petroleum industries (Doherty and Maloney, 2001),1 the design of
columns for reactive distillation is yet to be fully explored. Kaymak and Luyben (2004)2 itemized several
limitations to effective application of reactive distillation. One of these limitations is the specific reaction rate of the system. To adequately cover this
problem, consideration must be given to the residence time of species in the column, among other
factors. This would require careful study of liquid
hold-up in columns (especially packed columns)
more so, that the residence time is an essential factor
in chemical reaction – a criterion for reactive distillation. The hydrodynamics of this phenomenon requires understanding the liquid hold-up in beds and
the residual liquid hold-up as a function of liquid
flow and reactor geometry. Backmixing of phases,
rather than plug flow model, had earlier been found
adequate to describe concentration profile in packed
column (Taiwo 1993,3 Taiwo and Fasesan 20024),
but literature report on this phenomenon is sparse
and hence the effect of dynamic liquid hold-up on its
effectiveness and efficiency is not available. On this
premise, this research work was designed to study
the effect of the molecular species on the residence
time in the reactor and hence the significance of the
dynamic liquid hold-up operation.
Experimental
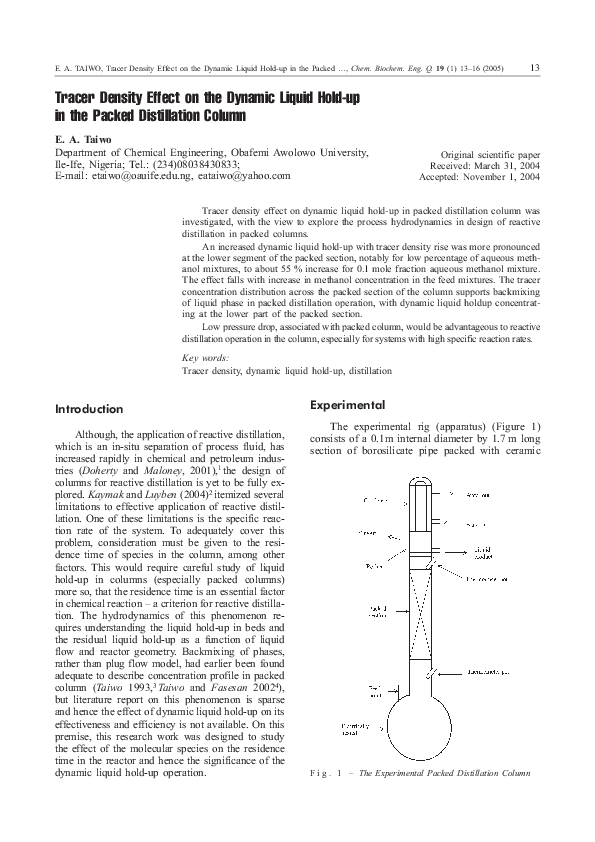
The experimental rig (apparatus) (Figure 1)
consists of a 0.1m internal diameter by 1.7 m long
section of borosilicate pipe packed with ceramic
F i g . 1 – The Experimental Packed Distillation Column
�14
E. A. TAIWO, Tracer Density Effect on the Dynamic Liquid Hold-up in the Packed …, Chem. Biochem. Eng. Q. 19 (1) 13–16 (2005)
Raschig rings (8 mm nominal diameter, and 12 mm
length with 492.05 m2 m–3 volumetric area) randomly arranged in the column. Probes were introduced at three locations in the column to adequately
measure the tracer distribution and the dynamic liquid hold-up.
The boiler pot was charged with aqueous methanol and the condenser unit was supplied with cooling water. The column was operated at atmospheric
pressure and total reflux condition to attain steady
state. On attainment of steady state, a situation indicated by constant column temperature across the
column, the volume of liquid held up was determined from the height of the liquid held-up, read
from the graduated scale fixed on the column at
each of the designated segment of the packed column fixed with the probes. Thereafter, tracer sample which is 10 ml of 10 g L–1 KCl solution was injected into the column, through either the top or
bottom port. The tracer distribution across the column was monitored by conductivity measurement.
The probe and circuit for detection and transmission of conductivity measurement were designed as
described by Trasi and Khang (1979).5 A total of
thirty-five experimental run were carried out and
six of the experiments were repeated for consistency and reproducibility.
F i g . 2 – Tracer concentration distribution across the column packed section for tracer injected at the top
port. (run 8)
Results and discussion
The tracer concentration profiles measured at
the top and bottom-sampling points as a function of
time are reported in figures 2 and 3. Figure 2 shows
the distribution of tracer introduced into the column
via the top port. A sharp rise in tracer concentration
was observed at the top sampling point while a
gradual rise was felt at the bottom sampling point.
The concentration registered at the bottom point
later rise above that of the top point. From figure 3,
the changes in concentration of tracer across the
column when injected at the bottom port was instantly felt at the bottom sampling point, and rose
sharply with time, whereas at the top, the tracer was
initially unnoticed until about 600 s. Even then, it
was minimal (about 35 mg L–1).
The tracer concentration profiles in figures
2 and 3 reflect backmixing in the column. The trend
was the same for all the experimental runs.
Table 1 shows that the dynamic liquid hold-up
is resident mainly at the bottom section of the column. At the probe P1 (top section of the column)
the measured hold-up for a 0.2 mole fraction aqueous methanol (run 8) was 0.0243 m3 m–3 as compared to the bottom probe P3 that had a dynamic
liquid hold-up of 0.0301 m3 m–3. This corroborates
the earlier report of Taiwo and Fasesan (2004).6
F i g . 3 – Tracer concentration distribution across the column packed section for tracer injected at the bottom port. (run 8)
Both table 1 and figures 2 and 3 reveal a continuous
refreshing of the liquid held-up across the column
as against the static holdup, hence the dynamic
fraction of the liquid hold-up preponderates. This
gives credence to backmixing in the packed distillation column operation. The dynamic nature of the
liquid hold-up is responsible for the observed tracer
concentration distribution. The highest tracer concentration was observed at the bottom sampling
�15
E. A. TAIWO, Tracer Density Effect on the Dynamic Liquid Hold-up in the Packed …, Chem. Biochem. Eng. Q. 19 (1) 13–16 (2005)
T a b l e 1 – Experimental dynamic liquid hold-up data
Dynamic liquid hold-up, H/m3 m–3
Feed composition
Heat flow rate
xF,Me
Q/kJ s–1
P1
P2
P3
1
0.1
0.195
0.0196
0.0228
0.0250
2
0.1
0.235
0.0204
0.0239
0.0269
3
0.1
0.260
0.0214
0.0245
0.0286
4
0.1
0.326
0.0229
0.0251
0.0294
5
0.2
0.195
0.0203
0.0232
0.0243
6
0.2
0.235
0.0210
0.0239
0.0272
7
0.2
0.260
0.0229
0.0244
0.0289
8
0.2
0.326
0.0243
0.0262
0.0301
9
0.4
0.195
0.0220
0.0248
0.0274
10
0.4
0.235
0.0245
0.0262
0.0290
11
0.4
0.260
0.0258
0.0289
0.0315
12
0.4
0.326
0.0273
0.0294
0.0322
13
0.6
0.195
0.0245
0.0260
0.0306
14
0.6
0.235
0.0252
0.0276
0.0314
15
0.6
0.260
0.0288
0.0304
0.0330
16
0.6
0.326
0.0305
0.0323
0.0351
Run
point with highest dynamic liquid hold-up irrespective of the port of tracer injection. The tracer concentration, spread across packed section, was similar to the dynamic liquid hold-up distribution. This
is an indication of favorable performance of packed
column for reactive distillation, specifically, for
systems with medium to high specific reaction
rates: a condition requiring low pressure drop provided by packed column. Also, it suggests that, locating the reactants’ introduction into the column at
a point a little above the reaction zone will probably
give a more efficient design. This phenomenon will
be explored in a future paper.
The influence of the tracer density variation
was significant for the lower percentage aqueous
systems. A 50 % increase in the tracer density resulted into increased dynamic liquid hold-up from
0.0243 to 0.0341 m3 m–3 at the top probe, and 0.0301
to 0.0466 m3 m–3 at the bottom probe for 0.2 mole
fraction aqueous methanol (Table 2). This rise is
T a b l e 2 – Tracer density influence of dynamic liquid hold-up
Run
Dynamic liquid hold-up H/m3 m–3
Feed
composition
(xF,Me)
tracer density, � = 10 g L–1
tracer density, � = 15 g L–1
P1
P2
P3
P1
P2
P3
4
0.1
0.0229
0.0251
0.0294
0.0323
0.0374
0.0456
8
0.2
0.0243
0.0262
0.0301
0.0341
0.0387
0.0466
12
0.4
0.0273
0.0294
0.0322
0.0338
0.0371
0.0418
16
0.6
0.0305
0.0323
0.0351
0.0314
0.0332
0.0363
�16
E. A. TAIWO, Tracer Density Effect on the Dynamic Liquid Hold-up in the Packed …, Chem. Biochem. Eng. Q. 19 (1) 13–16 (2005)
between 40 and 55 percent increase in the dynamic
liquid hold-up. This could have resulted from either
the cooling effect of tracer material resulting into
ease of condensation of the vapor phase in a similar
manner to cyclic cooling of vapor in distillation
column presented by Baron et. al. (1980),7 or increased molecular interaction of the molecular species resulting into drag action emanating from the
coupling of molecules put forward by Fasesan and
Taiwo (2001).8 The increase was less than 5 % rise
for the 0.6 mole fraction aqueous methanol studied. A dynamic hold-up of 0.0314 m3 m–3 at P1 and
0.0363 m3 m–3 at P3 was observed (run 16). This is
approximately 3.0 and 3.5 percent rise, respectively. Therefore, the dynamic liquid hold-up of the
separating mixtures having higher more volatile
component (mvc) show less response to the tracer
density increase. The tracer solution injected at the
top is expected to cause more dispersion while that
injected at the bottom would suppress dispersion,
more so, that the tracer element are in upward and
downward motion in the column, due to back mixing. Such effect would be felt at lower region than
the upper region, since less dense tracer elements
could be pushed upward more easily. Thus, exploring volatility for product separation in reactive distillation would be appropriate and efficient. The reactants species should be relatively heavier than the
product to keep the reactant into the column. However, the distillate purity may depend on the conversion in the reactive zone. The experimental
back-up of this will be explored in subsequent publication.
One significant observation is the fall in the
dynamic liquid hold-up with increasing mvc of the
separating mixtures fed into the column when
highly dense tracer material was introduced. This is
conspicuous in table 2. With the introduction of
tracer solution with density 15g L–1, the dynamic
liquid hold-up rose from 0.0456 m3 m–3 to 0.0466
m3 m–3, and then fall to 0.0418 m3 m–3 and 0.0363
m3 m–3 for separating mixtures with 0.1, 0.2, 0.4 and
0.6 mole fractions aqueous methanol, respectively.
This trend was consistent irrespective of the
sampling location in the column and the boil-up
rate.
Conclusion
Dynamic liquid hold-up variation with tracer
density in a packed distillation column has been
evaluated. A significant change was found when the
tracer density was increased by 50 percent for 0.2
mole fraction aqueous methanol mixture, and the
effect dropped with increased mvc in the mixture.
The experimental data presented and analyzed,
demonstrated that the hydrodynamic behavior of
packed distillation column could effectively translate the reactive distillation process in packed column, which favors systems with high specific reaction rates.
List of symbols
a
H
a
t
x
�
�
T
–
–
–
–
–
–
–
–
volumetric area, m2 m–3
dynamic liquid hold-up, m3 m–3
heat flow rate, kJ s–1
time, min
mole fraction
mass concentration, mg L–1
tracer density, g L–1
volume fraction, mL L–1
References
1. Doherty, M. F., Maloney M. F., Conceptual Design of Distillation Systems. McGrawHill. New York, 2001.
2. Kaymak, D. B., Luyben, W., L., Ind. Eng. Chem. Res.,
43 (1) (2004) 425.
3. Taiwo, E. A., Investigation of the effects of System Variables on the Efficiency of Distillation Packed Column.
MSc. Thesis. Chemical Engineering Department, Obafemi
Awolowo University, Ile-Ife. Nigeria., 1993., pp. 279.
4 Taiwo, E. A., Fasesan, S. O., AJS T– DAC., 2002, (in
press).
5. Trasi, P., Khang S., Ind. Eng. Chem. Fundam. 18(3),
(1979) 256.
6 Taiwo, E. A., Fasesan S. O., Ind. Eng. Chem. Res 43(1),
(2004) 197.
7. Baron, G., Wajc S., Larie R., Chem. Eng. Sci., 35 (1980)
859.
8. Fasesan, S. O., Taiwo, E. A., Ind. Eng. Chem. Res, 40(1),
(2001) 314.
9. Subawalla, H., Gonzalex, J. C., Seibert, A. F., Fair, J. R.,
Ind. Eng. Chem. Res 36 (1997) 3821.
�