Kinetic Characterisation of Catalysts for Methanol Synthesis
 Stanislaw Ledakowicz
2000, Chemical and Process Engineering
Sign up for access to the world's latest research
Abstract
The results of activity studies of four catalysts in methanol synthesis have been presented. A standard industrial catalyst TMC-3/1 was compared with two methanol catalysts promoted by the addition of magnesium and one promoted by zirconium. The kinetic analysis of the experimental results shows that the Cu/Zn/Al/Mg/1 catalyst was the least active. Although TMC-3/1 and Cu/Zn/Al/Mg/2 catalysts were characterised by a higher activity, the most active catalyst system was Cu/Zn/Al/Zr. The activity calculated for zirconium doped catalyst under operating conditions was approximately 30% higher that of TMC-3/1catalyst. The experimental data were used to identify the rate equations of two types -one purely empirical power rate equation and the other one -the Vanden Bussche & Froment kinetic model of methanol synthesis. The Cu/ZnO/Al 2 O 3 catalyst modified with zirconium has the highest application potential in methanol synthesis.
Figures (6)


INTRODUCTION
Methanol is synthesised in two heterogeneous chemical reactions (1) and (2) from a mixture of carbon monoxide and carbon dioxide with hydrogen according to the following reactions: CO + 2H 2 = CH 3 OH (1) CO 2 + 3H 2 = CH 3 OH + H 2 O
CO + H 2 O = CO 2 + H 2
Methanol was produced for the first time in the industry by the BASF Company in 1923. The methanol synthesis catalyst used 100 years ago by Pier was based on ZnO-Cr 2 O 3 and required extremely vigorous conditions -pressures ranging up to 30 MPa and temperatures up to 400°C (DR Patent, 1923). In order to reduce the costs of process the ICI group developed in the 1960s the low pressure methanol synthesis using a sulphur-free synthesis gas on Cu/ZnO catalyst (Lange, 2001). However, the copper/zinc catalyst was discovered and patented more than 10 years earlier by Błasiak (Patent PRL, 1947) and then successfully used in the 1950s in Chemical Works in Oświęcim in methanol synthesis (Kotowski, 1963). The advantage of Cu/ZnO/Al 2 O 3 catalyst is the fact that synthesis of methanol takes place at the temperature of 493-553 K and pressure below 10MPa (Skrzypek et al., 1994).
Nowadays Cu/ZnO/Al 2 O 3 catalyst is commonly used in chemical industry to produce methanol. The catalyst is produced in the shape of Raschig rings or tablets. The company Johnson Matthey produces a catalyst called KATALCO which is the standard of Cu/ZnO/Al 2 O 3. A new generation of catalysts also based on the copper catalyst is named APICO. Haldor Topsoe company produces CuO/ZnO/Al 2 O 3 called MK-121 where the composition of the catalyst is: CuO (wt%) -55; ZnO (wt%) 21-25; Al 2 O 3 (wt%) 8-10; catalyst diameter: 6 x 4 mm. The manufacturer claims that the catalyst is used in the production of methanol from carbon monoxide or dioxide. INS Puławy and ZA Tarnów S.A. manufacture TMC-3/1 a catalyst with the composition of Cu (wt%) -50, ZnO (wt%)-25, Al 2 O 3 (wt%)-10%. It has the form of tablets with the dimensions of 3.5-4.5 mm. AlVIGO produces Cu/ZnO/Al 2 O 3 called CHM-Y. The catalyst contains Cu (wt%) -53; ZnO (wt%)-26, Al 2 O 3 (wt%)-5.5%. The density of the catalyst is 1.3 g/cm 3 and the grain size is 5×5 or 6×4 mm. The above mentioned catalysts are available on the market. The catalyst TMC-3/1 was chosen as a standard one in our experiment.
Although the ternary Cu/ZnO/Al 2 O 3 catalyst is still used in industrial methanol synthesis due to its high activity and durability an interest to develop better catalyst has steadily been observed. In order to improve the efficiency of the process, modified catalysts are examined. The Cu/ZnO/ZrO 2 catalyst and the addition of B, Ga, In, Gd, Y, Mn and Mg oxides were studied by Skrzypek et al. (2006). The authors discussed the influence of catalyst modifications on the activity of methanol synthesis, dispersion of copper, surface composition of the catalyst and the stability of catalysts. Sanches et al. (2012) studied Cu/ZnO catalyst with zirconium and yttrium as promoters. The promoter effects were evaluated -the yttrium promoter of Cu/ZnO catalyst did not provide textural or structural advantages while the zirconium led to both greater Cu dispersion and structural changes in the Cu lattice. Gao et al. (2013) The modified catalyst showed a higher performance than CuO/ZnO/Al 2 O 3 . Poels and Brands (2000) discussed the importance of SiO 2 support on Cu/ZnO catalyst. The authors stated that promoters effected the catalyst precursor reduction in high temperatures and as a result, the methanol synthesis activity increased. Kang et al. (2009) discussed the influence of Ga promoting in Cu/ZnO/Al 2 O 3 . The modified catalyst exhibited higher reducibility and appropriate acidity which affected the performance of methanol synthesis in the high activity. Toyir et al. (2001) carried out research on Cu/ZnO activity, selectivity and stability for catalyst with Ga and SiO 2 promoter as a catalyst support. Property modification for copper particles is related to the presence of very small Ga 2 O 3 particles on the surface. Guo et al. (2011) studied Cu catalysts supported on zirconia with various La loadings. The presence of La favors production of methanol and the optimum catalytic activity is obtained when the amount of La doping is 5% of the total amount of Cu and Zr. Recently Wang et al. (2013) incorporated a small amount of cupric silicate into a copper based catalyst and showed that the catalyst modified with 1% CuSiO 3 exhibits the highest activity.
The aim of this paper was to compare activity of three new catalyst formulations with the standard methanol synthesis catalyst TMC-3/1 commonly used in industry. Two of the new catalyst were promoted by the addition of magnesium and one promoted with zirconium. The basis of comparison was the kinetic analysis of experimental data collected in a lab-scale differential fixed bed reactor. The experimental data were utilised to identify the rate equations of two types -the first one was a purely empirical power law rate equation and the other one Vanden Bussche and Froment (1996) kinetic model of methanol synthesis.
EXPERIMENTAL
Reactor set-up
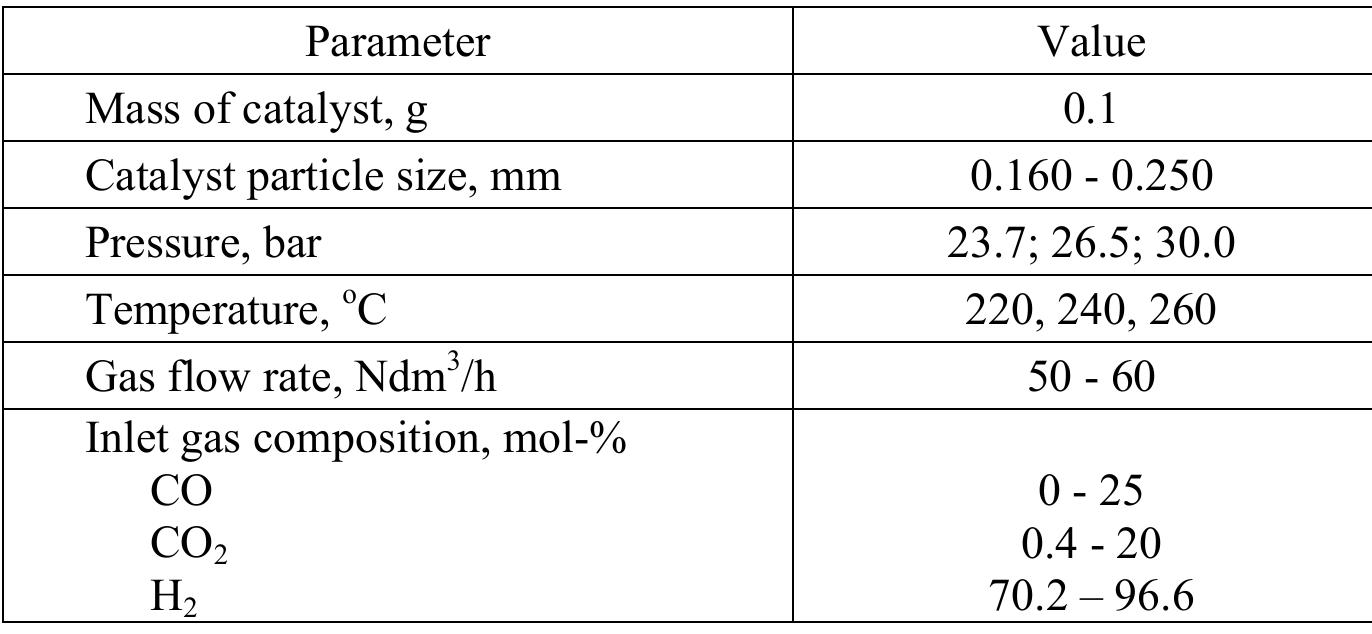
The activity tests were performed in a differential fixed-bed reactor. Hydrogen, carbon monoxide and carbon dioxide are supplied from gas cylinders through Brooks mass flow meters. The pressure of each compound was controlled by Brooks regulators. All components were mixed and heated to the reaction temperature and introduced into the reactor. Experimental conditions are listed in Table 1. Diameter of reactor tube was 7 mm and total height 152 mm, while the catalyst loading was only 0.1 g. The outlet gas from the reactor was flowing through the heating line directly to the gas chromatograph. The concentration of methanol and water vapor were measured by the gas chromatograph PU 4500 using TCD detector.
Table 1
The experimental conditions of activity measurements
Catalysts
The activity studies were carried out for four methanol synthesis catalysts. The standard TMC-3/1 was compared with two catalysts promoted by addition of magnesium and one promoted by zirconium. Two catalysts promoted by magnesium were different in chemical composition.
The preparation of the Cu/ZnO catalysts was a three-step process:
• synthesis of a hydroxycarbonate precursor by coprecipitation method,
• thermal decomposition of the precursor to the oxide form (calcination),
• reduction of the copper oxide to the final active catalyst form.
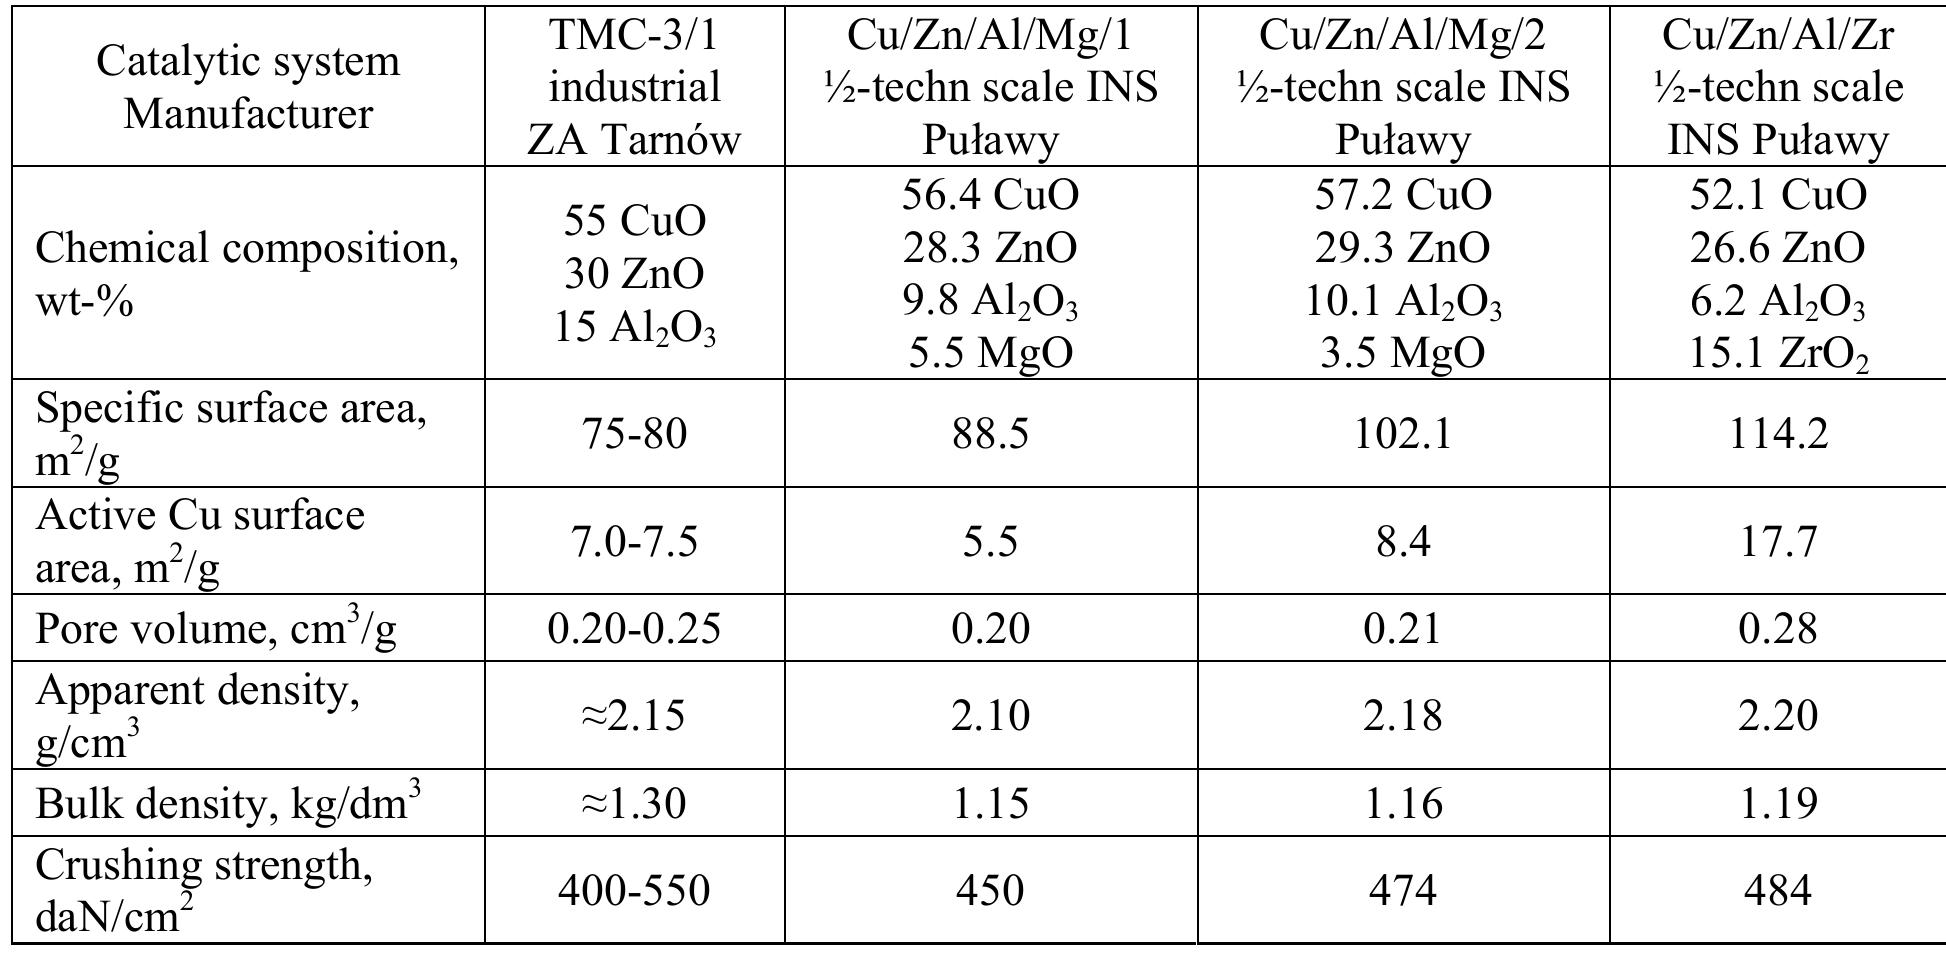
The catalyst precursors were prepared by the coprecipitation method. Aqueous solutions of copper, zinc and aluminum nitrates (POCh Gliwice, Poland), a solution of zirconyl or magnesium nitrate (Sigma Aldrich) and a solution of sodium carbonate were used. The reaction temperature was kept in the given range and the pH value of the resulting suspension was maintained in the range 7-7.4. Under these conditions a precursor deposited that was aged during intensive stirring for 1 hour. In the next step sodium and nitrate ions were thoroughly removed by washing out with redistilled water. Decantation of the material was followed by drying at 105°C for 20 h. The catalyst precursors were calcined at 300 °C and reduced in 6% H 2 /He mixture at 250 °C. The characteristics of the four catalytic systems are given in Table 2.
Table 2
Catalyst characteristics
The chemical compositions of precursors were determined by means of ICP-OES using Varian 720-ES spectrometer. The specific surface area of the samples and the pore volume were determined by measuring nitrogen adsorption at the temperature of liquid nitrogen and p/po = 0.05-0.3 using a Micromeritics ASAP® 2050 Xtended Pressure sorption analyser. For reduced catalyst precursors the measurements of active copper surface area were carried out using chemisorption of N 2 O -impulse technique. More details of the catalyst preparation and characterisation can be found elsewhere (Kowalik et al., 2013).
RESULTS AND DISCUSSION
The experimental results obtained in this study showed that the tested catalysts have different activity in the hydrogenation reaction of carbon oxides to methanol. To compare the activity of the catalyst more precisely the experimental data were correlated with a simple power law rate equation for methanol formation in the following form:
To develop Equation (4) the following assumptions were made:
1. Due to very small conversion, the synthesis of methanol can be considered as an irreversible reaction and the inhibition by reaction products was negligible. 2. Based on literature (Chinchen et al.,1987a;Rozovskii, 1989 andSzarawara andReychman, 1980) methanol is produced in the direct hydrogenation of carbon dioxide.
The Arrhenius parameter as well as the reaction orders with respect to reagent concentrations were estimated using non-linear least squares method by minimising the objective function of the following form
is the methanol formation rate determined experimentally and calculated from Eq. (4), respectively, and M is the number of experimental data obtained at different temperatures and reagent partial pressures.
Taking into account the experimental conditions described in the previous section, it was also assumed that the rate data were obtained in a differential reactor, in which the reagent concentration does not change much inside the reactor, thus the inlet values of partial pressures were used in the rate Equation (4).
As a result of the calculation, it was found that the rate Equation (4) fits a set of experimental data well. Parity plot for methanol synthesis rate is presented in Fig. 1. The agreement is good for all four catalysts taking into account 25% relative error. The optimum values of model parameters are given in Table 3. Fig. 1. Parity plot for the rate of methanol synthesis for the four catalysts studied As can be seen from Table 3, the optimum values of the kinetic parameters for different catalysts differ significantly from each other. The reaction orders in respect to both CO 2 and H 2 are significantly higher for the catalysts modified with magnesium or zirconium promoters than those for typical Cu/ZnO/Al 2 O 3 catalyst (TMC-3/1). That means a bigger impact of the total pressure on the rate of methanol synthesis. For all the catalysts the optimum value of the parameter m was less than one, suggesting that carbon dioxide has an inhibitory effect on the rate of reaction. The inhibition by CO 2 is not always taken into account in the Langmuir-Hinshelwood type of rate models developed from the detailed reaction mechanism, whereas the inhibition of methanol synthesis by hydrogen usually is considered. Higher values of the parameter m obtained for modified catalysts could also mean a smaller impact of this phenomenon on the reaction rate. It needs to be remembered that this type of observation should be treated with caution due to the purely empirical nature of the rate equation used.
Figure 1
Table 3
The values for kinetic parameters in the methanol rate equation
The values of apparent activation energy for one of the Cu/Zn/Al 2 O 3 catalyst modified with magnesium and the one with Zr were 56.4 and 60.8 kJ/mol, respectively, compared to 43 kJ/mol obtained for TMC-3/1 and Cu/Zn/Mg/Al 2 O 3 catalysts.
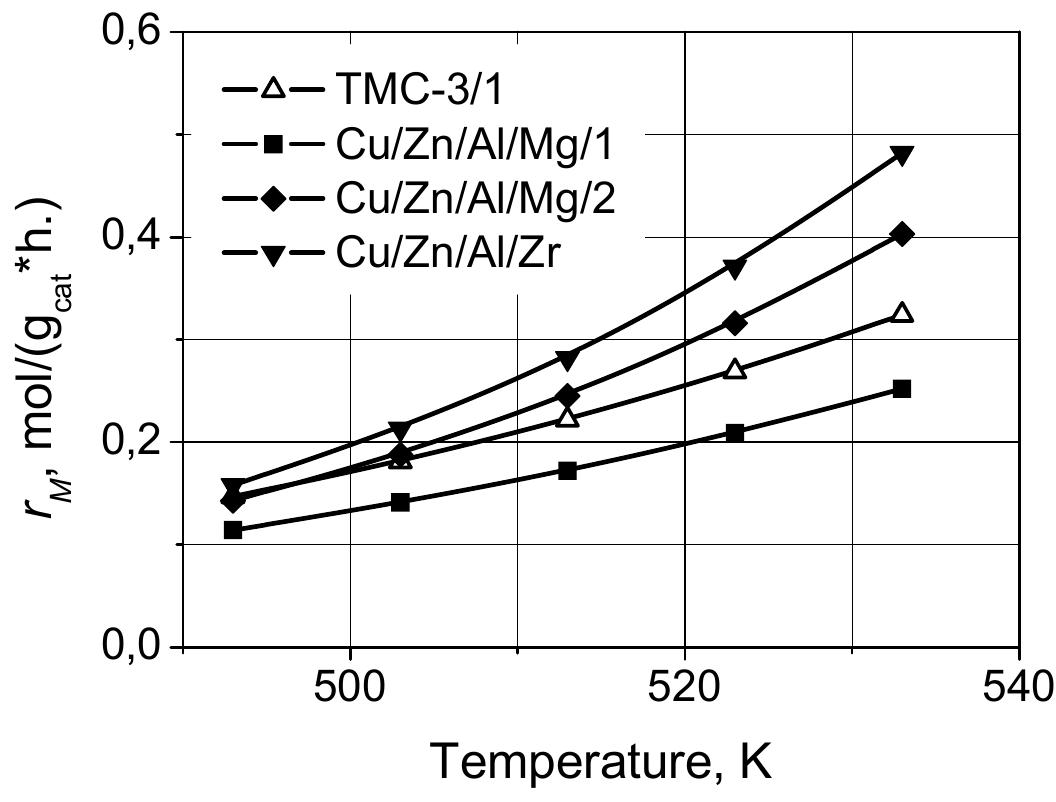
In summary, the results show that the proposed rate Equation (4) describes the influence of process conditions very well, so it can be used to compare the activity of the four investigated catalysts at selected temperatures, pressures and gas composition in the range of their values studied in this work. Figure 2 shows the change in the formation rate of methanol as a function of temperature for four studied catalysts calculated at one set of process conditions. It is clear from the figure that the Cu/ZnO/Al 2 O 3 catalysts promoted with Mg and Zr are more active in the reaction of hydrogenation of CO 2 than the unmodified catalyst, although one of the catalysts promoted with magnesium Cu/Zn/Al/Mg-1 was less active. The high activity of the two promoted catalysts is particularly evident at 533 K, which is the typical temperature for the industrial methanol synthesis process. At this temperature the rate of methanol synthesis on the Cu/ZnO/Al 2 O 3 /Zr catalyst was 1.5 times higher than that for the TMC-3/1 catalyst. Taking into account the characteristics of the catalysts presented in Table 2, the highest activity of the Cu/ZnO/Al 2 O 3 /Zr catalyst corresponds both to specific surface area of the catalyst and to the active surface of metallic copper. It is worth noticing that activity of the other investigated catalyst can be also correlated with their specific surface areas.
Figure 2
Comparison of activity of different catalysts at various temperatures (30 bar, 4 mol-% of CO 2 , 78 mol-% of H 2 )
The kinetic analysis based on the Eq. (4) was conducted with a purely empirical approach and the effect of methanol and water concentration on the process rate was not taken into account. However, water content in the reaction mixture was determined so it would be possible to verify the experimental data using a more sophisticated rate equation that could be applied for modeling outside the experimental conditions applied.
Among the kinetic models for low-pressure methanol synthesis process in the gas phase a model developed by Vanden Bussche and Froment (1996) seems to be the most suitable. The rate equation for methanol synthesis and water gas shift reactions were derived from the reaction mechanism assuming that CO 2 is the main source of carbon in methanol synthesis. Both reactions proceed at the same active centers in the centre of copper phase of the catalyst. The role of ZnO is limited to structural promotion.
In the next stage of the analysis the possibility of using the Vanden Bussche and Froment model (VBF) to describe the rate of methanol synthesis on the TMC-3/1 and Cu/ZnO/Al 2 O 3 /Zr catalysts was checked. Figure 3a shows the comparison of experimentally determined formation rates of methanol with the rates calculated on the basis of the VBF model using the kinetic parameters given by the authors (Vanden Bussche and Froment, 1996) and presented in Table 4. As can be seen from the figure, the model predictions are greater than the values obtained experimentally for the TMC-3/1 catalyst and much lower in the case of the catalyst promoted with zirconium. However, in both cases there is a linear correlation between the calculated and experimental values. This observation suggests the possibility of using the VBF model to describe the experimental data obtained in this work only by adjusting the value of the parameter k d , which reflects differences in the activity of various catalysts.
Figure 3
Parity plot for the rate of methanol synthesis for Vanden Bussche and Froment kinetic model (a) -calculated with original value of the parameter k d ; (b) -calculated for modified k d values
Table 4
The adjusted values of the Arrhenius parameters are given in Table 4, and Fig. 4 shows the changes of the parameter k d with temperature. This Arrhenius plot shows clearly the differences in the performance of the three compared catalysts and confirms very high activity of the catalyst promoted by zirconium. It is worth noting that apparent activation energy for all the three catalysts has a negative value which contradicts the physical meaning of this parameter. In fact, the parameter k d is the product of reaction rate constant of the rate determining step in the reaction scheme for methanol synthesis assumed by Vanden Bussche and Froment and three equilibrium constants of the other elementary steps of the assumed mechanism. Thus the sum of activation energy and enthalpies of adsorption or reaction may result in a negative value of this parameter. Nevertheless, the Vanden Bussche and Froment kinetic model is very often used for describing the experimental data both from laboratory and industry scale (Shahrokhi and Baghmisheh, 2005) and modelling of methanol synthesis (Petera et al., 2013).
Figure 4
Arrhenius plot for the rate constants k d in the VBF model for different catalysts
Table 4 .