Chemosphere 74 (2008) 70–77
Contents lists available at ScienceDirect
Chemosphere
j o u r n a l h o m e p a g e : w w w . e l s e v i e r. c o m / l o c a t e / ch e m o s p h e r e
Effects of spinosad and Bacillus thuringiensis israelensis on a natural population of
Daphnia pulex in field microcosms
C. Duchet a,b, M. Larroque c, Th. Caquet b, E. Franquet d, C. Lagneau a, L. Lagadic b,*
Entente Interdépartementale de Démoustication du Littoral Méditerranéen, 165 Avenue Paul-Rimbaud, F-34184 Montpellier, France
INRA, UMR985 Écologie et Santé des Écosystèmes, Équipe Écotoxicologie et Qualité des Milieux Aquatiques, 65 rue de Saint Brieuc, F-35042 Rennes, France
c
Laboratoire de Chimie Analytique, UMR Qualisud, Faculté de Pharmacie – Université Montpellier I, 15 Avenue Charles-Flahault, BP14491, F-34093 Montpellier Cedex 5, France
d
Université Paul Cézanne, Institut Méditerranéen d’Écologie et de Paléoécologie, Faculté des Sciences et Techniques Saint Jérôme, C31, F-13397 Marseille, France
a
b
a r t i c l e
i n f o
Article history:
Received 4 April 2008
Received in revised form 12 August 2008
Accepted 4 September 2008
Available online 1 November 2008
Keywords:
Biopesticide
In situ microcosm
Dissipation kinetics
Mosquito control
Ecological risk assessment
a b s t r a c t
Spinosad, a candidate biological larvicide for mosquito control, was evaluated for its effects on a field population of Daphnia pulex, using Bacillus thuringiensis serovar israelensis (Bti) as a reference larvicide. Microcosms (125 L enclosures) were placed in a shallow temporary oligohaline marsh where D. pulex was present.
Three concentrations of spinosad (8, 17 and 33 lg L¡1) and two concentrations of Bti (0.16 and 0.50 lL L¡1)
were applied (5 replicates per concentration, including the controls). Effects of larvicides on D. pulex were
evaluated after 2, 4, 7, 14 and 21 d of exposure, through measurements of abundance and individual size. Dissipation of spinosad from the water phase was rapid. Four days after treatment, residue concentration represented 11.8%, 3.9% and 12.7% of the initial exposure level for the nominal concentrations of 8, 17 and 33 lg L¡1,
respectively. Spinosyns A and D dissipated at similar rates. Analysis of abundance and size structure of the
D. pulex population showed an impact of spinosad. Both survival and size structure were affected. However,
at the lowest concentration (8 lg L¡1), population recovered after the first week. In microcosms treated with
Bti, the abundance of D. pulex was not affected but the size structure of the population changed after 21 d. As
compared to laboratory tests, the use of in situ microcosms improved the environmental risk assessment of
larvicides, taking into account the influence of environmental factors (e.g., temperature, light, salinity) and
intrinsic capacity of recovery of D. pulex under field conditions.
© 2008 Elsevier Ltd. All rights reserved.
1. Introduction
Chemicals used for mosquito control may be applied as larvicides or adulticides. Larvicides are introduced into aquatic ecosystems where mosquito larvae develop (marshes, ponds, sanitation
devices) whereas adulticides are sprayed into the atmosphere to
kill flying mosquitoes. The use of larvicides optimizes the efficiency of chemical control because mosquito larvae cannot escape
from the treated water. However, treatment of aquatic ecosystems
raises the question of possible effects of larvicides on non-target
aquatic species. To be used in the European Union, larvicides must
fulfil the criteria of the “Biocides Directive” 98/8/EC, ensuring an
adequate level of protection for humans and the environment. As
a consequence, many active substances used to control mosquito
larvae have been withdrawn from the market. For example, the
organophosphorus insecticide temephos was banned in 2007 in
Europe. The number of available larvicides is therefore decreasing, and there is an urgent need to identify environment-friendly
compounds.
*
Corresponding author. Tel.: +33 223 485 237; fax: +33 223 485 440.
E-mail address: Laurent.Lagadic@rennes.inra.fr (L. Lagadic).
0045-6535/$ - see front matter © 2008 Elsevier Ltd. All rights reserved.
doi:10.1016/j.chemosphere.2008.09.024
In such a context, a number of natural products have been
developed as insecticides, some with specificity to certain insect
taxa. For example, pyrethrum and neem are well established
commercially, and pesticides based on plant essential oils have
recently entered the marketplace (Isman, 2006). Another bioinsecticide, the bacterial larvicide Bacillus thuringiensis serovar israelensis (Bti), is well-known for its selectivity for Nematocera dipterans.
Moreover, the highest sensitivity is observed within a restricted
number of families, namely Culicidae (mosquitoes), Simuliidae
(black flies) and Chironomidae (non-biting midges) (Boisvert and
Boisvert, 2000). This larvicide is therefore widely used for mosquito control all over the world (Boisvert and Lacoursière, 2004).
Bti is a positive Gram (Bacillaceae) and endospore-forming aerobic bacterium. During the spore-forming stage of its life-cycle, Bti
produces a protein crystal. When ingested by mosquito larvae, the
crystal is dissolved, due to the alkaline environment of insect gut,
and converted into toxic proteins (Ali, 1980; Garcia et al., 1981;
Merritt et al., 1989; He and Ong, 2000). The toxins bind to specific
receptors of the epithelial cell wall, causing membrane perforations of the gut, leaking of gut internal fluids, and eventually death
(Van Frankenhuyzen, 1993).
A new biological insecticide that seems promising for
mosquito control is spinosad (DowElanco, Indianapolis, IN, USA).
�C. Duchet et al. / Chemosphere 74 (2008) 70–77
Spinosad is a mixture of spinosyns A and D known as fermentation
products of a soil bacterium (Saccharopolyspora spinosa, Actinomycetes) (Crouse et al., 2001). Spinosad acts as a contact and
stomach poison (DowElanco, 1996; Salgado, 1998). It persistently stimulates the insect central nervous system by interacting with nicotinic acetylcholine receptors through a mechanism
distinct from those of other nicotinic agonists (Watson, 2001).
Up to now, it has been used against lepidopteran, dipteran, and
thysanopteran pests, and it is used for integrated pest management (IPM) programmes in vegetables and ornamentals (Pineda
et al., 2006). Spinosad is also a potential candidate for mosquito
control (Cetin et al., 2005). Although it is considered as a selective insecticide for insect pest species (Miles and Dutton, 2000),
some studies indicate that it may be toxic to beneficial species
(Nasreen et al., 2000; Tillman and Mulrooney, 2000; Consoli et
al., 2001), and previous studies demonstrated effects of spinosad on cohort dynamics of the zooplanktonic crustacean Daphnia
pulex (Crustacea, Cladocera) in laboratory conditions (Stark and
Vargas, 2003).
Ecological risk assessment is usually based on toxicity studies
conducted on single species in laboratory. Although these tests
may allow mortality, growth, reproduction and behaviour of
individuals to be estimated, they can rarely be used to assess
environmental hazards at higher levels of biological organization. As natural ecosystems are more complex and variable than
laboratory standardised systems (Burnett and Liss, 1990; Rand
and Clark, 2000), laboratory toxicity bioassays should be complemented with higher tier assessment in field conditions. In situ
microcosms or enclosures take into account physicochemical
and biological natural variability which is not possible with single-species laboratory toxicity tests designed to achieve homogenous test conditions (van den Brink et al., 2005). The ecological
risk of insecticides in the field following a treatment depends
on their environmental fate and on the ability of non-target
species to recover their pre-treatment population size (Medina
et al., 2004; Caquet et al., 2007).
There is a large amount of data available on the effects of Bti
on non-target species (Boisvert and Boisvert, 2000; Boisvert and
Lacoursière, 2004), but few studies on effects in the field, especially in wetlands, have been published (Purcell, 1981; Hershey
et al., 1998). In the case of spinosad, the published studies were
carried out in greenhouses (Miles, 2003; Holt et al., 2006), and
none were performed in natural aquatic ecosystems.
The present study was therefore undertaken to assess the
impact of spinosad on a field population of Daphnia pulex, with
Bti as the reference compound. In situ microcosms were used to
enclose parts of this natural population, in order to control exposure to the larvicides. Changes in spinosyns A and D concentrations
in water were monitored, and D. pulex population-level effects
were concomitantly assessed by analysing abundance and sizestructure for increasing levels of exposure. Results are discussed
with regard to the interest of using in situ microcosms in the ecological risk assessment of mosquito larvicides.
2. Materials and methods
2.1. Microcosms
The microcosms, 125 L cube-shaped plexiglas enclosures
(50 £ 50 £ 50 cm), were placed in a shallow temporary oligohaline marsh located in Le Tour du Parc (Morbihan, Brittany, France;
47°319250N–02°389280O). They were pushed into the sediment
surface (5–10 cm deep) to avoid leaking of contaminated water
from the enclosures where the insecticides were applied. Thirty
units were used in this study. Microcosms were allowed to stabilize for 24 h before larvicide application.
71
2.2. Experimental design
Ten microcosms were treated with Bti (Vectobac® 12AS; Valent
Biosciences, Libertyville, IL, USA), fifteen microcosms were treated
with spinosad (Spinosad 120SC; DowElanco, Indianapolis, IN,
USA), and five microcosms remained as untreated controls. Treatments were randomly assigned to the microcosms using a random
number table (R for Windows Version 2.7.0). Vectobac® 12AS was
applied at 0.8 and 2.5 L ha¡1 (nominal concentration for 30 cm
water depth: 0.16 and 0.50 lL L¡1, respectively), each concentration
being applied to 5 enclosures (replicates). These concentrations
correspond to the minimum recommended and the maximum
registered rates for terrestrial and aerial treatments, respectively
(ACTA, 2007). Spinosad was applied as a suspension concentrate
formulation containing 120 g active substance per litre at 25, 50
and 100 g ha¡1 (nominal concentration for 30 cm water depth: 8,
17 and 33 lg L¡1, respectively). The treatment rates were chosen in
order to encompass the rate of 50 g ha¡1 which would be the mean
presumed recommended rate for field application. Five replicates
were used for each spinosad concentration.
The treatments were performed on May 30, 2006. Each
insecticide was diluted in tap water before spraying at the water
surface using a portable spraying apparatus. To prevent cross-contamination, the treated microcosms were covered with a PVC plate
with a hole in its centre to allow the spray to enter. Additionally,
adjacent microcosms were covered with PVC plates while spraying. Monitoring started just before the treatments (day 0), and was
carried on 2, 4, 7, 14 and 21 d after insecticide spraying.
2.3. Water quality parameters
At each sampling date, the water temperature, dissolved oxygen,
salinity, and pH were measured in every enclosure at ca. 5 cm below
the water surface, using portable probe apparatus (Wissenschaftlich-Technische-Werkstätten – WTW, Champagne au Mont d’Or,
France). Water level was measured in every microcosm using a
graduated aluminium gauge. Measurements were always performed between 10:00 and 12:00 AM to ensure data consistency
in the event of diurnal effects. Suspended Matter (SM) concentration was determined in 250 mL water samples filtered through
pre-weighed oven-dried Whatman GF/C fiberglass filters (2 h at
500 °C; 1.2-lm mesh size; Whatman International, Maidstone, UK)
and weighed according to the AFNOR (1996) method after 48 h at
105 °C. Chlorophyll a levels were determined in 250 mL water samples filtered through Whatman GF/C fiberglass filters. Pigments
were extracted overnight using 5 mL of an acetone/distilled water
(90/10, v/v) mixture. Chlorophyll a was quantified spectrophotometrically (UVK-LAB Technologies, Trappes, France) according to
Lorenzen (1967).
2.4. Spinosad residue analysis
To determine spinosad concentrations in treated microcosms,
water samples were collected 15 min after treatment and at each
subsequent sampling date in 3 randomly chosen treated microcosms per concentration. Samples were taken at mid-depth, using
250 mL glass amber bottles. They were stored at -20 °C until analysis. From each sample, 100 mL were acidified with 6 mL of HCl
(pH 2). Spinosad was extracted three times with 50 mL dichloromethane. The pooled extracts were evaporated to dryness at 30 °C
under a nitrogen flow, and residues were resuspended in 1 mL acetonitrile. Samples of 50 lL were then injected into a HPLC device
(Thermoquest P4000) equipped with a UV detector set at 243 nm,
and an Eclipse XDB C8 column (150 £ 4.6 mm, 5 lm, Agilent Technologies, Santa Clara, CA, USA). A mobile phase consisting of acetonitrile and ammonium formate buffer at 150 mg L¡1 (90:10, v/v)
�C. Duchet et al. / Chemosphere 74 (2008) 70–77
72
was delivered at 0.8 mL min¡1 flow rate. Calibration curves were
established using stock solutions of spinosyns A and D (150 and
165 mg L¡1, respectively) by successive dilutions in acetonitrile in
order to obtain concentrations ranging from 75 to 1500 ng mL¡1
and from 82.5 to 1650 ng mL¡1 for spinosyns A and D, respectively.
The response was linear in the range of concentrations tested (data
not shown). Under these conditions, the limit of quantification was
0.2 lg L¡1.
2.5. Sampling procedures and endpoints in daphnids
Daphnia pulex samples were taken using home-made PVC
tube samplers (70 cm length, 6 cm inner diameter) equipped
with a 2 £ 4 mm mesh screen-covered one-way valve at the bottom. Water column samples were collected from twenty regularly spaced locations within each enclosure in order to reduce
the effects of plankton patchiness (Stephenson et al., 1984;
SETAC, 1991). The resulting composite sample (mean ± S.E. volume = 120 ± 26 mL, depending on the water level in the microcosm) was filtered through 30-lm mesh nylon net. The retained
organisms (daphnids and some other pelagic invertebrates) were
transferred to a 500 mL plastic vial and preserved using neutral
aqueous formaldehyde/sucrose (4%, v/v; 40 g L¡1) containing
250 lg L¡1 Bengal pink dye.
All the D. pulex found in the samples were identified using the
taxonomic key proposed by Amoros (1984). They were counted
using a stereomicroscope (Stemi SV 6, Zeiss, Thornwood, NY, USA)
and their body length was measured from the eye to base of the
tail spine (Boronat and Miracle, 1997). Abundances of D. pulex
were expressed as the number of individuals per litre based on
the volume of the composite samples collected in the enclosures.
D. pulex size structure was obtained by sorting body length data
into 5 size-classes according to Gurney et al. (1990) and McCauley
et al. (1990): class 1, (<0.6 mm), for neonates; class 2, (0.6–1 mm),
for daphnids between 1 and 2 d old; class 3, (1–1.4 mm) for daphnids between 2 and 4 d old; class 4, (1.4–1.7 mm), for daphnids
between 4 and 6 d old; class 5, (>1.7 mm), for daphnids older than
6 d, corresponding to the mean age at first reproduction.
Invertebrates collected while D. pulex were being sampled were
also identified and counted, using the taxonomic key proposed by
Amoros (1984) for Cladocera and the taxonomic key proposed by
Tachet et al. (2000) for macroinvertebrates.
2.6. Data analysis
One-way Repeated Measures-ANOVA (RM-ANOVA) followed
by Duncan’s post hoc test were used to compare the data obtained
from physicochemical, chlorophyll a and SM measurements, and
for the abundance of D. pulex and other invertebrates. Abundance
data were log-transformed before analysis. Statistical comparisons were performed over the whole study period to determine
overall trends among treatments. When RM-ANOVA indicated a
significant effect of treatments on the different parameters, data
were further analyzed for each sampling date using one-way
ANOVA followed by Duncan’s post hoc test to detect when differences between treated and control microcosms occurred. For body
length, Kolmogorov-Smirnov two-sample test was performed to
compare central tendency of Daphnia size as well as the general
shapes of distributions. This test was performed when the abundance of daphnids per treatment was higher than 10 individuals.
All RM- and one-way ANOVA and Kolmogorov-Smirnov two-sample test were performed using Statistica® for Windows Version 6.0
(Statsoft, Tulsa, OK, USA). Differences were considered significant
at a = 0.05 for all tests.
3. Results
3.1. Physicochemical and biological parameters
The mean values (±SE) of the parameters monitored over the
whole study period in the different types of microcosms are given
in Table 1. Water depth slightly decreased (from 38.2 cm at d 0
to 24.5 cm at d 21) over the course of the experiment, whereas
temperature fluctuated between 13 and 19 °C, salinity fluctuated
between 0.3 and 0.8 g L¡1, and pH ranged from 6.8 to 7.5. Greater
variations were observed for dissolved oxygen (1.5–11.30 mg L¡1),
Table 1
Mean values (±SE; n = 30) and results of the Duncan’s post hoc test for the physicochemical and biological parameters measured in the enclosures during the whole exposure
period
Parameter
Water depth
(cm)
Temperature
(°C)
Salinity
(g L¡1)
Dissolved O2
(mg L¡1)
pH
Chlorophyll a
(lg L¡1)
SM
(mg L¡1)
Chaoborus sp.
(nb indiv L¡1)
Cladocera
(nb indiv L¡1)
Culex sp.
(nb indiv L¡1)
Control
microcosms
32
(±1.0)
16.6
(±0.9)
0.6
(±0.1)
4.51
(±0.92)
7.1
(±0.1)
64
(±4)
37
(±4)
17
(±6.7)
50
(±21.7)
1
(±6)
Microcosms treated with:
Bti
Spinosad
0.16 (lL L¡1)
0.50 (lL L¡1)
8 (lg L¡1)
17 (lg L¡1)
33 (lg L¡1)
34
(±1.0)
16.6
(±0.9)
0.6
(±0.1)
4.68
(±0.93)
7.1
(±0.1)
54
(±10)
28
(±6)
13
(±3.6)
69
(±39.0)
0
34
(±1.0)
16.6
(±0.8)
0.6
(±0.1)
4.87
(±1.13)
7.1
(±0.1)
62
(±5)
34
(±8)
29
(±7.3)
49
(±20.5)
3
(±1.2) **
33
(±1.0)
16.5
(±0.9)
0.6
(±0.1)
5.71
(±1.10)*
7.2
(±0.1)
73
(±7)
33
(±6)
8
(± 4.0)
10
(± 6.5)
1
(± 1.0)
34
(±1.0)
16.5
(±0.9)
0.6
(±0.1)
6.40
(±1.30)**
7.2
(±0.1)*
85
(±12)
37
(±9)
3
(± 1.3)
6
(± 3.2)
0
33
(±0.9)
16.6
(±0.9)
0.6
(±0.1)
5.87
(±1.31)*
7.2
(±0.1)*
74
(±5)
35
(±6)
3
(±1.5)
3
(±1.4)
1
(±0.5)
Significant difference as compared to control (Duncan’s post hoc test): *, p < 0.05; **, p < 0.01.
�C. Duchet et al. / Chemosphere 74 (2008) 70–77
100
Spinosyn concentration (µg L-1)
Chlorophyll a concentration (µg L-1)
Spinosad, 8 µg L-1
Spinosad, 17 µg L-1
Spinosad, 33 µg L-1
Control
Bti, 0.16 µg L-1
Bti, 0.50 µg L-1
160
140
120
100
80
60
40
73
Full symbols: Spinosyn A, for spinosad nominal concentrations of
-1
( ) 8, ( ) 17 and ( ) 33 µg L
Open symbols: Spinosyn D, for spinosad nominal concentrations of
-1
( ) 8, ( ) 17 and ( ) 33 µg L
10
1
0.1
20
0
2
4
6
8
Time (days)
0
3
6
9
12
15
18
21
Time (days)
Fig. 1. Changes in mean values (±SE; n = 5) of chlorophyll a concentration in the
water of the control microcosms, the microcosms treated with Bti at 0.16 and
0.50 lL L¡1, and the microcosms treated with spinosad at 8, 17 and 33 lg L¡1.
SM concentration (10–80 mg L¡1), and chlorophyll a concentration
(16–130 lg L¡1). Concentrations of chlorophyll a increased in all
the microcosms during the first 14 d and decreased from 14 to 21 d
after treatments (Fig. 1).
Larvae of the phantom midge Chaoborus sp. (Diptera: Nematocera), larvae of the mosquito Culex sp. (Diptera: Nematocera), and
Chydorus sp., Pleuroxus sp., Ceriodaphnia sp., Simocephalus sp., and
Scapholeberis sp. (Crustacea: Cladocera) grouped as Cladocera in
Table 1, were collected. Considering the 30 microcosms, the general tendency is an increase of the abundance of these three taxa
over the course of the experiment (from 1 at d 0 to 42 indiv L¡1 at d
21 for Chaoborus sp. larvae, from 7 at d 0 to 153 indiv L¡1 at d 21 for
Cladocera, and from 0 at d 0 to 1 indiv L¡1 at d 21 for Culex sp. larvae). However Chaoborus sp. larvae and cladocera were less abundant in spinosad-treated microcosms, as compared to Bti-treated
and control enclosures (Table 1).
RM-ANOVA did not indicate significant differences in the
environmental parameters between treated and control microcosms from the day before the applications (d 0) to the end of the
study (d 21), except for pH (p = 0.011), dissolved oxygen (p = 0.004),
and Culex sp. abundance (p = 0.02). Water pH values were significantly different between the controls and the enclosures treated
with 17 and 33 lg L¡1 spinosad (Duncan’s post hoc test, p = 0.01 and
p = 0.013, respectively). Dissolved oxygen concentration was significantly different between the controls and the enclosures treated
with 8, 17 and 33 lg L¡1 spinosad (Duncan’s post hoc test, p = 0.034,
p = 0.002 and p = 0.019, respectively). Density of Culex sp. larvae
was significantly different between the controls and the enclosures treated with 0.16 lL L¡1 Bti (Duncan’s post-hoc test, p = 0.008).
When Duncan’s post hoc test showed significant differences
between the controls and spinosad-sprayed microcosms, mean pH
values, mean dissolved oxygen values and mean Culex sp. larvae
density values were always higher in the treated microcosms than
in the controls.
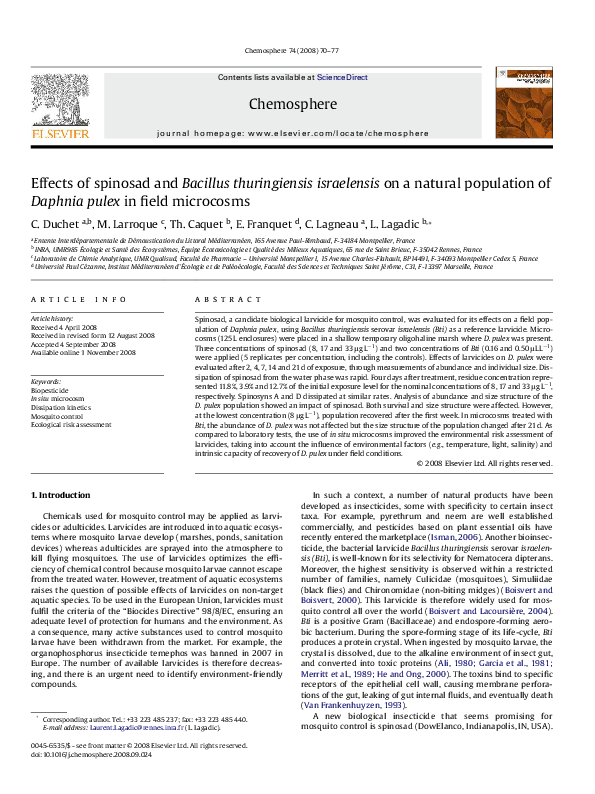
Fig. 2. Changes in spinosyn A (full symbols) and spinosyn D (open symbols) mean
concentrations (±SE; n = 3) measured in microcosm water for spinosad nominal
concentrations of 8, 17 and 33 lg L¡1. Day 0 corresponds to sampling immediately
(within the first 15 min) after spinosad application. A logarithmic scale has been
used for spinosyn concentration (Y-axis). The horizontal dotted line represents the
limit of quantification.
90.1 ± 2.1% of the total spinosad level, whatever the initial water
concentration. Two days after treatment, spinosad concentrations
dramatically decreased to 45.8%, 24.1% and 12.9% of the initial exposure levels, for the nominal concentrations of 8, 17 and 33 lg L¡1,
respectively. Spinosyn A concentration still represented on average 88.5 ± 2.7% of the insecticide initial concentration. Within the
first two days of exposure, the spinosyn A/spinosyn D ratio did not
vary (12.2 ± 0.6, 6.3 ± 0.5 and 9.0 ± 1.3, for the nominal concentrations of 8, 17 and 33 lg L¡1, respectively). From four days on, residue concentrations were at the limit of quantification for the 8
and 17 lg L¡1 treatments, representing 11.8% and 3.9% of the initial
exposure level, respectively. For the 33 lg L¡1 nominal concentration, the concentration of spinosad measured after two days was
12.7 ± 0.3% of the initial exposure level. At d 7, residue levels were
1000
Abundance (number of individuals per litre
0
800
600
400
*
*
200
***
0
0
3.2. Spinosad exposure concentrations
Analysis of spinosad residues in water showed that the exposure
concentrations were in the range of 45–118% of the nominal concentrations at the time of application (Fig. 2). Within the 15 min
following the treatment, spinosyn A concentration represented
Spinosad, 8 µg L-1
Spinosad, 17 µg L-1
Spinosad, 33 µg L-1
Control
Bti, 0.16 µg L-1
Bti, 0.50 µg L-1
***
3
*
***
6
9
12
***
15
18
21
Time (days)
Fig. 3. Changes in mean values (±SE; n = 5) of Daphnia pulex abundance (expressed
as the number of individuals per litre) in the control microcosms, the microcosms
treated with Bti at 0.16 and 0.50 lL L¡1, and the microcosms treated with spinosad
at 8, 17 and 33 lg L¡1. Significant difference from control (Duncan’s post hoc test): *:
p < 0.05; **: p < 0.01; ***: p < 0.001.
�C. Duchet et al. / Chemosphere 74 (2008) 70–77
74
Table 2
Daphnia pulex mean body size (±SE; n = 5) (mm) at each sampling date after larvicide application, and results of Kolmogorov–Smirnov two-sample test
Treatment
Sampling date
Control
Bti, 0.16 lL L
¡1
Bti, 0.50 lL L¡1
Spinosad, 8 lg L¡1
Spinosad, 17 lg L¡1
Spinosad, 33 lg L¡1
Day 0
Day 2
Day 4
Day 7
Day 14
Day 21
1.050
(±0.019)
1.022
(±0.014)
1.018
(±0.015)
1.040
(±0.016)
1.042
(±0.019)
1.048
(±0.016)
1.173
(±0.019)
1.178
(±0.020)
1.155
(±0.022)
1.092
(±0.034)**
1.042
(±0.086)
0.856
(±0.083)**
1.268
(±0.022)
1.309
(±0.029)
1.326
(±0.027)
1.388
(±0.034)*
1.297
(±0.063)
1.176
(±0.086) nt
1.006
(±0.031)
1.015
(±0.031)
0.992
(±0.037)
1.115
(±0.046)***
0.930
(±0.044)*
0.906
(±0.225) nt
1.064
(±0.037)
1.013
(±0.024)
0.973
(±0.033)
1.309
(±0.028)***
1.038
(±0.134)
0.739
(±0.064) nt
1.037
(±0.032)
1.430
(±0.042)***
1.303
(±0.032)***
1.267
(±0.039)***
1.334
(±0.057)***
0.994 nt
Significant difference as compared to control (Kolmogorov-Smirnov two-sample test):*: p < 0.05; **: p < 0.01; ***: p < 0.001.
nt: not tested (number of daphnids 6 10).
8.4%, 6.5% and 4.4% of the initial exposure level for the nominal
concentrations of 8, 17 and 33 lg L¡1, respectively. Spinosyn A represented on average 79.1 ± 7.3%, and the spinosyn A/spinosyn D
ratio was 4.5 ± 1.5 whatever the insecticide initial concentration.
3.3. Daphnia pulex
The mean abundance of D. pulex varied between 730 and 280
individuals per litre in Bti-treated and control microcosms from
the beginning to the end of the whole study period (Fig. 3). In the
microcosms treated with 8 lg L¡1 spinosad, D. pulex population
density ranged between 780 and 180 individuals per litre whereas
there was a sharp density decrease in the enclosures treated with
17 and 33 lg L¡1 spinosad (respectively from 501 to 15 individuals
per litre and from 479 to 3 individuals per litre).
RM-ANOVA showed significant differences between the
treatments (p < 0.0001). Duncan’s post hoc test did not show any
significant difference between Bti-treated and untreated microcosms. In contrast, spinosad at 17 and 33 lg L¡1 caused a significant
reduction in the density of D. pulex as compared to the controls
from d 2 after treatment until the end of the study (Duncan’s post
hoc test, p < 0.0001 for both treatments). Density of D. pulex also
decreased in the microcosms treated with 8 lg L¡1 spinosad (Fig.
3), but differences were only significant at days 2 and 4 after treatment as compared to the controls (Duncan’s post hoc test, p = 0.046
and p = 0.035, respectively), indicating that population recovery
occurred in those enclosures.
The effect of treatment on mean size of D. pulex is shown in
Table 2. In the controls, the first cohort grew between d 0 and d 4
(mean size ranging from 1.050 to 1.268 mm). At days 7, 14 and 21,
a new cohort was identified in the samples (size-class 2; Fig. 4). In
Bti-treated microcosms, similar results were observed, except at d
2 in the microcosms treated with Bti at 0.50 lL L¡1 where size-class
3 was more abundant, and at d 21 for both concentrations where
the younger daphnids did not represent the major class (Fig. 4). In
microcosms treated with 8 lg L¡1 spinosad, Kolmogorov-Smirnov
two-sample test showed significant differences in the size structure of D. pulex population as compared to the controls from d 2
to d 21 (Fig. 4). In the microcosms treated with 17 lg L¡1, Kolmogorov-Smirnov two-sample test showed significant differences in the
size structure of D. pulex population at d 7 and d 21 as compared
to the control. In the microcosms treated with 33 lg L¡1 spinosad,
Kolmogorov-Smirnov two-sample test was carried out only at d 0
and d 2 because there were fewer than 10 daphnids per litre for
each of the other sampling dates. Furthermore, the new cohort
that appeared in the control enclosures at d 7, 14 and 21 was not
observed in any of the spinosad-treated microcosms.
4. Discussion
For the first time, the present study demonstrates effects of
spinosad on a natural population of D. pulex. Both survival and size
structure were affected by the treatments, but the lowest concentration (8 lg L¡1) allowed population recovery after the first week
of exposure. In contrast, Bti had no effect on D. pulex population
survival, confirming a number of previous studies (reviewed in
Boisvert and Boisvert, 2000 and Boisvert and Lacoursière, 2004).
Effects of spinosad were associated with a short time window of
exposure (less than the first two days), as both spinosyns A and D
were nearly undetectable in the water after four to seven days.
Overall, physicochemical water conditions (e.g., pH, salinity,
SM) were not affected by the treatments. Water temperatures differed between d 0 and d 21, and increased inside the microcosms as
air temperature increased during the study. Water level decreased
and salinity concomitantly increased during the study due to evaporation. Concentrations of dissolved oxygen in the microcosms
treated with spinosad were significantly higher than in the controls from d 2 to d 21 (Table 1), which may reflect depletion of the
population of D. pulex and possibly of other invertebrates. Other
water quality parameters (e.g., chlorophyll a concentration) were
insensitive to the effects of the insecticide (Fig. 1). However, chlorophyll a level is a rough indicator of microalgal biomass (Dauta
and Feuillade, 1995), and further investigations are needed to
assess the possible consequences of changes in arthropod densities on phytoplankton.
Spinosad concentrations measured in microcosm water were
close to the expected concentrations shortly after treatment (Fig.
2), the slight discrepancy observed for the lowest concentration
being likely due to the sampling procedure and/or a rapid degradation of spinosyns as both the A and D forms phototransform rapidly in aqueous solutions. Dissipation kinetics of spinosad in our
microcosms are in close agreement with the results obtained by
Cleveland et al. (2002a) in outdoor microcosms of comparable size,
and confirm the half-life of 1–2 d for the sum of spinosyns A and
D (Saunders and Bret, 1997; Cleveland et al., 2002a). Within the
first two days, the ratio between spinosyns A and D concentrations
remained constant, indicating that both compounds degraded at
similar rates, as shown by Cleveland et al. (2002a,b) who determined half-lives of 1.6–1.8 d in outdoor microcosms. In the present
study, a mean half-life value of 0.76 ± 0.02 d was estimated using
exponential regression for the three nominal spinosad concentrations tested. Rapid removal of spinosad from the water column
results from both photolysis and sediment partitioning (Saunders
and Bret, 1997; Cleveland et al., 2002a). Both processes were
favoured in our experimental conditions since the microcosms
�C. Duchet et al. / Chemosphere 74 (2008) 70–77
240
240
A. Control
160
120
80
40
160
120
**
80
* *** *** ***
40
0
0
0
2
4
240
7
14
21
0
2
240
B. Bti - 0.16 µL L-1
4
7
14
21
E. Spinosad - 17 µg L-1
200
Abundance
200
Abundance
D. Spinosad - 8 µg L-1
200
Abundance
Abundance
200
160
120
80
***
40
160
120
*
80
***
40
0
0
2
4
240
14
21
0
2
240
C. Bti - 0.50 µL L-1
**
200
7
4
7
14
21
F. Spinosad - 33 µg L-1
200
160
120
80
***
40
Abundance
0
Abundance
75
160
120
80
40
0
**
nt
nt
nt
nt
2
4
7
14
21
0
0
2
4
7
14
21
Time (days)
0
Time (days)
class 1 (< 0.6 mm; neonates);
class 2 (0.6 - 1 mm; 1 to 2 days old);
class 3 (1 - 1.4 mm; 2 to 4 days old); class 4 (1.4 - 1.7 mm; 4 to 6 days old);
class 5 (> 1.7 mm; older than 6 days)
Fig. 4. Changes in size-structure of the Daphnia pulex population exposed to 0.16 and 0.50 lL L¡1 Bti (B and C, respectively) and 8, 17 and 33 lg L¡1 spinosad (D, E and F,
respectively) as compared to control (A). Significant difference from control (Kolmogorov-Smirnov test): *: p < 0.05; **: p < 0.01; ***: p < 0.001. nt: not tested (number of daphnids 6 10).
were exposed to June sunlight and contained a 5–10 cm layer of
organic matter rich sediments.
Effects of spinosad on D. pulex were compared to those of Bti,
applied at 0.16 and 0.50 lL L¡1. As expected, Bti had no effect on the
survival of D. pulex, as shown by the absence of change in abundance (Fig. 3). According to previous studies, Bti is highly specific to
Nematocera (Diptera) like Culicidae, Simuliidae and Chironomidae
(Boisvert and Boisvert, 2000). Other aquatic invertebrates (molluscs, crustaceans, and insects) and vertebrates (fish and amphibians) are not sensitive to Bti. Moreover, Ali (1981) and Miura et al.
(1981) showed that Ephemeroptera, Amphipoda, Cladocera and
Copepoda were not affected by Bti. However, our study shows that
there were fewer younger daphnids and more older daphnids at d
21 in the enclosures treated with Bti (0.16 and 0.50 lL L¡1), as compared to the control (Fig. 4). As this change was only observed at
d 21 after Bti application, direct effects are unlikely. Size selection
by predation and/or competition in the D. pulex population might
be an explanation. Chaoborus sp. larvae, which were abundant in
the enclosures treated with Bti (Table 1), may have impacted some
specific size-classes in the D. pulex population. Indeed, phantom
midge larvae are major predators in zooplankton (Lüning-Krizan,
1997), and medium-sized preys represent a great proportion of the
diet because of their vulnerability (defined as the product of the
encounter rate between predator and prey and the capture success of the predator; Pastorok, 1981). In addition, there were more
Cladocera (Chydorus sp., Pleuroxus sp., Ceriodaphnia sp., Simocephalus sp., and Scapholeberis sp.) in enclosures treated with 0.16 lL L¡1
Bti, and more Culex sp. larvae in enclosures treated with 0.50 lL L¡1
Bti, as compared to the controls (Table 1). Cladocera and mosquito
larvae are filter-feeders and may have competed with D. pulex for
food, resulting in a decrease in the number of young daphnids
which are more vulnerable to food deprivation.
�76
C. Duchet et al. / Chemosphere 74 (2008) 70–77
In contrast to Bti, spinosad had a significant effect on the natural
population of D. pulex. At 17 and 33 lg L¡1, spinosad affected the
whole population and did not impact a particular size-class (Figs.
3 and 4). This indicates that all size-classes of D. pulex were equally
sensitive to the highest concentrations applied to the microcosms. In the enclosures treated with 8 lg L¡1 spinosad, D. pulex
density measured within the first four days of exposure was significantly lower than controls (Fig. 3). High mortality rates due to
the exposure to 17 and 33 lg L¡1 nominal concentrations were also
observed, which are inconsistent with the laboratory data published by Stark (2005), who estimated the acute LC50 at 129 lg L¡1.
Recovery of the D. pulex population in microcosms treated with
spinosad at 17 and 33 lg L¡1 did not occur, even after pesticide dissipation (Fig. 3). This may be due to the short duration of the observation period and/or to an eutrophication process (i.e., increase of
algal biomass) resulting in deoxygenation (Lampert and Sommer,
1997). Moreover, in our microcosms, concentrations of dissolved
oxygen decreased drastically (mean value at d 2 in all the enclosures: 5.47 mg L¡1 versus 2.58 mg L¡1 in spinosad-treated microcosms; 1.52 mg L¡1 in Bti-treated microcosms; 1.82 mg L¡1 in the
controls at d 21) resulting in degradation of water quality, which
impeded recovery of the D. pulex population affected by the two
highest spinosad concentrations.
Chronic NOECs of spinosad were estimated at 6.7 and 8 lg L¡1
in static and semi-static laboratory tests, respectively (National
Registration Authority for Agricultural and Veterinary Chemicals,
1998; WHO, 2007). In our conditions, 8 lg L¡1 spinosad produced
significant mortality in D. pulex over the first four days of exposure.
Seven days after the treatment, the D. pulex population recovered
to densities similar to those measured in the control and Bti-treated
microcosms. At d 4, the most abundant size-class in the microcosms treated with 8 lg L¡1 spinosad was class 4 (between 1.4 and
1.7 mm) which was able to reproduce two days later, leading to an
increase in the abundance of neonates (class 1, <0.6 mm) and juveniles (class 2, 0.6–1 mm) at d 7 (Fig. 4). In contrast, recovery was
not observed in laboratory experiments where the exposure of D.
pulex to 10 lg L¡1 spinosad led to a decline in survival, birth rate
(b), net reproductive rate (R0), and intrinsic rate of increase (rm),
population extinction (negative rm values) occurring after eight
days of exposure to spinosad (Stark and Vargas, 2003). This discrepancy may be due to the fact that, in the laboratory study, D.
pulex were maintained in static renewal tests and moved to newly
made pesticide solutions every other day. Additionally, spinosad
may have been more persistent in the laboratory conditions as
little photodegradation would have occurred.
5. Conclusion
Unlike Bti, spinosad had a strong lethal effect on D. pulex when
applied at 17 and 33 lg L¡1, resulting in population extinction. This
result does not confirm the LOEC that was estimated at 52 lg L¡1
in static laboratory tests (National Registration Authority for Agricultural and Veterinary Chemicals, 1998). When applied at 8 lg L¡1
in the enclosures, spinosad slowed down the growth of the population but recovery was observed after seven days. This is not in
agreement with laboratory studies which predicted population
extinction within eight days of exposure to 10 lg L¡1 spinosad
(Stark and Vargas, 2003). In situ microcosms therefore appear to be
a good compromise between laboratory tests and open field studies, allowing a realistic assessment of larvicide impact, including
recovery capacity, on natural invertebrate populations.
Acknowledgements
The authors are grateful to the French Ministry for Ecology,
Sustainable Development and Spatial Planning for financial support
through the National Programme for Ecotoxicology (PNETOX). The
help of M. Roucaute and P. Le Goff for field sampling was greatly
appreciated. The authors are most grateful to Dow AgroSciences
for the generous gift of spinosad 120SC and for helpful information
on analytical procedures. They also gratefully acknowledge Mr.
Jacques Defois for giving them access to the study site.
References
ACTA, 2007. Index Phytosanitaire. Association de Coordination Technique Agricole,
Paris.
AFNOR, 1996. Qualité de l’eau – Dosage des matières en suspension – Méthode
par filtration sur filtre en fibres de verre. In: Association Française de Normalisation (Eds.), Qualité de l’eau – 6e édition Tome 2 – Analyses organoleptiques
– Mesures physico-chimiques – Paramètres globaux – Composés organiques.
AFNOR, Paris, France, pp. 101–110.
Ali, A., 1980. Nuisant Chironomids and their control: a review. Entomol. Soc. Am.
Bull. 26, 3–16.
Ali, A., 1981. Bacillus thuringiensis serovar israelensis (ABG-6108) against chironomids and some nontarget aquatic invertebrates. J. Invertebr. Pathol. 38, 264–
272.
Amoros, C., 1984. Crustacés Cladocères. Bull. mensuel de la Soc. Linn. de Lyon 53,
72–145.
Boisvert, J., Lacoursière, J.O., 2004. Le Bacillus thuringiensis et le contrôle des insectes
piqueurs au Québec. ENV/2004/0278. Ministère de l’Environnement Québécois,
Québec Canada.
Boisvert, M., Boisvert, J., 2000. Effects of Bacillus thuringiensis var. israelensis on target and non target organisms: a review of laboratory and field experiments.
Biocontrol Sci. Technol. 10, 517–561.
Boronat, M.D., Miracle, M.R., 1997. Size distribution of Daphnia longispina in the vertical profile. Hydrobiologia 360, 187–196.
Burnett, K.M., Liss, W.J., 1990. Multi-steady-state toxicant fate and effect in laboratory aquatic ecosystems. Environ. Toxicol. Chem. 9, 637–647.
Caquet, Th., Hanson, M.L., Roucaute, M., Graham, W.G., Lagadic, L., 2007. Influence
of isolation on the recovery of pond mesocosms from the application of an
insecticide. II. Benthic macroinvertebrate responses. Environ. Toxicol. Chem.
26, 1280–1290.
Cetin, H., Yanikoglu, A., Cilek, J.E., 2005. Evaluation of the naturally-derived insecticide spinosad against Culex pipiens L. (Diptera: Culicidae) larvae in septic tank
water in Antalya, Turkey. J. Vector Ecol. 30, 151–154.
Cleveland, C.B., Bormett, G.A., Saunders, D.G., Powers, F.L., McGibbon, A.S., Reeves,
G.L., Rutherford, L., Balcer, J.L., 2002a. Environmental fate of spinosad. 1. Dissipation and degradation in aqueous systems. J. Agric. Food Chem. 50, 3244–
3256.
Cleveland, C.B., Mayes, M.A., Cryer, S.A., 2002b. An ecological risk assessment for
spinosad use on cotton. Pest Manage. Sci. 58, 70–84.
Consoli, F.L., Botelho, P.S.M., Parra, P.J.R., 2001. Selectivity of insecticides to the egg
parasitoid Trichogramma galloi Zucchi, 1988 (Hym., Trichogrammatidae). J.
Appl. Entomol. 125, 37–43.
Crouse, G.D., Sparks, T.C., Schoonover, J., Gifford, J., Dripps, J., Bruce, T., Larson,
L., Garlich, J., Hatton, C., Hill, R.L., Worden, T.V., Martynow, J.G., 2001. Recent
advances in the chemistry of spinosyns. Pest Manage. Sci. 57, 177–185.
Dauta, A., Feuillade, J., 1995. Croissance et dynamique des populations algales. In:
Pourriot, R., Meybeck, M. (Eds.), Limnologie générale. Masson, Paris France, pp.
328–350.
DowElanco, 1996. Spinosad technical guide. Form No 200-03-001 (4/96). Indianapolis, USA.
Garcia, R., Des Rochers, B., Tozer, W., 1981. Studies on the toxicity of Bacillus thuringiensis var. israelensis against organisms found in association with mosquito
larvae. In: California Mosquito and Vector Control Association, Inc (Eds.), Proceeding of the Forty-eighth Annual Conference of the California Mosquito and
Vector Control Association, Inc, pp. 33–36.
Gurney, W.S.C., McCauley, E., Nisbet, R.M., Murdoch, W.W., 1990. The physiological
ecology of Daphnia: a dynamic model of growth and reproduction. Ecology 71,
716–732.
He, L.S., Ong, K.H., 2000. Effects of Bacillus thuringiensis H-14 on bloodworms (Diptera: Chironomidae). Singapore. J. Pri. Ind. 28, 7–12.
Hershey, A.E., Lima, A.R., Niemi, G.J., Regal, R.R., 1998. Effects of Bacillus thuringiensis
israelensis (Bti) and methoprene on nontarget macroinvertebrates in Minnesota
wetlands. Ecol. Appl. 8, 41–60.
Holt, K.M., Opit, G.P., Nechols, J.R., Margolies, D.C., 2006. Testing for non-target
effects of spinosad on two spotted spider mites and their predator Phytoseiulus
persimilis under greenhouse conditions. Exp. Appl. Acarol. 38, 141–149.
Isman, M.B., 2006. Botanical insecticides deterrents, and repellents, in modern agriculture and an increasingly regulated world. Annu. Rev. Entomol. 51, 45–66.
Lampert, W., Sommer, U., 1997. Limnology: The Ecology of Lakes and Streams.
Oxford University Press, Oxford, UK.
Lorenzen, C.J., 1967. Determination of chlorophyll and pheopigments: Spectrophotometric equations. Limnol. Oceanogr. 12, 343–346.
Lüning-Krizan, J., 1997. Selective feeding of third- and fourth-instar larvae of Chaoborus flavicans in the field. Arch. Hydrobiol. 140, 347–365.
McCauley, E., Murdoch, W.W., Nisbet, R.M., Gurney, W.S.C., 1990. The physiological
ecology of Daphnia: development of a model of growth and reproduction. Ecology 71, 703–715.
�C. Duchet et al. / Chemosphere 74 (2008) 70–77
Medina, M., Barata, C., Telfer, T., Baird, D.J., 2004. Effects of cypermethrin on marine
plankton communities: a simulated field study using mesocosms. Ecotoxicol.
Environ. Saf. 58, 236–245.
Merritt, R.W., Walker, E.D., Wilzbach, M.A., Cummins, K.W., Morgan, W.T., 1989. A
broad evaluation of Bti for black fly (Diptera: Simuliidae) control in a Michigan
river: efficacy, carry and non target effects on invertebrates and fish. J. Am. Mosquito Control Assoc. 5, 397–415.
Miles, M., 2003. The effects of spinosad, a naturally derived insect control agent to
the honeybee. Bull. Insectol. 56, 119–124.
Miles, M., Dutton, R., 2000. Spinosad: a naturally derived insect control agent with
potential use in glasshouse integrated pest management systems. Meded. Fac.
Landbouwkundige en Toegepaste Biol. Wet. Univ. Gent 65, 393–400.
Miura, T., Takahashi, R.M., Mulligan III, F.S., 1981. Impact of the use of candidate
bacterial mosquito larvicides on some selected aquatic organisms. In: California
Mosquito and Vector Control Association, Inc (Eds.), Proceedings of the Annual
Conference of the Californian Mosquito Control Association 49, pp. 45–48.
Nasreen, A., Ashfaq, M., Mustafa, G., 2000. Intrinsic toxicity of some insecticides
to egg parasitoid Trichogramma chilonis (Hym. Trichogrammatidae). Bull. Inst.
Trop. Agric. Kyushu Univ. 23, 41–44.
National Registration Authority for Agricultural and Veterinary Chemicals, 1998.
Spinosad in the products Laser Naturalyte Insect Control–Tracer Naturalyte
Insect Control. NRA, Camberra, Australia.
Pastorok, R.A., 1981. Prey vulnerability and size selection by Chaoborus larvae. Ecology 62, 1311–1324.
Pineda, S., Smagghe, G., Schneider, M.I., Del Estal, P., Viñuela, E., Martìnez, A.M.,
Budia, F., 2006. Toxicity and pharmacokinetics of spinosad and methoxyfenozide to Spodoptera littoralis (Lepidoptera: Noctuidae). Environ. Entomol. 35,
856–864.
Purcell, B.H., 1981. Effects of Bacillus thuringiensis var. israelensis on Aedes taeniorhynchus and some non target organisms in the salt marsh. Mosq. News 41,
476–484.
Rand, G.M., Clark, J.R., 2000. Hazard/risk assessment of pyridaben: I. Aquatic toxicity and environmental chemistry. Ecotoxicology 9, 157–168.
77
Salgado, V.L., 1998. Studies on the mode of action of spinosad: insect symptoms and
physiological correlates. Pestic. Biochem. Physiol. 60, 91–102.
Saunders, D.G., Bret, B.L., 1997. Fate of spinosad in the environment. Down to Earth
52, 14–20.
SETAC, 1991. Guidance Document on Testing Procedures for Pesticides in Freshwater Static Mesocosms. In: SETAC (Eds.), A Meeting of Experts on Guideline for
Static Field Mesocosms Tests, Huntingdon, UK.
Stark, J.D., 2005. How closely do acute lethal concentration estimates predict effects
of toxicants on populations? Int. Environ. Assess. Manage. 1, 109–113.
Stark, J.D., Vargas, R.I., 2003. Demographic changes in Daphnia pulex (Leydig) after
exposure to the insecticides spinosad and diazinon. Ecotoxicol. Environ. Saf. 56,
334–338.
Stephenson, G.L., Hamilton, P., Kaushik, N.K., Robinson, J.B., Solomon, K.R., 1984.
Spatial distribution of plankton in enclosures of three sizes. Can. J. Fish. Aquat.
Sci. 41, 1048–1054.
Tachet, H., Richoux, P., Bournaud, M., Usseglio-Polatera, P., 2000. Invertébrés d’eau
douce - Systématique, biologique, écologie. CNRS Editions, Paris France.
Tillman, P.G., Mulrooney, J.E., 2000. Effects of selected insecticides on the natural
enemies Coleomegilla maculata and Hippodamia convergens (Coleoptera:
Coccinellidae), Geocoris punctipes (Hemiptera: Lygaeidae), and Bracon mellitor,
Cardiochiles nigriceps, and Cotesia marginiventris (Hymenoptera: Braconidae) in
cotton. J. Econ. Entomol. 93, 1638–1643.
van den Brink, P.J., Tarazona, J.V., Solomon, K.R., Knacker, T., van den Brink, N.W.,
Brock, T.C.M., Hoogland, J.P.H., 2005. The use of terrestrial and aquatic microcosms and mesocosms for the ecological risk assessment of veterinary medicinal products. Environ. Toxicol. Chem. 24, 820–829.
van Frankenhuyzen, K., 1993. The challenge of Bacillus thuringiensis. In: Entwistle,
P.F.J., Cory, S., Bailey, M.J., Higgs, S. (Eds.), Bacillus thuringiensis, an Environmental Biopesticide: Theory and Practice. John Wiley & Sons, pp. 1–35.
Watson, G.B., 2001. Actions of insecticidal spinosyns on gamma-aminobutyric acid
receptors from small-diameters cockroach neurones. Pestic. Biochem. Physiol.
71, 20–28.
WHO, 2007. Spinosad. World Health Organization, Geneva, Switzerland.
�
 Laurent Lagadic
 Claire Duchet