Ocean & Coastal Management 73 (2013) 1e12
Contents lists available at SciVerse ScienceDirect
Ocean & Coastal Management
journal homepage: www.elsevier.com/locate/ocecoaman
The impacts of shrimp farming on land use, employment and
migration in Tumbes, northern Peru
F. Mialhe a, *, Y. Gunnell b, C. Mering a
a
b
Department of Geography, Université Paris Diderot 7, CNRS UMR 8586, 2 rue Valette, 75005 Paris, France
Department of Geography, Université de Lyon, CNRS UMR 5600 EVS, 86 rue Pasteur, 69365 Lyon Cedex 07, France
a r t i c l e i n f o
a b s t r a c t
Article history:
Available online 4 January 2013
Export-oriented shrimp aquaculture appeared in the coastal landscape of Peru in the late 1970s. Its rapid
development has entailed both positive and negative environmental and socioeconomic impacts across
the newly emerging shrimp farming territory of the Tumbes river delta. Here we combine ground surveys and interviews with remote sensing analysis of the transformed environment in order to characterize and quantify the nature, origin and scale of the environmental and social impacts caused by the
intrusion of aquaculture. Results show that shrimp farming has encroached on several land cover categories and converted 17% of the Peruvian mangrove. We provide an overview of the history and nature
of those impacts. Minimum full-time equivalent employment, which occurred during a white-spot
epidemic, was attained in 2001 with 439 full-time jobs; employment peaked in 2006, with 2660 fulltime jobs. However, considering indirect benefits, remittances and the prevalence of part-time jobs,
the population reliant on aquaculture probably exceeds 10,000. A geographical analysis of social networks reveals how shrimp farming draws a sustained influx of population from the Andes and how it
modifies the interaction between population and the natural coastal environment. Recent sectorial
improvements towards achieving a more sustainable management of the coastal resources are analysed,
and additional recommendations predicated on a more integrated approach are provided.
Ó 2013 Elsevier Ltd. All rights reserved.
1. Introduction
Among the diverse productions of aquaculture, shrimp farming
has received special scrutiny because of its negative environmental
and social impacts. Worldwide production of farmed shrimps has
increased from less than 100,000 metric tons in 1980 to more than
3.5 million metric tons in 2009 (FAO, 2012). Shrimps, as many other
crustacean organisms, are high value food commodities. Crustacean production accounted of late for only 9.5% of the global production in mass but for 23.1% in terms of value (FAO, 2010).
Growing demand among developed countries and emerging
economies, technological advances conducive to the intensification
of production, and the global decline in marine fish catches have
been the main drivers behind this surge in shrimp farming (Biao
and Kaijin, 2007; Paul and Vogl, 2011). Aquaculture has also been
promoted to alleviate poverty through the supply of direct and
* Corresponding author. Present address: Department of Geography, University of
Namur, 61 rue de Bruxelles, 5000 Namur, Belgium. Tel.: þ32 485 36 34 24.
E-mail
addresses:
francois.mialhe@fundp.ac.be,
framialhe@hotmail.fr
(F. Mialhe).
0964-5691/$ e see front matter Ó 2013 Elsevier Ltd. All rights reserved.
http://dx.doi.org/10.1016/j.ocecoaman.2012.12.014
indirect jobs, proteins and revenue (Hishamunda and Ridler, 2006;
Asian Development Bank, 2004; Edwards, 2000; Heck et al., 2007).
For example, several development projects conducted by multilateral agencies such as the World Bank and the Asian Development
Bank focused on aquaculture during the 1980s (Goss et al., 2000;
Hall, 2004) and shrimp farming, a non-traditional export activity,
benefited substantially from them. Shrimp farming has since
become a major source of export earnings for several Southeast
Asian countries (Hall, 2004).
The ensuing economic development was associated with both
positive and negative impacts. In total, shrimp farming is estimated
to occupy between 1 and 1.5 million hectares along the world’s
coastlines (Berlanga-Robles et al., 2011). Mangrove degradation, for
example, has largely been depicted as a major environmental
consequence in American and Asian coastal areas. Almost half of
the total mangrove land cover area has been depleted in the last 50
years (Curran, 2002). Although several factors have led to mangrove destruction, shrimp farming is considered a major culprit
(Valiela et al., 2001). Until recently, development of shrimp farms in
mangrove ecosystems was not prohibited and even sometimes
encouraged by national and local governments, who assessed the
traditional use of mangrove resources as inefficient (Stokstad, 2010;
�2
F. Mialhe et al. / Ocean & Coastal Management 73 (2013) 1e12
Armitage, 2002). Other negative ecological (e.g. soil and water
pollution) and social impacts have arisen with the development of
the aquaculture industry, such as social inequalities in food security
and resource allocation, and the marginalization of smaller scale
farmers (Bailey, 1988; Stonich, 1995). A major unforeseen impact is
that the development of aquaculture has failed to reduce the
pressure on capture fisheries: instead of operating as a substitute it
has expanded the demand for fish protein by creating new markets
(Curran, 2002).
A positive outcome of the activity is the job market generated by
the farms, with opportunities for improving human livelihoods.
Overall, global aquaculture production, including shrimp farms, is
estimated to provide a direct source of income to 16.7 million people
and indirectly to another 6.8 million (Valderrama et al., 2010). Even
such a figure probably underestimates reality if we consider that just
in Bangladesh 1.2 million people are directly involved in shrimp
production and 4.8 million household members benefit from the
industry (Islam, 2008). However, according to some case studies in
Asia (India, Philippines, Indonesia), shrimp farming appears to have
benefited mostly affluent and elite classes, and in some case has
widened the gap between rich and poor (Adduci, 2009; Hall, 2004;
Armitage, 2002; Stonich, 1995). Among the poorer sections of society, some individuals have benefited from aquaculture, mainly
through job opportunities in the commodity chain (Edwards, 2000).
Many, however, such as in Ecuador and Honduras, have seen
a reduction of their livelihood options because of poor planning of
aquacultural activities and contempt from the ruling class towards
traditional resource management practices and local indigenous
populations (Stonich, 1995; Hamilton, 2011). Privatization of the
resource base that supports traditional livelihoods has caused some
in- and out-migration of labour for economic reasons, with farm
owners taking advantage of interregional or international wage
inequalities and favouring non-local populations as an avoidance
strategy against local collective protest (Resurrección and Sajor,
2010). In places such as the Philippines or Bangladesh, the development of shrimp farming has led to emigration because of environmental degradation (Primavera, 1997). However, through the
remittances sent home by the migrants, aquaculture has also
revealed a capacity to enhance the resilience of households in their
original home territories by spreading economic risk and broadening economic opportunities. In Vietnam, remittances have also
increased inequalities among households in the communities of
origin (Adger et al., 2002). In Thailand, the development of inland
shrimp farming has also promoted migration into the continental
interior (Flaherty and Vandergeest, 1998). In Indonesia, the
government-led transmigration of population from Java to Sumatra,
Kalimantan and others islands has been critical in the development
of shrimp farms outside Java, where shrimp diseases affects many
production units (Armitage, 2002; Hall, 2004). Shrimp farming has
also generated some international migration. In Thailand, where
Thais tend to avoid unskilled work, the government has encouraged
immigration policies advantageous to shrimp farms. These now
employ low- and semi-skilled workers from Laos and Burma
(Resurrección and Sajor, 2010).
These impacts have been addressed in different ways by
stakeholders of the shrimp farming sector. The wide spectrum of
solutions reflects differences in diagnosis, in perception of the
impacts, but also divergent interests. For example, Béné (2005) has
highlighted a sharp opposition between a politicized discourse
rooted in political ecology, which promotes a holistic approach
involving extensive and mixed farming systems, and a technocratic
and market-oriented discourse which advocates intensive, closed
systems assorted with best management practices. Concepts and
guidelines emanating from the prescriptions of Integrated Coastal
Management (Chua et al., 2006; Primavera, 2006) and Ecosystem-
Based Management, for example, strive to reconcile economic
development and resource conservation objectives by reframing
aquaculture through the lens of the ecosystem services narrative
(Barbier et al., 2008). However, the successful conciliation of conservation goals and development objectives at sites where shrimp
farms have become established still remains a largely unfulfilled
ideal (Barbier et al., 2008).
In South America, shrimp farming developed first in Ecuador in
1969 (Twilley et al., 1999). In Peru, it began in the 1970s, initially
under the impulse of government-led experiments. The private
sector was first allowed to invest in shrimp farming in 1978 following a shift in national policies towards liberal economic principles (National Institute of Natural Resources, or INRENA, 2007).
That same year, the government allocated 6000 ha to aquaculture,
mostly in saline areas on the inner fringes of mangrove swamps.
Initially, the development of aquaculture was driven by a government-endorsed licence to exploit land resources, with the economic pattern broadly following an export-based system modelled
on vent-for-surplus theory (Myint, 1958). Following the importsubstitution model of industrialization, export-led growth models
of development through non traditional export were supposed to
stabilize the balance of payments and revitalize economic growth
in many developing countries (Barham et al., 1992). This model
argues that export activities in the basic sector (export) create jobs
in the non-basic sector through spillovers (Tiebout, 1956) and are
particularly well suited to small regions or cities that need to
import goods not produced locally (Malecki, 1997). In this perspective, shrimp farming was a suitable candidate activity since
a number of advantageous conditions were locally available:
unfarmed land, the proximity of Ecuadorian expertise, private
capital, wild post-larvae in the local ecosystem, and an existing
research unit in the local Fisheries department. The well-known
collapse of Peruvian marine fisheries in 1972 due to anchovy
overfishing (e.g. Thorpe et al., 2000) also provided a perfect conjuncture for developing aquaculture in the Tumbes delta.
Based on a case study, this paper aims to assess some of the
impacts generated by ex nihilo shrimp farming in the coastal area of
Tumbes, northernmost Peru. In this so far poorly documented region, we first map the land cover and land use changes that have
occurred through the development of aquaculture to unveil the
environmental changes that have occurred at landscape level. Then
we estimate the number of jobs created by the newly introduced
shrimp farming system. Through an analysis of labour migration,
we identify the determinants of population flow at the individual,
household and regional levels and analyse the role of shrimp
farming in driving immigration. We finally connect those three
aspects to show how shrimp farming has shaped, and been shaped
by, the interactions between society and the environment.
2. The study area
The study area is part of Tumbes Department, in the northern
coastal zone of Peru on the border with Ecuador (Fig. 1). Climate is
influenced by the semi-arid conditions in the south, by the equatorial climate in the north, and by El Niño events. The 180 km-long
Tumbes river is the main watercourse in the area (drainage area:
5656 km2) and the only navigable river of the Pacific coast of Peru.
It rises in Ecuador (Zaruma Mountains) and forms a delta in the
study area. The river discharge regime is unimodal and peaks in
March. The coastal area comprises a mosaic of various ecosystems
such as mangrove (association of Rhizophora mangle, Laguncularia
racemosa, Conocarpus erectus and Avicennia germinans), dry forest,
savanna and algarrobal (Prosopis pallida).
Among the provinces forming the Tumbes Department (population: 191,713), Tumbes province was the most populated in 2005
�F. Mialhe et al. / Ocean & Coastal Management 73 (2013) 1e12
3
Fig. 1. Location of the study area.
10000 12000 14000
occurrence of the seventh cholera pandemic in 1991; and (iii) an
epidemic caused by an outbreak of white-spot syndrome (WSS) in
August 1999.
The farming systems involve semi-intensive and intensive
monoculture of shrimps (P. vannamei). Post-larvae are produced in
hatcheries mainly located in Ecuador (Evans and Tveteras, 2011)
whereas formulated feed is produced nationally from forager fish.
The stocking density of post-larvae varies from 15 m 2 for semiintensive to >50 m 2 for intensive systems. Farms are large scale,
many of them with a production area exceeding 50 ha. Yields in
semi-intensive systems approximate 1 to 1.5$103 kg per cycle with
two to three cycles per year, while intensive systems yield between
5$103 and >10$103 kg per cycle. Farmers are now dramatically
reducing intensive systems and have shifted towards semi-intensive systems following the recurrence of viral diseases. The absence
of a local market likely to absorb the production unfit for export has
provided a further impetus for the farmers to abandon the intensive system, in which production costs remain very high (E. Mialhe,
pers. comm. October 2012).
3. Methods
8000
In order to assess the multidimensional nature of aquaculturerelated impacts both in space and time, a specific methodology
was elaborated based on remote sensing and field work.
4000
6000
3.1. Mapping changes in land use
0
2000
Farmed shrimp production (Mt)
(population: 139,073) (Instituto Nacional de Estadistica e Informativa, or INEI, 2009). Between 1981 and 2005, the Department
population increased by 77% (83,649 inhabitants), the bulk of this
increase (67%) affecting Tumbes alone. With a population density of
225 km 2, the coastal area, which includes the La Cruz, Corrales,
Tumbes, Papayal, Aguas Verdes, and Zarumilla provinces, is much
more thickly populated than the hinterland (10 km 2). Given also
that demographic fertility is greater in the hinterland, migration
has been an important driver of this demographic imbalance.
Alongside services and international trade with Ecuador, agriculture is a major activity. Rice and banana are the two mains crops,
both irrigated.
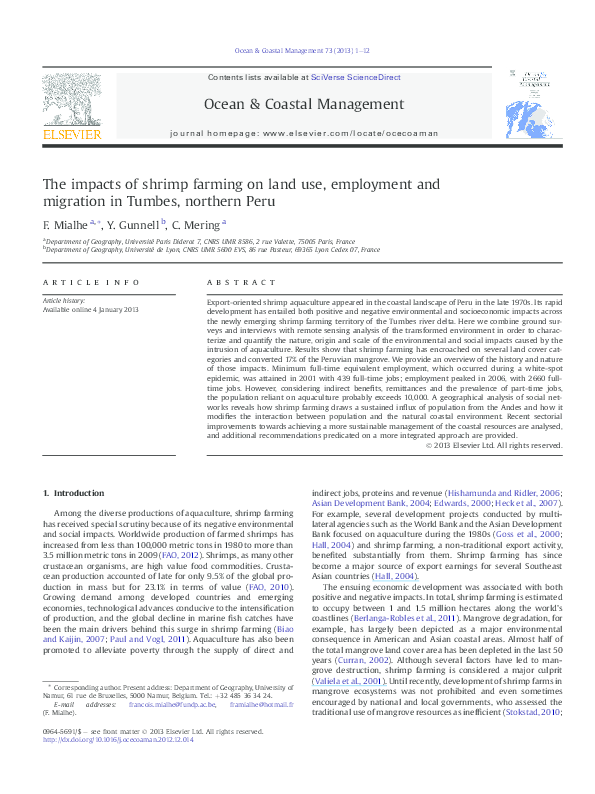
Peruvian shrimp production statistics (Fig. 2) exhibit high variability over time. The major disturbances to a steadily growing
production were (i) El Niño in 1983 and 1997e1998, which caused
flooding, clogging of waterways by sediment, mangrove depletion,
and a critical reduction of wild post-larvae of Penaeus vannamei,
Penaeus stylirostris and Penaeus californiensis in 1984; (ii) the
1980 1983 1986 1989 1992 1995 1998 2001 2004 2007 2010
Years
Fig. 2. Shrimp production in Tumbes between 1980 and 2006 Source: Peruvian
Department of Fisheries.
The assessment of environmental impacts at the landscape level
was achieved through a multitemporal inventory of land resources
obtained from a satellite image- and aerial photograph-based
analysis of land use changes. Remote sensing is a convenient tool
for obtaining synoptic and repetitive information about the state of
land resources and then to assess the land use changes (Green et al.,
1996; Rogan and Chen, 2004). A total of eight images were used in
this study: three Landsat MSS, one Landsat TM, one Landsat ETMþ
and three SPOT 5 (Table 1). Landsat images were acquired from the
Global Land Cover Facility while SPOT images were acquired
through the ISIS program of the CNES (Centre National d’Études
Spatiales). Aerial photographs were taken in 1962 by the Fuerzas
�4
F. Mialhe et al. / Ocean & Coastal Management 73 (2013) 1e12
Table 1
Imagery used in the study.
Table 2
Image geometrical correction tests.
Source
Date (years)
Aerial photographs
Landsat MSS
1962
1977, 1982,
1983
1991
2000
2003, 2004,
2007
Landsat TM
Landsat ETMþ
SPOT 5
Ground
resolution (m)
57
28.5
28.5
10
Armadas del Peru. In total, the image data set covers a period of 45
years.
Because misregistration can decrease the accuracy of diachronic
maps (Dai, 1998), geometric corrections were performed systematically (Fig. 3). Given field investigations and in situ GPS data collection carried out in 2007, a SPOT 5 satellite image from 2007 was
selected as the reference image. All the other images were thus coregistered against the SPOT 5 using second-degree polynomial
transformation and nearest neighbour resampling. The root mean
square errors (RMSE) of the images are given in Table 2. Except for
the Landsat MSS image acquired in 1983, for which the low quality
did not allow the same level of accuracy to be attained, all the RMSE
Image (with acquisition date)
No. of ground
control points
RMSE
Landsat MSS (1977)
Landsat MSS (1982)
Landsat MSS (1983)
Landsat TM (1991)
Landsat ETMþ (2000)
Spot 5 (2003)
Spot 5 (2004)
23
18
20
20
17
11
15
0.444064
0.471381
0.602474
0.499527
0.246883
0.102056
0.074806
values were suitable because below the recognized accuracy
threshold of 0.5 (Hui et al., 2008).
The image classification procedure followed the steps indicated
in Fig. 3. Principal Component Analysis (PCA) is a multivariate
statistical technique based on an orthogonal transformation
designed to convert possibly correlated spectral data into a (usually
smaller) set of linearly uncorrelated variables called principal
components. PCA was first performed on each image in order to
increase radiometric contrasts and reduce redundancy between
strongly correlated channels (Chavez and Kwarteng, 1989; Eklundh
and Singh, 1993; Lu and Weng, 2007; Campbell and Wynne, 2011).
Components with the higher eigenvalues were then subjected to an
unsupervised K-means classification, which has become a routine
procedure of unsupervised pixel classification (Lillesand et al.,
2007). The number of user-defined classes varied from 15 for the
Landsat to 25 for the SPOT 5 images. These classes were first
interpreted and were then merged on the basis of a land cover
typology elaborated from field investigations (Mialhe, 2010). The
typology included the following classes: wetlands, water bodies,
bare soil, mangrove, dry forest, mixed vegetation (including savanna and riparian forest). The sea was masked by segmenting the
water body classes. Because maps derived from remotely sensed
images can contain errors, e.g. due to preprocessing or interpretative techniques, classification accuracy was assessed using the
Kappa index, frequently used in remote sensing and derived from
an error matrix (Story and Congalton, 1986; Foody, 2002, 2004).
Kappa indices ranged here between 0.81 and 0.98. Aerial photographs were visually interpreted using the same class typology as
for the satellite images. Finally, several change detection maps were
computed using a post-classification method based on the individual land use maps (Singh, 1989).
3.2. Surveys
Fig. 3. Flow chart of the remote sensing procedure for land use change mapping.
Field work was conducted to collect information about
employment in the aquaculture sector and labour migration. It was
conducted between April and June 2007. First-hand data were
collected through questionnaires and interviews with local stakeholders (government agents, farm operators, environmentalists)
while second-hand data were compiled after visiting the appropriate institutions (referenced whenever relevant hereafter in the
text).
The unbiased assessment of population involvement in specific
activities is not a simple task because employment can be informal,
irregular or indirect. Here, quantitative estimates of employment
levels relied on estimations of the labour force required at several
stages of the commodity chain: farms, conditioning plants, and
input salesmen. One of the three major conditioning plants was
visited. Chief and section managers were questioned about the
operations conducted within the plant and about the labour force
required to perform each operation. Data was normalized by the
mass of shrimps processed in order to allow for interannual computations. Information about the same operations in other plants
�5
F. Mialhe et al. / Ocean & Coastal Management 73 (2013) 1e12
confirmed these numerical estimations. The assessment of jobs in
the transformation chain is based on the following empirical
equation:
Ep ¼ ½ðp þ yÞ*x þ ðq þ sÞ*w=z
(1)
where Ep is the number of annual full-time jobs per plant, p is the
total mass of shrimps produced (in 106 g), q is the mass of whole
shrimps destined for export (in 106 g, 10% of the production on
average), s is the mass of unbeheaded shrimps (in 106 g), x is the
average number of labourers involved in beheading operations
(x ¼ 8$10 6 g), w the average number of people required for
freezing and conditioning operations (w ¼ 10$10 6 g), y the proportion of total production to be beheaded (y ¼ 0.9), and z the
number of days worked by each employee (z ¼ 260).
A dozen of grow-out farms were visited, ranging from extensive
to intensive and from medium to large-scale. Farm managers were
questioned about the labour force required for permanent and
temporary operations. External agents were also questioned about
temporary work loads. The following information was sought:
number of permanent workers for grow-out operations under
different production intensities (ranging from extensive to intensive), proportion of skilled workers, number of temporary workers
and number of annual production cycles. Because numerical data
given by farm managers were suitably convergent, an average of
reported figures was calculated. These numerical data were also
consistent with estimations made by Berger et al. (2004). For onfarm operations, separate functions were computed for permanent and temporary workers. Employees include both skilled
(technical, administrative, secretarial) and unskilled workers (for
grow-out operations, security, monitoring), whereas the temporary
workers are hired for harvesting and cleaning tasks. The empirical
formula for on-farm employees is:
Epf ¼ Q *F þ M*SI þ N*I
(2)
where Epf is the number of permanent workers on the farm, Q the
average number of skilled jobs per farm, F the number of farms, M
the number of permanent unskilled workers per hectare for semiintensive and extensive farms (M ¼ 0.2), N the number of permanent unskilled workers per hectare for intensive farms (N ¼ 2), SI
the area of semi-intensive and extensive farms (in ha), and I the
area of intensive farms (in ha).
For temporary workers the function is:
Et ¼ A*B*V þ I*B*W
(3)
where Et is the number of temporary workers, A is the total production area (in ha), B is the average number of cycles per year, V is
the number of workers needed per harvest and per hectare, W the
number of workers needed to clean the intensive ponds after harvesting operations, and I the area of intensive farms (in ha).
The total number of jobs was calculated from equation (4):
Ed ¼ Epf þ Ep þ Et þ T þ U
(4)
where Ed is the total number of jobs, T is the number of individuals
working in local services dedicated to aquaculture (such as food
and input supplies), and U is the estimated number of workers
working in undeclared farms. Other variables are as given in
equations (1)e(3).
A questionnaire was submitted to unskilled workers (n ¼ 70)
and served several purposes. Its aim was to estimate the proportion
of migrants among the unskilled worker population and to identify
the determinants of the migration at individual, household and
contextual levels. Because most farm workers live most of the time
on the farm, surveys were carried out on the farm during the rest of
the time. Six farms presenting a range of production intensities
were surveyed. Respondents were selected randomly among the
workers, i.e. without indicating our intended focus on migrants.
The questionnaire included a general section dedicated to all
workers and a special section concerning immigrant workers.
4. Results and discussion
4.1. Land cover and land use change
Land cover changes observed from the six diachronic land use
maps produced (see Supplementary Material for five of these
maps) have been interpreted and summarized in Table 3. The map
sequence provides a detailed record of habitat depletion for each of
the time slices indicated in Table 3. This table includes only nonseasonal changes, i.e. it does not consider phenological changes
in the ecosystems or cropping systems. The successive main land
use changes are related to the development of agriculture, the
development of shrimp farming and the variability of shrimp production. The main transformative process occurring in the study
area during the second half of the 20th century has been the
destruction of natural habitat by agriculture and aquaculture.
Agriculture first developed on fine-textured bare soil and mangrove in the delta and along the small river floodplains, and it was
promoted in this lowland environment by the introduction of highyielding rice varieties and new irrigation schemes. Between 1977
and 1991, the ponds appeared primarily on bare soil (which includes beaches and saline soils with scattered halophytes, e.g.
Distichlis spicata and Sesuvium portulacastrum), mainly on the
landward side of the mangrove belt. Mangrove and dry forest
Table 3
Land use changes detected by remote sensing methods.
Period
Time-sliced
evolution
1962e1977
1977e1991
1991e2000
2000e2003
2003e2007
Summary
1962e2007
Qualitative land use changes
Quantitative estimate of impact
Expansion of aquaculture
Development of ponds
Coastline variation
Interruption of aquaculture
Recovery of aquaculture
Continued recovery of
aquaculture
Average of 47 ha yr 1 gained at the expense of bare soil (526 ha) and mangrove (185 ha)
Gained at the expense of mangrove (600 ha), dry forest (500 ha) and bare soil (2000 ha)
Accretion associated with channel avulsion
Development of bare soil at the expense of water bodies (w1800 ha)
w1000 ha of recovered ponds, scattered along the coast
w1000 ha of recovered ponds
Expansion of agriculture
Coastal accretion
Gained at the expense of bare soil (1330 ha), dry forest (852 ha), savanna (853 ha)
w375 ha of new coastal sediment (i.e. w3 km of seaward progradation) near present day
sand spit
Mangrove (w1000 ha), bare soil (1000 ha), savanna (1490 ha), dry forest (700 ha)
Development of fish ponds
�6
F. Mialhe et al. / Ocean & Coastal Management 73 (2013) 1e12
located on the mangrove fringes were first to be cleared. Some
farms, however, were also implanted as enclaves in the mangrove
heartland. Although the bulk of the mangrove was converted to
ponds, some portions were also deforested for building the farm
access roads and bridges (INRENA, 2007). El Niño (1997e1998) and
the WSS outbreak episode explain the reduction of areas under
productive aquaculture during the 1991e2000 decade. Estimating
through remote sensing alone the shrimp farming areas that temporarily halt production is a difficult task because of the difficulty in
distinguishing between naturally bare soil and disused (i.e. dried
up) ponds based on spectral signatures alone. However, a visual
inspection of the maps in the Supplementary Information shows
that the total change (w1800 ha) corresponds mostly to a decline in
pond use. During that same time interval, however, some new
farms also developed on bare soil (w500 ha). The area corresponding to ponds that recovered during the following period
(2000e2007) is w2000 ha.
A more comprehensive account of the proportion of land cover
converted to ponds is best provided by the map of land use change
between 1962 (estimated from aerial photography) and 2007
(obtained from SPOT 5) (Fig. 4, see Supplementary Information for
a colour version of Fig. 4). It reveals the contrast between the diversity and heterogeneity of initial land cover types and the comparative uniformity of present day land use as the delta became
progressively converted to aquaculture. In total, the percentages of
original land cover that have been converted to shrimp farms between the coastline and the pan-American highway are 16%, 18%,
14% and 28% for mangrove, bare soil, dry forest, and savanna,
respectively. The absence of environmental and land use planning
policy enforcement gave a free hand to indiscriminate aquaculture
development, yielding a relatively anarchic spatial pattern of farm
occurrence. Depletion of the TumbesePiura dry forest, recognized
in this region as containing high rates of bird endemism (Best and
Kessler, 1995), raises conservation issues of international proportion. Like the Guayaquil flooded grasslands in adjacent Ecuador, this
tropical and subtropical broadleaf woodland is listed as a remarkable terrestrial ecoregion by the World Wide Fund for Nature and is
really a mosaic of many habitats, with at least 14 endangered
species and a catalogue of nearly 500 species of bird, mammal,
batracian and reptile. The risk of desertification relating to the
increase of grassland savanna over woodland is another concern.
The encroachment of aquaculture on bare soil (whether dry or
wet) has also impacted natural drainage because this type of land
cover mostly corresponds to creeks in the intertidal zone. As
a consequence, the mangrove ecosystems that depend on the ebb
and flow of water in the creeks have been affected (INRENA, 2007).
The construction of canals by farmers has also increased flood
hazard in built-up areas. The impacts are thus not limited to the
converted areas but also have off-site effects. Shrimp-farm effluents, which diffuse to the surrounding water bodies, usually damage both flora and fauna (Gräslund and Bengtsson, 2001; PàezOsuna, 2001). Evidence of such impacts on the local flora and
fauna would require a purpose-designed ecological investigation,
but previous studies have already highlighted a link between the
Fig. 4. Changes in land use from 1962 to 2007.
�7
F. Mialhe et al. / Ocean & Coastal Management 73 (2013) 1e12
development of shrimp farming and the reduction of fish catches
and crab populations (e.g. Cardisoma crassum) within the Tumbes
mangrove area (INRENA, 2007; McClennen, 2004).
Deforested mangrove between 1962 and 2007 is mapped in Fig. 5
(see Supplementary Information for a colour version of Fig. 5). It
reveals that 1228 ha of mangrove have been destroyed, a figure close
to official data (1278e1294 ha) but less than claimed by environmentalists (3000e4500 ha) for that same time period. Depletion
represents about one sixth of the total mangrove area. The creation
in 1988 of a 2972 ha mangrove sanctuary, unique in Peru and further
recognized as a Ramsar site (wetland of international importance) in
1997, was a direct consequence of aquaculture development. It has
been effective in the limitation of encroachment by aquaculture
within the limits of the sanctuary but much less in its buffer area,
which comprises patches of dry forest and salt marsh and was
designed to reduce extractive activities such as logging. Conversion
of forested land to aquaculture had a direct impact on natural resources and on the level of ecological goods and services (Sathirathai
and Barbier, 2001). The extension of aquaculture at the expense of
mangrove habitat raises questions of sustainability because the
mangrove habitat supplies natural resources and ecosystem services of direct utilitarian value to shrimp farmers (post-larvae,
nutrient cycling). Because fish, molluscs and crustaceans that
depend on the mangrove habitat are routinely harvested by smallscale fisherfolk and collectors (INRENA, 2007), the reduction in
mangrove land cover has also negatively affected livelihoods.
Avulsion of the main Tumbes channel causing migration of the
river mouth has occurred several times as a consequence of Niñorelated floods. Fig. 5 maps the shoreline variations between 1962
and 2007 resulting from the beach erosion and accretion processes
in response to Niño events. Because of the limited number of
shrimp farms pumping Tumbes river water, the impact of flow
extraction on river discharge is deemed limited and thus has not
played a key role in the observed shoreline variation. Some farms,
however, have suffered the consequences of shoreline variations,
with several farms located near the beaches having ceased to
N
operate the more exposed ponds. Others farms have planted
mangrove vegetation in the hope of stabilizing the shoreline. There
is no evidence of newly developed farms since 2007 in the study
area. However, some new farms have appeared to the back of the
beach in the southern part of Tumbes Department. These new installations have caused detectable losses of dry forest.
4.2. Employment in the shrimp farming sector
Peru lacks official statistics about employment in the shrimp
farming sector (Evans and Tveteras, 2011). Based on our own data,
Fig. 6 shows the evolution of total employment between 1980 and
2006. Employment after 2006 was not computed because information about surface areas under semi-intensive and intensive
farming is scarce. A minimum was attained in 2001 (in the middle
of the WSS epidemic) with 439 full-time jobs, and the peak was
reached in 2006, with 2660 full-time jobs. This is consistent with
the estimation of 1130e2260 permanent employees given by Evans
and Tveteras (2011). Our estimate does not take into account the
post-larvae collectors (larveros) who used to work along the beaches and tidal channels until this activity was definitively banned in
2000. Most of them were previously in farming and came from the
Andean provinces during the shrimp boom (Peña-Ruiz, pers.
comm., April 2007). According to the INEI (2009), there were 4000
larveros in 1997 and only 300 in 2002. Approximately 70% of them
stayed in Tumbes after the ban (Peña-Ruiz, pers. comm., April
2007). On-farm permanent work is the most important source of
jobs before temporary work on farms and in conditioning plants.
The number of jobs has undergone important changes, with some
booms in 1986e1988, 1993e1997 and 2002e2006 and some busts
in 1990e1991 and 1998e2001. While busts are mostly related to
environmental shocks and viral outbreaks, booms are related to
economic incentives and technological innovation.
A more accurate estimate of the people directly or indirectly
dependant on aquaculture requires family members to be included
because wages are locally shared with household members or sent
Pacific Ocean
Depleted mangrove
Land mass
Puerto Pizarro
0
N
2,5
5
10 kilometers
1962 / 1991
Pacific Ocean
Recession
Progradation
Land mass
Rivers
Puerto Pizarro
0
2,5
5
10 kilometers
N
1991 / 2007
Pacific Ocean
Recession
Progradation
Land mass
Rivers
Puerto Pizarro
0
2,5
5
Fig. 5. Mangrove depleted by aquaculture between 1962 and 2007, with shoreline variations.
10 kilomete rs
�8
4000
F. Mialhe et al. / Ocean & Coastal Management 73 (2013) 1e12
Farm − temporary
Conditioning plant
3000
Total
Farm − permanent
Undeclared farms
El Niño
Intensification
2000
WSSV
0
1000
Full−time jobs
Cholera
PL shortage
1980
1985
1990
1995
2000
2005
Years
Fig. 6. Full-time jobs in the local shrimp commodity chain.
to the family by single migrants. Based on a conservative estimate
of three beneficiaries per household, a minimum population of
8000 is thus estimated to depend on aquacultural wages. This figure is based on the hypothesis of full-time employment in the
sector, but given that most of the workers are employed on a parttime basis, the estimated population reliant on aquaculture is likely
to exceed 10,000. This figure is less, however, than the estimate of
20,000 by Berger (2002).
The w10,000 jobs can be differentiated according to whether
they are contract-based or not, to wage levels, working conditions,
security levels, and variability in time. In Tumbes, the working
population represents 54% of the total (INEI, 2009). On that basis,
the proportion of the working population employed in the aquaculture commodity chain reached a maximum of 4% in the early
1990s. This estimation does not consider indirect employment
created through the local expenditure of wages, e.g. on transportation, food, accommodation, retail, construction, or leisure. It
also excludes activity losses (small-scale farming and livestock) in
dry forest areas due to land conversion.
4.3. Shrimp farming and migration
From the set of unskilled workers we interviewed, 81% of them
are internal migrants, all male and mostly young. An overwhelming
proportion of the migrants comes from Piura Department (87%),
which is the adjacent province to the south, 7% from Lima, 2% from
Cuzco, 2% from La Libertad and 2% from Cajamarca (Table 4 and
Fig. 7). Geographic proximity is evidently a cause in immigrant
provenance: Piura is the only Peruvian region contiguous with
Tumbes, with the two respective provincial capitals w300 km apart
by road. The bulk of migrants from the Piura region come from its
rural and mountainous eastern provinces. These consist of deep
valleys exposed to floods and soil erosion with small, lowproductivity farms (Rubio, 2007). Biophysical and agriculturerelated structural factors thus appear to be major constraints on
economic prosperity. This is confirmed by poverty and extreme
poverty indices, which are based on household level income and
expenditure (INEI, 2009) and are nationally much higher in the
mountainous provinces d respectively 72% and 39% d in the Andes
compared to 45% and 5% in the coastal areas (INEI, 2009). In Tumbes
Department the extreme poverty index is 7.4%. The advantages of
Tumbes are linked to factors already mentioned such as international trade and the production of export commodities such as rice,
banana and shrimp. The main migration stream, therefore, is
clearly from rural and mountainous to urban and coastal areas.
The three main motives given by the migrants for emigrating are
economic: they expect to improve their standard of living, find
a job, and support the household (Table 4). These all arise from push
factors. Push factors, which can either be environmental, economic
or social, are unfavourable conditions that prevail in the place of
origin; conversely, pull factors are attractive conditions that prevail
in the place of destination (Lee, 1966). In the last several years,
agriculture in Piura has been adversely affected by El Niño anomalies and by an absence of effective agricultural policies. Together,
these have further marginalized farmers who were already vulnerable to agrarian problems (Rubio, 2007). Pull factors are related
to needs in the labour market and to the presence of relatives or
acquaintances. The availability of jobs in shrimp farming ranks
third among the list of pull factors, with 22% of migrants choosing
Tumbes because of the aquaculture industry (Table 4). These factors
are linked to the existence of social networks, i.e. links between
individuals from the same community or kinship group, regardless
of their current place of residence, thus including prior migrants
(Massey, 1990). The existence of these social networks, where information about economic opportunities is intensively exchanged,
explains why the migrants have chosen Tumbes and why almost
half of them were aware of job opportunities in shrimp farming
before leaving Piura. Social capital, i.e. the network together with
the information or resources shared among individuals, thus contributes to the emergence of migration as a livelihood strategy by
providing a direction to potential migrants. Social capital completes
the pushepull paradigm, which successfully explained the difference between places of origin and destination but failed to explain
why and how people move to a place with qualities similar to those
of other places (Curran, 2002).
The members of the social networks also support the migrants
during the initial job seeking stages: earlier migrants succeed in
securing jobs on their farm for new migrants by virtue of the
mutual trust that has already had a chance to grow between them
and the shrimp farm manager. Several data confirm that statement:
our survey indicated that 97% of the workers had obtained their
jobs through their social networks and that 80% of them had
a relative already working in shrimp farming. As a result, every
farm includes several clusters of workers coming from the same
geographical area or from the same kinship group, thus confirming
the more widely recognized importance of social capital in migration patterns (Portes, 1995; Gray, 2009). The presence of prior migrants within the social network fuels the influx of new migrants
because the latter are informed of opportunity costs and are provided with appropriate material reassurances (Curran, 2002).
A majority of migrants (68.5%) send remittances to their family.
On average, farm workers send 40% of their wages to their families,
i.e. 231 soles1 for an average monthly salary of 573 soles. These
savings are declared to be mostly invested in the services sector in
the province of origin, such as grocery retailing or automobile
repair, or are used for basic household needs. Although this aspect
would require a more detailed analysis, previous studies in Andean
countries and in Asia have shown that remittances and return
migration sometimes reduce social resilience and increase inequalities between individuals and households within and between home villages because wealth is not redistributed (Adger
et al., 2002; Lipton, 1980). One of the consequences of these migrations is the evolution of the gender ratio in Tumbes Department,
which has increased from 106 males for 100 females in 1993 to
112:100 in 2005 (INEI, 2009). In 1993, considering just the more
recent migrants, the ratio even reached 135:100 (INEI, 2009). This
1
The currency rate exchange between US dollar and Peruvian sol in April 2007
was: 1 USD ¼ 3.06 soles.
�9
F. Mialhe et al. / Ocean & Coastal Management 73 (2013) 1e12
Table 4
Characteristics of migrant population based on field surveys (n ¼ 57).
Variables (various units)
Results
Former region of residence (%)
Time already spent in Tumbes (years)
Average
Standard deviation
Main reason for migration (%)
Piura (87), Lima (7), Cuzco (2), Cajamarca (2), La Libertad (2)
6.6
6.3
Improve standard of living (53), Find a job (51), Help the
household (45), Exerce the present position (11), Live with
relatives (7)
More working opportunities (66), Known resident person (35),
Shrimp farming (22)
No (54), Yes (46)
Reason for choosing Tumbes (%)
Awareness of shrimp farming jobs
before leaving (%)
Decision to migrate (%)
Migration participants (%)
First job after arrival (%)
Personal (90), Household (10)
Alone (64), With family members (26), Other (10)
Shrimp farming (67), Agriculture (10), Manufacturing (2),
Services (21)
Through friend (54), Through relative (43)
Access to present job in shrimp
farming (%)
Remittances sent home (%)
Average monthly remittances (pesos)
Average proportion of wage remitted
(%)
Estimated future duration of stay in
Tumbes (%)
Yes (68.5), No (31.5)
231
40
Forever (20), 5 more years (9), From 1 to 5 years (22),
Less than 1 year (14), Do not know (35)
imbalance has begun to pose serious local demographic challenges
involving fertility and household renewal issues.
Although the majority of the population is employed on a permanent basis, immigrants and locals do not occupy the same jobs
on the farms (Table 5). Locals obtain the better paid jobs in maintenance and management. Furthermore, skilled jobs (not surveyed
here) are dominated by locals with higher educational status. These
advantages secure positions with higher income and fewer working hours. For immigrants, the relatively lower condition is
expressed by a greater willingness to change jobs. Work in shrimp
farming is a transitional activity for the immigrants, who spend
much less average time in this occupation than the non-migrants
(4.6 against 8.8 years, respectively). The future of immigrants after having left shrimp farming needs to be thoroughly investigated
but local informants declared that they either chose to stay (then
working in the services or fisheries sector, or as seafood collectors),
returned to their homestead, or emigrated to Ecuador or to
southern Peru. These are common situations but they were dramatically intensified during the El Niño and WSS events. The
population involved in resource extraction from the mangrove
N
Ferrenafe
Pacific Ocean
Zarumilla
B
Tumbes
C
Pacific Ocean
Huamanga
Pacasmayo
Contralmirante villar
Tumbes department
ECUADOR
A
ECUADOR
Piura department
A
PERU
B
Ayacaba
Pacific Ocean
Lima
Piura
C
Morropon
Huacabamba
Nber of shrimp farm
workers per district of origin
Sechura
0
25
50
75
100 kilometers
1
6-7
Department
2
9
Province
3-4
12
Fig. 7. Geographic origin and number of shrimp farm workers interviewed.
�10
F. Mialhe et al. / Ocean & Coastal Management 73 (2013) 1e12
Table 5
Socio-economic profiles of immigrants and locals.
Variable (various units)
Immigrant
(n ¼ 57)
Local
(n ¼ 13)
Average age (years)
Time spent in shrimp
farming (years)
Life cycle status (%)
Single
Married
Cohabiting
Average number of
children
Education level (%)
Primary
Secondary
Further/Higher
Previous job (%)
Primary sector
Manufacturing
Services
Other
Contract type (%)
Permanent
Temporary
Present work on
farma (%)
Production
Security
Maintenance
Management
Ancillaryb
Weekly hours (h)
Mean wage (pesos)
Willingness to change
jobs (%)
31
4.6
33
8.8
58
21
21
1.2
31
61
8
1.5
30
65
5
31
38
31
46
6
40
8
31
23
38
8
87
13
92
8
51
29
10
4
6
61
573
Yes (78)
No (22)
38.5
15
38.5
8
0
53
682
Yes (42)
No (58)
a
Production encompasses activities dedicated to the grow-out of farmed
shrimps: feeding, fertilizing, pond cleaning, harvest. Security refers to guarding the
farms against intruders. Maintenance includes the maintenance of the material used
in production such as pumps or aerators. Management refers to decision making
with regard to buying the inputs, to the daily operation of the farm, and to timing of
the harvest.
b
On-farm ancillary work involves activities such as cooking and cleaning the
buildings.
sanctuary, for example, consists predominantly (65%) of migrants
mainly originating from Piura department (Ayabaca, Huancabamba
and Morropon provinces) (INRENA, 2007).
Overall, immigrants are deemed to play an important role in the
economic viability of Tumbes shrimp farms because of the lower
labour costs compared to wage expectations among the local
population. This is important because reducing the cost of labour is
a major target among shrimp farm owners in order to remain
competitive. The clustering of relatives and acquaintances at farm
level also strengthens trust between shrimp farmers and workers.
For the migrants, the advantages of a job on a shrimp farm are
linked to the contractual engagement in which they find security
even though the contract can be easily broken. Shrimp farms also
provide a job soon upon arrival, thus reducing the costs of migration. Consequently, even though shrimp farming as a pull factor
remains weaker than the push factors previously mentioned, the
rise of aquaculture has evidently contributed to an influx of labour
facilitated by the information provided by prior migrants about
employment opportunities in Tumbes.
4.4. Shrimp farming, society and the environment in Tumbes
4.4.1. Existing environmental safeguards and outstanding issues
The previous sections have provided some insights into land use
change, employment in the shrimp farming sector, and internal
migratory flows towards Tumbes. Together, those insights illuminate
how shrimp farming in Peru has redefined the interactions between
population and the environment. Through its dual process of
extensification and intensification, and also its relatively volatile
productivity determined by environmental and market factors,
shrimp farming has shaped the natural and social environments
through its unprecedented use and degradation of natural resources
as well as by its requirements in terms of labour. Shrimp farming has
also suffered under the impacts of its own externalities such as the
pollution of canals by effluents. During the recent intensification of
the industry, labour requirements grew and attractivity to migrants
likewise increased. Further integration of these immigrants into the
local economy poses an ecological threat from the moment they
choose to exploit natural resources, but can also be beneficial to locals
because immigrants are more willing to occupy the low-wage jobs.
Due to increasing population in the coastal area, growing inequalities
between skilled and unskilled workers and the competing uses of
natural resources between various stakeholders have led on some
farms to acts of sabotage, arson and theft. Conflicts have opposed
shrimp farmers to inhabitants of Puerto Pizarro who live on the periphery of the shrimp farms.
The principles of Integrated Coastal Management have never
been implemented in the Tumbes region. Most of the policies that
rule the use of natural resources are sectorial and concern isolated
segments of the territory. Conservation-oriented management
initiatives were nonetheless adopted to tackle the depletion of
natural resources, the most important policies dedicated to the
conservation of coastal ecosystems having been promulgated in
1978 (protection of channels, mangrove and dry forest) and 1988
(creation of the mangrove sanctuary and its buffer zone). The
sanctuary was created because of the growth of shrimp ponds in
the biodiversity-rich coastal habitats. The enforcement of rules
dedicated to curbing shrimp farm encroachment on the sanctuary
limits has proved to be more effective than in the sanctuary’s buffer
zone. Shrimp farm implantation has continued in the buffer zone,
which is an area where conservation practices and more sustainable activities should have prevailed.
Slack enforcement encourages over-harvesting of aquatic organisms within the sanctuary boundaries by individual collectors,
who also ignore best practice rules such as a restriction of harvesting activities during the spawning season. The ban in 2000 on
wild post-larvae collection along the beaches and tidal channels,
which was designed to prevent the intrusion of virus-bearing larvae into the production ponds, positively contributed to a reduction
of industry-related environmental impacts not just because it helped to restore the importance of post-larvae in the food chain, but
also because the post-larvae harvesting was carried out using finemeshed netting, a practice which entailed unsustainable by-catch
of other aquatic organisms. The management of natural resources
within the sanctuary was also devolved to the local community
after 1999 through the creation of a Management Committee,
which includes ordinary citizens, representatives of the shrimp
industry, academic institutions and some small-scale farmers and
fisherfolk. The purpose of the Committee is to ensure the sustainable use of natural resources within the sanctuary and in its buffer
zone. On the ground, dialogue remains limited but some progress
has occurred through the constitution of action groups dedicated to
promoting tourism in the sanctuary. A recent collaborative project
has been successfully developed by shrimp farmers, NGOs and the
SERNANP (Servicio Nacional de Areas Nacionales Protegidas) for
the production of spats of Anadara tuberculosis, a local and overexploited mollusc, with a particular focus on genetic diversity and
disease prevention. Overall, the management policies still remain
exceedingly sectorial, i.e. do not take sufficient account of the diversity of coastal activities and their interactions. Their scope is also
limited in that they do not consider the entire coastal zone as an
�F. Mialhe et al. / Ocean & Coastal Management 73 (2013) 1e12
integrated system. Finally, they remain largely ineffective because
the existing regulatory framework lacks the appropriate resources
for enforcement.
Environmental regulations dedicated to controlling the effluents
released by shrimp farms were introduced in 1994. All new farms
were forced to carry out an environmental impact assessment (EIA)
by a certified agency, and farms above 50 ha were required to produce an EIA declaration every six months. However, local officials
openly admit that farms do not comply with the rules. Encroachments and the absence of EIA compliance point to a connivance
between the shrimp industry, politicians and environmental agency
employees, both at local and national level. In addition to giving the
industry an opportunity to be competitive in the international
marketplace, the numerous fiscal advantages granted to the industry are also interpreted as a consequence of cronyism.
Among the more positive recent developments, the strong
reduction of antibiotics and substitution by native probiotics isolated from the wild shrimp microbiota is a welcome noteworthy (E.
Mialhe, pers. comm. October 2012). The methodology for shrimp
virus diagnosis based on molecular tools also promises a decrease
of viral outbreaks into the environment, subsequently decreasing
impacts on wild shrimp populations.
Local officials also recognize the existence of many unauthorized farms, particularly in the more remote areas. Some of them
were visited during the course of this study. These illegal farms
maintain a tacit agreement with authorized farms to sell their
produce to the conditioning plants, which require the farmers to be
declared. This informal system is well known but the willingness or
resources to police it remain elusive.
4.4.2. Outlook for the future
The findings brought into focus by this study provide a basis for
formulating a few recommendations towards an improvement of
coastal management in Tumbes. Although the perspective adopted
here has been restricted to shrimp farming and does not, therefore,
authorize prescriptions relevant to all aspects of Integrated Coastal
Management, considerations regarding land use planning, social
welfare and local governance would suggest the following priorities: (i) stricter urban planning in the vicinity of existing ponds in
order to limit the total length of direct contact between residential
land use and ponds; (ii) a moratorium on habitat fragmentation
through stronger enforcement of existing resource harvesting policies; (iii) a regeneration of forest habitats and a restoration of bare
soil areas (beaches, salt marshes); (iv) improved design of canals for
both water intake and effluents. (v) Better monitoring of immigrant
labour should also help to anticipate the increase in local demand for
goods and services. Migrant workers would also gain from a stricter
enforcement of labour laws, which would not only improve their
economic status and working conditions but could also limit the
urge to engage unsustainably in the harvesting of wild species.
The setting up of the Management Committee in 1999 remains
a landmark among the more innovative governance schemes in the
region. Other frameworks conducive to dialogue between the different agencies involved in shrimp farming are called for, one being
cross-border cooperation with Ecuador. This perspective would
allow watershed-scale integrated planning, particularly given that
gold mining activity in the Ecuadorian part of the Tumbes river
catchment has been releasing inorganic mercury and sodium cyanide in the water, which raises concerns for the shrimp production
in the coastal areas (Guimaraes et al., 2011).
5. Conclusion
This case study has analysed some impacts triggered by the
development of shrimp farming in northern Peru. Since the first
11
appearance of ponds in the late 1970s, shrimp farming has experienced severe upsets due to external environmental factors such as
El Niño and world market instabilities, but also to internal mismanagement. The growth of aquaculture has also induced social
and economic changes: shrimp farming has created a labour market draining migrants from poorer mountainous regions. In addition to the attraction exerted by shrimp farming, social capital was
also found to be a major driver of migration. The production chain
relies on a diversity of segmented labour tasks. Shrimp farming was
estimated to support the livelihoods of 10,000 individuals contributing to the local economy, but a more thorough diagnosis
would also require accounting for livelihoods that were destroyed
or stifled by the development of commercial aquaculture. By
remote sensing analysis we quantified and qualified the areas over
which aquaculture-related land use has expanded. As in other
contexts throughout the Tropics, aquaculture has expanded at the
expense of mangrove but the intensity with which this has occurred must be put into perspective because aquaculture has also
developed over land cover categories initially detected as bare soil,
dry forest, and savanna. A moratorium on the destruction of relict
mangroves has been in place since 1988 through enforcement of
a habitat conservation policy. Recent history reveals several adaptations of the local socialeecological system such as the adoption of
new management practices and an intensification of production
systems. By providing a quantitative account of changes in land use,
farmed shrimp production, labour markets and a qualitative
assessment of migratory flows, this case study contributes to the
ongoing global debate on the processes and policies best adapted to
attaining sustainability in resource allocation and management. It
promotes a holistic perspective on the impacts of shrimp farming
on the socioeconomic and natural environments at the local and
regional levels, with global ramifications and feedbacks relating to
world markets and to epidemiological and climatic hazards.
Acknowledgements
The authors acknowledge the Isis program, Centre National
d’Etudes Spatiales (CNES), for providing SPOT 5 images at a negotiated price. Three anonymous reviewers contributed helpful
comments, resulting in a more balanced treatment of the many
issues and specialisms that we have attempted to combine here in
a cross-disciplinary synthesis.
Appendix A. Supplementary data
Supplementary data related to this article can be found at http://
dx.doi.org/10.1016/j.ocecoaman.2012.12.014.
References
Adduci, M., 2009. Neoliberal wave rocks Chilika lake, India: conflict over intensive
aquaculture from a class perspective. J. Agrar Change 9 (4), 484e511.
Adger, W.N., Kelly, P.M., Winkels, A., Huy, L.Q., Locke, C., 2002. Migration, remittances, livelihood trajectories, and social resilience. Ambio 31, 358e366.
Armitage, D., 2002. Socio-institutional dynamics and the political ecology of
mangrove forest conservation in Central Sulawesi, Indonesia. Glob. Environ.
Change 12, 203e217.
Asian Development Bank (ADB), 2004. Special Evaluation Study on Small-scale
Freshwater Rural Aquaculture Development for Poverty Reduction. Operations
Evaluation Department SST. REG 2004-07.
Bailey, C., 1988. The social consequences of tropical shrimp mariculture development. Ocean Shore Manag. 11 (1), 31e44.
Barbier, E.B., Koch, E.W., Silliman, B.R., Hacker, S.D., Wolanski, E., Primavera, J.,
Granek, E.K., Polasky, S., Aswani, S., Cramer, L.A., Stoms, D.M., Kennedy, C.J.,
Bael, D., Kappel, C.V., Perillo, G.M.E., Reed, D.J., 2008. Coastal ecosystem-based
management with non-linear functions and values. Science 319, 321e323.
Barham, B., Clark, M., Katz, E., Schurman, R., 1992. Nontraditional agricultural exports in Latin America. Lat. Am. Res. Rev. 27 (2), 43e82.
�12
F. Mialhe et al. / Ocean & Coastal Management 73 (2013) 1e12
Béné, C., 2005. The good, the bad and the ugly: discourse, policy controversies and
the role of science in the politics of shrimp farming development. Dev. Policy
Rev. 23 (5), 585e614.
Berger, C., 2002. Situacion del cultivo de langostinos en el Peru. In: Proceedings of
the Primer congreso nacional de acuicultura, Lima.
Berger, C., Quispe, M., Talavera, V., 2004. Programa Nacional para la competitividad
de la acuicultura langostinera en el Peru 2005-2014. Asociación langostinera
Peruana (ALPE).
Berlanga-Robles, C.A., Ruiz-Luna, A., Bocco, G., Vekerdy, Z., 2011. Spatial analysis of
the impact of shrimp culture on the coastal wetlands on the Northern coast of
Sinaloa, Mexico. Ocean Coast Manag. 54, 535e543.
Best, B., Kessler, M., 1995. Biodiversity and Conservation in Tumbesian Ecuador and
Peru. BirdLife International, Cambridge.
Biao, X., Kaijin, Y., 2007. Shrimp farming in China: operating characteristics, environmental impact and perspectives. Ocean Coast Manag. 50, 538e550.
Campbell, J., Wynne, R., 2011. Introduction to Remote Sensing, fifth ed. The Guilford
Press, New York.
Chavez, P.S., Kwarteng, A.Y., 1989. Extraction spectral contrast in Landsat Thematic
Mapper image data using selective principal component analysis. Photogramm.
Eng. Rem. Sens. 55, 339e348.
Chua, T.-.E., Bonga, D., Bermas-Atrigenio, N., 2006. Dynamics of integrated coastal
management: PEMSEA’s experience. Coast Manag. 34 (3), 303e322.
Curran, S., 2002. Migration, social capital and the environment: considering
migrant selectivity and network in relation to coastal ecosystems. Popul. Dev.
28, 89e125.
Dai, X., 1998. The effects of image misregistration on the accuracy of remotely
sensed change detection. IEEE Trans. Geosci. Rem. Sci. 36 (5), 1566e1577.
Edwards, P., 2000. Aquaculture poverty impacts and livelihoods. ODI Nat. Res.
Perspect. 56, 1e4.
Eklundh, L., Singh, A., 1993. A comparative analysis of standardised and unstandardised Principal Component Analysis in remote sensing. Int. J. Rem. Sens. 14
(7), 1359e1370.
Evans, Y., Tveteras, S., 2011. Status of Fisheries and Aquaculture Development in
Peru: Case Studies of Peruvian Anchovy Fishery, Shrimp Aquaculture, Trout
Aquaculture and Scallop Aquaculture. FAO, Background Report.
FAO, 2010. The State of World Fisheries and Aquaculture. FAO Fisheries and Aquaculture Department, Rome.
FAO, 2012. Aquaculture Production 1950e2010. FishStat Plus. FAO Fisheries and
Aquaculture Information and Statistics Service, Rome.
Flaherty, M., Vandergeest, P., 1998. Low-salt shrimp aquaculture in Thailand:
goodbye coastline, Hello Khon Kaen! Environ. Manag. 22 (6), 817e830.
Foody, G.M., 2002. Status of land cover classification accuracy assessment. Rem.
Sens. Environ. 80, 185e201.
Foody, G.M., 2004. Thematic map comparison: evaluating the statistical significance
of differences in classification accuracy. Photogramm. Eng. Rem. Sens. 70 (5),
627e633.
Goss, J., Burch, D., Rickson, R.E., 2000. Agri-food restructuring and third world
transnationals: Thailand, the CP group and the global shrimp industry. World
Dev. 28 (3), 513e530.
Gräslund, S., Bengtsson, B.-E., 2001. Chemicals and biological products used in
south-east Asian shrimp farming, and their potential effect on the environment
e a review. Sci. Total Environ. 280 (1e3), 93e131.
Gray, C.L., 2009. Environment, Land, and rural out-migration in the southern
Ecuadorian Andes. World Dev. 37 (2), 457e468.
Green, E.P., Mumby, P.J., Edwards, A.J., Clark, C.D., 1996. A review of remote sensing
for the assessment and management of tropical coastal resources. Coast Manag.
24 (1), 1e40.
Guimaraes, J.R.D., Betancourt, O., Miranda, M.R., Barriga, R., Cueva, E., Betancourt, S.,
2011. Long-range effect of cyanide on mercury methylation in a gold mining
area of Southern Ecuador. Sci. Total Environ. 409, 5026e5033.
Hall, D., 2004. Explaining the diversity of Southeast Asian shrimp farming aquaculture. J. Agrar Change 4 (3), 315e355.
Hamilton, S.E., 2011. The Impact of Shrimp Farming on Mangrove Ecosystems and
Local Livelihoods along the Pacific Coast of Ecuador. PhD thesis., the University
of Southern Mississippi.
Heck, S., Béné, C., Reyes-Gaskin, R., 2007. Investing in African fisheries: building
links to the Millenium Development goals. Fish Fish 8 (3), 211e226.
Hishamunda, N., Ridler, N.B., 2006. Farming fish for profits: a small step towards
food security in sub-Saharan Africa. Food Pol. 31 (5), 401e414.
Hui, F., Xu, B., Huang, H., Yu, Q., Gong, P., 2008. Modelling spatial-temporal change
of Poyang Lake using multitemporal Landsat imagery. Int. J. Rem. Sens. 29 (20),
5767e5784.
Instituto Nacional de Estadistica e Informatica (INEI), 2009. Perfil sociodemografico
del departamento de Tumbes. Instituto Nacional de Estadistica e Informatica,
Lima.
Instituto Nacional de Recursos Naturales (INRENA), 2007. Plan maestro del santuario nacional los manglares de Tumbes 2007e2011. Instituto Nacional de
Recursos Naturales, Lima.
Islam, M.S., 2008. From pond to plate: towards a twin-driven commodity chain in
Bangladesh shrimp aquaculture. Food Pol. 33 (3), 209e223.
Lee, E.S., 1966. A theory of migration. Demography 3 (1), 47e57.
Lillesand, T., Kiefer, R.W., Chipman, J., 2007. Remote Sensing and Image Interpretation, sixth ed. J. Wiley & Sons, New York.
Lipton, M., 1980. Migration from rural areas of poor countries: the impact on rural
productivity and income distribution. World Dev. 8 (1), 1e24.
Lu, D., Weng, Q., 2007. A survey of image classification methods and techniques for
improving classification performance. Int. J. Rem. Sens. 28 (5), 823e870.
Malecki, E.J., 1997. Technology and Economic Development: the Dynamics of Local,
Regional and National Competitiveness. Longman, London.
Massey, D., 1990. Social structure, household strategies, and the cumulative causation of migration. Popul. Index 56 (1), 3e26.
McClennen, C., 2004. White Spot Syndrome Virus. The Economic, Environmental
and Technical Implications on the Development of Latin American Shrimp
Farming. M.A. thesis., Tufts University, Medford.
Mialhe, F., 2010. Le développement de l’aquaculture saumâtre dans l’Aire Pacifique.
Evolution des paysages, dynamiques socio-économiques et impacts environnementaux dans deux territoires au Pérou et aux Philippines. PhD thesis.,
Université Paris 7 Diderot, Paris.
Myint, H., 1958. The ‘Classical Theory’ of international trade and the underdeveloped countries. Econ. J. 68, 317e337.
Pàez-Osuna, F., 2001. The environmental impact of shrimp aquaculture: causes,
effects and mitigating alternatives. Environ. Manag. 28 (1), 131e140.
Paul, B.G., Vogl, C.R., 2011. Impacts of shrimp farming in Bangladesh: challenges and
alternatives. Ocean Coast Manag. 54 (3), 201e211.
Portes, A., 1995. The Economic Sociology of Immigration: Essays on Networks,
Ethnicity, and Entrepreneurship. Russell Sage Foundation, New York.
Primavera, J.H., 1997. Socio-economic impacts of shrimp culture. Aquac. Res. 28,
815e827.
Primavera, J.H., 2006. Overcoming the impacts of aquaculture on the coastal zone.
Ocean Coast Manag. 49 (9e10), 531e545.
Resurrección, B.P., Sajor, E.E., 2010. “Not a real worker”: gendering migrants in
Thailand’s shrimp farms. Int. Migrat. 48 (6), 102e131.
Rogan, J., Chen, D.M., 2004. Remote sensing technology for mapping and monitoring land-cover and land-use change. Prog. Plann. 61, 301e325.
Rubio, E.T., 2007. Climate Change Impacts and Adaptation in Peru: the Case of Puno
and Piura. Human Development Report, UNDP.
Sathirathai, S., Barbier, E., 2001. Valuing mangrove conservation in southern Thailand. Contemp. Econ. Pol. 19, 109e122.
Singh, A., 1989. Digital change detection techniques using remotely-sensed data.
Int. J. Rem. Sens. 10 (6), 989e1003.
Stokstad, E., 2010. Down on the shrimp. Science 328, 1504e1505.
Stonich, S.C., 1995. The environmental quality and social justice implications of
shrimp mariculture development in Honduras. Hum. Ecol. 23 (2), 143e168.
Story, M., Congalton, R., 1986. Accuracy assessment: a user’s perspective. Photogramm. Eng. Rem. Sens. 52 (3), 397e399.
Thorpe, A., Ibarra, A.A., Reid, C., 2000. The new economic model and marine fisheries development in Latin America. World Dev. 28 (9), 1689e1702.
Tiebout, C., 1956. A pure theory of local expenditures. J. Polit. Econ. 64 (5),
416e424.
Twilley, R.R., Montano, M., Valdivieso, J.M., Bodero, A., 1999. The environmental
quality of coastal ecosystems in Ecuador: implications for the development of
integrated mangrove and shrimp pond management. In: Yanez-Arancibia, A.,
Lara-Dominguez, A.L. (Eds.), Ecosistemas de manglar en America Tropical.
IUCN/ORMA, NOAA/NMFS, pp. 199e230.
Valderrama, D., Hishamunda, N., Zhou, X., 2010. Estimating employment in world
aquaculture. FAO Aquacult. Newsl. 45, 24e25.
Valiela, I., Bowen, J.L., York, J.K., 2001. Mangrove forests: one of the world’s
threatened major tropical environments. BioScience 51 (10), 807e815.
�
 C. Mering