ECOLOGICAL ENGINEERING
& ENVIRONMENTAL TECHNOLOGY
Ecological Engineering & Environmental Technology 2022, 23(6), 128–139
https://doi.org/10.12912/27197050/152954
ISSN 2719-7050, License CC-BY 4.0
Received: 2022.07.01
Accepted: 2022.08.24
Published: 2022.09.07
Estimation of Seismic Kappa Parameter and Near-Surface
Attenuation in Morocco
Abderrahim Boulanouar1*, Himanshu Mittal2, Abdelaali Rahmouni3,
Ahmed Zian4, Mimoun Chourak5, Yves Géraud6, Mimoun Harnafi7, Jamal Sebbani8
1
Laboratory of Applied Sciences, National School of Applied Sciences, Abdelmalek Essaadi University, 03 Al
Hoceima, Morocco
2
National Center for Seismology, Ministry of Earth Sciences, New Delhi, 110003, India
3
Laboratory of Solid State Physics, Department of Physics, Faculty of Science Dhar El Mahraz, Sidi Mohamed
Ben Abdellah University, Fez 1796, Fez-Atlas, Morocco
4
Laboratory of Engineering Sciences and Applications, National School of Applied Sciences, Abdelmalek
Essaadi University, 03 Al Hoceima, Morocco
5
Laboratory of Applied Science, National School of Applied Sciences, Mohammed First University, Oujda
60000, Morocco
6
University of Lorraine, ENSG, UMR 7359-GeoRessources, Nancy Cedex, France
7
Earth Science Department, Scientific Institute, Mohamed V University, P.O. Box 1014, Rabat, Morocco
8
Mechanics and Materials Team, Faculty of Science, Mohammed V University, P.O. Box 1014, Rabat, Morocco
* Corresponding author’s email: aboulanouar1@gmail.com
ABSTRACT
The goal of this study is to estimate the kappa (κ) parameter for a group of 12 broadband stations, located in different geological structures in Morocco, a country with moderate seismic activity. In this study, the kappa, κ has
been obtained from the spectral analysis of the shear waves of 42 earthquakes, recorded in Morocco. Using 321
seismograms recorded in the period between 2009 and 2012 by the Picasso Project, the average κ-values have been
computed from the horizontal components. For each station, the relationship between κ values and the hypocentral
distance was determined. We separately investigated and studied the distance dependence of the stations located
on soft soil and hard rock sites. The estimated average factor of the κ value ranges from 0.0682 for the hard sites to
0.0763 for the soft sites, with 0.072 as an average value. The lack of a significant correlation found between κ and
magnitude at all stations considered in this study suggests that kappa is mainly dependent on local site characteristics. To the best of our knowledge, no studies related to kappa parameter estimation have been published for this
region. The results generated in this study can be used for the seismic hazard evaluation of Morocco.
Keywords: kappa parameter, PICASSO Project, Morocco.
INTRODUCTION
In recent years, the Rif area in northern Morocco has witnessed several events (Al Hoceima
earthquakes of 1994, 2004, and 2016) (Kariche
et al., 2018; Boulanouar et al., 2013, Galindo‐
Zaldivar et al., 2018). Al Hoceima is one of the
seismically active areas in northern Morocco
128
(Boulanouar et al., 2018). Large seismic events
that have been recorded and documented in seismic catalogs and research papers are evidence
of this fact. This region was devastated by three
severe earthquakes with moment magnitudes of
more than 6 on May 26, 1994, February 24, 2004,
and January 25, 2016 (Kariche et al., 2018). Any
significant/major earthquake in the future in this
�Ecological Engineering & Environmental Technology 2022, 23(6), 128–139
region will result in a significant loss of property
and human life. To reduce the earthquake losses,
seismic hazard prediction and later application to
building structures, as well as the development of
Morocco’s current seismic code (RPS2011), are
required. The kappa parameter has been identified
as one of the critical parameters necessary for the
evaluation of seismic hazard of a region (Yadav et
al., 2018; Chandler et al., 2006).
In terms of seismic risk, areas with lower
kappa values tend to have bigger ground motions
than areas with higher kappa values (Douglas et
al., 2010). The spectral spectrum kappa parameter
κ measures the high-frequency amplitudes decay
of ground motion (Biro et al., 2020). This parameter is influenced by several parameters including
source parameters, velocity, propagation path, and
local site characteristics (Perron et al., 2017). The
kappa k parameter, which governs the decay of
the acceleration spectrum for seismic recordings
at high frequencies, is considered one of the most
essential parameters to study the ground motion
characteristics. Especially, it represents the range
of attenuation energy and it is used as input for
simulating strong ground motion in regions with
insufficient data (Yadav et al., 2018). Several studies have been done to identify this parameter for
various regions of the world (Van Houtte et al.,
2011; Lai et al., 2016; Stanko et al., 2020; Mittal
et al. 2021, 2022). Yadav et al. (2018) investigated
the decay of the kappa parameter in the North East
region of India using 598 accelerograms. They
concluded that the vertical kappa values are lower
than the horizontal estimations. Moreover, they
observed that there was no statistically significant
relationship between hypocentral distance and
kappa or magnitude. Using Anderson and Hough
(1984) approach for two station sites, Stanko et al.
(2020) determined the kappa value for the seismic
zone in Zagreb city (Croatia). According to this
study, Vs30 and the predicted near-site attenuation
k0 are well correlated. In addition, the value of the
k0 was lower for hard rocks and higher for soft
rocks. For the northwest (NW) Himalayan region,
Mittal et al. (2022) studied attenuation characteristics using 81 recorded earthquakes at 50 stations.
They estimated kappa values and concluded that
kappa ranges from 0.03 s to 0.095 s and is higher
at the sites having sediment accumulation. Similarly, Mittal et al. (2021) estimated kappa in the
Delhi region of India. Another research on kappa
and its variation in distance utilizing 114 records
was applied in Northwestern Iran (Samaei et al.
2016). In this work, the linear representation has
a limited dependence, and they propose a clear
concavity dependence in distance. The value of
kappa at a great distance is observed to increase at
a higher rate than at a small distance.
The main goal of this study is to estimate the
kappa parameter using 12 seismic stations. The
Fourier amplitude spectrum decay of acceleration
in high-frequency bands for 42 local earthquakes
recorded by the Picasso Project in the period between 2009 and 2012 in Morocco are analyzed
in the present work. The kappa model and their
R2 indices for northern Morocco were proposed
using linear regression at various seismic station
locations and for different hypocentral distances.
The possible dependence of the kappa (κ) on the
hypocentral distance and the magnitude of the
earthquake used in this study has been discussed.
The effects of soft soil and hard rock sites are investigated separately. The results of this investigation will help improve our comprehension of
how structures affect attenuation.
SEISMOTECTONIC SETTING
In Northwest Africa, the convergence of the
African and Eurasian Plates is manifested by a
complex and heterogeneous tectonic history, particularly in Northern Morocco and Western Algeria. One of the most important tectonic settings
is the Gibraltar Arc system, which occurs at the
western end of the Alpine orogenic belt (Morley,
1987), which includes the Alboran Sea and is surrounded by the Belt-Rif-Tell orogen. The main
structural domains of this region are the Rif and
tell mountains surrounding the Alboran Sea, the
Moroccan and Algerian Meseta, the Atlas Mountains, and the Sahara platform (Fig. 1).
This analysis is based on two groups of stations belonging to the two structural domains
described in the first paragraph: 1) The Rif and
Tell Mountains domain, and 2) The Atlas Mountains domain. Regarding the Rif and Tell ranges,
The estimated crustal thickness beneath the Rif
cordillera ranged from a maximum of 45/50 km
to a minimum of 30 km at the border with the
southern portion of the Alboran Sea (De Lis Mancilla et al., 2012). This domain is distinguished
by deep sedimentary, which is the result of complex tectonic movements (Chalouan et al., 2008;
El Fellah et al., 2019). It consists of three primary
structural domains:
129
�Ecological Engineering & Environmental Technology 2022, 23(6), 128–139
Figure 1. The main structural domains of the study area modified from (Khattach et al. 2013)
• the internal zone where these two stations (PM
04 and PM 07) are operated, consists of upper
and lower plates and contains Paleozoic rocks
covering Mesozoic-Cenozoic remnants (Chalouan et al., 2008);
• the complex Nappes of Flysch where PM 05
and PM 08 are deployed, are composed of two
major Nappes, the Mauritanian Nappes and
the massilian Nappes, which are formed in the
late Mesozoic (Upper and lower cretaceous),
Eocene-Oligocene and the early Miocene
(Chalouan et al., 2008; De Capoa et al., 2007);
• the external zone is separated into three structural zones: intrarif (Stations: PM 11), Mesorif, and Prerif, and it is mostly composed
of Cretaceous and Tertiary rocks (Andrieux,
1971; Chalouan et al, 2008).
During the 1994–2019 period, three catastrophic earthquakes occurred in the Rif region
near Al Hoceima city on January 25, 2016 (Mw
6.3), February 24, 2004 (Mw 6.4), and May 26,
1994 (Mw 6.0) (Arab et al., 2020). The last earthquake did not cause as much damage as the previous two due to its offshore location and was
only left on the coastline of the Rif region. While
earlier earthquakes, due to their inland location,
resulted in a big loss of life and caused significant damage to the infrastructure. In addition, in
contrast to other areas of the world, this zone of
130
the Iberian-African collision is characterized by
moderate seismicity. As can be seen in the map
of the seismicity of the Rif region (Arab et al.,
2020), seismic activity is primarily concentrated
within a 50-kilometer radius around Al Hoceima
city, south of Nador city, and northeast of the
coastline between Jebha and Tetouan city.
The Atlas Mountains are separated from the
Rif Mountains by the Rharb foreland basin, where
the Neogene and Quaternary sediments reach a
maximum depth of eight kilometers westward.
The Atlas Mountains, which are composed of Paleozoic, Mesozoic, and Tertiary rocks, are an intracontinental orogenic area situated between the
Rif and Tell Mountains. They consist of the High
Atlas, Middle Atlas, and Saharan Atlas in Morocco
and Algeria, respectively. In contrast to the general
WSW-ENE strike of the high Atlas and the Sahara
Atlas, the Middle Atlas range is oriented NE-SW.
Although elevations in the high Atlas reach over
4000 m, crustal thickness as revealed by available
seismic data is moderate (38–39 km), which does
not support crustal isostatic compensation (Fullea et al., 2007). Asthenosphere upwelling may
be contributing to the uplift of the Atlas of this
region (Seber et al., 1996). The Atlas Mountains
are flanked by comparatively less deformed areas.
The tectonic deformation in Western Maghreb is
related to the oblique NW-SE convergence, creating seismic activity which is diffuse and is mostly
�Ecological Engineering & Environmental Technology 2022, 23(6), 128–139
localized over the middle Atlas (Stations: PM21,
PM 22, PM 23, PM 24, PM 25, and PM 26) and
the Central High Atlas (Benouar, 1994).
SEISMIC DATA
During the 2009–2013 period, the XB network in Morocco, known as PICASSO Morocco
(PM), was in operation. This investigation is
based on 12 broadband stations located in different geological structures in northern Morocco.
These stations are separated into two geological
formations distinct. The Rif zone consists of the
six stations, namely, PM04, PM05; PM07, PM08;
PM011, and PM 036, whereas, the Medal Atlas
includes other six stations (PM21, PM22, PM23,
PM24, PM25, and PM26). Some of the stations
are located on rock sites, whereas, the others are
installed in soft soil environments. Table 1 shows
the descriptions of the seismic sites for the Select
Northern Morocco of the Picasso Project network. The stations used in this study are listed
by the name of the station. About 42 events and
Table 1. Seismic site descriptions for select Northern Morocco Picasso Project network, ordered by the name of
the station used in this study
Station name
PM04
PM05
PM07
PM08
PM11
PM21
PM22
PM23
PM24
PM25
PM26
PM36
Surface rock
It is a component of the complex Intra Rifain deposits: 1) The alluvial sediments of Oued Law River
extend and reach approximately three to four southeast of this station. 2) The station is s located
precisely between outcrop Triassic Gabbro in the Northwest and Pliocene sand and sandstone that are
part of the internal zone of the Rif, especially the Ghomarids unit. 3) the Sebtids unit from the southern
zone is located 4 kilometers away from the station which contains salt-gypsum deposits of the Trias.
It is part of the Flysch unit which is composed of Synclinal structures in the Northwestern and
southeastern direction, formed by marls of the upper cretaceous with anormal contact of Quaternary
alluvial sediments. The southwestern side is part of Numudien unit (Flysch unit) and is composed of
hercynien Microgranite (lower Miocene and Oligocene) that extends 5 kilometers. The Northeastern
side is part of Beni Ider uint (Flysch unit) composed of Eocene sediments deposits that extend by 5
kilometers.
Near this station, a part of the Complex Alpin epimetamorphism for the TIZGARIN unit (part of the
Sebtids unit) with a salt-gypsum deposit (Triassic evaporite beds) above the thinned continental crust of
the North Africa passive margin (Wildi, 1983, Chalouan et al, 2008). In the North of the station, part of
the polymetamorphism with the michaschiste deposit formed the Hercynian socle.
Part of the Flysch unit (Tisiren unit), is composed of Dolerite and gabbro for the lower cretaceous and
extends from the station 15 kilometers to the south. From 2 kilometers to the north of the station, a
complex intra-rifain deposit with outcrop Triassic gabbro is found.
Part of the Intra-rifain unit of the external zone of the Rif. It contains Quaternary sediments
(Villafranchien) that extent 8 kilometers east of the station surrounded by the big deposit of lower
cretaceous divided into two units: 1) The Ketama unit in the southeast (Albian -Aptien and Neocomien)
contained the Marls sediments and 2) TISIREN unit in the Northwest side which is part of the flysch unit
who are composed of Cretaceous-Lower Miocene detrital rocks.
Part of the Jurassic Red Sandstone which extends about 50 kilometers in the North. The nearest
plioquaternary basalts contact is 5 kilometers south of the station and after that, the Jurassic red
Sandstone and a few cretaceous sediments appear in the deeper south. The serpentine and basic rock
is in the west of the station.
Part of the Pleated Middle Atlas is constituted by 4 kilometers of schist-sandstone and conglomerate
deposits and is surrounded by Jurassic Red Sandstone which extends 10 kilometers in the south and
more than 20 kilometers in the north. The northeastern side consists of Pleistocene Lake facies within
30 kilometers. Its extension is found in the south of the area within 25 kilometers.
This station is near the last station but with the Pleistocene Lake facies and schist-sandstone +
conglomerates deposit. The basaltic formation does not exceed a few hundred meters.
This station is situated in the center of the Devonian formation. To the north and northwest, there are
some outcrops of Permian age rocks not exceeding a few kilometers and surrounded by Pleistocene
Lake facies. The same outcrop Permian surrounded Red Sandstone and detritus facies on the
Northeast side.
The station is located at the limit between Jurassic Red Sandstone from the west, Pleistocene Lake
facies in the east, Cretaceous Detritus facies in the north, and quaternary sediments in the south. It is
situated about 7 kilometers toward the extreme south of the chain of the High Atlas which contained
basaltic rocks.
Part of the High Atlas with homogeneous basaltic rocks of the Jurassic and Lias age. It’s extending from
the north to the south about 78 kilometers. The station is situated in the middle this formation.
Located in the Medal Quaternary sediments extend about 10 kilometers in the south of the station
which is bounded by salt-gypsum deposit (Triassic evaporite beds) in the southeastern area. The North
boundary of the Quaternary sediments is 400 meters near the station and extends 17 kilometers from
the station which is composed of a complex deposit of cretaceous and salt-gypsum materials.
131
�=
−
Ecological Engineering & Environmental Technology 2022, 23(6), 128–139
321 seismograms with magnitudes from 1.9 to
4.8 mb are chosen to study the high-frequency
attenuation parameter kappa for northern Morocco. In particular, 38 events had a magnitude
greater than 3. The depth and epicentral distance
of the events vary from 0 to 97.9 km, and from
9.7 to 373.58 km, respectively. Digital data were
collected at a rate of 50 samples per second. An
example of three-component velocity data (Vertical, north-south, and east-west component) recorded by the PM04 station of the XB network
from the event of December 8, 2009 is shown
in Fig. 2. The three-component waveform data
for each record in our collection are baseline-corrected. Then, we manually marked arrival phases
for the P and S waves. All the records are differentiated to obtain the acceleration records. Only
waveforms having a signal-to-noise ratio (SNR)
of 100 or above are processed and considered
in the present study. The Fast Fourier transform
method is used to transform the S-wave waveforms to the frequency domain. The study area
with the location of the 12 seismic broadband
sites and the 42 earthquakes used to determine
the kappa parameter is shown in Fig. 3. Table 2
provides the lists of the epicentral information
for these earthquakes. Table 3 represents the locations and duration of the seismic station used
to calculate the Kappa parameter.
METHODOLOGY USED TO ESTIMATE K
Various techniques have been utilized to estimate the kappa parameter, such as the displacement kappa (Biasi and Smith, 2001), AH-Kappa
(Anderson and Humphery, 1991), the acceleration Kappa approach (Biasi and Smith, 2001), and
the classical kappa methodology (Anderson and
Hough, 1984). Anderson and Hough (1984) presented a description of the kappa parameter k to
explain the spectral shape at the high frequency for
strong earthquake ground motion. They proposed
that the kappa parameter has the following form:
A( f ) =A0 .exp(− kf ),
f fE
(1)
where: A(f) indicates the acceleration spectrum
and the A0 parameter is affected by a variety =
of parameters
− such
k . f as source properties and epicentral distance.
= −the
/logarithms
Using
of both sides, it may be
written as:
𝑘𝑘 = 𝑘𝑘0 + 𝑚𝑚. 𝑅𝑅
132
ln( A(=
f )) ln=
A0 − k . f−
(2)
It is a linear relationship between the loga= − / spectrum and frequency. The
rithm of acceleration
value of the kappa parameter
by
= can be−calculated
𝑘𝑘 =
𝑅𝑅
0 + 𝑚𝑚.
determining
the𝑘𝑘slope
of
the
following
Equation:
=
−
k = − /
where:
(3)
λ – the slope of Equation 2.
𝑘𝑘 = =
𝑘𝑘0 + 𝑚𝑚. 𝑅𝑅 −
A significant relationship between kappa and
distance was discovered
= − /by
Anderson and Hough
(1984). The equation for the linear relationship is:
(4)
𝑘𝑘 = 𝑘𝑘0 + 𝑚𝑚. 𝑅𝑅
where: k – the observable value of the kappa; k0 –
the near source attenuation or the kappa at
zero distance; m – the slope of variations;
R – the hypocentral distance.
In this study, the method used to estimate the
kappa-value is the one proposed by Anderson and
Hough (1984). Fig. 4 illustrates an example of
kappa parameter estimate using spectral amplitude for the event “20091120” recorded by PM05
in the frequency range of 8–23 Hz. The best-fit
lines are displayed by the solid red line.
RESULTS AND DISCUSSION
Using the method of Anderson and Hough
(1984) mentioned above, the values of the kappa parameter for northern Morocco have been
calculated for the horizontal components of the
321 seismograms recorded in the period between
2009 and 2012 by the Picasso Project. The stations (PM21, PM23, and PM26) had poor signals
or great noise levels for several seismograms,
which may affect the kappa values for these stations. Most of the Kappa values, for each station,
were estimated using eight to ten events. Table
4 compares the results obtained in this study to
those obtained in other parts of the world. The estimated average factor of the Kappa value ranges
from 0.0682 for the hard sites to 0.0763 for the
soft sites, with 0.072 as an average value. This
result suggests that northern Morocco has high
Kappa values when compared to other parts of
the world (Yadav et al., 2018).
The mean kappa values for both of the research areas (Soft soil type and hard rocks type)
are nearly identical to the kappa values obtained in Northeast India, Northwest India, and
1
�Ecological Engineering & Environmental Technology 2022, 23(6), 128–139
Figure 2. Example of three-component velocity records (Vertical, north–south, east–west component)
recorded by PM04 of the XB network from the event on 08 December 2009. BHZ is the vertical
component; BHN is the North-South component; BHE is the East-West component
Figure 3. Location of earthquakes in the red circle and recording stations in the
blue triangle icon used in the present study (Wessel and Smith 2004)
133
�Ecological Engineering & Environmental Technology 2022, 23(6), 128–139
Table 2. List of earthquakes used for the estimation of kappa parameter, k
ID event
Depth
Magnitude
Latitude
Longitude
200911201915
25.7
3.8
34.8506
-5.5166
20091208211238
14.8
3
34.834
-5.5473
20100214221434
27.1
4.2
34.882
-5.5342
201002070934
7.1
3.7
34.894
-5.7842
201001190158
10
3.5
34.704
-4.4617
20100121165707
12.9
4.5
34.7985
-5.7031
201002070320
30
3.1
34.8414
-5.7165
20100213050309
10
4
34.8347
-5.7499
201003071635
73.8
3.6
35.203
-4.9779
201004220123
42.2
4.8
35.3272
-6.2519
201004131138
35.9
3.8
34.6806
-5.6645
20100219041311
10
4.3
33.4391
-4.2612
201001250235
60
3.4
35.58
-5.8377
20100123002907
10
3.7
32.6964
-3.1803
201003230531
13.8
3.7
33.6287
-5.4764
201003150013
24
3.7
33.9941
-4.6317
20100219041309
10
3.5
33.616
-4.233
201003120851
24
3.8
34.0097
-4.5022
201003271421
0
3.8
33.7785
-4.6277
201003171651
26.5
3.8
35.203
-4.3495
201003140537
20
3.0
33.9313
-4.3693
201003120317
24
3.6
33.9312
-4.4972
20110210212542
11.3
4
34.2882
-2.9082
201102140602
10.9
4.5
32.0523
-5.9026
201102150115
28.4
3.5
34.972
-3.7713
201102180110
23.8
4.2
35.6338
-4.4791
201105010450
6.3
4.3
32.7206
-5.3896
201107180226
10
Ml=2.3
34.6729
-4.1626
201109292044
35
Ml=3.2
34.9709
-4.6479
20110301102626
97.9
3.7
35.1406
-4.7261
20120704074416
19.8
4
34.8894
-2.9617
20120710041952
19
3.8
34.2113
-5.2821
201009050333
14.7
3.3
35.0823
-3.0246
201009110357
15.1
3.0
35.0467
-2.9775
20100422014248
53.9
3.2
35.3366
-6.2688
201202180028
29.6
4.2
34.4874
-5.6734
201207040744
19.8
4.0
34.8894
-2.9617
201012141745
8.9
3.6
35.3796
-4.1563
201102102125
11.3
4.0
34.2882
-2.9082
20101016035249
17.6
2.9
35.5132
-3.7984
20101016035251
10
1.9=Ml
35.5256
-3.7817
20100414152119
10
4.1
34.8001
-5.6973
Saint-Louis, USA (Table 4). Low values of the
mean of the kappa parameter are found in several regions such as Switzerland by 0.015, the
Western Alps by 0.0125, and mainland French
134
by 0.04–0.06. The low kappa value indicates
that the local geology has very little impact on
high-frequency attenuation (Rinne, 2021). Due
to the high kappa value obtained in this study,
�Ecological Engineering & Environmental Technology 2022, 23(6), 128–139
Table 3. Locations and duration of the 13 seismic stations used in this study
Network
Station
Latitude
Longitude
Elevation
Start time
End time
XB
PM04
35.402599
-5.1525
111.0
2009-02-11T00:00:00
2012-10-31T23:59:00
XB
PM05
35.213402
-5.3368
510.0
2009-11-01T00:00:00
2012-10-30T23:59:00
XB
PM07
35.227501
-4.9863
711.0
2009-11-02T00:00:00
2012-10-31T23:59:00
XB
PM08
35.144798
-4.7082
253.0
2009-11-02T00:00:00
2012-10-31T23:59:00
XB
PM11
34.930801
-4.3119
1004.0
2009-11-03T00:00:00
2012-10-31T23:59:00
XB
PM21
33.720501
-5.3197
1013.0
2009-10-28T00:00:00
2013-05-27T23:59:00
XB
PM22
33.294701
-5.1071
1945.0
2009-10-22T00:00:00
2009-10-29T00:00:00
XB
PM22
33.294701
-5.1071
1945.0
2009-10-29T00:00:00
2011-03-09T11:30:00
XB
PM23
33.127998
-5.0300
1990.0
2009-10-22T00:00:00
2013-05-27T23:59:00
XB
PM24
32.9953
-4.8979
1599.0
2009-10-22T00:00:00
2013-05-27T23:59:00
XB
PM25
32.875702
-4.8880
1417.0
2009-10-20T00:00:00
2013-05-27T23:59:00
XB
PM26
32.524502
-4.5659
1840.0
2009-10-20T00:00:00
2013-05-26T23:59:00
XB
PM36
34.8894
-3.7359
776.0
2010-10-19T00:00:00
2012-10-30T23:59:00
Figure 4. Example of kappa parameter estimation using spectral amplitude in the frequency band of 8-23Hz
for the event «20091120» which was recorded by PM05. The solid red line shows the best-fitted lines
Table 4. Compares results obtained from this study with those from other parts of the world
Region
Mean Kappa value
Reference
Switzerland
0.015
Bay et al. 2003
Switzerland
0.0125
Bay et al. 2005
Western Alps
0.012
Morasca et al.2006
0.04 for rock sites
Douglas et al. 2010
0.0637 for firm ground type of site
Awasthi et al. 2010
Northeast India
0.0756 for soft rock type
Awasthi et al. 2010
Northwest India
0.03–0.095 for various sites
Mittal et al. (2022)
mainland France
Northeast India
Delhi region, India
0.0118–0.0537 for various sites
Mittal et al. (2021)
Saint-Louis
0.007
Hermann and Akinci (1999)
Memphis
0.063
Hermann and Akinci (1999)
Greece
0.060
Margaris et al. (1998)
the local sites of the seismic stations have a significant influence on the high-frequency attenuation. Figure 5 shows the existing correlation between the kappa parameter and the hypocentral
distance and Figure 6 illustrates the dependency
of the kappa parameter on the hypocentral distance for all 12 seismic stations used in this study.
The distance-dependency of the kappa laws for
135
�Ecological Engineering & Environmental Technology 2022, 23(6), 128–139
Figure 5. Correlation of the kappa parameter for each seismic station site with
the hypocentral distance and their error for northern Morocco
Figure 6. Dependency of kappa parameter
on the hypocentral distance for all 12
seismic stations used in this study
136
each pair station-event is, using linear regression,
shown at the top of each plot accompanied by the
dependency index R-square. A highly significant
correlation between the Kappa parameter and the
hypocentral distance was observed for some station sites such as PM05, PM21, and PM22, and a
low correlation was observed in others. The reason could be the low number of data per station
or high seismic noise recorded for some stations
or both. Also, the kappa value is sensitive to the
data selection criteria and the methodology choice
(Palmer and Atkinson, 2020). In Indian Himalayan region, Yadav et al. (2018) and Mittal et al.
(2021, 2022) found that the distance dependence
is not significant. Additionally, they observed that
�Ecological Engineering & Environmental Technology 2022, 23(6), 128–139
Figure 7. Distance-dependence of kappa for a) hard rock sites and b) soft soil sites
there is no clear distance dependence for both the
horizontal and the vertical components. The nearsource parameter, κ0, obtained from the station dependence at zero distance, indicates the site attenuation immediately under the station site (Hough
and Anderson, 1988). It is a unique property of the
seismic site (Awasthi et al., 2010). Once the dependency equation of the kappa parameter for each
event-station pair has been determined, the nearsurface attenuation parameter k0 is derived using
equation (4).
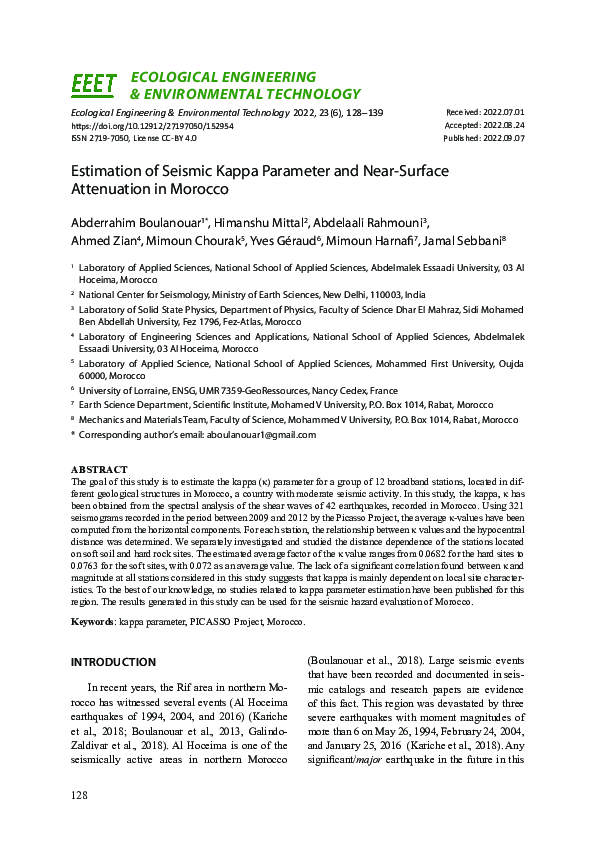
Figure 7 illustrates the distance dependence
of kappa for hard rock sites and soft soil sites.
For hard rock sites, the linear fit relation is k =
0.0754-3E-05R and for soft rock type sites, k =
0.0847-8E-05R. k0 is 0.0754 for hard rock type
sites and 0.0847 for soft rock sites. This indicates
that the value of near-surface attenuation for soft
rock stations has a higher value than those of hard
rock type sites. This result is consistent with the
experimental research conducted by Yadav et al.
(2018) in North East India. In France, Douglas et
al. (2010) observed that kappa is affected by the
local geology proprieties and hypocentral distance.
They have found κ0 = 0.0270 for soft soil rocks and
κ0 = 0.0207 for hard rocks. For Guerrero, Mexico,
Humphrey and Anderson (1992) discovered no
relationship between the kappa parameter and site
geology. In the Kachchh region of Gujarat, India,
Kumar et al. (2018) found that κ0 = 0.016 for hard
rock sites and κ0 = 0.0201 for soft rock sites. Using
data from the ANZA Seismic Network, Kilb et al.
(2012) found κ0= 0.036 for soil soft rock sites and
κ0= 0.030 for hard rock sites in Southern California. Chang et al. (2019) calculated the near-surface
attenuation parameter for the Taiwan region and
found that its values vary from 0.032 to 0.097 at
the surface and from 0.012 to 0.078 in the borehole.
CONCLUSIONS
Using the Anderson and Hough technique
(1984), we have calculated the kappa proprieties
from the horizontal components for the region of
northern Morocco through the spectral decay amplitude at high frequencies. The estimated average factor of the Kappa value ranges from 0.0682
for the hard sites to 0.0763 for the soft sites, with
0.072 as an average value. According to this finding, northern Morocco has higher Kappa values
than other regions of the world. The linear fit relation for hard rock sites is k = 0.0754-3E-05R and
for soft rock sites is k = 0.0847-8E-05R. It means
that the near-surface attenuation, k0, is 0.0754 for
hard rock sites and 0.0847 for soft rock sites. It implies that the near-surface attenuation for soft rock
stations is higher than the hard rock type sites. The
average kappa values for both research areas (Soft
rock type and hard rock type) are very similar to
those observed in Northeast India and Saint-Louis, USA. For some station sites, including PM05,
PM21, and PM22, a highly significant correlation
between the Kappa parameter and the hypocentral
distance was seen, although a poor correlation was
seen in other cases. These results can be used for
the seismic hazard evaluation of Morocco.
Acknowledgments
All seismic data used in this study, belonging
to the Program to Investigate Convective Alboran Sea System Overturn, were retrieved from the
137
�Ecological Engineering & Environmental Technology 2022, 23(6), 128–139
Incorporated Research Institutions for Seismology (IRIS) (ORFEUS Data Center) at the website:
http://www.fdsn.org/networks/detail/XB_2009.
All data retrieved from this project are openly
available (Last accessed in August 2022). The author Himanshu Mittal is thankful to Director, National Centre for Seismology, Ministry of Earth
Sciences, India for his support to participate in the
present work. Figure 3 is created with the GMT
software (Wessel and Smith 2004).
REFERENCES
1. Anderson J.G., Hough S.E. 1984. A model for the
shape of the Fourier amplitude spectrum of acceleration at high frequencies. Bulletin of the Seismological Society of America, 74, 1969–1993.
2. Anderson J.G., Humphrey J. 1991. A least-squares
method for objective determination of earthquake
source parameters. Seismological Research Letters,
62, 201–209.
3. Andrieux J., Fontbote J.M., Mattauer M. 1971. Sur
un modèle explicatif de l’Arc de Gibraltar. Earth and
Planetary Science Letters, 12(2), 191–198.
4. Arab O., Azguet R., Ouchen I., El Fellah Y., Harnafi M., Sebbani, et al. 2020. Attenuation of seismic
coda waves in the Rif area, northern Morocco. Journal of African Earth Sciences, 165, 103815.
5. Awasthi D.K., Shende V.J., Gupta I.D. 2010. Estimation of κ factor for two types of sites in northeast
India. Indian Geotechnical Conference, 16–18.
6. Bay F., Fäh D., Malagnini L., Giardini D. 2003.
Spectral shear-wave ground-motion scaling in Switzerland. Bulletin of the Seismological Society of
America, 93(1), 414–429.
7. Bay F., Wiemer S., Fäh D., Giardini D. 2005. Predictive ground motion scaling in Switzerland: best
estimates and uncertainties. Journal of Seismology,
9(2), 223–240.
8. Benouar D. 1994. Materials for the investigation
of the seismicity of Algeria and adjacent regions
during the twentieth century. Annali de geofisica,
37(4), 609–835.
9. Biasi G.P., Smith K.D. 2001. Site effects for seismic monitoring stations in the vicinity of Yucca
Mountain, Nevada. A report prepared for the US
DOE/University and Community College System
of Nevada (UCCSN) Cooperative Agreement.
MOL20011204.0045. Nevada (US).
10. Biro Y., Siyahi B., Akbas B. 2020. The spectral decay parameter κ (kappa) for hard rock strong ground
motion stations in Turkey. 17th World Conference
on Earthquake Engineering, 3–18.
138
11. Boulanouar A., El Moudnib L., Harnafi M., Cherkaoui T. E., Rahmouni A., Boukalouch M., Sebbani J.
2013. Spatial variation of coda wave attenuation using aftershocks of the Al Hoceima earthquake of 24
February, 2004, Morocco. Natural Science, 5(8), 72.
12. Boulanouar A., Moudnib L.E., Padhy S., Harnafi
M., Villaseñor A., et al. 2018. Estimation of coda
wave attenuation in Northern Morocco. Pure and
Applied Geophysics, 175(3), 883–897.
13. Chalouan A., Michard A., Kadiri K., Negro F., Lamotte D., Soto J.I., et al. 2008. Continental evolution:
the geology of Morocco. Springer Berlin, Heidelberg.
14. Chandler A.M., Lam N.T., Tsang H.H. 2006. Near
surface attenuation modelling based on rock shear
wave velocity profile. Soil Dynamics and Earthquake Engineering, 26, 1004–1014.
15. Chang S.C., Wen K.L., Huang M.W., Kuo C.H.,
Lin, C. M., et al. 2019. The high-frequency decay
parameter (Kappa) in Taiwan. Pure and Applied
Geophysics, 176(11), 4861–4879.
16. De Capoa P., Di Staso A., Perrone V., Zaghloul
M.N. 2007. The age of the foredeep sedimentation in the Betic–Rifian Mauretanian units: a major constraint for the reconstruction of the tectonic
evolution of the Gibraltar Arc. Comptes Rendus
Geoscience, 339(2), 161–170.
17. Douglas J., Gehl P., Bonilla L.F., Gélis C. 2010.
A κ model for mainland France. Pure and applied
geophysics, 167(11), 1303–1315.
18. De Lis Mancilla F., Stich D., Morales J., Julià J.,
Diaz J., et al. 2012. Crustal thickness variations
in northern Morocco. Journal of Geophysical Research: Solid Earth, 117(B2).
19. El Fellah Y., Bouskri G., Harnafi M., Abd El
A.E.A.K., Timoulali Y., et al. 2019. Tracking regional heterogeneities through seismic ambient
noise constrains: What Rayleigh wave tomography
can tell about deep structures in northern Morocco. Journal of African Earth Sciences, 160, 103615.
20. Fullea J., Fernandez M., Zeyen H., Vergés J. 2007.
A rapid method to map the crustal and lithospheric
thickness using elevation, geoid anomaly and thermal analysis. Application to the Gibraltar Arc System, Atlas Mountains and adjacent zones. Tectonophysics, 430(1–4), 97–117.
21. Galindo‐Zaldivar J., Ercilla G., Estrada F. Catalán, M.,
d’Acremont E., et al. 2018. Imaging the growth of recent faults: The case of 2016–2017 seismic sequence
sea bottom deformation in the Alboran Sea (Western
Mediterranean). Tectonics, 37(8), 2513–2530.
22. Herrmann R., Akinci A. 1999. Mid-America ground
motion models, http://www.eas.slu.edu/People/RBHerrmann/MAEC/maecgnd.html
23. Hough E., Anderson J.G. 1988. High-frequency
spectra observed at Anza, California: Implications
�Ecological Engineering & Environmental Technology 2022, 23(6), 128–139
for Q structure. Bulletin of the Seismological Society of America, 78(2), 692–707.
24. Humphrey J.R., Anderson J.G. 1992. Shear wave
attenuation and site response in Guerrero Mexico.
Bulletin of the Seismological Society of America,
81, 1622–1645.
25. Kariche J., Meghraoui M., Timoulali Y., Cetin E.,
Toussaint R. 2018. The Al Hoceima earthquake sequence of 1994, 2004 and 2016: Stress transfer and
poroelasticity in the Rif and Alboran Sea region. Geophysical Journal International, 212(1), 42–53.
26. Khattach D., Houari M.R., Corchete V., Chourak
M., El Gout R., Ghazala H. 2013. Main crustal
discontinuities of Morocco derived from gravity
data. Journal of Geodynamics, 68, 37–48.
27. Kilb D., Biasi G., Anderson J., Brune J., Peng Z.,
Vernon F.L. 2012. A comparison of spectral parameter kappa from small and moderate earthquakes
using southern California ANZA seismic network
data. Bulletin of the Seismological Society of America, 102(1), 284–300.
28. Kumar S., Kumar D., Rastogi B.K., Singh A.P.
2018. Kappa (κ) model for Kachchh region of
Western India. Geomatics, Natural Hazards and
Risk, 9(1), 442–455.
29. Lai T.S., Mittal H., Chao W.A., Wu Y.M. 2016. A
study on Kappa value in Taiwan using borehole and
surface seismic array. Bulletin of the Seismological
Society of America, 106(4), 1509–1517.
30. Margaris B.N., Boore D.M. 1998. Determination
of Δσ and κ0 from response spectra of large earthquakes in Greece. Bulletin of the Seismological
Society of America, 88(1), 170–182.
31. Mittal H., Sharma B., Chao W.A., Wu Y.M., Lin
T.L., Chingtham P. 2022. A comprehensive analysis
of attenuation characteristics using strong ground
motion records for the Central Seismic Gap Himalayan Region, India. Journal of Earthquake Engineering, 26(5), 2599–2624.
32. Mittal H., Sharma B., Sandhu M., Kumar D. 2021.
Spatial distribution of high-frequency spectral decay factor kappa (κ) for Delhi, India. Acta Geophysica, 69(6), 2113–2127.
33. Morley K. 1987. Origin of major cross element
zone: Morocco Rif. Geology, 15, 761–764.
34. Palmer S.M., Atkinson G.M. 2020. The high‐frequency decay slope of spectra (kappa) for M≥ 3.5
earthquakes on rock sites in Eastern and Western
Canada. Bulletin of the Seismological Society of
America, 110(2), 471–488.
35. Perron V., Hollender F., Bard P.Y., Gélis C., Guyonnet‐Benaize C., Hernandez B., Ktenidou O.J.
2017. Robustness of Kappa (κ) Measurement in
Low‐to‐Moderate Seismicity Areas: Insight from a
Site‐Specific Study in Provence, France. Bulletin
of the Seismological Society of America, 107(5),
2272–2292.
36. Rinne L. 2021. Seismic wave attenuation and the
spectral decay parameter κ (kappa) in crystalline
bedrock at Olkiluoto, SW Finland. Master’s thesis,
University of Helsink, Finland.
37. Samaei M., Miyajima M., Yazdani A., Jaafari F.
2016. High Frequency Decay Parameter (Kappa)
for Ahar–Varzaghan Double Earthquakes, Iran
(MW 6.5 and 6.3). Journal of Earthquake and Tsunami, 10(2), 1640006.
38. Seber D., Barazangi M., Ibenbrahim A., Demnati
A. 1996. Geophysical evidence for lithospheric delamination beneath the Alboran Sea and Rif–Betic
mountains. Nature, 379(6568), 785–790.
39. Stanko D., Markušić S., Korbar T., Ivančić J. 2020.
Estimation of the high-frequency attenuation parameter kappa for the Zagreb (Croatia) seismic stations. Applied Sciences, 10(24), 8974.
40. Van Houtte C., Drouet S., Cotton F. 2011. Analysis of
the origins of κ (kappa) to compute hard rock to rock
adjustment factors for GMPEs. Bulletin of the Seismological Society of America, 101(6), 2926–2941.
41. Wessel P., Smith W.H.F. 2004. Generic Mapping
Tools Graphics.
42. Wildi W. 1983. La chaîne tello-rifaine (Algérie, Maroc, Tunisie): structure, stratigraphie et évolution du
Trias au Miocène. Revue de géographie physique et
de géologie dynamique, 24(3), 201–297.
43. Yadav R., Kumar D., Chopra S. 2018. The high
frequency decay parameter κ (kappa) in the region
of North East India. Open Journal of Earthquake
Research 7, 141–159.
139
�
 Abderrahim Boulanouar