KR20060066570A - Method and system for monitoring application performance in distributed environment - Google Patents
Method and system for monitoring application performance in distributed environment Download PDFInfo
- Publication number
- KR20060066570A KR20060066570A KR1020047021335A KR20047021335A KR20060066570A KR 20060066570 A KR20060066570 A KR 20060066570A KR 1020047021335 A KR1020047021335 A KR 1020047021335A KR 20047021335 A KR20047021335 A KR 20047021335A KR 20060066570 A KR20060066570 A KR 20060066570A
- Authority
- KR
- South Korea
- Prior art keywords
- user
- server
- performance
- request
- information
- Prior art date
- Legal status (The legal status is an assumption and is not a legal conclusion. Google has not performed a legal analysis and makes no representation as to the accuracy of the status listed.)
- Granted
Links
Images


Classifications
-
- G—PHYSICS
- G06—COMPUTING OR CALCULATING; COUNTING
- G06F—ELECTRIC DIGITAL DATA PROCESSING
- G06F16/00—Information retrieval; Database structures therefor; File system structures therefor
- G06F16/10—File systems; File servers
- G06F16/11—File system administration, e.g. details of archiving or snapshots
-
- G—PHYSICS
- G06—COMPUTING OR CALCULATING; COUNTING
- G06F—ELECTRIC DIGITAL DATA PROCESSING
- G06F11/00—Error detection; Error correction; Monitoring
- G06F11/30—Monitoring
- G06F11/3003—Monitoring arrangements specially adapted to the computing system or computing system component being monitored
- G06F11/3006—Monitoring arrangements specially adapted to the computing system or computing system component being monitored where the computing system is distributed, e.g. networked systems, clusters, multiprocessor systems
-
- G—PHYSICS
- G06—COMPUTING OR CALCULATING; COUNTING
- G06F—ELECTRIC DIGITAL DATA PROCESSING
- G06F15/00—Digital computers in general; Data processing equipment in general
- G06F15/16—Combinations of two or more digital computers each having at least an arithmetic unit, a program unit and a register, e.g. for a simultaneous processing of several programs
-
- G—PHYSICS
- G06—COMPUTING OR CALCULATING; COUNTING
- G06F—ELECTRIC DIGITAL DATA PROCESSING
- G06F11/00—Error detection; Error correction; Monitoring
- G06F11/30—Monitoring
- G06F11/3065—Monitoring arrangements determined by the means or processing involved in reporting the monitored data
- G06F11/3072—Monitoring arrangements determined by the means or processing involved in reporting the monitored data where the reporting involves data filtering, e.g. pattern matching, time or event triggered, adaptive or policy-based reporting
-
- G—PHYSICS
- G06—COMPUTING OR CALCULATING; COUNTING
- G06F—ELECTRIC DIGITAL DATA PROCESSING
- G06F11/00—Error detection; Error correction; Monitoring
- G06F11/30—Monitoring
- G06F11/32—Monitoring with visual or acoustical indication of the functioning of the machine
- G06F11/324—Display of status information
- G06F11/328—Computer systems status display
-
- G—PHYSICS
- G06—COMPUTING OR CALCULATING; COUNTING
- G06F—ELECTRIC DIGITAL DATA PROCESSING
- G06F11/00—Error detection; Error correction; Monitoring
- G06F11/30—Monitoring
- G06F11/34—Recording or statistical evaluation of computer activity, e.g. of down time, of input/output operation ; Recording or statistical evaluation of user activity, e.g. usability assessment
- G06F11/3409—Recording or statistical evaluation of computer activity, e.g. of down time, of input/output operation ; Recording or statistical evaluation of user activity, e.g. usability assessment for performance assessment
-
- G—PHYSICS
- G06—COMPUTING OR CALCULATING; COUNTING
- G06F—ELECTRIC DIGITAL DATA PROCESSING
- G06F11/00—Error detection; Error correction; Monitoring
- G06F11/30—Monitoring
- G06F11/34—Recording or statistical evaluation of computer activity, e.g. of down time, of input/output operation ; Recording or statistical evaluation of user activity, e.g. usability assessment
- G06F11/3466—Performance evaluation by tracing or monitoring
- G06F11/3476—Data logging
-
- G—PHYSICS
- G06—COMPUTING OR CALCULATING; COUNTING
- G06F—ELECTRIC DIGITAL DATA PROCESSING
- G06F11/00—Error detection; Error correction; Monitoring
- G06F11/30—Monitoring
- G06F11/34—Recording or statistical evaluation of computer activity, e.g. of down time, of input/output operation ; Recording or statistical evaluation of user activity, e.g. usability assessment
- G06F11/3466—Performance evaluation by tracing or monitoring
- G06F11/3495—Performance evaluation by tracing or monitoring for systems
-
- G—PHYSICS
- G06—COMPUTING OR CALCULATING; COUNTING
- G06F—ELECTRIC DIGITAL DATA PROCESSING
- G06F15/00—Digital computers in general; Data processing equipment in general
-
- G—PHYSICS
- G06—COMPUTING OR CALCULATING; COUNTING
- G06F—ELECTRIC DIGITAL DATA PROCESSING
- G06F15/00—Digital computers in general; Data processing equipment in general
- G06F15/16—Combinations of two or more digital computers each having at least an arithmetic unit, a program unit and a register, e.g. for a simultaneous processing of several programs
- G06F15/163—Interprocessor communication
- G06F15/173—Interprocessor communication using an interconnection network, e.g. matrix, shuffle, pyramid, star, snowflake
-
- H—ELECTRICITY
- H04—ELECTRIC COMMUNICATION TECHNIQUE
- H04L—TRANSMISSION OF DIGITAL INFORMATION, e.g. TELEGRAPHIC COMMUNICATION
- H04L43/00—Arrangements for monitoring or testing data switching networks
- H04L43/08—Monitoring or testing based on specific metrics, e.g. QoS, energy consumption or environmental parameters
-
- H—ELECTRICITY
- H04—ELECTRIC COMMUNICATION TECHNIQUE
- H04L—TRANSMISSION OF DIGITAL INFORMATION, e.g. TELEGRAPHIC COMMUNICATION
- H04L67/00—Network arrangements or protocols for supporting network services or applications
- H04L67/01—Protocols
- H04L67/06—Protocols specially adapted for file transfer, e.g. file transfer protocol [FTP]
-
- H—ELECTRICITY
- H04—ELECTRIC COMMUNICATION TECHNIQUE
- H04L—TRANSMISSION OF DIGITAL INFORMATION, e.g. TELEGRAPHIC COMMUNICATION
- H04L67/00—Network arrangements or protocols for supporting network services or applications
- H04L67/01—Protocols
- H04L67/10—Protocols in which an application is distributed across nodes in the network
-
- G—PHYSICS
- G06—COMPUTING OR CALCULATING; COUNTING
- G06F—ELECTRIC DIGITAL DATA PROCESSING
- G06F2201/00—Indexing scheme relating to error detection, to error correction, and to monitoring
- G06F2201/81—Threshold
-
- G—PHYSICS
- G06—COMPUTING OR CALCULATING; COUNTING
- G06F—ELECTRIC DIGITAL DATA PROCESSING
- G06F2201/00—Indexing scheme relating to error detection, to error correction, and to monitoring
- G06F2201/865—Monitoring of software
-
- G—PHYSICS
- G06—COMPUTING OR CALCULATING; COUNTING
- G06F—ELECTRIC DIGITAL DATA PROCESSING
- G06F2201/00—Indexing scheme relating to error detection, to error correction, and to monitoring
- G06F2201/88—Monitoring involving counting
Landscapes
- Engineering & Computer Science (AREA)
- Theoretical Computer Science (AREA)
- General Engineering & Computer Science (AREA)
- Physics & Mathematics (AREA)
- General Physics & Mathematics (AREA)
- Computer Hardware Design (AREA)
- Quality & Reliability (AREA)
- Computing Systems (AREA)
- Signal Processing (AREA)
- Computer Networks & Wireless Communication (AREA)
- Environmental & Geological Engineering (AREA)
- Mathematical Physics (AREA)
- Computer Vision & Pattern Recognition (AREA)
- Software Systems (AREA)
- Data Mining & Analysis (AREA)
- Databases & Information Systems (AREA)
- Debugging And Monitoring (AREA)
- Computer And Data Communications (AREA)
Abstract
Description
분산 서버는 사업에 중요한 어플리케이션을 선 마이크로시스템 자바2 엔터프라이즈 에디션(J2EE) 기술을 사용하여 현재 호스트하고 있다. 그러한 어플리케이션은 브라우저 클라이언트를 성능하는 고객에게 직접 중요한 사업 수행을 제공하는 서버를 포함한다. 다양한 툴과 기술이, 데이터 베이스, 플랫폼 및 하드웨어를 포함하는 그러한 시스템의 다양한 콤포넌트의 성능을 모니터하는데 사용될 수 있다. 그러나, 고객에 의해 경험된 성능은 그러한 기저의 콤포넌트의 성능이 아니라, 어플리케이션의 성능이다. 발명자들은 종래 기술의 주요한 장애를 확인하여 어플리케이션의 성능에 관한 정보를 제공하였다. 어플리케이션의 성능을 측정하는 종래 기술의 제품이 그 무능력을 발휘하지 못한 결과로서, 하드웨어 및 소프트웨어의 선택에 대한 결정은 잘못될 수 있다. 예를 들어, 만일 어플리케이션이 느리게 응답하는 중이면, 관리자에게 이용가능한 하나의 옵션은 어플리케이션이 성능하는 추가적인 서버를 구매하거나 임대하는 것이다. 그러한 구입 비용은 고가이고, 새로운 하드웨어의 설치는 반드시 다른 임무로부터 벗어나야 하는 정보 기술 직원이 하게된다. 느리게 응답하는 어플리케이션에 대한 다른 응답은 다양한 하드웨어의 구성의 변경을 포함한다. 그러나, 어플리케이션 성능을 향상시키기 위하여 다양한 하드웨어 및 소프트웨어 구성의 수많은 다른 조합을 실시할 필요가 있을 수 있다.Distributed servers currently host business-critical applications using Sun Microsystems' Java2 Enterprise Edition (J2EE) technology. Such applications include servers that provide significant business performance directly to customers performing browser clients. Various tools and techniques can be used to monitor the performance of various components of such a system, including databases, platforms, and hardware. However, the performance experienced by the customer is not the performance of such underlying components, but the performance of the application. The inventors have identified a major obstacle of the prior art and provided information regarding the performance of the application. As a result of the inability of a prior art product to measure the performance of an application, decisions about the choice of hardware and software can be wrong. For example, if the application is responding slowly, one option available to the administrator is to purchase or rent additional servers that the application is performing. Such purchases are expensive, and the installation of new hardware is done by information technology staff, who must free themselves from other duties. Other responses to slow responding applications include changing the configuration of various hardware. However, it may be necessary to implement numerous different combinations of various hardware and software configurations to improve application performance.
분산 컴퓨팅 환경의 서버에서 성능되는 어플리케이션의 성능을 모니터하는 발명에 따른 방법은, 사용자를 재촉하여 모니터링하는 정보를 선택하고, 선택된 정보에 따라 어플리케이션 성능을 모니터하고, 사용자에게 유용한 모니터된 성능 정보를 만드는 단계를 포함한다.The method according to the invention for monitoring the performance of an application that is performed on a server in a distributed computing environment, prompts the user to select the information to monitor, monitors the application performance according to the selected information, and generates useful monitored performance information for the user. Steps.
발명에 따른 방법은 사용자를 재촉하여 서버 또는 서버군, 리소스 및 통지용 임계 또는 조건을 선택하고, 임계 또는 조건에 대한 파라미터 값 또는 질을 비교하고, 파라미터가 임계 또는 조건에 도달하는 경우 사용자에게 통지를 제공하는 단계를 포함한다.The method according to the invention prompts the user to select a server or server family, resource and notification threshold or condition, compare the parameter value or quality for the threshold or condition, and notify the user when the parameter reaches the threshold or condition. Providing a step.
본 발명에 따른 방법은 분산 컴퓨팅 환경의 서버에서 성능되는 어플리케이션에 관계하는 성능 정보를 사용자에게 제공하고, 더 많은 구체적인 성능 정보에 관한 요청을 사용자로부터 수신하고, 요청에 응답하여 더욱 상세한 성능 정보를 제공하는 단계를 포함한다.The method according to the present invention provides a user with performance information relating to an application running on a server in a distributed computing environment, receives a request for more specific performance information from the user, and provides more detailed performance information in response to the request. It includes a step.
본 발명에 따른 방법은 허가 서버로서의 서버, 비교 서버로서의 다른 서버의 신분 확인을 사용자로부터 입력받고, 선택된 서버 사이의 CPU 데이터, 서버 데이터 및 자바 데이터 중 하나 이상의 형태의 성능 시간 환경 데이터를 비교하고, 사용자에게 차이를 표시하는 단계를 포함한다.The method according to the present invention receives an identification from a user of a server as an authorization server and another server as a comparison server, compares performance time environment data in the form of one or more of CPU data, server data and Java data between selected servers, Displaying the difference to the user.
본 발명의 방법은 허가 서버로서의 서버 및 비교 서버로서의 다른 서버의 신 분 확인을 사용자로부터 입력받고, 파일 이름을 매칭하고 다르게 하는 리스트를 제공하는 단계를 포함한다. 본 방법은 파일 중의 선택을 사용자로부터 수신하고, 파일 중의 비교를 수행하고, 결과를 사용자에게 제공하는 단계를 더 포함할 수 있다.The method includes receiving input from a user for identification of a server as an authorization server and another server as a comparison server, and providing a list of matching and different file names. The method may further comprise receiving a selection in the file from the user, performing a comparison in the file, and providing the result to the user.
본 발명의 방법은 요청 스트링을 수신하고, 구별할 수 있는 요청 스트링 및 파괴할 수 있는 요청 스트링에 수신된 요청 스트링을 매핑하는 단계를 포함한다. 수신된 요청 스트링은 JSP, 서브렛 및 원격 엔터프라이즈 자바 빈 콜(Bean call)의 형태일 수 있다. 본 발명의 방법은 사용자를 재촉하여 구별할 수 있는 요청 스트링 및 파괴할 수 있는 요청 스트링에 수신된 요청 스트링의 매핑을 하는 규칙을 생성할 수 있다.The method of the present invention comprises receiving a request string and mapping the received request string to a distinguishable request string and a breakable request string. The received request string may be in the form of a JSP, servlet, and remote enterprise Java bean call. The method of the present invention may generate a rule for prompting the user to map the received request string to the distinguishable request string and the breakable request string.
본 발명의 방법은 적어도 하나의 어플리케이션을 성능하는 시스템에서 모니터링 및 관리하는 다양한 콤포넌트를 갖는 관리 어플리케이션을 제공하고, 콤포넌트의 구성 및 콤포넌트 사이의 관계에 관한 정보를 실시간으로 사용자에게 모니터링하고 제공하는 단계를 포함한다.The method of the present invention provides a management application having various components for monitoring and managing at least one application in a system that performs at least one application, and monitoring and providing information to the user in real time about the configuration of the components and the relationships between the components. Include.
본 발명의 방법은 각각의 사용자에게 기능을 지정하고, 기능에의 접근과 접근 제어 리스트에 의한 각각의 사용자 기능 사이에서 매핑하는 단계를 포함하고, 여기서 기능에 대한 접근은 사용자의 지정된 기능에 의존하면서 제한된다.The method of the present invention includes assigning a function to each user and mapping between access to the function and each user function by an access control list, wherein access to the function depends on the user's designated function. Limited.
분산 컴퓨팅 환경의 서버에서 성능되는 어플리케이션의 성능을 모니터링하는 본 발명에 따른 시스템은 사용자를 재촉하여 모니터링하는 정보를 선택하는 컴퓨터 하드웨어 및 소프트웨어, 사용자로부터 수신된 선택된 정보에 따라 어플리케이션 성능을 모니터링하는 컴퓨터 하드웨어 및 소프트웨어와, 사용자에게 이용될 수 있 는 모니터된 성능 정보를 만드는 컴퓨터 하드웨어 및 소프트웨어를 포함한다.The system according to the present invention for monitoring the performance of an application performed on a server in a distributed computing environment includes computer hardware and software for prompting the user to select information to monitor and computer application for monitoring application performance according to the selected information received from the user. And software and computer hardware and software to produce monitored performance information that is available to the user.
본 발명에 따른 시스템은 사용자를 재촉하여 서버 또는 서버 그룹, 리소스 및 통지에 대한 임계 또는 조건을 선택하는 컴퓨터 하드웨어 및 소프트웨어, 임계 또는 조건에 대한 서버 또는 서버 그룹의 리소스의 모니터된 파라미터 값 또는 질을 비교하는 컴퓨터 소프트웨어 및 하드웨어, 파라미터가 임계 또는 조건에 도달하는 경우에 사용자에게 통지를 제공하는 컴퓨터 소프트웨어 및 하드웨어를 포함한다.The system according to the present invention prompts the user to monitor the monitored parameter values or quality of the server or server group, computer hardware and software that select the thresholds or conditions for resources and notifications, or the resources of the server or server group for the thresholds or conditions. Comparing computer software and hardware, and computer software and hardware for providing notification to a user when a parameter reaches a threshold or condition.
본 발명에 따른 시스템은 분산 컴퓨팅 환경의 서버에서 성능되는 하나 이상의 어플리케이션에 관계하는 성능 정보를 사용자에게 제공하는 컴퓨터 하드웨어 및 소프트웨어, 더 이상의 구체적인 성능 정보를 위한 요청을 사용자로부터 수신하는 컴퓨터 하드웨어 및 소프트웨어와, 요청에 응답하여 더 이상의 상세한 성능 정보를 제공하는 컴퓨터 하드웨어 및 소프트웨어를 포함한다.The system according to the present invention includes computer hardware and software for providing a user with performance information relating to one or more applications that are performed on a server in a distributed computing environment, computer hardware and software for receiving a request from the user for further specific performance information; Computer hardware and software that provides further detailed performance information in response to the request.
본 발명에 따른 시스템은 허가 서버로서의 제1 서버 및 비교 서버로서의 제2 서버의 신분 확인을 사용자로부터 수신하는 컴퓨터 하드웨어 및 소프트웨어, 선택된 서버 사이의 하나 이상의 CPU 데이터, 서버 데이터 및 자바 데이터의 형태로 허가 서버 및 비교 서버로부터 성능시간 환경 데이터를 비교하는 컴퓨터 하드웨어 및 소프트웨어와, 사용자에게 선택된 서버 사이의 그러한 데이터의 차이를 표시하는 컴퓨터 하드웨어 및 소프트웨어를 포함한다.The system according to the invention permits in the form of computer hardware and software that receives identification from a user of a first server as an authorization server and a second server as a comparison server, one or more CPU data between selected servers, server data and Java data. Computer hardware and software for comparing performance time environment data from a server and a comparison server, and computer hardware and software for indicating a difference in such data between a server selected by a user.
본 발명에 따른 시스템은 허가 서버로서의 제1 서버 및 비교 서버로서의 제2 서버의 신분 확인을 사용자로부터 수신하는 컴퓨터 하드웨어 및 소프트웨어와, 파 일 이름을 매칭하고 다르게 하는 리스트를 제공하는 컴퓨터 하드웨어 및 소프트웨어를 포함한다. 시스템은 허가 서버 및 비교 서버의 둘다에 파일의 선택을 사용자로부터 수신하는 컴퓨터 하드웨어와, 파일 중의 비교를 성능하고 결과를 사용자에게 제공하는 컴퓨터 하드웨어 및 소프트웨어를 더 포함할 수 있다.The system according to the present invention provides computer hardware and software for receiving identification from a user of an identification of a first server as an authorization server and a second server as a comparison server, and computer hardware and software for providing a list of matching and different file names. Include. The system can further include computer hardware that receives a selection of a file from a user on both the authorization server and the comparison server, and computer hardware and software that performs the comparison in the file and provides the result to the user.
본 발명의 시스템은 요청 스트링을 수신하는 컴퓨터 하드웨어 및 소프트웨어와, 구별할 수 있는 요청 스트링 및 파괴할 수 있는 요청 스트링에 수신된 요청 스트링을 매핑하는 컴퓨터 하드웨어 및 소프트웨어를 포함한다. 수신된 요청 스트링은 JSP, 서브렛 및 원격 엔터프라이즈 자바 빈 콜의 형태일 수 있다. 본 발명의 시스템은 사용자를 재촉하여 구별할 수 있는 요청 스트링 및 파괴할 수 있는 요청 스트링에 수신된 요청 스트링을 매핑하는 규칙을 생성하는 컴퓨터 하드웨어 및 소프트웨어를 포함할 수 있다.The system of the present invention includes computer hardware and software for receiving a request string, and computer hardware and software for mapping the received request string to a distinguishable request string and a breakable request string. The received request string may be in the form of JSP, servlet, and remote enterprise Java bean call. The system of the present invention may include computer hardware and software for generating a rule for prompting a user to generate a distinguishable request string and a mapping of the received request string to the disruptable request string.
본 발명의 시스템은 적어도 하나의 어플리케이션을 성능하는 시스템에서, 모니터링 및 관리를 위한 다양한 콤포넌트를 갖는 관리 어플리케이션을 제공하고, 콤포넌트의 구성 및 콤포넌트 사이의 관계에 관한 정보를 실시간으로 사용자에게 제공하고 모니터링하는 컴퓨터 하드웨어 및 소프트웨어를 포함한다.The system of the present invention provides a management application having various components for monitoring and management in a system that performs at least one application, and provides and monitors information on the configuration of the components and the relationships between the components to the user in real time. Computer hardware and software.
본 발명의 시스템은 각각의 사용자에게 기능을 지정하는 컴퓨터 하드웨어 및 소프트웨어와, 기능에 대한 접근과 접근 제어 리스트에 의한 각각의 사용자 기능 사이에서 매핑하는 컴퓨터 하드웨어 및 소프트웨어를 포함하고, 여기서 기능에 대한 접근은 사용자의 지정된 역할에 따라 제한된다.The system of the present invention includes computer hardware and software that assigns a function to each user, and computer hardware and software that maps between each user function by access to the function and by an access control list, where access to the function Is restricted according to the user's assigned role.
분산 컴퓨팅 환경에서의 서버에서 성능하는 어플리케이션의 성능을 모니터링 하는 발명에 따른 컴퓨터 프로그램은 프로세서에서 성능되는 경우, 명령이 사용자를 재촉하여 모니터링을 위한 정보를 선택하고, 선택된 정보에 따라 어플리케이션 성능을 모니터링하고, 사용자에게 사용될 수 있는 모니터된 성능 정보를 만드는 단계를 프로세서가 성능하도록 하는 매체에 저장된 명령들로 구성된다.When a computer program according to the invention monitors the performance of an application performing on a server in a distributed computing environment, the instruction prompts the user to select information for monitoring, and monitors the performance of the application according to the selected information. It consists of instructions stored on a medium which causes the processor to perform the step of making the monitored performance information available to the user.
본 발명에 따른 컴퓨터 프로그램은 프로세서에서 성능되는 경우, 명령이 사용자를 재촉하여 서버 또는 서버 그룹, 리소스와 통지를 위한 임계 및 조건을 선택하고, 임계 또는 조건에 대한 서버 또는 서버 그룹의 리소스의 검출된 값 또는 질을 비교하고, 파라미터가 임계 또는 조건에 도달하는 경우 사용자에게 통지를 제공하는 단계를 프로세서로 하여금 성능하도록 하는 매체에 저장된 명령들로 구성된다.When the computer program according to the present invention is performed in a processor, the instruction prompts the user to select a server or server group, a threshold and a condition for the resource and the notification, and detects the server or server group's resource for the threshold or condition. Comparing the value or quality and providing the user with a notification when the parameter reaches a threshold or condition consists of instructions stored on the medium.
본 발명에 따른 컴퓨터 프로그램은 프로세서에서 성능되는 경우, 분산 컴퓨팅 환경의 서버에서 성능되는 어플리케이션에 관계한 성능 정보를 사용자에게 제공하고, 더 이상의 구체적인 성능 정보를 위한 요청을 사용자로부터 입력받고, 요청에 응답하여 더 상세한 성능 정보를 제공하는 단계를 명령이 프로세서로 하여금 성능하도록 하는 매체에 저장된 명령으로 구성된다.When the computer program according to the present invention performs on a processor, the computer program provides performance information related to an application performed on a server in a distributed computing environment, receives a request for more specific performance information from the user, and responds to the request. Providing more detailed performance information by means of instructions stored on a medium that causes the processor to perform performance.
본 발명에 따른 컴퓨터 프로그램은 프로세서에서 성능되는 경우, 명령이 프로세서로 하여금 허가 서버로서의 제1 서버 및 비교 서버로서의 제2 서버의 신분 확인을 사용자로부터 입력받고, 선택된 서버 사이의 하나 이상의 CPU 데이터, 서버 데이터 및 자바 데이터의 형태로 실시간 환경 데이터를 비교하고, 차이를 사용자에게 표시하는 단계를 성능하도록 하는 매체에 저장된 명령으로 구성된다.When the computer program according to the present invention is performed on a processor, the instructions cause the processor to receive identification from a user of an identification of a first server as an authorization server and a second server as a comparison server, and at least one CPU data between the selected servers, the server. Comparing the real-time environment data in the form of data and Java data and displaying the differences to the user.
본 발명에 따른 컴퓨터 프로그램은 프로세서에서 성능되는 경우, 명령이 허가 서버로서의 제1 서버 및 비교 서버로서의 제2 서버의 신분 확인을 사용자로부터 입력받고, 제1 및 제2 서버 사이의 파일 이름을 매칭하고 다르게하는 리스트를 제공하는 단계를 프로세서가 성능하도록 하는 매체에 저장된 명령으로 구성된다. 프로그램은 프로세서에서 성능되는 경우, 프로세서로 하여금 제1 및 제2 서버 둘 다에서 발견된 파일의 선택을 사용자로부터 수신받고, 파일의 비교를 수행하고, 결과를 사용자에게 제공하는 단계를 성능하도록 하는 명령을 더 포함할 수 있다.The computer program according to the present invention, when performed in a processor, receives instructions from a user for identification of a first server as an authorization server and a second server as a comparison server, and matches file names between the first and second servers. Providing a different list consists of instructions stored on a medium that allows the processor to perform. The program, when performing on a processor, causes the processor to perform the steps of receiving a selection of files found on both the first and second servers from a user, performing a file comparison, and presenting the results to the user. It may further include.
본 발명의 컴퓨터 프로그램은 프로세서에서 성능되는 경우, 명령이 요청 스트링을 입력받고, 구별할 수 있는 요청 스트링 및 파괴할 수 있는 요청 스트링에 수신된 요청 스트링을 매핑하는 단계를 프로세서로 하여금 성능하도록 하는 매체에 저장된 명령으로 구성된다. 수신된 요청 스트링은 JSP, 서브렛 및 원격 엔터프라이즈 자바 빈 콜의 형태일 수 있다.The computer program of the present invention is a medium which, when executed in a processor, causes the processor to perform the steps of receiving an input of a request string and mapping the received request string to a distinguishable request string and a breakable request string. It consists of commands stored in. The received request string may be in the form of JSP, servlet, and remote enterprise Java bean call.
본 발명의 컴퓨터 프로그램은 프로세서에서 성능되는 경우, 명령이 프로세서로 하여금 적어도 하나의 어플리케이션을 성능하는 시스템에서, 모니터링 및 관리를 위한 다양한 콤포넌트를 갖는 관리 어플리케이션을 제공하고, 콤포넌트의 구성 및 콤포넌트 사이의 관계에 관한 정보를 실시간으로 사용자에게 모니터링하고 제공하는 단계를 성능하도록 하는 매체에 저장된 명령으로 구성된다.The computer program of the present invention provides a management application having various components for monitoring and management in a system in which instructions cause the processor to perform at least one application, when the performance is at a processor, and the configuration of the components and the relationship between the components. It consists of instructions stored on a medium to enable the performance of monitoring and providing information to the user in real time.
본 발명의 컴퓨터 프로그램은 프로세서에서 성능되는 경우, 명령이 프로세서로 하여금 각각의 사용자에게 기능을 지정하고, 기능으로의 접근과 접근 제어 리스트에 의한 각각의 사용자 사이에서 매핑하는 단계를 성능하도록 하는 매체에 저장 된 명령으로 구성되고, 여기서 기능으로의 접근은 사용자의 지정된 기능에 따라 제한된다.The computer program of the present invention, when performed on a processor, includes instructions that, when executed by a processor, cause the processor to perform the steps of assigning a function to each user and mapping between each user by access to the function and by an access control list. Consists of stored commands, where access to the function is restricted according to the user's assigned function.
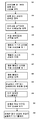
도 1은 본 발명에 따른 방법을 설명하는 흐름도이다.1 is a flow chart illustrating a method according to the invention.
도 2A 및 도 2B는 본 발명에 따른 방법을 설명하는 흐름도이다.2A and 2B are flowcharts illustrating a method according to the invention.
도 3은 본 발명에 따른 방법의 개략적 설명도이다.3 is a schematic illustration of the method according to the invention.
도 4는 본 발명에 따른 방법을 설명하는 흐름도이다.4 is a flow chart illustrating a method according to the present invention.
도 5는 본 발명에 따른 방법을 설명하는 흐름도이디.5 is a flow chart illustrating a method in accordance with the present invention.
도 6은 본 발명의 특징을 설명하는 개략도이다.6 is a schematic diagram illustrating features of the present invention.
도 7은 본 발명의 특징을 설명하는 개략도이다.7 is a schematic diagram illustrating features of the present invention.
도 8은 일례의 구조를 설명하는 개략도.8 is a schematic diagram illustrating an example structure.
도 9는 일례의 구조의 특징을 설명하는 개략도.9 is a schematic diagram illustrating features of an example structure.
도 10은 일례의 구조의 특징을 설명하는 도면.10 is a view for explaining characteristics of an example structure.
도 11은 일례의 구조의 특징을 설명하는 개략도.11 is a schematic diagram illustrating features of an example structure.
도 12는 일례의 구조의 특징을 설명하는 개략도.12 is a schematic diagram illustrating features of an example structure.
도 13은 일례의 구조를 설명하는 흐름도.13 is a flowchart for explaining an example structure.
본 발명은 컴퓨터 시스템, 컴퓨터 프로그램 및 본 발명에 따른 목적을 성취하기 위한 시스템의 형태의 성능에 관한 정보를 모니터링하고 제공하는 프로세스를 포함한다. 본 방법 및 시스템은 본 발며에 따른 목적을 성취하고 본 발명의 시스템 에서 사용하기 위한 컴퓨터 프로그램과 관령하여 설명된다. 본 발명의 컴퓨터 프로그램은 어플리케이션 서버에서 성능하는 어플리케이션에 특히 유용하다. 본 발명의 컴퓨터 프로그램은 사용자에게 다양한 정보 및 옵션을 제공하는 사용자 인터페이스를 포함한다. 어플리케이션 및 서버에 설치된 프로브(probe)는 어플리케이션의 동작에 관계된 정보를 획득하고, 분석 및 보고를 하기 위한 다른 프로그램 콤포넌트에 대한 정보를 사용자에게 제공한다.The invention includes a process for monitoring and providing information concerning the performance of a computer system, a computer program and a system for achieving the object according to the invention. The method and system are described in conjunction with a computer program for use in the system of the present invention and for achieving the object according to the present invention. The computer program of the present invention is particularly useful for applications that perform in an application server. The computer program of the present invention includes a user interface for providing various information and options to a user. Probes installed in the application and server provide information to the user about other program components for obtaining information related to the operation of the application and for analyzing and reporting.
[모니터링 레벨 및 스케줄][Monitoring level and schedule]
본 발명에 따른 방법, 시스템 및 컴퓨터 프로그램에 있어서, 서버에서 성능되는 어플리케이션의 동작에 관해 상세히 선택된 레벨을 제공하는 능력이 제공된다. 사용자는 도 10의 105에 지시된 것처럼, 모니터링하는 정보를 확인하도록 재촉받는다. 사용자에게 모니터링하기 위한 상세 레벨에 관하여 적어도 2가지의 선택 사항이 바람직하게 제공된다. 모니터링의 상세 항목 레벨은 어플리케이션의 성능에 관하여 획득된 정보의 양 및 성질을 지칭한다. 모니터링 상세의 레벨은 또한 획득된 데이터 또는 정보의 양을 지칭할 수 있다. 상세의 레벨은 획득된 정보의 성질을 또한 참고할 수 있다. 예를 들어, 서버 이용 정보 같은 어떤 형태의 정보는 상대적으로 고 상세 레벨이다. 방법 트레이스(trace) 정보 같은 다른 형태의 정보는 상대적으로 저 상세 레벨이다.In the method, system and computer program according to the present invention, the ability to provide a selected level of detail with respect to the operation of an application being performed on a server is provided. The user is prompted to confirm the information being monitored, as indicated at 105 in FIG. At least two options are preferably provided with respect to the level of detail for the user to monitor. The level of detail of monitoring refers to the amount and nature of the information obtained regarding the performance of the application. The level of monitoring detail may also refer to the amount of data or information obtained. The level of detail may also refer to the nature of the information obtained. For example, some form of information, such as server usage information, is at a relatively high level of detail. Other forms of information, such as method trace information, are relatively low detail.
사용자는 모니터링의 레벨을 선택하도록 재촉받을 수 있다. 사용자는 모니터에 특별한 특징을 선택할 수 있다. 이와 달리, 미리선택된 모니터링 레벨을 제공받을 수 있다. 각각의 미리선택된 모니터링 레벨은 모니터되고 보고되는 특별한 정보 와 관련이 있다. 도 1의 블럭(110)에 지시된 것처럼, 모니터링 레벨 또는 특별한 특징의 선택을 사용자로부터 수신하는 경우, 본 발명의 프로그램은 지시된 것처럼 어플리케이션 성능을 모니터하고, 사용자에게 유용한 모니터된 성능 정보를 만든다. 일례를 들자면, 도 1에 설명된 것처럼, 3가지 레벨의 모니터링이 제공될 수 있다. 사용자로부터 요청을 수령하는 경우, 시스템은 결정 블록(115)에 의해 지시된 것처럼, 모니터링 레벨을 결정한다. 레벨1 에서, 최고 레벨, 그러므로 최소 정보를 제공하는 레벨인 정보는 특성상 요청 레벨 데이터 및 서버 레벨 데이터일 수 있다. 예를 들어, 관련된 정보는 블록(120)에 지시된 것처럼, 이용 관리, 시스템 리소스, 분산 플랫폼 및 기본 요청 데이터일 수 있다. 이용 관리는 특별한 어플리케이션이 특별한 서버에서 성능하는 지에 관한 정보를 포함한다. 시스템 리소스는 사용할 수 있는 메모리의 양 같은 그러한 정보 및 사용가능한 접속수를 지시한다. 기본 요청 데이터는 만들어진 요청의 수, 완료된 요청의 수 등을 지시한다.The user may be prompted to select a level of monitoring. The user can select special features for the monitor. Alternatively, a preselected monitoring level may be provided. Each preselected monitoring level is associated with specific information that is monitored and reported. As indicated by
같은 예에서, 사용자는 레벨2 모니터링을 선택할 수 있다. 레벨2 모니터링 선택은 통상 블록(125)에 지시된 것처럼, 추가적인 정보를 가지고 레벨1 모니터링에 의해 제공되는 모든 정보를 포함한다. 추가적인 정보는 SQL 데이터, JMS 데이터 및 EJB 콜 데이터 같은 API 레벨 데이터일 수 있다. 그러한 데이터는 특별한 CPU의 처리량에 관한 데이터를 포함한다. 사용자로 하여금 소프트 요청 캔슬(cancel)을 제공하도록 허용하는 기능성은 제공될 수 있다. 아무런 방법 데이터 또는 SQL 데이터가 제공되지 않는다. 추가적인 데이터를 제공하기 위하여, JVMPI는 대응하는 JVM에서 인에블된다. 이 레벨은 문제 결정과 관련이 있고, 때때로 불안정하게 많은 양의 트랜젝션을 갖는 서버에 사용될 수 있다. 트랜젝션의 복잡함은 변화될 수 있다. JVMPI가 대응하는 JVM에 인에이블되기 때문에, 사용자는 이하 설명될 레벨3 같은 모니터링의 더욱 상세한 레벨로 동적으로 변화하는 옵션이 제공될 수 있다.In the same example, the user can select level 2 monitoring. The level 2 monitoring selection typically includes all the information provided by the level 1 monitoring with additional information, as indicated in
같은 예에서, 사용자는 레벨3 모니터링을의 선택할 수 있다. 레벨3 모니터링은 레벨2 모니터링과 연결되어 공급되는 정보, 플러스 방법 레벨 데이터를 제공한다. 레벨3은 진보된 문제 결정 및 예를 들어, 블록(130)에 의해 지시된 것처럼, 방법 및 SQL 레벨 데이터을 보고하고 포함하는 것을 포함할 수 있다. JVMPI는 대응하는 JVM에서 인에이블된다. JVMPI 기능 콜은 가능하고, 방법 엔트리 및 엑시트 이벤트가 선택된다. 이 레벨은 진단, 상세한 워크로드 특성 및 프로파일링에 선택되는 서버에 대표적으로 사용된다. 이 레벨이 상기 주석한 것처럼, JYMPI의 인에블링을 요구하기 때문에, 상기 설명한 예로 든 레벨2 와 같은 JVMPI가 인에블된 이 레벨 및 다른 레벨 사이에서 동적으로 변화하게 하는 것이 가능하다. 모든 경우에 있어서, 상기 주석한 것처럼, 블록(135)에 의해 지시된 것처럼, 모니터된 정보는 사용자에게 보여진다.In the same example, the user can select level 3 monitoring of. Level 3 monitoring provides information, plus method level data, that is supplied in conjunction with level 2 monitoring. Level 3 may include advanced problem determination and reporting and including method and SQL level data, for example, as indicated by
바람직한 실시예에 있어서, 사용자는 블록(140)에 의해 지시된 것처럼, 모니터링하는 스케줄을 정의하도록 재촉받는다. 스케줄은 블록(145)에 의해 지시된 것처럼, 사용자로부터 수신되고, 모니터링은 블록(150)에 의해 지시된 것처럼 스케줄에 따라 진행한다. 스케줄은 달력 날짜 및 시간, 모니터링 레벨과 서버 또는 서버의 그룹에 의해 바람직하게 정의된 적어도 시작 시간을 정의한다. 모니터링 레벨 보다는 오히려, 본 발명의 프로그램에 의해 사용자는 모니터링하는 개인적 데이터 항목을 선택할 수 있다. 스케줄은 변화하는 모니터링 레벨을 위한 시간을 정의할 수 있고, 달력 날짜 및 시간에 또한 관한 것일 수 있다. 스케줄은 각각의 월, 각각의 주 또는 각각의 일과 같은 적절한 바탕에 순환하도록 선택될 수 있다. 바람직한 실시예에서, 스케줄은 스케줄 레코드의 그룹으로 구성되고, 그 각각은 시작 날짜 및 시간과 모니터링 레벨의 조합이다. 본 발명의 프로그램에 의해 모니터링이 제1 스케줄 레코드와 함께 시작되고, 모니터링이 현재 시간이 다른 스케줄 레코드의 시작 시간 및 날짜일 경우 변화한다. 이 과정은 계속되는 스케줄 레코드를 통하여 계속된다. 디폴트 모니터링 레벨은 아무런 모니터링이 스케줄에 상술되지 않는 경우의 시간에 사용을 위하여 제공될 수 있다. 프로그램은 디폴트로 제공될 수 있고, 사용자에 의해 변경될 수 있다. 사용자는 하나 이상의 서버 또는 서버 그릅에 완성된 스케줄을 적용하도록 재촉받는다. 사용자는 존재하는 스케줄을 복사하는 옵션을 제공받을 수 있고, 그 다음 스케줄을 적용하는 서버 또는 서버 그룹을 위해 재촉받는다. 사용자는 스케줄의 필드를 수정하는 옵션을 제공받을 수 있다. 바람직하게, 만일 스케줄이 서버 또는 서버 그룹의 제거에 의해 수정되면, 사용자는 다른 스케줄을 그 서버 또는 서버 그룹에 적용하도록 재촉받을 것이다. 프로그램은 사용자가 주어진 서버로부터 모든 스케줄을 제거하는 겻을 방지하도록 구성될 수 있다. 또한, 주어진 서버 또는 그룹으로부터 모든 스케줄을 제거할 때, 영향받은 서버 또는 서버 그룹의 모니터링은 디폴트 모니터링 레벨로 복귀할 수 있다. 사용자는 스케줄을 제거하는 옵션을 제공받을 수 있고, 모니터링은 삭제된 스케줄에 대응하는 서버 또는 서버 그룹과 시간을 위한 디폴트 레벨에서 발생할 수 있다.In the preferred embodiment, the user is prompted to define a monitoring schedule, as indicated by
미리선택되도록 모니터되는 항목을 가지고, 프로그램된 모니터링 레벨이 사용될 수 있는 것에 비하여, 본 발명의 시스템에 의해 사용자는 적절한 권한을 갖고 모니터되는 항목을 수동으로 변경할 수 있다. 그러한 수동에 의한 변경은 일시적 으로만 바람직하게 이용되고, 특별한 서버 또는 서버 그룹에 제한될 수 있다.With the items monitored to be preselected and the programmed monitoring level can be used, the system of the present invention allows the user to manually change the monitored items with appropriate privileges. Such manual change is preferably used only temporarily, and may be limited to a particular server or server group.
만일 서버가 재시작되면, 시스템은 모니터링의 적절한 레벨을 결정하는 이력 프로브 경로를 따른다. 만일 스케줄러를 접촉하고, 일시적 오버라이드 그 다음 스케줄된 모니터링 레벨을 요청하는 것이 가능하다면, 그러면 시스템-와이드(wide) 모니터링 레벨이 사용된다. 스케줄러가 접촉될 수 없는 경우, 그러면 디폴트 모니터링 레벨이 사용된다. If the server is restarted, the system follows a historical probe path that determines the appropriate level of monitoring. If it is possible to contact the scheduler and request a temporary override then scheduled monitoring level, then the system-wide monitoring level is used. If the scheduler cannot be contacted, then the default monitoring level is used.
[모니터링 트랩 및 경고][Monitoring Traps and Alerts]
본 발명에 따른 방법, 시스템 및 컴퓨터 프로그램에 있어서, 서버의 모니터링이 발생하고 있더라도, 경고가 사용자에게 제공된다. 경고는 선택된 매칭 조건 또는 조건에 대한 임계치에 도달하는 선택된 서버 또는 서버 그룹에 모니터된 리소스의 파라미터의 결과로서 제공된다. 여기서는 사용자에게 통지 또는 경고를 제공할 수 있는 소프트웨어를 소프트웨어 트랩이라고 한다. 사용자는 본 발명에 따른 프로그램의 메뉴로부터 소프트웨어를 생성 또는 수정하는 옵션을 선택할 수 있다.In the method, system and computer program according to the invention, an alert is provided to the user even if monitoring of the server is taking place. The alert is provided as a result of the parameter of the monitored resource to the selected server or group of servers reaching a threshold for the selected matching condition or condition. Software that can provide notifications or alerts to users is referred to herein as software traps. The user can select an option to create or modify software from the menu of the program according to the invention.
사용자가 새로운 소프트웨어 트랩을 생성하기 위하여 만들도록 재촉받는 많은 선택들이 있다. 이 선택은 트랩이 적용될 서버 또는 서버 그룹, 측정되는 리소스 및 조건을 포함한다. 도 2의 보기에 지시된 것처럼, 제1 단계는 블록(205)에 지시된 것처럼, 서버 또는 서버 그룹을 선택하도록 사용자를 재촉할 수 있다. 선택은 블록(210)에 의해 지시된 것처럼 수신된다.There are many options prompting the user to make a new software trap. This selection includes the server or server group to which the trap will be applied, the resources being measured, and the conditions. As indicated in the example of FIG. 2, the first step may prompt the user to select a server or server group, as indicated in
요구되는 정보는 트랩의 형태에 따라 다양하고, 사용자는 블록(215)에 지시된 것처럼 트랩의 형태에 재촉받는다.The information required varies depending on the type of trap, and the user is prompted by the type of trap as indicated in
트랩의 제1 형태에 대하여, 결정 블록(220) 및 블록(225)에 지시된 것처럼, 임계치의 형태의 리소스 및 조건은 선택되어야 한다. 리소스는 발생, CPU 시간, 거주 시간, 대기 시간 및 SQL 거주 시간을 포함한다. 임계치는 특별한 형태의 리소스에 의존한다. 리소스를 선택하는 경우, 230에서 처럼, 시스템은 임계치의 선택을 위하여 사용자에게 단위를 제공할 수 있다. 트랩은 임의의 요청, 구체적인 요청 이름 또는 구체적인 방법 이름에 적용될 수 있다. 그러면 트랩은 블록(235)에 의해 지시된 것처럼, 선택된 리소스를 모니터하도록 진행한다. 만일 임계치가 만족된다면, 그러면 시스템은 블록(236, 237)에 지시된 것처럼, 경고 조건이 트리거될 지를 평가한다. 만일 그렇지 않다면, 그러면 블록(238)에 지시된 것처럼, 이벤트는 기록될 수 있다. 만일 경고 조건이 만족된다면, 그러면 경고는 239에서 처럼, 사용자와 통신하고 기록된다.For the first type of trap, as indicated in
소프트웨어 트랩의 제2 형태에 대하여, 블록(240, 242)에 지시된 것처럼, 많은 히트를 갖는 리소스 및 조건은 선택되어야 한다. 이 형태의 소프트웨어 트랩을 설정하기 위해, 사용자는 242에서 처럼, 리소스 및 조건을 상술하도록 재촉받는다. 리소스는 예를 들어, HTTP 요청 파라미터 또는 SQL 스테이츠먼트일 수 있다. HTTP 또는 SQL 요청에 대하여, 조건은 HTTP/SPL 요청에 내장된 구체적 스트링이다. 조건은 스트링에 적용된 불리안 표현의 형태가 또한 될 수 있다. 사용자가 요청된 리소 스 및 조건을 244에서 제공하는 경우, 소프트웨어 트랩은 도 2B의 246에서 처럼, 모니터링을 성능한다. 요청 또는 스테이트먼트가 조건 만족을 확인할 때마다, 히트 카운터는 도 2B의 블록(248, 250 및 252)에 의해 지시되는 것처럼, 증가된다. 만일 충분한 히트가 카운트된다면, 그러면 경고 조건은 도달되고, 경고는 254에서 처럼 통신하고 기록된다.For the second form of software trap, as indicated in
제3 형태의 트랩은 응용 서버의 리소스 소비의 조건에 적용한다. 사용자는 응용 서버 또는 그룹을 선택하도록 요구된다. 사용자는 도 2B의 블록(260, 262 및 264)에 지시된 것처럼, 리소스와 임계치, 리소스 및 임계에 대하여 상술하도록 재촉받는다. 리소스는 응용 서버 이용가능성, 데이터베이스 연결 풀 및 JVM 런타임 메모리에 관계한 정보를 포함할 수 있다. 서버 이용가능성은 단순한 포지티브 또는 네가티브로서 측정된다. 데이터베이스 연결 풀에 관하여, 많은 다른 임계가, 연결의 수에 할당된 연결의 수; 연결을 기다리는 줄의 평균 수; 클라이언트가 연결을 수여받도록 기다리는 평균 시간; 연결 풀 타임아웃의 수; 사용하는 풀의 평균 퍼센트를 포함하여 설정될 수 있다. JVM 런타임 메모리에 대하여, 리소스는 JVM 런타임에서의 프리 메모리의 양 및 JVM 런타임에서 사용되는 메모리의 양일 수 있다. 사용자는 수를 제공하고 수가 최대 또는 최소인지를 가리키도록 재촉받는다. 적절한 단위 예를 들어 프리 메모리 및 사용되는 메모리에 대해 Mbytes가 사용자에게 제공될 수 있다. 사용자는 경고 메세지가 생성되기 전에 조건이 충족되는 시간의 수를 선택하도록 또한 재촉받는다. 리소스는 266에 지시되는 것처럼, 모니터되고, 만일 경고 조건이 충족된다면, 경고는 268 및 270에 도시된 것처럼, 통신하고 기록된다.The third type of trap applies to the condition of resource consumption of the application server. The user is required to select an application server or group. The user is prompted to specify resources and thresholds, resources and thresholds, as indicated in
어떤 환경 하에서 조작자가 트랩에 의해 확인된 데이터에 관하여 통지를 받는 지를 결정하는 경고 조건이 설명된다. 조작에 있어서, 소프트웨어 트랩에 설정된 임계 조건이 충족되는 경우, 사용자에 의해 설정된 조건에 따라, 경고가 보내지거나 또는 카운터가 증가된다. 만일 카운터가 증가된다면, 그러면 새로운 카운트는 임계에 대하여 체크된다. 경고 액션은 수개의 형태를 취할 수 있다. 경고는, 트랩 조건, 오펜딩(offending) 모니터된 리소스, 오펜딩 값 및 날짜/시간 스탬프를 포함하여, 회계 목적을 위해 바람직하게 기록된다. 오펜딩 요청의 국부 덤프, 방법 또는 쓰레드(thread)는 디스플레이에 접근할 수 있는 것처럼, 생산될 수 있다. 스택 트레이스 및 방법 트레이스는 제공될 수 있다. 하나 이상의 개인은 이메일 또는 SNMP 경고와 같은 다른 메세지에 의해서와 같이 통지될 수 있다. 경고의 점증은, 예를 들어 임계의 제3 발생 후에만 이메일을 보내는 것에 의해 포함될 수 있다. 다중 조건에 취해진 다중 액션의 다른 예는 쉽게 상상될 수 있다. 히트의 임계 수가 검출되는 경우, 카운터는 제로로 리셋된다. 만일 불리안 조건이 상술된다면, 조건은 경계가 충족되는 각각의 시간에 재평가된다. 만일 방법이 상술된다면, 조건은 방법이 검출된 후에 재평가된다.Warning conditions are described that determine under what circumstances the operator is informed about the data identified by the trap. In operation, if the threshold condition set in the software trap is met, a warning is sent or the counter is incremented, depending on the condition set by the user. If the counter is incremented then the new count is checked against the threshold. Warning actions can take several forms. Alerts are preferably recorded for accounting purposes, including trap conditions, offending monitored resources, offending values, and date / time stamps. Local dumps, methods, or threads of offending requests can be produced, just as they can access the display. Stack traces and method traces may be provided. One or more individuals may be notified as by other messages such as email or SNMP alerts. Increment of an alert may be included, for example, by sending an email only after a threshold third occurrence. Other examples of multiple actions taken on multiple conditions can be easily imagined. If the threshold number of hits is detected, the counter is reset to zero. If a Boolean condition is specified, the condition is reevaluated each time the boundary is met. If the method is specified, the condition is reevaluated after the method is detected.
트랩/경고 기록은 날짜/시간 스탬프에 의한 엔트리와 경고로부터 획득된 다른 정보를 확인하면서 유지된다. 사용자는 기록 및 카운터를 보면서 트랩을 모니터할 수 있다. 사용자는 액티브와 인액티브 상태 사이에서 트랩을 토글하는 능력을 제공받을 수 있다.Trap / warning records are maintained, confirming entries by date / time stamps and other information obtained from alerts. The user can monitor the traps while viewing records and counters. The user may be provided with the ability to toggle traps between active and inactive states.
[응용 성능 분석][Application Performance Analysis]
본 발명의 방법, 시스템, 및 컴퓨터 프로그램에 있어서, 프로그램은 성능 분석을 획득하는 능력을 제공한다. 정보는 상대적으로 고 레벨에서 제공되고, 사용자는 더 이상의 상세한 정보를 요청하고 수신하는 옵션을 갖는다. 정보는 보고로서 참조될 포맷으로 제공된다. 일반적으로, 사용자는 도 3의 305에 지시되는 것처럼, 보고의 형태를 선택하도록 재촉받고, 고 레벨 보고 또는 경향 보고가 310에 지시된 것처럼 사용자에게 보여진다. 경향 보고로부터, 사용자는 다양한 더욱 상세한 보고를 선택하는 옵션을 제공받는다. 사용자는 연속적으로 더 상세한 보고를 획득하는 옵션을 받는다. 사용자는 이전 시간 주기로부터 베이스라인 데이터에 대한 보고의 성능 데이터를 비교하는 옵션을 갖는다. 보고는 어플리케이션의 전망으로부터 서버 이용가능성, 서버 리소스, 사업 수행, 어플리케이션 성능, 및 데이터베이스 성능과 같은 정보를 포함한다.In the method, system, and computer program of the present invention, the program provides the ability to obtain performance analysis. The information is provided at a relatively high level, and the user has the option to request and receive further detailed information. The information is provided in a format to be referred to as a report. In general, the user is prompted to select the type of report, as indicated at 305 of FIG. 3, and is shown to the user as if a high level report or trend report is indicated at 310. From the trend report, the user is provided with the option of selecting various more detailed reports. The user is subsequently given the option to obtain more detailed reports. The user has the option to compare the performance data of the report against the baseline data from the previous time period. The report includes information such as server availability, server resources, business performance, application performance, and database performance from the perspective of the application.
응용 프로그래머 인터페이스(API)와, 구체적인 응용 서버(예를 들어, 웹스피어(WebSphere)의 PMI) 및 데이터 컬렉터가 동작하는 사용자의 어플리케이션에 의해 제공되는 서비스로부터, 데이터는 획득된다. 획득된 데이터는 데이터의 작업 셋일 것이다. 선택된 형태의 보고인 경향 보고는 획득될 수 있다. 보고는 서버 그룹 레벨에 저장된다. 초기에, 데이터는 API와 서버와 사용자 어플리케이션과 같이 획득된다. 사용자는 캡쳐되는 응용 데이터의 양을 결정할 수 있다. 이 양은 저장되어야 하는 총 요청 샘플의 퍼센트로 표현될 수 있다. 사용자는 요청 샘플이 취해지는 응용 서버를 선택하도록 재촉받는다. 사용자는, 사용자가 데이터의 스냅샷을 시스템이 취하도록 원하는 분과 같은 시간 주기에 관하여, 주파수를 선택하도록 재촉받을 수 있다.Data is obtained from an application programmer interface (API), a specific application server (e.g., PMI in WebSphere) and services provided by the user's application on which the data collector operates. The data obtained will be a working set of data. Trend reports, which are reports of the selected type, can be obtained. The report is stored at the server group level. Initially, data is acquired along with APIs and servers and user applications. The user can determine the amount of application data that is captured. This amount can be expressed as a percentage of the total request samples that must be stored. The user is prompted to select the application server from which the request sample is taken. The user may be prompted to select a frequency with respect to a time period, such as the minute that the user wants the system to take a snapshot of the data.
중복된 데이터의 사용은 제한되어야만 한다. 샘플링 레이트는 얼마나 많은 데이터가 성능 히스토리 데이터베이스에 기록되는 지를 결정하도록 정의된다. 사용자는 샘플링 레이티오를 설정하도록 지극받고, 그에 의해 데이터베이스에 저장을 위해 요구되는 데이터의 양을 제한한다. 도표 1은 매트릭, 각각의 매트릭의 설명, 및 데이터가 획득되는 리소스를 보인다.The use of duplicate data should be limited. The sampling rate is defined to determine how much data is written to the performance history database. The user is urged to set up the sampling rate, thereby limiting the amount of data required for storage in the database. Table 1 shows the metrics, a description of each metric, and the resources from which the data is obtained.
경향 및 단일 데이터 포인트에 대한 분해 보고 형태를 보여주는 보고 형태를 포함하여, 다양한 형태의 보고가 제공될 수 있다. Various forms of reporting can be provided, including report forms showing trends and decomposition report forms for a single data point.
일실시예에 있어서, 도 3에 도시된 것처럼, 사용자는 305에 지시된 것처럼, 작업 세트를 위한 특정 데이터를 제공하도록 재촉받고, 그 다음 310에 도시된 것처럼, 그 데이터를 제공한다. 이 데이터는 어플리케이션 서버 또는 그룹, 분석 형태, 데이터 주기, 데이터 간격, 집합 주기, 즉 요청, 방법, SQL, 서버 사용가능성, 어플리케이션 서버 분석 및 베이스라인 같은 데이터가 그룹화되는 방법, 데이터 포인트를 선택하는 표준 필터링, 분석 형태를 포함한다. 그러면 사용자는 315에 도시된 것처럼, 분석 형태를 선택할 수 있다.In one embodiment, as shown in FIG. 3, the user is prompted to provide specific data for the working set, as indicated at 305, and then provide that data, as shown at 310. This data is a standard for selecting data points, application servers or groups, types of analysis, data cycles, data intervals, aggregation cycles, such as requests, methods, SQL, server availability, application server analysis, and baselines. Includes filtering and analysis forms. The user can then select the analysis type, as shown at 315.
만일 요청 분석이 선택된다면, 320에 도시된 것처럼, 사용자는 매트릭을 선택하도록 재촉받는다. 매트릭의 예는 321에 도시된 것처럼, 처리량, 응답 시간, CPU 타임이다. 선택에 대한 응답에 있어서, 경향 분석은 322에 도시된 것처럼, 시간 간격 및 어플리케이션 서버를 지시하는 라벨로 제공된다. 사용자는 요청 형태 또는 요청 이름에 의해, 또는 만일 보고가 서버 그룹에 적용된다면 서버 이름에 의해 요청 경향 분석을 파괴할 수 있다. 앞서의 파괴는 323에 도시된 것처럼, 분해로 불릴 수 있다. 사용자는 분해의 어떠한 일부분을 파괴할 수 있다. 또한, 경향 보고로부터, 사용자는 어떠한 하나의 데이터 포인트에 대해 상세를 얻을 수 있다. 이 더이상의 파괴는 324에 도시된 것처럼, 상세 보고로 불릴 수 있다. 상세 보고는 상세 보고의 일기록에 대해, 325에 도시된 것처럼, 트레이스 보고로 더욱 파괴될 수 있다. 트레이스 보고는 선택된 매트릭에서와 같이 방법 엔트리 및 엑시트 정보를 제공한다. 따라서, 그것은 사용자가 상세의 더 이상의 레벨로 꿰뚫을 수 있다는 것을 보여줄 수 있다.If request analysis is selected, the user is prompted to select a metric, as shown at 320. Examples of metrics are throughput, response time, and CPU time, as shown at 321. In response to the selection, the trend analysis is provided with a label indicating the time interval and the application server, as shown at 322. The user can destroy the request trend analysis by request type or request name, or by server name if the report applies to a server group. The foregoing destruction may be referred to as decomposition, as shown at 323. The user can destroy any part of the disassembly. In addition, from the trend report, the user can get details on any one data point. This further destruction may be referred to as detailed reporting, as shown at 324. The detailed report can be further destroyed by the trace report, as shown at 325, for a record of the detailed report. Trace reporting provides method entry and exit information as in the selected metric. Thus, it can show that the user can penetrate to further levels of detail.
만일 방법 분석이 선택된다면, 330에서 처럼, 사용자는 331에 지시된 것처럼, 처리량, 응답 시간 및 CPU 타임 중의 하나일 수 있는 매트릭을 선택하도록 재촉받는다. 사용자는 구체적 요청 이름, 요철 형태, 또는 방법 이름 같은 항목에 보고를 제한하는 옵션을 제공받는다. 사용자로부터 선택을 입력받은 후에, 본 발명의 시스템은 332에 지시된 것처럼, 경향 분석으로 보고를 생성한다. 경향 보고로부터, 사용자는 요청 이름 또는 요청 형태에 의해 경향 분석의 파괴를 선택할 수 있다. 결과 보고는 333에 지시된 것처럼, 방법 분석을 위한 분해 보고로 불릴 것이다. 적용가능하다면, 사용자는 만일 보고가 서버 그룹을 커버한다면, 서버에 의해 경향 분석 보고를 분해할 수 있다. 사용자는 개개인의 기록에 의해 상세 및 뷰(view)로의 파괴를 위한 방법 분석에 대한 분해 보고의 어떠한 일부분을 선택할 수 있거나 또는 사용자는 기록으로의 경향 보고의 단일 데이터 포인트의 파괴를 선택할 수 있다. 결과 보고는 334에 지시된 것처럼, 상세 보고로 불린다.If method analysis is selected, as at 330, the user is prompted to select a metric, which may be one of throughput, response time, and CPU time, as indicated at 331. The user is given the option of restricting reporting to items such as specific request names, irregularities, or method names. After receiving a selection from the user, the system of the present invention generates a report by trend analysis, as indicated at 332. From the trend report, the user can choose to break trend analysis by request name or request type. The result report will be referred to as decomposition report for method analysis, as directed at 333. If applicable, the user can disassemble the trend analysis report by the server if the report covers the server group. The user may select any portion of the decomposition report for analysis of the method for destruction into detail and view by individual record, or the user may choose to destroy a single data point of the trend report into the record. The resulting report is called a detailed report, as indicated at 334.
만일 사용자가 340에서 처럼, SQL 분석 보고를 선택한다면, 사용자는 341에서 처럼, 처리량 및 응답 시간의 매트릭 중의 하나를 선택하도록 재촉받는다. 사용자는 구체적인 요청 이름 또는 요청 형태, 방법 이름, 표 이름, 또는 SQL 콜을 선택할 수 있다. 응답을 할 때, 시스템은 342에서 처럼, 경향 분석을 제공한다. 경향 분석은 343에서 처럼, 분해 보고를 제공하기 위하여 요청 이름, 요청 형태, 방법 이름 및/또는 표 이름에 의해 파괴될 수 있다. 보고는 총 퍼센티지로서 샘플의 수 를 포함할 수 있다. 사용자는 개개인의 기록에 의한 상세를 얻도록 분해 보고의 어떠한 일부분을 파괴할 수 있거나 또는 개개인의 기록을 획득하도록 단일 데이터 포인트에 의해 경향 보고를 파괴할 수 있다. 개개인 기록을 갖는 보고는 344에서 처럼, 상세 보고로 알려진다.If the user selects SQL analysis reporting, as in 340, the user is prompted to choose one of the metrics of throughput and response time, as in 341. The user can select a specific request name or request type, method name, table name, or SQL call. In response, the system provides trend analysis, as in 342. Trend analysis may be broken by request name, request type, method name and / or table name to provide a decomposition report, as in 343. The report may include the number of samples as a total percentage. The user can destroy any portion of the disassembly report to get details by individual records or the trend report by a single data point to obtain individual records. Reports with individual records are known as detailed reports, as in 344.
만일 사용자가 350에서 처럼, 서버 사용가능 분석 보고를 선택한다면, 경향 분석은 351에서 처럼, 제공된다. 아무런 매트릭도 선택되지 않는다. 사용가능성을 위한 경향 보고를 할 때, 시스템은 시간 간격의 연속에 걸쳐 그룹의 퍼센트 업 시간을 플롯할 수 잇다. 사용자는 352에서 처럼, 응용 서버에 의해, 그룹을 위한 경향 보고를 파괴할 수 있다.If the user selects a server available analysis report, as in 350, a trend analysis is provided, as in 351. No metric is selected. When reporting trends for availability, the system can plot the percentage up time of the group over a series of time intervals. The user can destroy the trend report for the group, by the application server, as in 352.
어플리케이션 서버 분석 보고는 360에서 처럼 선택될 수 있다. 사용자는 361에서 처럼, 다음 매트릭 중의 하나: 풀 사이즈, 동시의 웨이터, 평균 대기 시간, 폴트, 퍼센티지 풀 사용법, 물리적 연결, JVM 프리 메모리 및 사용된 JVM 메모리를 제공하도록 재촉받을 수 있다. 경향 분석 보고는 362에서 처럼, 제공된다.The application server analysis report can be selected as in 360. The user may be prompted to provide one of the following metrics: full size, simultaneous waiter, average wait time, fault, percentage pool usage, physical connection, JVM free memory, and JVM memory used, as in 361. Trend analysis reports are provided, as in 362.
보고는 어떠한 적절한 방법에서 제공될 수 있다. 경향 보고는 각각의 데이터 포인트를 위한 모든 데이터의 터블러쳐(tablature) 뷰를 갖는 라인 그래프일 수 있다. 비교 베이스라인 디스플레이는 시간을 지난 선택된 시간에서 같은 데이터를 보여주며, 제공될 수 있다. 예를 들어, 베이스라인 데이터는 이전의 날에 같은 시간에 대한 같은 데이터를 보여줄 수 있다. 분해 보고를 위하여, 바(bar) 또는 파이(pie) 그래프는 형태 당 모든 데이터의 터블러쳐 뷰로 제공될 수 있다. 사용자는 상세 보고를 꿰뚫기 위해 분해 보고의 일부분을 바람직하게 선택할 수 있다. 베이 스라인 데이터는 비교용 상세 보고에 제공될 수 있다.The report may be provided in any suitable way. The trend report may be a line graph with a tablature view of all the data for each data point. A comparison baseline display shows the same data at the selected time over time and may be provided. For example, the baseline data can show the same data for the same time on the previous day. For decomposition reports, a bar or pie graph can be provided as a blurt view of all data per form. The user may preferably select a portion of the decomposition report to penetrate the detailed report. Baseline data can be provided in a detailed report for comparison.
소프트웨어 일관성 체크Software consistency check
본 발명의 방법, 시스템 및 프로그램에 있어서, 다양한 서버에서의 어플리케이션의 동작 비교는 성능될 수 있다. 그러한 비교는 다른 서버의 가능한 구성 문제를 확인하는 데 값가 있다.In the methods, systems and programs of the present invention, the comparison of the operation of applications on various servers can be performed. Such a comparison is valuable in identifying possible configuration problems with other servers.
그러한 비교의 예는 n-way diff로 불린다. 각각의 서버에 관하여, 본 발명의 프로그램은 어떻게 시스템이 셋업되고 인스톨되는 지에 관해 런타임 환경 데이터를 획득한다. 이러한 환경은 시스템, 자바 및 어플리케이션 서버일 수 있다. 시스템을 위해, 환경 정보가 CPU 속도, CPU 온라인의 수, CPU 오프라인의 수, 메모리, 운영 체제 버전, 및 물리적 디스크 공간을 포함할 수 있다. 다른 정보가 포함될 수도 있다. 자바를 위해, 정보는 JDK 버전, 인스톨레이션 디렉토리, 자바 폴러시(policy), 운영 체제 정보, 클래스 경로, 및 라이브러리 경로를 포함할 수 있다. 어플리케이션 서버를 위해, 정보는 어플리케이션 서버, 스타트업 디렉토리, 리스닝 포트, SSL 리스닝 포트, 등록된 서브렛의 수, 등록된 EJB의 수, JDBC 연결 풀의 수, 및 EAR의 수를 포함할 수 있다. 프로그램은 사용자를 재촉하여 도 4의 405에 지시된 것처럼, 허가 서버로서의 서버를 선택할 수 있고, 410에 지시된 것처럼, 선택을 수신할 수 있고, 그 다음 사용자를 재촉하여 415에 지시된 것처럼, 비교를 위한 서버를 선택할 수 있다. 일단 사용자가 420에 지시된 것처럼, 비교를 위한 서버를 선택하면, 시스템은 425에지시된 것처럼, 비교결과를 획득하여 디스플레이한다. 비교 결과는 상기 설명한 런타임 환경 정보를 포함할 수 있다. 비교 결과는 디퍼링(differig) 데이터만을 포함할 수 있고, 그래프적으로 표현될 수 있다. 시스템은 430, 435에 지시된 것처럼, 각각의 어플리케이션 서버를 위한 모든 적절한 정보를 디스플레이하는 상세 스크린에 디스플레이된 결과로부터 사용자가 꿰뚫을 수 있도록 바람직하게 허용한다.An example of such a comparison is called n-way diff. For each server, the program of the present invention obtains runtime environment data about how the system is set up and installed. Such environments may be system, Java and application servers. For the system, the environmental information may include CPU speed, number of CPUs online, number of CPUs offline, memory, operating system version, and physical disk space. Other information may be included. For Java, the information may include the JDK version, installation directory, Java policy, operating system information, class path, and library path. For the application server, the information may include the application server, startup directory, listening port, SSL listening port, number of registered servlets, number of registered EJBs, number of JDBC connection pools, and number of EARs. The program may prompt the user to select the server as the authorization server, as indicated at 405 of FIG. 4, receive the selection, as indicated at 410, and then prompt the user to compare, as indicated at 415. You can select a server for. Once the user selects a server for comparison, as indicated at 420, the system obtains and displays the comparison results, as indicated at 425. FIG. The comparison result may include the runtime environment information described above. The comparison result may include only diffraction data and may be represented graphically. The system preferably allows the user to penetrate from the results displayed on the detail screen displaying all the appropriate information for each application server, as indicated at 430 and 435.
비교의 다른 형태에 있어서, 바이너리 파일과 매칭 파일 이름의 비교가 성능될 수 있다. 최고 레벨 분석에서, 사용자는 도 5의 505에 지시된 것처럼, 허가 서버로서의 그룹으로부터 하나의 서버를 선택하도록 재촉받는다. 사용자는 510에 지시된 것처럼, 선택을 제공한 다음, 515에 지시된 것처럼, 비교 서버로서의 하나 이상의 서버를 선택하도록 재촉받는다 비교 서버 선택의 입력을 할 때, 520에서, 사용자는 525에서처럼, 파일의 소스를 선택하도록 재촉받는다. 사용자는 EAR 폴더의 리스트 또는 허가 서버의 마스터 파일 리스트를 형성하도록 간주되는 CLASSPATH의 리스트로부터 선택할 수 있다. 사용자는 530에 처럼, 선택을 제공한다. 사용자는 또한 마스터 파일 리스트의 비교를 위해 파일 형태 중의 하나를 선택하도록 535에서 처럼 재촉받는다. 파일 형태는 540에서 수신된다. 응답할 때 시스템은 선택된 소스로부터의 마스터 파일 리스트 및 허가 서버로부터의 파일 형태를 준비하는 것을 시작한다. 시스템은 그 다음 545에 지시된 것처럼, 비교 서버의 마스터 파일 리스트에서 리스트된 파일을 찾는다. 각각의 비교에 대하여, 결과는 550에 디스플레이된다. 결과는 발견된 파일과 발견되지 않은 파일로 분할될 수 있다. 발견된 카테고리에 대하여, 리스트는 매치된 파일, 즉 폴더처럼, 매치된 파일 이름, 사이즈, 및 파일 시스템 타임 스탬프를 갖는 모든 파일, 즉 매치된 파일 이름 및 사이즈, 타임 스탬프가 아니라, 같지않은 폴더, 즉 매치된 파일 이름만을 갖는 파일 등의 매치된 파일을 포함한다. 발견되지 않은 파일에 대하여, 파일은 비교서버가 아니라 허가 서버의 파일 및 허가 서버가 아니라 비교 서버의 모든 파일로 분할된다. 이 파일의 리스트는 디스플레이된다. 이 디스플레이는 사용자로 하여금 허가하고 비교하는 서버의 파일을 쉽게 비교하도록 허용한다.In another form of comparison, a comparison of binary file and matching file names can be performed. In the highest level analysis, the user is prompted to select one server from the group as the authorization server, as indicated at 505 of FIG. The user is provided with a selection, as indicated at 510, and then is prompted to select one or more servers as comparison servers, as indicated at 515. When inputting a comparison server selection, at 520, the user is prompted for a file, as at 525. You are prompted to choose a source. The user can choose from a list of EAR folders or a list of CLASSPATH considered to form a master file list of the authorization server. The user provides a selection, as at 530. The user is also prompted as in 535 to select one of the file types for comparison of the master file list. The file type is received at 540. In response, the system begins to prepare the master file list from the selected source and the file type from the authorization server. The system then finds the listed file in the master file list of the comparison server, as indicated at 545. For each comparison, the result is displayed at 550. The result can be split into found and unfound files. For the categories found, the list is the same as the matched file, i.e. the folder, all files with the matched file name, size, and file system time stamp, i. That is, it includes a matched file such as a file having only a matched file name. For a file that is not found, the file is divided into files of the permission server, not the comparison server, and all files of the comparison server, not the permission server. The list of this file is displayed. This display allows the user to easily compare files on the server that he is allowing and comparing.
이 디스플레이로부터, 시스템은 사용자로 하여금 파일에 관한 추가적인 정보를 획득하도록 꿰뚫는 것을 허용한다. 사용자는 하나의 비교 서버를 선택할 수 있고, 555에 지시된 것처럼, 상세한 비교를 위하여 허가 파일로부터 하나의 파일을 선택할 수 있다. 시스템은 결과가 같거나 또는 다른 채로, 파일에 비교를 성능한다. 비교는 MD5 알고리즘과 같은 체크섬 계산을 사용할 수 있다. 일 실시예에 있어서, 비교가 성능될 수 있기 전에, 상부의 레벨이 JAR 파일에 요구되는 것이 주목되어야 한다. 처음에, 아카이브 파일은 추출되고, 그 다음 이름 매칭이 성능된다. 그 다음, 비교가 성능될 수 있다. 이 비교의 결과로서, 파일의 이름 및 파일의 내용의 양쪽 다 560에 지시된 것처럼, 서버 사이에서 비교된다.다양한 버전 및 커럽티드(currupted) 코드와 같은 문제는 쉽게 확인될 수 있다.From this display, the system allows the user to penetrate to obtain additional information about the file. The user can select one comparison server and, as indicated at 555, can select one file from the authorization file for detailed comparison. The system performs comparisons to files, with the same or different results. The comparison can use the same checksum calculation as the MD5 algorithm. In one embodiment, it should be noted that an upper level is required in the JAR file before the comparison can be performed. Initially, the archive file is extracted and then name matching is performed. The comparison can then be performed. As a result of this comparison, both the name of the file and the contents of the file are compared between the servers, as indicated at 560. Problems such as various versions and corrupted code can be easily identified.
요청 재기록Rewrite request
본 발명의 방법, 시스템, 및 프로그램에 있어서, 방법, 시스템, 및 프로그램은 재기록 또는 어떤 요청을 매핑하는 데 제공될 수 있다. 특히, 요청 중 3개의 다른 형태는 본 발명의 시스템에 수신된다. 이것은 JSP, 서브렛, 및 리모트 엔터프라이즈 자바 빈 콜이다. 이 요구는 대표적으로 스트링의 형태를 띠고, 웹 서버 또는 다른 어플리케이션 서버와 같은 다른 어플리케이션으로부터 수신된다. 그러한 요청은 2개의 다른 목적을 위해 본 발명의 시스템에 사용된다. 요청은 확인 목적을 위해 사용될 수 있다. 요청은 비지니스 요청 또는 어플리케이션을 나타내는 데 또한 사용될 수 있다. 일반적으로, 요청 스트링의 임플리시트 듀얼 의미는 문제가 안된다. 그러나, 이 듀얼 의미가 충돌을 생성할 수 있는 상황이 있다. 예를 들어, 포털 사이트에 있어서, URL의 형태의 요청 스트링은 통상적으로 정확히 같게 보이고, 따라서 기억하기 위한 엔드 유저에게 편리한다. 그러나, 그것들은 요청 또는 세션 오브젝트와 같은 언더라잉 데이터 오브젝트를 사용하여 포털 엔진에 의해 다른 형태의 요청인 것으로 간주된다. 문제 결정하는 동안에, 조작자 또는 관리자는 그가 스트링 사이의 해결책이 없이 같은 스트링에 의해 표현되는 다른 기능을 위해 요청을 보듯이 혼란스러울 것이다. 한편, 단일 어플리케이션은 다중 및 다른 요청 스트링을 포함할 수 있고, 그 성공적인 성능 후에, 결과 성능 데이터는 하나의 어플리케이션 이른 또는 라벨에 대해서 분석되어야 한다. 여기서 다시 문제는 요청 스트링의 그룹은 서로 관계됨을 인식하도록 시스템을 위한 그룹 메카니즘의 부족이 있다는 것이다.In the methods, systems, and programs of the present invention, the methods, systems, and programs may be provided for rewriting or mapping any request. In particular, three different types of requests are received by the system of the present invention. This is a JSP, servlet, and remote enterprise Java bean call. This request is typically in the form of a string and is received from another application, such as a web server or other application server. Such a request is used in the system of the present invention for two other purposes. The request can be used for verification purposes. The request can also be used to indicate a business request or application. In general, the implied dual meaning of the request string is not a problem. However, there are situations where this dual meaning can create a collision. For example, in a portal site, the request string in the form of a URL typically looks exactly the same and is therefore convenient for the end user to remember. However, they are considered to be another type of request by the portal engine using an underlying data object such as a request or session object. During problem determination, the operator or administrator will be confused as if he sees a request for another function represented by the same string without a solution between the strings. On the other hand, a single application may contain multiple and different request strings, and after its successful performance, the resulting performance data should be analyzed for one application early or label. Again the problem is that there is a lack of group mechanisms for the system to recognize that groups of request strings are related to each other.
상기 문제를 극복하기 위해, 자바 베이스드 로직의 형태일 수 있는 모듈은 요청를 매핑하도록 제공될 수 있다. 도 6에 지시된 것처럼, 요청 600과 같은 각각의 요청은 2개의 개별의 스트링에 매핑된다.: 구별 가능한 요청 스트링(605) 및 컬랩스가능한 요청 스트링(610). 이 개별의 스트링은 뚜렷한 목적을 위해 사용된다. 이 스트링은 뚜렸한 URL 또는 라벨 스트링일 수 있다. 동작을 매핑하거나 또는 재 기록하는 것은 결정 및 성능 관리 기능의 양쪽 문제점이 동작을 이용할 수 있는 경우의 포인트에서 바람직하게 발생한다. 예를 들어, 성능 관리 기능은 컬랩스가능한 요청 스트링에서의 요청에 의하여 분해를 성능한다. 문제 결정에 사용되는 액티브 요청 서치는 구별 가능한 요청 스트링에서 수행된다.To overcome this problem, a module, which may be in the form of Java based logic, may be provided to map the request. As indicated in FIG. 6, each request, such as
보안security
각각의 사용자가 사용자 기능에 지정됨을 제공함에 의해 보안은 바람직하게 유지된다. 각각의 사용자 기능은 본 발명의 소프트웨어의 특별한 기능에 매핑된다. 접근 제어 리스트는 생산 기능과 그에 관련된 사용자 기능의 사이에서 매핑이 제공될 수 있다. 관리자는 사용자 기능을 더할 수 있고 기능에 그들의 기능을 매핑할 수 있다. 도 7의 개략적인 설명을 참조하면, 관리자(700)는 모든 기능들 및 구성들에 접근을 판독 및 기록하고, 로그 파일에 접근한다. 예를 들어, 생성, 수정, 활성화, 불활성화 및 소프트웨어 트랩의 삭제, 및 모니터링 레벨의 변경은 관리자에게만을 위할 수 있다. 조작자(705)는 대부분의 기능에 디스플레이 접근, 및 어떤 기능 구성에 대한 접근을 갖는다. 사용자(710)는 어떠한 기능 구성에 대해서가 아니라 기능 및 보고에 대한 디스플레이 접근을 갖는다.Security is preferably maintained by providing that each user is assigned to a user function. Each user function is mapped to a special function of the software of the present invention. The access control list may be provided with a mapping between the production function and its associated user function. Administrators can add user functions and map their functions to functions. Referring to the schematic description of FIG. 7,
아키텍쳐Architecture
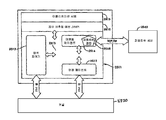
본 발명의 시스템은 아래 설명될 아키텍쳐를 가질 수 있다. 아키텍쳐는 중앙 제어를 제공하는 커널, 프로브 엔진으로부터의 데이터를 수신하는 퍼블리쉬 서버, 캐시로부터 데이터베이스로 데이터를 이동시키는 아카이브 에이전트, 데이터베이스, 모든 엔드 유저 어플리케이션를 제공하는 시각화 엔진, 및 어플리케이션 서버( 웹스피이어 같은)로부터의 어떤 어플리케이션 서버 구체화 데이터를 수집하는 어플리케이션 서버 에이전트를 포함하여, 각각의 어플리케이션 서버에서 동작하는 에이전트의 성질 및 전용 서버의 남겨진 콤포넌트일 수 있다. 보기의 아키텍쳐는 도 8에 설명된다. 프로브 및 퍼블리쉬 엔진(2511)은 어프리케이션 서버 에이전트(2510)의 주요한 콤포넌트가다. 남겨진 콤포넌트는 데디케이티드 서버(2520)에 인스톨될 수 있다. 커널(2530)은 중앙 제어를 제공한다. 퍼블리쉬 서버(2540)는 어플리케이션 서버 에이전트(2510)으로부터 데이터를 수신하고, 아카이브 에이전트(2550)으로 데이터를 이동시킨다. 아카이브 에이전트(2550)는 데이터베이스(2560)로 데이터를 이동시킨다. 시각화 엔진(2570)은 모든 엔드 유저 어플리케이션을 보증하고, 히스토리컬 정보를 이해 데이터베이스와 통신하고, 어플리케이션 서버 에이전트(2510)과 직접 통신하여 스냅숏 정보를 요청하고 수신하는다.The system of the present invention may have an architecture described below. The architecture includes a kernel that provides central control, a publish server that receives data from the probe engine, an archive agent that moves data from the cache to the database, a database, a visualization engine that provides all end user applications, and an application server (such as WebSphere). It may be a leftover component of a dedicated server and the nature of the agent running on each application server, including an application server agent that collects some application server materialization data. The architecture of the example is described in FIG. 8. The probe and publish
일실시예에 있어서, 상기 설명한 방법에서 사용자에게 제공된 데이터의 소스는 프로브 및 퍼블리쉬 엔진일 수 있다. 프로브 및 퍼블리쉬 엔진은 구체적 쓰레드에 속하는 모든 정보를 획득한다. 바람직한 실시예에서, 스탠다드 자바 프로파일링 인터페이스(JVMPI)는 프로브 에이전트로 사용될 수 있다.In one embodiment, the source of data provided to the user in the method described above may be a probe and publish engine. Probe and publish engines get all the information belonging to a specific thread. In a preferred embodiment, the Standard Java Profiling Interface (JVMPI) can be used as a probe agent.
도 9를 참조하면, 프로브 및 퍼블리쉬 엔진(2511)은 어플리케이션 서버(2615)와 마찬가지로, 그것과 통신하는 자바 버추얼 머쉰(2610)에 관계하여 도시된다. 프로브 및 퍼블리쉬 엔진(2610)은 5개의 컴포넌트를 바람직하게 구비한다. 프로브 제어기(2512), 커맨드 에이전트(2513), 이벤트 에이전트(2514), 이벤트핸들러(2515), 및 퍼블리쉬 엔진(2516). 프로브 제어기(2512)는 다른 콤포넌트의 라이프 사이클을 제어하는 제어기 쓰레드이다. 이벤트 에이전트(2514)는 흥미있는 JVMPI를 위한 이벤트 핸들러를 등록한다. 그러한 이벤트가 발생한 경우, 핸들러는 그러면 재촉받는다. 핸들러는 적절한 정보를 수집하고, 그것을 이벤트 큐에 더한다. 퍼블리쉬 엔진(2516)은 그러면 이벤트 큐로부터의 데이터를 확득하고 그것을 퍼블리쉬 서버(2540)에 보낸다. 에이전트는 자바 디벨로프 킷 1.2.2 또는 상기를 제공하는 스탠다드 자바 프로파일링 인터페이스를 사용하여 구성될 수 있다.With reference to FIG. 9, the probe and publish
이 실시예에 있어서, JVMPI 라이브러리는 JVM으로 적재되고 JVM, 프로브 제어기, 이벤트 에이전트, 및 커맨드 에이전트와 통신한다. JNI 기능은 모든 이벤트 베이스드 데이터, 및 날짜/시간 스탬프, 월 클럭 및 CPU 클럭을 캡쳐하도록 사용될 수 있다. JVMPI 라이브러리, 이벤트 에이전트, 커맨드 에이전트, 퍼블리쉬 엔진, 및 프로브 제어기에 의해 등록된 이벤트는 표 2에 도시된다.In this embodiment, the JVMPI library is loaded into the JVM and communicates with the JVM, probe controller, event agent, and command agent. The JNI function can be used to capture all event based data, and date / time stamps, wall clocks, and CPU clocks. The events registered by the JVMPI library, event agent, command agent, publish engine, and probe controller are shown in Table 2.
표 2 TABLE 2
JVMPI 라이브러리로부터 획득된 정보는 큐에 저장되고, 이벤트 큐라고 불리고, 이벤트 에이전트는 큐로부터의 기록을 복구하고, 패킷에 그것들을 팩하고, 그것들을 퍼블리쉬 엔진을 거쳐 퍼블리쉬 서버로 보낸다. 이벤트 엔진에 의해 큐로부터 수집 된 데이터는 표 3에 도시된다. The information obtained from the JVMPI library is stored in a queue, called an event queue, and the event agent recovers the records from the queue, packs them into packets, and sends them to the publish server via the publish engine. The data collected from the queue by the event engine is shown in Table 3.
표 3 TABLE 3
커맨드 에이전트는 커널로 등록된 RMI 서비스이다. 커맨드 에이전트는 시각화 엔진 및 다른 외부 콤포넌트으로부터 커맨드를 입력받고 JVMPI 또는 JNI 콜을 사용하여 그것들을 만족시킨다. 커맨드의 보기 리스트와, 커맨드가 JVMPI 또는 JNI에 제공되는 지는 표 4에 도시된다.The command agent is an RMI service registered with the kernel. Command agents receive commands from visualization engines and other external components and satisfy them using JVMPI or JNI calls. An example list of commands and whether the commands are provided in JVMPI or JNI are shown in Table 4.
표 4 Table 4
프로브 제어기는 또한 바람직하게 커널(2530)에 등록된 RMI 서비스이고, 다른 프로브 컴포넌트를 시작 및 중단하고, 검색 구성을 얻는다. 프로브의 새로운 구성은 커널(2530)으로부터 프로브 제어기로 보내진다. 프로브 제어기는 프로브가 시작되고 또는 중단되는 지 또는 필터가 새로운 구성을 입력받을 때 변경되는 지를 결정할 것이다. 프로브/퍼블리쉬 엔진에 대한 로직 다이어그램은 도 10에서 처럼 제공된다. 이 로직 다이어그램에 따라서, JVM이 로드되는 경우, 2702에 도시된 것처럼, 쓰레드 개시, 쓰레드 종료 및 JVM의 초기화의 완성을 확인하는 이벤트는 2704에 도시된 것처럼, 커널로 JVMPI를 통해 등록된다. JVM의 초기화가 완성된 경우, 2706에 지시된 것처럼, 시스템 프라퍼티는 설정되고 프로브를 개시하는 쓰레드는 2708에 지시된 것처럼, 생성된다. 그러면 스레드는 2710에 지시된 것처럼, 메소드 엔트리 및 클래스 로드 이벤트를 인에블하고, 2712에 도시된 것처럼, 어플리케이션 서버가 시작할 때까지 대기한다. 메소드 엔트리는 2714에서 JVM의 처리 흐름을 시작하고, 어플리케이션 서버가 2716에서 시작되는 지를 보는지 확인한다. 그것이 시작된다면, 처리 흐름은 IntiProbe Thread를 통과하고, 이것은 2718에서 방법 엔트리 및 클래스 로드 이벤트를 디스에이블하고, 2720에서 프로브 제어기 쓰레드를 생성한다. 프로브 제어기 쓰레드는 2722에서, 커널로부터 프로브 구성을 찾는 다. 만일 프로브 구성이 발견되지 않는다면, 2724와 2726에 지시된 것처럼, 흐름은 끝난다. 만일 구성이 발견된다면, 처리 흐름은 2729\8에서 프로브가 구성에 인에이블 되는 지를 판정하도록 진행한다. 만일 아니라면, 처리 흐름은 종료한다. 처리 흐름은 2730에 지시된 것처럼, 커널로부터 RMI 콜의 형태의 새로운 구성으로 또한 시작될 수 있다. 만일 프로브가 인에이블된다면, 처리 흐름은 이벤트 에이전트 및 커맨드 에이전트를 시작하도록 진행하고, 2732에 도시된 것처럼, 클래스 로드 이벤트 및 방법 엔트리 이벤트를 인에블한다. 방법 엔트리 이벤트의 인에이블링은 2750에 지시된 것처럼, JVM에서 처리 흐름을 시작한다. CPU 클럭, 월 클럭, 방법 확인, 쓰레드 확인, 및/또는 URL 및 SQL 과 같은 데이터는 2750에 지시된 것처럼, 획득되고, 이벤트 큐(2760)을 지난다. 클래스 로드 이벤트는 2754에 도시된 것처럼, JVM에서 처리 흐름을 시작한다. 2756에 도시된 것처럼, 클래스 이름, 방법 이름 및 사인의 기능이 시작되고, 이 정보가 클래스 해쉬 테이블(2762)을 지나간다. 이벤트 에이전트는 2780에 지시된 것처럼, 이벤트 큐(2760)으로부터 기록을 복구한다. 이벤트 에이전트는 2782에 지시된 것처럼, 퍼블리슁 주파수에 따라 대기할 것이다. The probe controller is also preferably an RMI service registered with the
시각화 엔진(2750)은 본 발명의 방법 및 시스템에서 사용되는 프런트 엔드 유저 인터페이스 컴포넌트를 제공한다. 스탠다드 J2EE 기술은 시각화 엔진(2750)의 장착에 사용될 수 있다. 시각화 엔진(2750)의 프런트-엔드 프레임워크는 세션 관리 및 보안 같은 하우스키핑을 다룬다. 시각화 엔진(2750)은 프런트-엔드 어플리케이션 및 비지니스 로직 콤포넌트의 개발에 공헌하는 환경을 제공하기 위하여 가능한 많은 공통의 태스크를 바람직하게 다룬다. 시각화 엔진(2750)은 데이터베이스의 상 부에 존재하고, 그것은 사용자 요청에 응답하여 접근한다. 아키텍쳐는 도 28에 도시되고, 웹 서버(2815)와 통신하면서 브라우저(2810)을 사용하여 브라우저-베이스드이도록 도시되고, 데이터베이스 및 웹 서버 사이에서 인터페이스하며, IBM의 웹스피어와 같은 아파치 웹 서버 및 어플리케이션 서버(2820)일 수 있다. 서브렛은 핸들 요청 및 관리 어플리케이션 흐름에 사용될 수 있다. 서브렛은 폼 데이터-엔트리 유효화를 성능하고 JSP 페이지로 데이터를 포함하는 자바 빈 오브젝트를 보냄에 의해 프런트-엔드 동작을 제어하도록 또한 사용될 수 있다. JSP 페이지는 프런트-엔드 프리젠테이션 로직의 대부분을 다룰 수 있다. 비지니스 로직은 엔터프라이즈 자바 빈을 사용하여 장착될 수 있다. 일반적으로, 스테이트레스 세션 빈이 사용된다.
서브렛은 상기 언급한 것처럼, 폼-엔트리 데이터 유효화 및 어플리케이션 로직 흐름을 위해 사용될 수 있다. 베이스 서브렛은 모든 서브렛 어플리케이션이 확장되어야만 하도록 제공될 수 있다. 베이스 서브렛은 글로벌 변수를 셋업하고, 인증 및 권한을 다루고, 필요한 대로 로그인에 리디렉트(redirect) 및 접근-거절된 페이지를 성능한다. 리소스 번들, 로그 메세지 및 오딧(audit) 트레일 메세지 파일은 제공된다. JSP는 브라우저에서 디스플레이되도록 웹 페이지를 만드는 HTML 코드를 생성한다. 서브렛은 자바 빈 오브젝트를 사용하여 JSP로 바라는 데이터를 전달한다.The servlet may be used for form-entry data validation and application logic flow, as mentioned above. Base servlets may be provided such that all servlet applications must be extended. The base servlet sets up global variables, handles authentication and authorization, and performs redirect and access-rejected pages on login as needed. Resource bundles, log messages, and audit trail message files are provided. JSPs generate HTML code that creates a web page to be displayed in a browser. The servlet uses Java bean objects to pass the desired data to the JSP.
스테이트레스 세션 빈의 상층은 API를 구성한다. 데이터베이스로부터 데이터로의 접근을 다루는 상층의 아래에 엔터프라이즈 자바 빈 또는 자바 클래스의 층이 존재할 수 있다. 데이터베이스로부터의 데이터는 DBAccess 데이터 접근 프레임워크의 일부인 데이터베이스 접근 층을 통해 획득될 수 있다.The upper layer of the stateless session bean constitutes an API. Underneath the upper layer, which handles access to data from the database, there may be a layer of enterprise Java beans or Java classes. Data from the database can be obtained through the database access layer, which is part of the DBAccess data access framework.
어플리케이션 액티비티 디스플레이 기능은 상기 언급한 것처럼, 데이터에 실시간 접근을 제공하고, 시각화 엔진 및 대응하는 퍼블리쉬 서버 사이에서 다이렉트 통신을 포함하고 프로브한다. 퍼블리쉬 서버 인터페이스 및 커맨드 에이전트 인터페이스는 이 다이렉트 통신에 제공된다. 이 인터페이스로의 스텁은 커널에 의해 유지되고, 룩업 에이전트 헬퍼(helper) 클라이언트를 사용하여 커널로부터 룩업을 성능함으로써 시각화 엔진에 의해 복구된다. 프로브가 성능되는 각각의 서버는 프로브를 위한 유일한 확인을 갖는다. 일단 프로브 확인이 획득되면, 커맨드 에이전트의 인터페이스 스텁은 커널로부터 획득된다. 프로브에 의해 사용되는 퍼블리쉬 서버의 확인은 그러면 프로브으로부터 획득된다. 퍼블리쉬 서버의 대응하는 인터페이스 스텁은 커널로부터 획득된다. 액티브 요청 및 관련 데이터의 리스트는 그러면 선택된 퍼블리쉬 서버로부터 직접 획득될 수 있다. 추가적인 요청 데이터는 직접 프로브으로부터 획득될 수 있다. 시각화 엔진, 커맨드 에이전트 및 프로브의 퍼블리쉬 서버 사이의 통신은 실시간이고 동기적이다.The application activity display function, as mentioned above, provides real-time access to data and includes and probes direct communication between the visualization engine and the corresponding publish server. The publish server interface and command agent interface are provided for this direct communication. Stubs to this interface are maintained by the kernel and restored by the visualization engine by performing lookups from the kernel using the lookup agent helper client. Each server on which the probe is performing has a unique confirmation for the probe. Once the probe confirmation is obtained, the interface stub of the command agent is obtained from the kernel. The identification of the publish server used by the probe is then obtained from the probe. The corresponding interface stub of the publish server is obtained from the kernel. The list of active requests and related data can then be obtained directly from the selected publish server. Additional request data can be obtained directly from the probe. Communication between the visualization engine, command agent and probe's publish server is real time and synchronous.
시각화 엔진은 상기 설명된 보안 기능을 포함한다. 독점 API는 J2EE 스페시피케이션 보안 특징이 상기 설명된 보안 특징을 제공하는데 충분하지 않기 때문에 개발되었다. 보안 특징은 인증 및 권한 기능으로 구성된다. 인증은 제3 파티(party) 인증 시스템을 랩(wrap)하는 독점 자바 API를 거쳐 성능된다. 권한은 사용자 또는 그룹에 의해 접근 제어 리스트를 유지함으로써 성능된다. 사용자는 특별한 그룹과 관련되고, 그 그룹의 서버에 대한 데이터를 접근만 할 수 있다. 서버는 하나 이상의 그룹과 각각 관련된다.The visualization engine includes the security function described above. Proprietary APIs were developed because J2EE specification security features are not sufficient to provide the security features described above. Security features consist of authentication and authorization functions. Authentication is performed via a proprietary Java API that wraps a third party authentication system. Privileges are performed by maintaining access control lists by users or groups. A user is associated with a particular group and can only access data for servers in that group. Servers are each associated with one or more groups.
커널은 지금 상세히 설명된다. 커널은 네트워크에 서로를 발견하도록 다양한 서버스를 인에블하고 동적이고 강한 방법으로 인터액트하는 서비스에 대한 방법을 제공한다. 아무런 사용자 간섭도 서비스가 온 또는 오프 라인을 가져온 경우에 요구되지 않는다. 커널과 결합하는 서비스는 다른 서비스 중의 어떠한 것이 온 또는 오프를 진행하는 경우 동적으로 적용할 수 있다. 서비스의 소비자는 서비스의 장착에 대한 선행 지식을 요구하지 않는다. 도면을 참조하면, 커널(2530, 2530')의 2개의 예가 도시된다. 커널의 아키텍쳐는 핵(2531), 리스 관리자(2532), RFS 서버(2533), 코드베이스 서버(2534), 등록 데이터베이스(2535), 사용가능성 서버(2536), 및 구성 서버(2537)을 특징으로 한다. 커널의 2개의 예는 개량된 사용가능성에 대한 개별 서버에서 바람직하게 성능된다.The kernel is now described in detail. The kernel provides a way for services to enable various servers to interact with each other on the network and to interact in a dynamic and strong way. No user intervention is required if the service brought on or off line. Services that are combined with the kernel can be applied dynamically if any of the other services are on or off. The consumer of the service does not require prior knowledge of the installation of the service. Referring to the drawings, two examples of
커널 핵(2531)은 서비스로부터 모든 결합, 갱신, 리브(leave) 및 룩업 요청을 다룬다. 서비스는 프로브 에이전트, 사용가능성 서버(2536), 및 구성 서버(2537)이다. 결합 요청에 대하여, 서비스는 프락시 오브젝트 및 커널로의 그의 관련된 서비스 애트리뷰트를 경로한다. 커널은 등록 데이터베이스의 프락시 오브젝트 및 서비스 애트리뷰트를 저장함으로써 요청을 이행한다. 클라이언트가 태스크를 성취하는 어떤 형태의 서비스를 필요로 하는 경우, 그것은 서치(search) 템플레이트를 경로하고 커널로 룩업 요청을 내림에 의해 서비스를 찾는다. 서치 템플레이트에 근거하여, 커널은 클라이언트에 대응하는 프락시 오브젝트를 리턴할 것이다. 각각 의 서비스는 주기적으로 커널로 갱신된 요청을 내림에 의하여 그 리스를 갱신하는데 요구된다. 만일 커널이 요구되는 경우, 갱신 요청을 입력받지 않는다면, 커널은 등록 데이터베이스로부터 서비스의 프락시 오브젝트 및 서비스 애트리뷰트를 제거한다. 이 갱신된 요구는 사용할 수 없는 서비스로 보내지는 요청을 피한다. 프로브 및 퍼블리쉬 서버는 리스가 갱신되는 경우, 완성된 요청 및 CPU 사용의 크기외 같은 어플리케이션 및 시스템 정보를 바람직하게 묶는다. 따라서 리스 개념은 서버 및 고 레벨 통계 정보의 사용가능성을 보고하도록 기능한다. 서비스는 커널로 리브 요청을 또한 내릴 수 있다.Kernel hack 2551 handles all join, update, leave and lookup requests from the service. The services are probe agent, availability server 2536, and
리스 관리자 콤포넌트(2532)은 등록 데이터베이스에 기록의 트레이스를 유지한다. 만일 어떠한 등록이 종료되거나, 또는 리브 요청이 입력되면, 리스 관리자(2532)는 대응하는 기록으로 하여금 제거되도록 하여 커널은 임의의 클라이언트에 대응하는 프락시 오브젝트를 경로하지 않을 것이다. RFS(request for stub) 서버(2533)는 연결을 위한 포트에 귀를 기울인다. 연결이 확인되는 경우, 커널의 연속된 스텁 오브젝트는 커널에 인터페이싱하는데 사용하는 서버 또는 클라이언트로 보내진다. 코드베이스 서버(2534)는 HTTP 서버와 유사하지만, 그러나 서비스의 클라이언트가 프락시 오브젝트의 클래스 정의를 다운로드하도록 허락하는 기능을 제공하고 그것은 커널로부터 획득한다. 등록 데이터베이스(2535)는 프락시 오브젝트를 위한 인(in)-메모리 저장 및 관련된 서비스 애트리뷰트를 제공한다. 서버 사용가능성 및 통계 정보는 등록 데이터베이스(2535)에 존재한다.The
사용가능성 서버(2536)는 스냅숏을 취하고 시각화 엔진(2750)으로 서버의 사 용가능성 및 통계 데이터를 제공하도록 기능하기 위하여 등록 데이터베이스(2535)의 히스토리를 저장한다.Availability server 2536 stores a history of
구성 서버(2537)는 모든 컴포넌트를 위하여 구성 데이터를 저장하도록하는 집중된 장소이다. 구성 데이터는 XML 형태이고 데이터베이스에 유지된다. 사용자는 시각화 엔진을 통해 구성을 변경할 수 있다. 이것이 완성된 경우, 구성 서버(2537)는 과거 구성에 적용된 프락시 오브젝트의 리스트를 커널로부터 복구한다. 구성 서버(2537)는 새로운 구성을 방송하는 프락시 오브젝트를 사용한다. 이 서버는 시각화 엔진에서 사용자 커맨드에 대응하여 프로브의 구성을 업데이트하도록 기능한다.
JoinManager라고 불리는 헬퍼 유틸리티는 커널의 스텁 오브젝트를 요청하고, 그 서비스 애트리뷰트 뿐만 아니라 프락시 오브젝트와 커널을 결합시킨다. 만일 스텁 오브젝트가 사용가능하지 않다면, 유틸리티는 그것이 성공할 때까지 재시도를 계속할 것이다. 이 유틸리티는 또한 리스를 유지하고 갱신한다. 룩업 매니저 유틸리티는 특별한 서비스를 찾는 클라이언트에 의해 사용될 수 있다.A helper utility called JoinManager requests the kernel's stub object and joins the proxy object with the kernel, as well as its service attributes. If a stub object is not available, the utility will continue retrying until it succeeds. This utility also maintains and updates leases. The lookup manager utility can be used by clients looking for special services.
퍼블리쉬 서버(2540)는 다양한 퍼블리쉬 엔진으로부터 수신된 데이터를 관리한다. 다중 퍼블리쉬 서버는 단일 인스톨레이션에 제공될 수 있다. 퍼블리쉬 서버는 시각화 엔진을 위한 커리(query) 능력을 제공한다. 퍼블리쉬 서버는 또한 성능 관리 관련 데이터 및 시스템 리소스 관련 데이터의 증가하는 복구를 관리한다. 퍼블리쉬 서버 아키텍쳐는 도 13에 도시된다.The publish
퍼블리쉬 서버(2540)는 멀티쓰레드 처리로서 기능할 수 있다. 각각의 쓰레드는 특별한 퍼블리쉬 엔진에 연결되고, 그것으로부터 데이터를 수신하는다. 그것은 또한 스타트업, 셧다운 및 커널과의 통신을 처리하는 추가적인 쓰레드를 내장할 수 있다.The publish
도 13을 참조하면, 퍼블리쉬 서버(2540)는 커널과 결합하는 쓰레드를 생산하고 3002에 도시된 것처럼, 그 컨트랙트를 규칙적으로 갱신한다. 퍼블리쉬 서버(2540)는 3004에 도시된 것처럼, 소켓 연결을 억셉트하는 쓰레드를 또한 생산한다. 결정 블록(3006)에 의해 지시된 것처럼, 다음 단계는 커리가 대응하는 퍼블리쉬 엔진으로부터 수신하는지에 달려있다. 만일, 커리라기 보다는, 데이터가 수신된다면, 일관된 소켓 연결은 3008에 지시된 것처럼, 달성된다. 데이터는 또한 요청과 관련된다. 그러면 데이터는 3010에 지시된 것처럼, 퍼블리쉬 엔진을 거쳐 프로브으로부터 획득된다. 만일 서버 재시작 신호가 수신된다면, 3012 및 3014에 지시된 것처럼, 퍼블리쉬 서버는 진행 전에 재시작된 서버를 위해 축적된 데이터를 리셋한다. 만일 데이터가 3016 및 3018에 지시된 것처럼, 새로운 프로브으로부터라면, 서버는 등록되어 서버의 성능 관리 관련 데이터 및 시스템 리소스 관련 데이터는 5분 마다와 같이 주기적으로 복구될 것이다. 그러면 처리 흐름은 3020에 지시된 것첨, 프로브으로부터 수신된 메소드 레벨 레코드, 클래스 로드 레코드 및 GC 레코드와 같은 레코드를 처리하도록 진행한다. 만일 요청이 완성되거나 또는 3022에 지시된 것처럼, 어떤 양의 시간을 위한 요청에 액티비티가 존재하지 않는다면, 요청은 3024에 지시된 것처럼, 액티브 요청 리스트로부터 제거된다. 그러면 처리 흐름은 3026으로부터 리딩(leading)을 라벨링함에 의해 지시된 것처럼, 프로브으로부터 더 이상의 데이터를 억셉트하도록 리턴한다. Referring to FIG. 13, publish
만일 데이터가 커리인지 결정된다면, 프라퍼티는 적절한 형태의 정보를 결정하는데 사용될 수 있다. 커리는 3030, 3032, 및 3034에 설명된 것처럼, 다양한 정보를 요구할 수 있다. 그러면 결과는 연속되고 퍼블리쉬 엔진으로 다시 보내진다. 퍼블리쉬 서버는 또한 3036에 지시된 것처럼, 상태를 위한 것과 같이 그 클라이언트에 의해 만들어진 어떤 관리 요청을 입력받고, 3038에 지시된 것처럼, 서비스를 중단한다. 이 태스크는 관리자에 의해 불러 일으켜질 수 있다. 연결은 커리에 응답하는 정보가 제공되는 경우, 3040에 지시된 것처럼, 닫혀지고, 퍼블리쉬 서버는 소켓 연결을 다시 억셉트하는데 사용될 수 있다.If it is determined that the data is curry, the property can be used to determine the appropriate type of information. Curry may require a variety of information, as described in 3030, 3032, and 3034. The results are then contiguous and sent back to the publish engine. The publish server also receives some administrative request made by the client as for status, as indicated at 3036, and stops the service as indicated at 3038. This task can be invoked by the administrator. If the connection is provided with information responsive to the curry, it is closed, as indicated at 3040, and the publish server can be used to accept the socket connection again.
상기 아키텍쳐가 본 발명의 방법의 단계를 수행하는 수단을 갖는 하나의 시스템을 대표하는 것이 이해될 것이다. 시각화 엔진은 사용자에게 정보를 주는 수단, 사용자를 재촉하는 수단, 및 사용자로부터 요청을 수신하는 수단을 포함한다. 프로브 엔진은 분산 어플리케이션에 관한 정보를 획득하고, 분산 어플리케이션의 필터된 모니터링을 수행하는 수단을 포함한다. 퍼블리쉬 엔진, 아카이브, 데이터베이스 및 커널의 기능은 방법의 단계를 수행하는 하나의 수단을 제공하는 시각화 엔진 및 프로브 엔진과 협동하는 것이 이해될 것이다.It will be appreciated that the architecture represents one system with means for performing the steps of the method of the invention. The visualization engine includes means for giving information to the user, means for prompting the user, and means for receiving a request from the user. The probe engine includes means for obtaining information about the distributed application and performing filtered monitoring of the distributed application. It will be appreciated that the functionality of the publish engine, archive, database, and kernel cooperate with the visualization engine and the probe engine, which provide one means of performing the steps of the method.
자기 진단 Self-diagnosis
본 발명의 방법, 시스템, 및 컴퓨터 프로그램에 있어서, 방법 및 시스템은 아키텍쳐의 내부 콤포넌트의 분석을 성능하고, 조작자에게 분석의 결과를 보고하는데 제공될 수 있다. 예를 들어, 커널, 데이터 컬렉터 콤포넌트, 퍼블리쉬 서버 및 아카이브 에이전트의 뷰(view)가 제공된다.In the methods, systems, and computer programs of the present invention, methods and systems may be provided for performing analysis of internal components of the architecture and reporting the results of the analysis to the operator. For example, views of the kernel, data collector components, publish servers, and archive agents are provided.
커널 뷰는 본 발명의 소프트웨어 시스템의 커널 콤포넌트의 모든 성능 예를 지시한다. 각각의 예에 대하여, 커널 런타임 환경 상세 및 각각에 대한 콤포넌트 오버뷰가 제공된다. 커널 런타임 환경 상세에서 보기의 값은 플랫폼, IP 어드레스, 다양한 포트 수, 코드베이스 라이브러리 경로, 컨트랙트 갱신 인터벌, 시작 시간, 보안 정책이 존재하는 파일, 드라이버 이름, 및 그 대응하는 데이터베이스의 URL을 포함한다. 콤포넌트 오버뷰는 서비스 이름, 콤포넌트 확인, 플랫폼, IP 어드레스, 듣기 포트 수, 최초 연결 시간, 마지막 컨트랙트 갱신 시간을 포함할 수 있다. 콤포넌트 오버뷰 섹션에서의 각각의 콤포넌트 확인은 대응하는 뷰를 제공하는 링크일 수 있다. 예를 들어, 만일 사용자가 콤포넌트 ID X에 링크를 클릭하면, 그 서비스 이름은 데이터 컬렉터 제어기이고, 사용자는 데이터 컬렉터 콤포넌트 뷰를 제공받는다.The kernel view indicates all performance examples of kernel components of the software system of the present invention. For each example, kernel runtime environment details and component overview for each are provided. In the kernel runtime environment details, the values of the view include platform, IP address, various port numbers, codebase library path, contract update interval, start time, file with security policy, driver name, and the URL of the corresponding database. . Component overview may include service name, component identification, platform, IP address, number of listening ports, first connection time, and last contract update time. Each component identification in the component overview section may be a link that provides a corresponding view. For example, if a user clicks on a link to component ID X, the service name is a data collector controller, and the user is provided with a data collector component view.
데이터 컬렉터 콤포넌트는 모든 업 및 성능 데이터 컬렉터 제어기에 속하는 데이터를 디스플레이한다. 이 뷰에 3개의 섹션이 존재할 수 있다: 데이터 컬렉터 제어기 런타임 환경 상세, 데이터 컬렉터 런타임 환경 상세, 및 퍼블리쉬 서버 관계. 처음 2개의 섹션은 데이터 컬렉터 제어기가 성능하는 구성 및 환경을 제공한다. 퍼블리쉬 서버 관계 섹션은 데이터 컬렉터가 연결중인 퍼블리쉬 서버의 아이덴티티(identity)를 표시한다. 데이터 컬렉터 제어기 런타임 환경 상세에 대하여, 아이덴티티는 콤포넌트 ID, admin 서버의 아이덴티티, 어플리케이션 서버의 아이덴티티, 플랫폼의 아이덴티티, IP 어드레스, 포트 수, 시작 시간, 커널 코드베이스 파일 위치, 연결된 커널, 구성 프로파일, 커널이 배치되었는지, 및 보안 정책 파일를 포함한다. 데이터 컬렉터 런타임 환경 상세에 대하여, 정보는 콤포넌트의 확인 번호, 포트 번호, 콤포넌트가 인에이블 되었는지이다.The data collector component displays data pertaining to all up and performance data collector controllers. There can be three sections in this view: data collector controller runtime environment details, data collector runtime environment details, and publish server relationships. The first two sections provide the configuration and environment in which the data collector controller performs. The publish server relationships section displays the identity of the publish server to which the data collector is connecting. For details on the data collector controller runtime environment, the identity is the component ID, the identity of the admin server, the identity of the application server, the identity of the platform, the IP address, the number of ports, the start time, the kernel codebase file location, the connected kernel, the configuration profile, the kernel. It has been deployed, and includes a security policy file. For the data collector runtime environment details, the information is the component's confirmation number, port number, and whether the component is enabled.
퍼블리쉬 서버 뷰는 모든 업 및 퍼블리쉬 서버 콤포넌트의 성능 예에 관한 정보를 제공한다. 각각의 예를 들어, 4개의 섹션이 있을 수 있다: 퍼블리쉬 서버 런타임 환경 상세, 데이터 컬렉터 관계, PMI 에이전트 관계, 및 아카이브 에이전트 관계.The Publish Servers view provides information on performance examples of all up and publish server components. For each example, there may be four sections: publish server runtime environment details, data collector relationships, PMI agent relationships, and archive agent relationships.
아카이브 에이전트 뷰는 모든 업 및 아카이브 에이전트의 성능 예를 도시하고, 아카이브 에이전트의 각각의 예를 들어, 2개의 정보 섹션이 있다: 아카이브 에이전트 런타임 환경 상세, 퍼블리쉬 서버 관계. 아카이브 에이전트 런타임 환경 상세는 아카이브 에이전트의 구성 및 환경을 리스트한다. 퍼블리쉬 서버 관계 정보는 아카이브 에이전트가 기능하는 퍼블리쉬 서버를 확인한다.The Archive Agents view shows performance examples of all up and archive agents, and for each of the archive agents, there are two information sections: Archive agent runtime environment details, publish server relationships. The archive agent runtime environment details lists the configuration and environment of the archive agent. The publish server relationship information identifies the publish server on which the archive agent is functioning.
상기의 설명이 본 발명의 시스템의 실시간 모니터링을 제공하는 것이 이해될 것이어서, 성능은 모니터링될 수 있고 문제는 결정된다.It will be appreciated that the above description provides for real time monitoring of the system of the present invention, so that performance can be monitored and problems are determined.
본 발명의 시스템은 모니터되는 서버, 본 발명의 나머지 소프트웨어를 위한 개별 서버에서 어떤 프로브 소프트웨어의 탑재를 통하여 설치될 수 있다. 이 구성은 본 발명의 시스템의 상대적으로 간단한 탑재를 제공한다.The system of the present invention can be installed via the mounting of any probe software in a monitored server, a separate server for the remaining software of the present invention. This configuration provides a relatively simple mounting of the system of the present invention.
본 발명은 그 방법을 성능하는 방법 및 장치의 형태로 구체화될 수 있다. 본 발명은 또한 플라피 디스켓, CD-ROM, 하드 드라이브, 또는 어떠한 다른 기계-판독가능한 저장 매체와 같은 유형의 매체로 구체화된 프로그램 코드의 형태로 구체화될 수 있고, 프로그램 코드가 컴퓨터 같은 기계에 의해 로드되고 성능되는 경우, 기계는 본 발명을 성능하는 장치가 된다. 본 발명은 또한 프로그램 코드, 예를 들어 저장 매체에 저장되거나, 기계로 로드되거나 및/또는 기계에 의해 성능되거나 또는 광 섬유 또는 전자기 복사를 통해 오버(over) 전기적 와이어링 또는 케이블링과 같은 어떤 전송 매체 상에서 전송되는지의 형태로 구체화될 수 있고, 프로그램 코드가 컴퓨터와 같은 기계에 로드되고 기계에 의해 성능되는 경우, 기계는 본 발명을 성능하는 장치가 된다. 일반 목적용 프로세서에 장착되는 경우, 프로그램 코드 세그먼트는 특별한 로직 회로에 유사하게 동작하는 독특한 장치를 제공하는 프로세서와 결합한다.The invention may be embodied in the form of a method and apparatus for performing the method. The invention may also be embodied in the form of program code embodied in a tangible medium such as a floppy diskette, CD-ROM, hard drive, or any other machine-readable storage medium, wherein the program code is implemented by a machine such as a computer. When loaded and performed, the machine becomes a device that performs the invention. The invention also provides program code, for example any transmission, such as over electrical wiring or cabling, stored in a storage medium, loaded into a machine and / or performed by a machine, or via optical fiber or electromagnetic radiation. It can be embodied in the form of being transmitted on a medium, and when the program code is loaded on a machine such as a computer and performed by the machine, the machine becomes an apparatus for performing the present invention. When mounted on a general purpose processor, program code segments are combined with a processor that provides a unique device that operates similarly to a particular logic circuit.
보기의 실시예는 자바 기술 및 구체적으로 J2EE 기술을 사용하여 엔터프라이즈 어플리케이션에 관하여 설명되어 왔지만, 본 발명의 방법은 다른 기술에 사용될 수 있다. 예를 들어, 본 발명의 방법은 다른 플랫폼-독립 기술에 사용될 수 있다. 본 발명의 방법은 또한 분산 엔터프라이즈 어플리케이션에 적용할 수 있는 다른 기술에 사용될 수 있다.Although embodiments of the example have been described with respect to enterprise applications using Java technology and specifically J2EE technology, the method of the present invention can be used in other technologies. For example, the methods of the present invention can be used in other platform-independent techniques. The method of the present invention can also be used in other techniques applicable to distributed enterprise applications.
본 발명이 바람직한 실시에 관해 설명되어 왔지만, 본 발명은 바람직한 실시예에 제한되는 것으로 간주되어야 하는 것은 아니다.Although the present invention has been described in terms of preferred embodiments, the present invention is not to be considered as being limited to the preferred embodiments.
Claims (80)
Applications Claiming Priority (2)
| Application Number | Priority Date | Filing Date | Title |
|---|---|---|---|
| US39202202P | 2002-06-25 | 2002-06-25 | |
| US60/392,022 | 2002-06-25 |
Publications (2)
| Publication Number | Publication Date |
|---|---|
| KR20060066570A true KR20060066570A (en) | 2006-06-16 |
| KR100772999B1 KR100772999B1 (en) | 2007-11-05 |
Family
ID=30000796
Family Applications (1)
| Application Number | Title | Priority Date | Filing Date |
|---|---|---|---|
| KR1020047021335A Expired - Fee Related KR100772999B1 (en) | 2002-06-25 | 2003-06-25 | Method and system for monitoring performance of applications in a distributed environment |
Country Status (7)
| Country | Link |
|---|---|
| US (5) | US7870244B2 (en) |
| EP (1) | EP1527395A4 (en) |
| JP (1) | JP4528116B2 (en) |
| KR (1) | KR100772999B1 (en) |
| CN (1) | CN1662901A (en) |
| AU (1) | AU2003278862A1 (en) |
| WO (1) | WO2004001555A2 (en) |
Cited By (4)
| Publication number | Priority date | Publication date | Assignee | Title |
|---|---|---|---|---|
| KR101136087B1 (en) * | 2009-11-09 | 2012-04-17 | 서울대학교병원 | Method and system for monitoring performance of application in a web environment |
| KR102072700B1 (en) * | 2019-07-31 | 2020-02-03 | (주)소울시스템즈 | Apparatus and method for real-time application performance monitoring based on full packet processing |
| KR102368147B1 (en) * | 2021-10-19 | 2022-02-25 | 강동원 | Server monitoring system and the driving method |
| KR102785518B1 (en) * | 2024-08-07 | 2025-03-25 | 메타빌드 주식회사 | Application management module and method using AI-based small language model and retrieval augmented generation technology |
Families Citing this family (245)
| Publication number | Priority date | Publication date | Assignee | Title |
|---|---|---|---|---|
| EP1239385B1 (en) * | 2001-02-28 | 2003-07-02 | Sap Ag | Computer system for business applications with alert notification and conditional enforcing |
| EP1495398A4 (en) | 2002-04-08 | 2008-11-26 | Ibm | Method and system for problem determination in distributed enterprise applications |
| US7577951B2 (en) * | 2002-05-30 | 2009-08-18 | Hewlett-Packard Development Company, L.P. | Performance of computer programs while they are running |
| US7870244B2 (en) | 2002-06-25 | 2011-01-11 | International Business Machines Corporation | Monitoring performance of applications in a distributed environment |
| US7440464B2 (en) * | 2002-08-29 | 2008-10-21 | Nokia Corporation | Server control plane connections recovery in a server-gateway architecture based telecommunication network |
| US7650403B2 (en) * | 2002-11-20 | 2010-01-19 | Microsoft Corporation | System and method for client side monitoring of client server communications |
| US7734637B2 (en) * | 2002-12-05 | 2010-06-08 | Borland Software Corporation | Method and system for automatic detection of monitoring data sources |
| JP3862652B2 (en) | 2002-12-10 | 2006-12-27 | キヤノン株式会社 | Printing control method and information processing apparatus |
| US7529842B2 (en) * | 2002-12-17 | 2009-05-05 | International Business Machines Corporation | Method, system and program product for detecting an operational risk of a node |
| US8443067B2 (en) * | 2003-04-25 | 2013-05-14 | Siemens Aktiengesellschaft | Method and apparatus for identifying an order in a network |
| US20050033625A1 (en) * | 2003-08-06 | 2005-02-10 | International Business Machines Corporation | Method, apparatus and program storage device for scheduling the performance of maintenance tasks to maintain a system environment |
| WO2005017715A2 (en) * | 2003-08-15 | 2005-02-24 | International Business Machines Corporation | Method and system for monitoring performance of processes across multiple environments and servers |
| US20050076116A1 (en) * | 2003-09-24 | 2005-04-07 | Taiwan Semiconductor Manufacturing Co., Ltd. | Information server performance alert system and method |
| US20050102429A1 (en) * | 2003-11-06 | 2005-05-12 | Sap Ag | Portal cluster manager |
| GB2423851A (en) | 2003-11-13 | 2006-09-06 | Commvault Systems Inc | System and method for performing an image level snapshot and for restoring partial volume data |
| US7822826B1 (en) | 2003-12-30 | 2010-10-26 | Sap Ag | Deployment of a web service |
| US7756968B1 (en) * | 2003-12-30 | 2010-07-13 | Sap Ag | Method and system for employing a hierarchical monitor tree for monitoring system resources in a data processing environment |
| US7941521B1 (en) | 2003-12-30 | 2011-05-10 | Sap Ag | Multi-service management architecture employed within a clustered node configuration |
| US7725572B1 (en) | 2003-12-30 | 2010-05-25 | Sap Ag | Notification architecture and method employed within a clustered node configuration |
| US20050172029A1 (en) * | 2004-01-29 | 2005-08-04 | International Business Machines Corporation | Method and apparatus for managing a connection pool using heuristic information |
| US7721266B2 (en) * | 2004-03-26 | 2010-05-18 | Sap Ag | Unified logging service with a logging formatter |
| US20050216510A1 (en) * | 2004-03-26 | 2005-09-29 | Reinhold Kautzleben | System and method to provide a visual administrator in a network monitoring system |
| US7526550B2 (en) * | 2004-03-26 | 2009-04-28 | Sap Ag | Unified logging service with a log viewer |
| US8234374B2 (en) * | 2004-04-26 | 2012-07-31 | Microsoft Corporation | Privacy model that grants access rights and provides security to shared content |
| US8073819B2 (en) * | 2004-05-11 | 2011-12-06 | At&T Intellectual Property I, L.P. | System and method for storing element information |
| US7665063B1 (en) | 2004-05-26 | 2010-02-16 | Pegasystems, Inc. | Integration of declarative rule-based processing with procedural programming |
| US7685575B1 (en) * | 2004-06-08 | 2010-03-23 | Sun Microsystems, Inc. | Method and apparatus for analyzing an application |
| US7596546B2 (en) * | 2004-06-14 | 2009-09-29 | Matchett Douglas K | Method and apparatus for organizing, visualizing and using measured or modeled system statistics |
| US7340654B2 (en) | 2004-06-17 | 2008-03-04 | Platform Computing Corporation | Autonomic monitoring in a grid environment |
| US7861246B2 (en) * | 2004-06-17 | 2010-12-28 | Platform Computing Corporation | Job-centric scheduling in a grid environment |
| US7844969B2 (en) | 2004-06-17 | 2010-11-30 | Platform Computing Corporation | Goal-oriented predictive scheduling in a grid environment |
| US7761556B2 (en) * | 2004-11-22 | 2010-07-20 | International Business Machines Corporation | Performance monitoring within an enterprise software system |
| JP4711672B2 (en) * | 2004-12-24 | 2011-06-29 | 富士通株式会社 | Information processing method and program |
| US7788226B2 (en) * | 2004-12-30 | 2010-08-31 | Sap Ag | Monitoring availability of applications |
| US7954062B2 (en) * | 2005-01-03 | 2011-05-31 | International Business Machines Corporation | Application status board mitigation system and method |
| US7788497B2 (en) * | 2005-01-13 | 2010-08-31 | Bea Systems, Inc. | Credential mapping of WebLogic and database user ids |
| US7769784B2 (en) * | 2005-01-27 | 2010-08-03 | International Business Machines Corporation | System for autonomically improving performance of Enterprise Java Beans through dynamic workload management |
| US20060179428A1 (en) * | 2005-02-10 | 2006-08-10 | Kiyokuni Kawachiya | Method and system for efficiently starting a JAVA application |
| US8856309B1 (en) * | 2005-03-17 | 2014-10-07 | Oracle America, Inc. | Statistical tool for use in networked computer platforms |
| US7469362B2 (en) * | 2005-04-15 | 2008-12-23 | Microsoft Corporation | Using a call stack hash to record the state of a process |
| US20060282832A1 (en) * | 2005-06-10 | 2006-12-14 | Klaus Nagel | Calculating module runtimes on multiple platforms |
| GB0516554D0 (en) * | 2005-08-11 | 2005-09-21 | Ibm | Method, apparatus and computer program for enabling monitoring of a resource |
| US7519024B2 (en) * | 2005-08-17 | 2009-04-14 | Sprint Communications Company Lp | Resource selection in a communication network |
| US20070060367A1 (en) * | 2005-09-14 | 2007-03-15 | International Business Machines Corporation | End-to-end transaction tracking in the enterprise |
| US20070064736A1 (en) * | 2005-09-19 | 2007-03-22 | Fujitsu Network Communications | Zero suppressed performance management data interpretation and same value suppression and interpretation |
| US20070067369A1 (en) * | 2005-09-22 | 2007-03-22 | Minshall Robbie J | Method and system for quantifying and comparing workload on an application server |
| KR100750834B1 (en) | 2005-10-06 | 2007-08-22 | (주)아이피엠에스 | A computer-readable recording medium for extracting various performance data of a Java application through a method of identifying the call relationship of the monitored data and an algorithm using the method when monitoring Java byte code data |
| US7784033B2 (en) * | 2005-10-11 | 2010-08-24 | Bea Systems, Inc. | JDBC monitoring and diagnostics enhancements |
| US20070081464A1 (en) * | 2005-10-11 | 2007-04-12 | Fujitsu Network Communications, Inc. | Real-time performance monitoring of ethernet data over sonet |
| US7823136B2 (en) * | 2005-10-11 | 2010-10-26 | Bea Systems, Inc. | Callbacks for monitoring driver-level statistics |
| US7921084B2 (en) * | 2005-10-11 | 2011-04-05 | Oracle International Corporation | Timer-driven diagnostic image inhibition for statement cache/connection pool |
| US20070083525A1 (en) * | 2005-10-11 | 2007-04-12 | Rahul Srivastava | JDBC debugging enhancements |
| US20070083526A1 (en) * | 2005-10-11 | 2007-04-12 | Rahul Srivastava | Monitoring statistics and profile information for JDBC resources |
| US7194386B1 (en) | 2005-10-17 | 2007-03-20 | Microsoft Corporation | Automated collection of information |
| US8095641B2 (en) * | 2005-10-27 | 2012-01-10 | International Business Machines Corporation | Method and system for virtualized health monitoring of resources |
| US8887241B2 (en) * | 2006-02-22 | 2014-11-11 | International Business Machines Corporation | Virtual roles |
| US8924335B1 (en) | 2006-03-30 | 2014-12-30 | Pegasystems Inc. | Rule-based user interface conformance methods |
| US20070266369A1 (en) * | 2006-05-11 | 2007-11-15 | Jiebo Guan | Methods, systems and computer program products for retrieval of management information related to a computer network using an object-oriented model |
| US8166143B2 (en) * | 2006-05-11 | 2012-04-24 | Netiq Corporation | Methods, systems and computer program products for invariant representation of computer network information technology (IT) managed resources |
| US20070294224A1 (en) * | 2006-06-16 | 2007-12-20 | Jean-Jacques Heler | Tracking discrete elements of distributed transactions |
| US20070297337A1 (en) * | 2006-06-21 | 2007-12-27 | International Business Machines Corporation | Apparatus and methods for determining availability and performance of entities providing services in a distributed system using filtered service consumer feedback |
| US7493302B2 (en) * | 2006-06-26 | 2009-02-17 | International Business Machines Corporation | Federated transaction path and service level agreement monitoring across service oriented application partner domains |
| JP2008015648A (en) * | 2006-07-04 | 2008-01-24 | Yokogawa Electric Corp | Application management framework |
| US8010849B2 (en) * | 2006-09-05 | 2011-08-30 | Arm Limited | Diagnosing faults within programs being executed by virtual machines |
| US8601104B2 (en) | 2006-09-19 | 2013-12-03 | The Invention Science Fund I, Llc | Using network access port linkages for data structure update decisions |
| US8281036B2 (en) | 2006-09-19 | 2012-10-02 | The Invention Science Fund I, Llc | Using network access port linkages for data structure update decisions |
| US7752255B2 (en) * | 2006-09-19 | 2010-07-06 | The Invention Science Fund I, Inc | Configuring software agent security remotely |
| US20080072032A1 (en) * | 2006-09-19 | 2008-03-20 | Searete Llc, A Limited Liability Corporation Of The State Of Delaware | Configuring software agent security remotely |
| US8984579B2 (en) * | 2006-09-19 | 2015-03-17 | The Innovation Science Fund I, LLC | Evaluation systems and methods for coordinating software agents |
| US8607336B2 (en) * | 2006-09-19 | 2013-12-10 | The Invention Science Fund I, Llc | Evaluation systems and methods for coordinating software agents |
| US8601530B2 (en) * | 2006-09-19 | 2013-12-03 | The Invention Science Fund I, Llc | Evaluation systems and methods for coordinating software agents |
| US8055797B2 (en) * | 2006-09-19 | 2011-11-08 | The Invention Science Fund I, Llc | Transmitting aggregated information arising from appnet information |
| US8627402B2 (en) * | 2006-09-19 | 2014-01-07 | The Invention Science Fund I, Llc | Evaluation systems and methods for coordinating software agents |
| US8224930B2 (en) * | 2006-09-19 | 2012-07-17 | The Invention Science Fund I, Llc | Signaling partial service configuration changes in appnets |
| US9306975B2 (en) * | 2006-09-19 | 2016-04-05 | The Invention Science Fund I, Llc | Transmitting aggregated information arising from appnet information |
| US20080168311A1 (en) * | 2007-01-08 | 2008-07-10 | Microsoft Corporation | Configuration debugging comparison |
| US20080172671A1 (en) * | 2007-01-11 | 2008-07-17 | International Business Machines Corporation | Method and system for efficient management of resource utilization data in on-demand computing |
| US8250525B2 (en) * | 2007-03-02 | 2012-08-21 | Pegasystems Inc. | Proactive performance management for multi-user enterprise software systems |
| JP2010524128A (en) * | 2007-04-12 | 2010-07-15 | トムソン ライセンシング | Message mechanism for workflow interface |
| US9602340B2 (en) * | 2007-04-20 | 2017-03-21 | Sap Se | Performance monitoring |
| US8898277B2 (en) * | 2007-06-08 | 2014-11-25 | Oracle International Corporation | Performance monitoring infrastructure for distributed transaction service |
| WO2008153193A1 (en) * | 2007-06-15 | 2008-12-18 | Nec Corporation | Address conversion device and address conversion method |
| US8874721B1 (en) * | 2007-06-27 | 2014-10-28 | Sprint Communications Company L.P. | Service layer selection and display in a service network monitoring system |
| US10417586B2 (en) * | 2007-08-31 | 2019-09-17 | Red Hat, Inc. | Attaching ownership to data |
| US7840653B1 (en) * | 2007-10-25 | 2010-11-23 | United Services Automobile Association (Usaa) | Enhanced throttle management system |
| JP2009187542A (en) * | 2008-01-10 | 2009-08-20 | Nec Corp | Request processing system, request processing method, and request processing program |
| US20090217259A1 (en) * | 2008-02-26 | 2009-08-27 | Microsoft Corporation | Building Operating System Images Based on Applications |
| US7486196B1 (en) * | 2008-04-14 | 2009-02-03 | International Business Machines Corporation | Using audio to detect changes to the performance of an application |
| JP2009294949A (en) * | 2008-06-05 | 2009-12-17 | Hitachi Ltd | Storage device and method of measuring performance of the same |
| US20090319653A1 (en) * | 2008-06-20 | 2009-12-24 | International Business Machines Corporation | Server configuration management method |
| US9477570B2 (en) * | 2008-08-26 | 2016-10-25 | Red Hat, Inc. | Monitoring software provisioning |
| EP2350933A4 (en) * | 2008-10-16 | 2012-05-23 | Hewlett Packard Development Co | Performance analysis of applications |
| US8744806B2 (en) | 2008-10-29 | 2014-06-03 | Sevone, Inc. | Scalable performance management system |
| US9084937B2 (en) | 2008-11-18 | 2015-07-21 | Gtech Canada Ulc | Faults and performance issue prediction |
| US8028196B2 (en) * | 2008-11-18 | 2011-09-27 | Gtech Corporation | Predictive diagnostics and fault management |
| JP5111340B2 (en) | 2008-11-20 | 2013-01-09 | 株式会社日立製作所 | Method for monitoring apparatus constituting information processing system, information processing apparatus, and information processing system |
| US8131842B1 (en) * | 2009-02-11 | 2012-03-06 | Charles Schwab & Co., Inc. | System and method for collecting and displaying information about many computer systems |
| US8843435B1 (en) | 2009-03-12 | 2014-09-23 | Pegasystems Inc. | Techniques for dynamic data processing |
| US8893156B2 (en) * | 2009-03-24 | 2014-11-18 | Microsoft Corporation | Monitoring of distributed applications |
| US8468492B1 (en) | 2009-03-30 | 2013-06-18 | Pegasystems, Inc. | System and method for creation and modification of software applications |
| US10157117B2 (en) * | 2009-10-08 | 2018-12-18 | International Business Machines Corporation | Processing transaction timestamps |
| US8316126B2 (en) | 2009-10-08 | 2012-11-20 | International Business Machines Corporation | Stitching transactions |
| US9117013B2 (en) | 2009-10-08 | 2015-08-25 | International Business Machines Corporation | Combining monitoring techniques |
| US8584123B2 (en) * | 2009-10-08 | 2013-11-12 | International Business Machines Corporation | Linking transactions |
| US8286192B2 (en) * | 2009-12-04 | 2012-10-09 | Red Hat, Inc. | Kernel subsystem for handling performance counters and events |
| US9665461B2 (en) | 2009-12-04 | 2017-05-30 | Red Hat, Inc. | Obtaining application performance data for different performance events via a unified channel |
| US8171340B2 (en) * | 2009-12-11 | 2012-05-01 | Red Hat, Inc. | Software performance counters |
| US8935703B2 (en) * | 2009-12-11 | 2015-01-13 | Red Hat, Inc. | Performance counter inheritance |
| US8954996B2 (en) * | 2009-12-11 | 2015-02-10 | Red Hat, Inc. | Profiling the system providing performance statistics in real time |
| US8930525B2 (en) * | 2010-04-27 | 2015-01-06 | Hewlett-Packard Development Company, L.P. | Method and apparatus for measuring business transaction performance |
| EP2577451A4 (en) | 2010-06-01 | 2014-06-18 | Hewlett Packard Development Co | Methods, apparatus, and articles of manufacture to deploy software applications |
| CN101968758B (en) * | 2010-10-28 | 2012-10-10 | 西北工业大学 | Multiple data point threshold detection method |
| US9378111B2 (en) * | 2010-11-11 | 2016-06-28 | Sap Se | Method and system for easy correlation between monitored metrics and alerts |
| US8842119B2 (en) * | 2010-11-17 | 2014-09-23 | Hewlett-Packard Development Company, L.P. | Displaying system performance information |
| US9009185B2 (en) * | 2010-12-28 | 2015-04-14 | Sevone, Inc. | Scalable performance management system |
| US9467507B2 (en) * | 2011-01-03 | 2016-10-11 | Verizon Patent And Licensing Inc. | Wireless network cloud computing resource management |
| US8909761B2 (en) * | 2011-02-08 | 2014-12-09 | BlueStripe Software, Inc. | Methods and computer program products for monitoring and reporting performance of network applications executing in operating-system-level virtualization containers |
| US8880487B1 (en) | 2011-02-18 | 2014-11-04 | Pegasystems Inc. | Systems and methods for distributed rules processing |
| US10140320B2 (en) * | 2011-02-28 | 2018-11-27 | Sdl Inc. | Systems, methods, and media for generating analytical data |
| US20120221319A1 (en) * | 2011-02-28 | 2012-08-30 | Andrew Trese | Systems, Methods and Media for Translating Informational Content |
| EP2557503B1 (en) * | 2011-07-28 | 2020-04-01 | Tata Consultancy Services Ltd. | Application performance measurement and reporting |
| RU2465635C1 (en) * | 2011-08-02 | 2012-10-27 | Открытое акционерное общество "ОТИК-групп" | Method for diagnosing program-hardware environment for distributed computing in multicore single-chip systems during real-time problem solving using adaptive petri net graphs |
| US9984054B2 (en) | 2011-08-24 | 2018-05-29 | Sdl Inc. | Web interface including the review and manipulation of a web document and utilizing permission based control |
| US20130073059A1 (en) * | 2011-09-20 | 2013-03-21 | Joseph Mark Brian | User interface for determining resource consumption |
| US20130081001A1 (en) * | 2011-09-23 | 2013-03-28 | Microsoft Corporation | Immediate delay tracker tool |
| US10270755B2 (en) | 2011-10-03 | 2019-04-23 | Verisign, Inc. | Authenticated name resolution |
| US8874733B2 (en) | 2011-12-14 | 2014-10-28 | Microsoft Corporation | Providing server performance decision support |
| US9195936B1 (en) | 2011-12-30 | 2015-11-24 | Pegasystems Inc. | System and method for updating or modifying an application without manual coding |
| CN102567185B (en) * | 2011-12-31 | 2014-11-12 | 北京新媒传信科技有限公司 | Monitoring method of application server |
| US9413615B1 (en) * | 2012-03-02 | 2016-08-09 | Juniper Networks, Inc. | Trap filtering within a device management protocol |
| US9298715B2 (en) | 2012-03-07 | 2016-03-29 | Commvault Systems, Inc. | Data storage system utilizing proxy device for storage operations |
| US9471578B2 (en) | 2012-03-07 | 2016-10-18 | Commvault Systems, Inc. | Data storage system utilizing proxy device for storage operations |
| EP2823883B1 (en) | 2012-03-08 | 2018-09-19 | Consejo Superior De Investigaciones Científicas (CSIC) | Coating with photochromic properties, method for producing said coating and use thereof applicable to optical articles and glazed surfaces |
| US9471460B2 (en) | 2012-03-29 | 2016-10-18 | International Business Machines Corporation | Characterization of real-time software base-station workloads at fine-grained time-scales |
| US9342537B2 (en) | 2012-04-23 | 2016-05-17 | Commvault Systems, Inc. | Integrated snapshot interface for a data storage system |
| US20150120914A1 (en) * | 2012-06-13 | 2015-04-30 | Hitachi, Ltd. | Service monitoring system and service monitoring method |
| US10382252B2 (en) * | 2012-06-26 | 2019-08-13 | Juniper Networks, Inc. | Filtering within device management protocol queries |
| US9135135B2 (en) | 2012-06-28 | 2015-09-15 | Sap Se | Method and system for auto-adjusting thresholds for efficient monitoring of system metrics |
| TW201405339A (en) * | 2012-07-24 | 2014-02-01 | Chunghwa Telecom Co Ltd | Operation relationship linking module having web operations sharing with thread pool and JDBC pool |
| US9916306B2 (en) | 2012-10-19 | 2018-03-13 | Sdl Inc. | Statistical linguistic analysis of source content |
| US9286185B2 (en) | 2012-11-16 | 2016-03-15 | Empire Technology Development Llc | Monitoring a performance of a computing device |
| US9886346B2 (en) | 2013-01-11 | 2018-02-06 | Commvault Systems, Inc. | Single snapshot for multiple agents |
| US9207969B2 (en) | 2013-01-25 | 2015-12-08 | Microsoft Technology Licensing, Llc | Parallel tracing for performance and detail |
| US8954546B2 (en) | 2013-01-25 | 2015-02-10 | Concurix Corporation | Tracing with a workload distributor |
| US9021262B2 (en) | 2013-01-25 | 2015-04-28 | Concurix Corporation | Obfuscating trace data |
| US20140025572A1 (en) * | 2013-01-25 | 2014-01-23 | Concurix Corporation | Tracing as a Service |
| US20130283281A1 (en) | 2013-02-12 | 2013-10-24 | Concurix Corporation | Deploying Trace Objectives using Cost Analyses |
| US8924941B2 (en) | 2013-02-12 | 2014-12-30 | Concurix Corporation | Optimization analysis using similar frequencies |
| US8997063B2 (en) | 2013-02-12 | 2015-03-31 | Concurix Corporation | Periodicity optimization in an automated tracing system |
| US9436589B2 (en) | 2013-03-15 | 2016-09-06 | Microsoft Technology Licensing, Llc | Increasing performance at runtime from trace data |
| US9223673B1 (en) | 2013-04-08 | 2015-12-29 | Amazon Technologies, Inc. | Custom host errors definition service |
| US9575874B2 (en) | 2013-04-20 | 2017-02-21 | Microsoft Technology Licensing, Llc | Error list and bug report analysis for configuring an application tracer |
| CN104142817B (en) * | 2013-05-10 | 2017-08-22 | 中国电信股份有限公司 | The method and apparatus of user resources usage amount is measured in Java applications |
| US9584364B2 (en) | 2013-05-21 | 2017-02-28 | Amazon Technologies, Inc. | Reporting performance capabilities of a computer resource service |
| CN104252391B (en) * | 2013-06-28 | 2017-09-12 | 国际商业机器公司 | Method and apparatus for managing multiple operations in distributed computing system |
| US10063450B2 (en) * | 2013-07-26 | 2018-08-28 | Opentv, Inc. | Measuring response trends in a digital television network |
| CN111522652B (en) * | 2013-08-13 | 2024-02-13 | 英特尔公司 | Power balancing for increased load density and improved energy efficiency |
| US9292415B2 (en) | 2013-09-04 | 2016-03-22 | Microsoft Technology Licensing, Llc | Module specific tracing in a shared module environment |
| US9503341B2 (en) * | 2013-09-20 | 2016-11-22 | Microsoft Technology Licensing, Llc | Dynamic discovery of applications, external dependencies, and relationships |
| US20150095015A1 (en) * | 2013-09-27 | 2015-04-02 | Statistics Solutions, Llc | Method and System for Presenting Statistical Data in a Natural Language Format |
| US9772927B2 (en) | 2013-11-13 | 2017-09-26 | Microsoft Technology Licensing, Llc | User interface for selecting tracing origins for aggregating classes of trace data |
| US9495251B2 (en) | 2014-01-24 | 2016-11-15 | Commvault Systems, Inc. | Snapshot readiness checking and reporting |
| US9632874B2 (en) | 2014-01-24 | 2017-04-25 | Commvault Systems, Inc. | Database application backup in single snapshot for multiple applications |
| US9753812B2 (en) | 2014-01-24 | 2017-09-05 | Commvault Systems, Inc. | Generating mapping information for single snapshot for multiple applications |
| US9639426B2 (en) | 2014-01-24 | 2017-05-02 | Commvault Systems, Inc. | Single snapshot for multiple applications |
| US20170053222A1 (en) * | 2014-02-19 | 2017-02-23 | Hewlett Packard Enterprise Development Lp | Role based assessment for an it management system |
| US9417970B2 (en) * | 2014-02-27 | 2016-08-16 | Halliburton Energy Services, Inc. | Data file processing for a well job data archive |
| IN2014MU00819A (en) | 2014-03-11 | 2015-09-25 | Tata Consultancy Services Ltd | |
| US9280407B2 (en) | 2014-04-16 | 2016-03-08 | International Business Machines Corporation | Program development in a distributed server environment |
| US9596164B1 (en) * | 2014-06-26 | 2017-03-14 | Juniper Networks, Inc. | Application visibility in layer 3 networks |
| CN104156661A (en) * | 2014-07-26 | 2014-11-19 | 珠海市君天电子科技有限公司 | Device and method for preventing account passwords from being tampered |
| US9558093B2 (en) * | 2014-07-30 | 2017-01-31 | Microsoft Technology Licensing, Llc | Visual tools for failure analysis in distributed systems |
| US9742690B2 (en) * | 2014-08-20 | 2017-08-22 | At&T Intellectual Property I, L.P. | Load adaptation architecture framework for orchestrating and managing services in a cloud computing system |
| US9774672B2 (en) | 2014-09-03 | 2017-09-26 | Commvault Systems, Inc. | Consolidated processing of storage-array commands by a snapshot-control media agent |
| CN104182540B (en) * | 2014-09-03 | 2017-10-27 | 北京国双科技有限公司 | Index statistical information processing method and processing device in data warehouse |
| US10042716B2 (en) | 2014-09-03 | 2018-08-07 | Commvault Systems, Inc. | Consolidated processing of storage-array commands using a forwarder media agent in conjunction with a snapshot-control media agent |
| US10469396B2 (en) | 2014-10-10 | 2019-11-05 | Pegasystems, Inc. | Event processing with enhanced throughput |
| US9648105B2 (en) | 2014-11-14 | 2017-05-09 | Commvault Systems, Inc. | Unified snapshot storage management, using an enhanced storage manager and enhanced media agents |
| US9448731B2 (en) | 2014-11-14 | 2016-09-20 | Commvault Systems, Inc. | Unified snapshot storage management |
| CN105988919B (en) * | 2015-03-02 | 2018-12-25 | 阿里巴巴集团控股有限公司 | Java type web container memory uses quantity measuring method and relevant apparatus |
| US10110688B2 (en) * | 2015-03-20 | 2018-10-23 | Sony Interactive Entertainment LLC | System and method for remote monitoring of API performance and user behavior associated with user interface |
| US11283697B1 (en) | 2015-03-24 | 2022-03-22 | Vmware, Inc. | Scalable real time metrics management |
| US10255081B2 (en) * | 2015-07-17 | 2019-04-09 | Accenture Global Solutions Limited | Method and system for intelligent cloud planning and decommissioning |
| CN105138571B (en) * | 2015-07-24 | 2019-12-24 | 四川长虹电器股份有限公司 | Distributed file system and method for storing massive small files |
| US10313211B1 (en) * | 2015-08-25 | 2019-06-04 | Avi Networks | Distributed network service risk monitoring and scoring |
| US10594562B1 (en) | 2015-08-25 | 2020-03-17 | Vmware, Inc. | Intelligent autoscale of services |
| US10701136B1 (en) * | 2015-08-26 | 2020-06-30 | Amdocs Development Limited | System, method, and computer program for monitoring application activity for a cluster of applications |
| US10044577B2 (en) * | 2015-11-04 | 2018-08-07 | International Business Machines Corporation | Visualization of cyclical patterns in metric data |
| US10791085B2 (en) | 2015-11-12 | 2020-09-29 | Verisign, Inc. | Techniques for directing a domain name service (DNS) resolution process |
| US9715721B2 (en) | 2015-12-18 | 2017-07-25 | Sony Corporation | Focus detection |
| US11283900B2 (en) * | 2016-02-08 | 2022-03-22 | Microstrategy Incorporated | Enterprise performance and capacity testing |
| US10440153B1 (en) | 2016-02-08 | 2019-10-08 | Microstrategy Incorporated | Enterprise health score and data migration |
| US10212041B1 (en) | 2016-03-04 | 2019-02-19 | Avi Networks | Traffic pattern detection and presentation in container-based cloud computing architecture |
| US10503753B2 (en) | 2016-03-10 | 2019-12-10 | Commvault Systems, Inc. | Snapshot replication operations based on incremental block change tracking |
| US10931548B1 (en) | 2016-03-28 | 2021-02-23 | Vmware, Inc. | Collecting health monitoring data pertaining to an application from a selected set of service engines |
| KR101955715B1 (en) * | 2016-04-01 | 2019-03-07 | 한국전자통신연구원 | Embedded system including a plurality of self-adaptive applications |
| US10698599B2 (en) | 2016-06-03 | 2020-06-30 | Pegasystems, Inc. | Connecting graphical shapes using gestures |
| US10698647B2 (en) | 2016-07-11 | 2020-06-30 | Pegasystems Inc. | Selective sharing for collaborative application usage |
| US10999240B1 (en) * | 2016-08-31 | 2021-05-04 | Verisign, Inc. | Client controlled domain name service (DNS) resolution |
| US10574559B2 (en) * | 2016-11-10 | 2020-02-25 | Bank Of America Corporation | System for defining and implementing performance monitoring requirements for applications and hosted computing environment infrastructure |
| US10362110B1 (en) * | 2016-12-08 | 2019-07-23 | Amazon Technologies, Inc. | Deployment of client data compute kernels in cloud |
| FR3061571B1 (en) * | 2016-12-29 | 2019-04-19 | Bull Sas | METHOD AND SYSTEM FOR MONITORING BATCH PROCESSING OF APPLICATIONS EXECUTED IN A COMPUTER INFRASTRUCTURE |
| US10904211B2 (en) | 2017-01-21 | 2021-01-26 | Verisign, Inc. | Systems, devices, and methods for generating a domain name using a user interface |
| US10348604B2 (en) | 2017-02-01 | 2019-07-09 | International Business Machines Corporation | Monitoring a resource consumption of an application |
| CN107222331B (en) * | 2017-04-26 | 2019-12-06 | 东软集团股份有限公司 | method and device for monitoring performance of distributed application system, storage medium and equipment |
| US10644962B2 (en) * | 2017-11-15 | 2020-05-05 | APImetrics Inc. | Continuous monitoring for performance evaluation of service interfaces |
| US10732885B2 (en) | 2018-02-14 | 2020-08-04 | Commvault Systems, Inc. | Block-level live browsing and private writable snapshots using an ISCSI server |
| US10999168B1 (en) | 2018-05-30 | 2021-05-04 | Vmware, Inc. | User defined custom metrics |
| US11048488B2 (en) | 2018-08-14 | 2021-06-29 | Pegasystems, Inc. | Software code optimizer and method |
| CN109359019A (en) * | 2018-08-15 | 2019-02-19 | 中国平安人寿保险股份有限公司 | Application program capacity monitoring method, device, electronic equipment and storage medium |
| CN109298990B (en) * | 2018-10-17 | 2023-04-14 | 平安科技(深圳)有限公司 | Log storage method and device, computer equipment and storage medium |
| WO2020086956A1 (en) | 2018-10-26 | 2020-04-30 | Vmware, Inc. | Collecting samples hierarchically in a datacenter |
| DE102018127949A1 (en) | 2018-11-08 | 2020-05-14 | Samson Aktiengesellschaft | Control of access rights in a networked system with data processing |
| CN109726085A (en) * | 2018-12-29 | 2019-05-07 | 云智慧(北京)科技有限公司 | Method and system for tracking performance problem |
| US11263111B2 (en) | 2019-02-11 | 2022-03-01 | Microstrategy Incorporated | Validating software functionality |
| CN110209495B (en) * | 2019-05-17 | 2023-08-18 | 上海新储集成电路有限公司 | Method and system for adjusting operation environment |
| US11290358B2 (en) | 2019-05-30 | 2022-03-29 | Vmware, Inc. | Partitioning health monitoring in a global server load balancing system |
| CN110245508A (en) * | 2019-06-18 | 2019-09-17 | 广东电网有限责任公司 | Localization method, device, equipment and the readable storage medium storing program for executing of database connection leakage |
| WO2020262932A1 (en) * | 2019-06-25 | 2020-12-30 | 세종대학교산학협력단 | Classification method using distributed classification model |
| US11288053B2 (en) | 2019-08-15 | 2022-03-29 | Microstrategy Incorporated | Conversion and restoration of computer environments to container-based implementations |
| CN110601875B (en) * | 2019-08-15 | 2022-08-19 | 平安普惠企业管理有限公司 | Information output method, information output apparatus, management device, and computer-readable storage medium |
| US11106455B2 (en) | 2019-08-15 | 2021-08-31 | Microstrategy Incorporated | Integration of containers with external elements |
| US11637748B2 (en) | 2019-08-28 | 2023-04-25 | Microstrategy Incorporated | Self-optimization of computing environments |
| US11507295B2 (en) | 2019-08-30 | 2022-11-22 | Microstrategy Incorporated | Backup, restoration, and migration of computer systems |
| US11210189B2 (en) | 2019-08-30 | 2021-12-28 | Microstrategy Incorporated | Monitoring performance of computing systems |
| US11354216B2 (en) | 2019-09-18 | 2022-06-07 | Microstrategy Incorporated | Monitoring performance deviations |
| US11360881B2 (en) | 2019-09-23 | 2022-06-14 | Microstrategy Incorporated | Customizing computer performance tests |
| US11438231B2 (en) | 2019-09-25 | 2022-09-06 | Microstrategy Incorporated | Centralized platform management for computing environments |
| CN113055640B (en) * | 2019-12-28 | 2023-06-20 | 浙江宇视科技有限公司 | A device management method and device in a monitoring system |
| US11093239B1 (en) | 2020-05-13 | 2021-08-17 | International Business Machines Corporation | Application driven configuration of service management tools |
| CA3122790A1 (en) * | 2020-06-19 | 2021-12-19 | Clariti Cloud Inc. | Configurable government process automation on multi tenant platform systems |
| US11567945B1 (en) | 2020-08-27 | 2023-01-31 | Pegasystems Inc. | Customized digital content generation systems and methods |
| US11729279B2 (en) * | 2021-01-11 | 2023-08-15 | Dell Products, L.P. | System and method for remote assisted optimization of native services |
| US11531613B1 (en) * | 2021-03-19 | 2022-12-20 | Headspin, Inc. | Systems for remote determination of data from test devices |
| CN113064762B (en) * | 2021-04-09 | 2024-02-23 | 上海新炬网络信息技术股份有限公司 | Service self-recovery method based on various detection |
| US12069537B2 (en) * | 2021-05-14 | 2024-08-20 | Headspin, Inc. | Systems for controlling acquisition of test data from devices |
| US11811861B2 (en) | 2021-05-17 | 2023-11-07 | Vmware, Inc. | Dynamically updating load balancing criteria |
| US11799824B2 (en) | 2021-06-14 | 2023-10-24 | Vmware, Inc. | Method and apparatus for enhanced client persistence in multi-site GSLB deployments |
| US12200008B2 (en) | 2021-07-20 | 2025-01-14 | VMware LLC | Security aware load balancing for a global server load balancing system |
| US11954473B2 (en) | 2021-09-20 | 2024-04-09 | Microstrategy Incorporated | Deployment architecture for multi-tenant cloud computing systems |
| CN114356693A (en) * | 2021-12-15 | 2022-04-15 | 绿盟科技集团股份有限公司 | A data monitoring method, device, medium and equipment |
| US20230222417A1 (en) * | 2022-01-07 | 2023-07-13 | Jawad Khan | Automated electronic data interchange application |
| US11861342B2 (en) | 2022-01-28 | 2024-01-02 | Microstrategy Incorporated | Enhanced cloud-computing environment deployment |
| US12107821B2 (en) | 2022-07-14 | 2024-10-01 | VMware LLC | Two tier DNS |
| US12316601B2 (en) | 2022-07-14 | 2025-05-27 | VMware LLC | Two tier DNS |
Family Cites Families (74)
| Publication number | Priority date | Publication date | Assignee | Title |
|---|---|---|---|---|
| JP2626512B2 (en) | 1993-11-02 | 1997-07-02 | 日本電気株式会社 | Information processing performance measurement method |
| US5941947A (en) | 1995-08-18 | 1999-08-24 | Microsoft Corporation | System and method for controlling access to data entities in a computer network |
| US6119101A (en) | 1996-01-17 | 2000-09-12 | Personal Agents, Inc. | Intelligent agents for electronic commerce |
| US5828833A (en) * | 1996-08-15 | 1998-10-27 | Electronic Data Systems Corporation | Method and system for allowing remote procedure calls through a network firewall |
| US7146230B2 (en) | 1996-08-23 | 2006-12-05 | Fieldbus Foundation | Integrated fieldbus data server architecture |
| US6438573B1 (en) | 1996-10-09 | 2002-08-20 | Iowa State University Research Foundation, Inc. | Real-time programming method |
| US5870559A (en) | 1996-10-15 | 1999-02-09 | Mercury Interactive | Software system and associated methods for facilitating the analysis and management of web sites |
| US6031528A (en) | 1996-11-25 | 2000-02-29 | Intel Corporation | User based graphical computer network diagnostic tool |
| US6408336B1 (en) | 1997-03-10 | 2002-06-18 | David S. Schneider | Distributed administration of access to information |
| US5958010A (en) | 1997-03-20 | 1999-09-28 | Firstsense Software, Inc. | Systems and methods for monitoring distributed applications including an interface running in an operating system kernel |
| US6338150B1 (en) | 1997-05-13 | 2002-01-08 | Micron Technology, Inc. | Diagnostic and managing distributed processor system |
| US6014760A (en) * | 1997-09-22 | 2000-01-11 | Hewlett-Packard Company | Scheduling method and apparatus for a distributed automated testing system |
| US6167537A (en) * | 1997-09-22 | 2000-12-26 | Hewlett-Packard Company | Communications protocol for an automated testing system |
| US6490620B1 (en) | 1997-09-26 | 2002-12-03 | Worldcom, Inc. | Integrated proxy interface for web based broadband telecommunications management |
| JPH11120106A (en) * | 1997-10-17 | 1999-04-30 | Fujitsu Ltd | Display method of server resource usage status and recording medium therefor |
| US6023696A (en) | 1997-10-31 | 2000-02-08 | Oracle Corporation | Summary table query routing |
| US6321263B1 (en) * | 1998-05-11 | 2001-11-20 | International Business Machines Corporation | Client-based application availability |
| US6070190A (en) | 1998-05-11 | 2000-05-30 | International Business Machines Corporation | Client-based application availability and response monitoring and reporting for distributed computing environments |
| US6633908B1 (en) | 1998-05-20 | 2003-10-14 | International Business Machines Corporation | Enabling application response measurement |
| US6054987A (en) * | 1998-05-29 | 2000-04-25 | Hewlett-Packard Company | Method of dynamically creating nodal views of a managed network |
| ATE297088T1 (en) | 1998-08-03 | 2005-06-15 | Firstsense Software Inc | METHOD AND PROGRAM FOR MONITORING DISTRIBUTED APPLICATIONS WITH DIAGNOSTIC INFORMATION |
| US6446028B1 (en) | 1998-11-25 | 2002-09-03 | Keynote Systems, Inc. | Method and apparatus for measuring the performance of a network based application program |
| US6360214B1 (en) | 1998-12-16 | 2002-03-19 | Microsoft Corporation | Automatic database statistics creation |
| JP3190902B2 (en) | 1999-02-02 | 2001-07-23 | 中部日本電気ソフトウェア株式会社 | Performance monitoring apparatus, performance monitoring method, and recording medium recording performance monitoring program |
| JP3265280B2 (en) | 1999-02-18 | 2002-03-11 | エヌイーシーソフト株式会社 | Application performance analysis system |
| JP2000250833A (en) | 1999-02-26 | 2000-09-14 | Hitachi Information Systems Ltd | Operating information acquisition method in multiple server operation management and recording medium recording the program |
| JP2000315198A (en) * | 1999-05-06 | 2000-11-14 | Hitachi Ltd | Distributed processing system and performance monitoring method thereof |
| DE60026788T2 (en) | 1999-05-13 | 2006-10-12 | Canon K.K. | Device for searching a device in a network |
| US8862507B2 (en) | 1999-06-14 | 2014-10-14 | Integral Development Corporation | System and method for conducting web-based financial transactions in capital markets |
| US7844594B1 (en) * | 1999-06-18 | 2010-11-30 | Surfwax, Inc. | Information search, retrieval and distillation into knowledge objects |
| US6298451B1 (en) * | 1999-11-02 | 2001-10-02 | Idini Corporation | Directory-based failure recovery and load balancing system |
| US6711739B1 (en) | 1999-11-08 | 2004-03-23 | Sun Microsystems, Inc. | System and method for handling threads of execution |
| US6829639B1 (en) | 1999-11-15 | 2004-12-07 | Netvision, Inc. | Method and system for intelligent global event notification and control within a distributed computing environment |
| US6909481B2 (en) * | 2000-11-07 | 2005-06-21 | Seiko Epson Corporation | Liquid crystal display and electronic appliance |
| EP1117220A1 (en) | 2000-01-14 | 2001-07-18 | Sun Microsystems, Inc. | Method and system for protocol conversion |
| US6701363B1 (en) * | 2000-02-29 | 2004-03-02 | International Business Machines Corporation | Method, computer program product, and system for deriving web transaction performance metrics |
| US6453269B1 (en) * | 2000-02-29 | 2002-09-17 | Unisys Corporation | Method of comparison for computer systems and apparatus therefor |
| US6691244B1 (en) | 2000-03-14 | 2004-02-10 | Sun Microsystems, Inc. | System and method for comprehensive availability management in a high-availability computer system |
| CA2303739C (en) | 2000-04-04 | 2009-06-30 | Webhancer Corporation | Method and system for managing performance of data transfers for a data access system |
| US7415537B1 (en) | 2000-04-07 | 2008-08-19 | International Business Machines Corporation | Conversational portal for providing conversational browsing and multimedia broadcast on demand |
| US6892221B2 (en) * | 2000-05-19 | 2005-05-10 | Centerbeam | Data backup |
| US7140022B2 (en) | 2000-06-02 | 2006-11-21 | Honeywell International Inc. | Method and apparatus for slack stealing with dynamic threads |
| US7127743B1 (en) | 2000-06-23 | 2006-10-24 | Netforensics, Inc. | Comprehensive security structure platform for network managers |
| US6658471B1 (en) * | 2000-06-29 | 2003-12-02 | International Business Machines Corporation | Method and system for zero overhead software performance measurement instrumentation |
| JP2002041331A (en) | 2000-07-27 | 2002-02-08 | Mitsubishi Electric Corp | Server performance measurement device |
| JP2002082926A (en) * | 2000-09-06 | 2002-03-22 | Nippon Telegr & Teleph Corp <Ntt> | Distributed application test and operation management system |
| AU2001289009A1 (en) * | 2000-09-12 | 2002-03-26 | Falcon Asset Acquisition Group | Method and apparatus for flash load balancing |
| JP2002099448A (en) | 2000-09-21 | 2002-04-05 | Ntt Data Corp | Performance monitoring apparatus and method |
| AU2002214659A1 (en) * | 2000-10-26 | 2002-05-06 | James C. Flood Jr. | Method and system for managing distributed content and related metadata |
| US7937470B2 (en) | 2000-12-21 | 2011-05-03 | Oracle International Corp. | Methods of determining communications protocol latency |
| US7685224B2 (en) * | 2001-01-11 | 2010-03-23 | Truelocal Inc. | Method for providing an attribute bounded network of computers |
| US20020165999A1 (en) | 2001-03-07 | 2002-11-07 | Ajile Systems, Inc. | Apparatus and method for interfacing hardware events with software events |
| US6616049B1 (en) * | 2001-04-10 | 2003-09-09 | Symbol Technologies, Inc. | Retail sales customer marketing system with electronic coupon processing |
| US7051339B2 (en) | 2001-06-29 | 2006-05-23 | Goldman, Sachs & Co. | System and method to measure latency of transaction information flowing through a computer system |
| US6976193B2 (en) | 2001-09-20 | 2005-12-13 | Intel Corporation | Method for running diagnostic utilities in a multi-threaded operating system environment |
| US20030065764A1 (en) | 2001-09-26 | 2003-04-03 | Karen Capers | Integrated diagnostic center |
| US6941298B2 (en) | 2002-01-18 | 2005-09-06 | Bea Systems, Inc. | System and method for providing result sets using EJB query language |
| US20030195875A1 (en) | 2002-03-25 | 2003-10-16 | Valk Jeffrey W. | Information management structure |
| EP1495398A4 (en) | 2002-04-08 | 2008-11-26 | Ibm | Method and system for problem determination in distributed enterprise applications |
| US8234128B2 (en) * | 2002-04-30 | 2012-07-31 | Baxter International, Inc. | System and method for verifying medical device operational parameters |
| US7870244B2 (en) * | 2002-06-25 | 2011-01-11 | International Business Machines Corporation | Monitoring performance of applications in a distributed environment |
| US7945909B2 (en) | 2003-05-09 | 2011-05-17 | Sap Aktiengesellschaft | Initiating recovery of an executing task using historical information and task information |
| WO2005017715A2 (en) | 2003-08-15 | 2005-02-24 | International Business Machines Corporation | Method and system for monitoring performance of processes across multiple environments and servers |
| US7725529B2 (en) * | 2003-11-19 | 2010-05-25 | George Mason Intellectual Properties, Inc. | Geographic information system |
| US20060167929A1 (en) | 2005-01-25 | 2006-07-27 | Amit Chakraborty | Method for optimizing archival of XML documents |
| US7757214B1 (en) * | 2005-11-10 | 2010-07-13 | Symantec Operating Coporation | Automated concurrency configuration of multi-threaded programs |
| US8856096B2 (en) | 2005-11-16 | 2014-10-07 | Vcvc Iii Llc | Extending keyword searching to syntactically and semantically annotated data |
| US7650394B2 (en) * | 2006-09-15 | 2010-01-19 | Microsoft Corporation | Synchronizing email recipient lists using block partition information |
| US7945804B2 (en) * | 2007-10-17 | 2011-05-17 | International Business Machines Corporation | Methods and systems for digitally controlled multi-frequency clocking of multi-core processors |
| US8443056B2 (en) * | 2010-01-22 | 2013-05-14 | Netflix, Inc. | Client-server signaling in content distribution networks |
| US8341650B1 (en) * | 2010-02-02 | 2012-12-25 | Cellco Partnership | High thread count analyzer for web application server environment |
| JP5730518B2 (en) * | 2010-08-27 | 2015-06-10 | 株式会社日立国際電気 | Specific person detection system and specific person detection method |
| US20120324568A1 (en) * | 2011-06-14 | 2012-12-20 | Lookout, Inc., A California Corporation | Mobile web protection |
| US8738765B2 (en) * | 2011-06-14 | 2014-05-27 | Lookout, Inc. | Mobile device DNS optimization |
-
2003
- 2003-06-25 US US10/606,028 patent/US7870244B2/en not_active Expired - Fee Related
- 2003-06-25 EP EP03742215A patent/EP1527395A4/en not_active Withdrawn
- 2003-06-25 AU AU2003278862A patent/AU2003278862A1/en not_active Abandoned
- 2003-06-25 KR KR1020047021335A patent/KR100772999B1/en not_active Expired - Fee Related
- 2003-06-25 CN CN038148773A patent/CN1662901A/en active Pending
- 2003-06-25 WO PCT/US2003/020109 patent/WO2004001555A2/en not_active Ceased
- 2003-06-25 JP JP2004516267A patent/JP4528116B2/en not_active Expired - Fee Related
-
2008
- 2008-09-22 US US12/235,545 patent/US20090070462A1/en not_active Abandoned
- 2008-09-23 US US12/236,461 patent/US8037205B2/en not_active Expired - Fee Related
-
2011
- 2011-07-15 US US13/183,959 patent/US9053220B2/en not_active Expired - Fee Related
-
2015
- 2015-05-04 US US14/703,572 patent/US9678964B2/en not_active Expired - Fee Related
Cited By (4)
| Publication number | Priority date | Publication date | Assignee | Title |
|---|---|---|---|---|
| KR101136087B1 (en) * | 2009-11-09 | 2012-04-17 | 서울대학교병원 | Method and system for monitoring performance of application in a web environment |
| KR102072700B1 (en) * | 2019-07-31 | 2020-02-03 | (주)소울시스템즈 | Apparatus and method for real-time application performance monitoring based on full packet processing |
| KR102368147B1 (en) * | 2021-10-19 | 2022-02-25 | 강동원 | Server monitoring system and the driving method |
| KR102785518B1 (en) * | 2024-08-07 | 2025-03-25 | 메타빌드 주식회사 | Application management module and method using AI-based small language model and retrieval augmented generation technology |
Also Published As
| Publication number | Publication date |
|---|---|
| CN1662901A (en) | 2005-08-31 |
| EP1527395A2 (en) | 2005-05-04 |
| AU2003278862A1 (en) | 2004-01-06 |
| JP2005531070A (en) | 2005-10-13 |
| KR100772999B1 (en) | 2007-11-05 |
| AU2003278862A8 (en) | 2004-01-06 |
| JP4528116B2 (en) | 2010-08-18 |
| US20090070462A1 (en) | 2009-03-12 |
| EP1527395A4 (en) | 2006-03-01 |
| US20090019441A1 (en) | 2009-01-15 |
| US8037205B2 (en) | 2011-10-11 |
| WO2004001555A3 (en) | 2005-03-03 |
| US20150234816A1 (en) | 2015-08-20 |
| US7870244B2 (en) | 2011-01-11 |
| US9053220B2 (en) | 2015-06-09 |
| US20110276594A1 (en) | 2011-11-10 |
| US20040064552A1 (en) | 2004-04-01 |
| US9678964B2 (en) | 2017-06-13 |
| WO2004001555A2 (en) | 2003-12-31 |
Similar Documents
| Publication | Publication Date | Title |
|---|---|---|
| KR100772999B1 (en) | Method and system for monitoring performance of applications in a distributed environment | |
| JP4267462B2 (en) | Method and system for problem determination in distributed enterprise applications | |
| US6122664A (en) | Process for monitoring a plurality of object types of a plurality of nodes from a management node in a data processing system by distributing configured agents | |
| US7661135B2 (en) | Apparatus, system, and method for gathering trace data indicative of resource activity | |
| US9231963B2 (en) | Detecting anomalous behavior patterns in an electronic environment | |
| US20050066027A1 (en) | Method of displaying events | |
| US20110265064A1 (en) | Detecting, using, and sharing it design patterns and anti-patterns | |
| US9411969B2 (en) | System and method of assessing data protection status of data protection resources | |
| US20120158925A1 (en) | Monitoring a model-based distributed application | |
| EP1955235A2 (en) | System and method of managing data protection resources | |
| Shivakumar | Web performance monitoring and infrastructure planning | |
| Stefanovic et al. | Monitoring and Data Protection | |
| Malcher et al. | Automation and Troubleshooting | |
| Alapati et al. | Analyzing Operating System Performance | |
| Malcher et al. | Database Troubleshooting | |
| Perttu | Implementing a Network Monitoring Tool in a Company IT Infrastructure | |
| Strasser | Long-term workload monitoring: workload management on distributed OS/2 server systems | |
| Jamen et al. | Oracle Fusion Middleware Performance and Tuning Guide 11g Release 1 (11.1. 1.7. 0) E10108-13 |
Legal Events
| Date | Code | Title | Description |
|---|---|---|---|
| PA0105 | International application |
St.27 status event code: A-0-1-A10-A15-nap-PA0105 |
|
| A201 | Request for examination | ||
| E13-X000 | Pre-grant limitation requested |
St.27 status event code: A-2-3-E10-E13-lim-X000 |
|
| P11-X000 | Amendment of application requested |
St.27 status event code: A-2-2-P10-P11-nap-X000 |
|
| P13-X000 | Application amended |
St.27 status event code: A-2-2-P10-P13-nap-X000 |
|
| PA0201 | Request for examination |
St.27 status event code: A-1-2-D10-D11-exm-PA0201 |
|
| R17-X000 | Change to representative recorded |
St.27 status event code: A-3-3-R10-R17-oth-X000 |
|
| PG1501 | Laying open of application |
St.27 status event code: A-1-1-Q10-Q12-nap-PG1501 |
|
| R18-X000 | Changes to party contact information recorded |
St.27 status event code: A-3-3-R10-R18-oth-X000 |
|
| R18-X000 | Changes to party contact information recorded |
St.27 status event code: A-3-3-R10-R18-oth-X000 |
|
| R17-X000 | Change to representative recorded |
St.27 status event code: A-3-3-R10-R17-oth-X000 |
|
| E902 | Notification of reason for refusal | ||
| PE0902 | Notice of grounds for rejection |
St.27 status event code: A-1-2-D10-D21-exm-PE0902 |
|
| T11-X000 | Administrative time limit extension requested |
St.27 status event code: U-3-3-T10-T11-oth-X000 |
|
| T11-X000 | Administrative time limit extension requested |
St.27 status event code: U-3-3-T10-T11-oth-X000 |
|
| T11-X000 | Administrative time limit extension requested |
St.27 status event code: U-3-3-T10-T11-oth-X000 |
|
| E13-X000 | Pre-grant limitation requested |
St.27 status event code: A-2-3-E10-E13-lim-X000 |
|
| P11-X000 | Amendment of application requested |
St.27 status event code: A-2-2-P10-P11-nap-X000 |
|
| P13-X000 | Application amended |
St.27 status event code: A-2-2-P10-P13-nap-X000 |
|
| E701 | Decision to grant or registration of patent right | ||
| PE0701 | Decision of registration |
St.27 status event code: A-1-2-D10-D22-exm-PE0701 |
|
| GRNT | Written decision to grant | ||
| PR0701 | Registration of establishment |
St.27 status event code: A-2-4-F10-F11-exm-PR0701 |
|
| PR1002 | Payment of registration fee |
St.27 status event code: A-2-2-U10-U12-oth-PR1002 Fee payment year number: 1 |
|
| PG1601 | Publication of registration |
St.27 status event code: A-4-4-Q10-Q13-nap-PG1601 |
|
| R18-X000 | Changes to party contact information recorded |
St.27 status event code: A-5-5-R10-R18-oth-X000 |
|
| R18-X000 | Changes to party contact information recorded |
St.27 status event code: A-5-5-R10-R18-oth-X000 |
|
| FPAY | Annual fee payment |
Payment date: 20100824 Year of fee payment: 4 |
|
| PR1001 | Payment of annual fee |
St.27 status event code: A-4-4-U10-U11-oth-PR1001 Fee payment year number: 4 |
|
| LAPS | Lapse due to unpaid annual fee | ||
| PC1903 | Unpaid annual fee |
St.27 status event code: A-4-4-U10-U13-oth-PC1903 Not in force date: 20111030 Payment event data comment text: Termination Category : DEFAULT_OF_REGISTRATION_FEE |
|
| PC1903 | Unpaid annual fee |
St.27 status event code: N-4-6-H10-H13-oth-PC1903 Ip right cessation event data comment text: Termination Category : DEFAULT_OF_REGISTRATION_FEE Not in force date: 20111030 |