The present application is a divisional application of the chinese patent application 201680082163.6 "differentiation of methylation levels in complex biological samples" filed 2016, 12, 15.
This application claims the benefit of 2016 U.S. provisional application serial No. 62/401,591, filed 9/29/year, and U.S. provisional application serial No. 62/268,961, filed 12/17/2015, each of which is incorporated herein by reference.
Detailed Description
DNA methylation data can provide valuable information when evaluated independently or in combination with other information such as genotype or gene expression pattern. One purpose of the methods set forth herein is to determine this information, e.g., whether one or more sites in the genome are differentially methylated in the test sample as compared to the reference sample or dataset.
Particular embodiments may be used to detect, screen, monitor (e.g., for relapse, remission, or response to therapy), grade, classify (e.g., to aid in the selection of the most appropriate form of therapy), and predict cancer using methylation analysis of circulating plasma/serum DNA.
Cancer DNA is known to demonstrate aberrant DNA methylation (see, e.g., herman et al 2003N Engl J Med 349, 2042-2054, incorporated herein by reference). For example, cpG site promoters of genes such as tumor suppressor genes are hypermethylated, whereas CpG sites in the genome are under-methylated, as compared to non-cancerous cells. In particular embodiments of the methods set forth herein, the detected methylation pattern from the blood of an individual suspected of having cancer is indicative of the methylation status of potentially cancerous tissue, such that the pattern is expected to be different between individuals having cancer when compared to those healthy individuals who do not have cancer or when compared to those individuals who have been cured of cancer.
Because aberrant methylation occurs in most cancers, the methods described herein can be applied to the detection of any of a variety of malignancies with aberrant methylation, such as those in the lung, breast, colorectal, prostate, nasopharynx, stomach, testis, skin, nervous system, bone, ovary, liver, blood tissue, pancreas, uterus, kidney, lymphoid tissue, and the like. Malignant tumors can have various histological subtypes, such as carcinoma, adenocarcinoma, sarcoma, fibroadenocarcinoma, neuroendocrine, or undifferentiated.
In particular embodiments, the methods for determining methylation patterns can be used to monitor the development of a fetus (e.g., to determine the presence or absence of dysplasia) or to determine the presence of a particular disease or condition. In such cases, the method can be performed using a sample (e.g., blood, tissue, or amniotic fluid) obtained from a pregnant female, and the sample can be evaluated for the methylation level of fetal nucleic acids. DNA methylation profiles of placental tissue can be used to assess the pathophysiology of pregnancy-related or development-related diseases such as preeclampsia and intrauterine growth retardation. Disorders in genomic imprints are associated with developmental disorders such as Prader-Willi syndrome and Angelman syndrome, and can be identified or assessed using the methods of the present disclosure. Altered patterns of genomic imprinting and overall DNA methylation in placental and fetal tissues have been observed in pregnancies generated by assisted reproductive techniques (see, e.g., hirra et al 2012 Hum reprod 27, 2541-2548, incorporated herein by reference) and can be detected using the methods set forth herein. Exemplary methods that can be modified for use with the methods of the present disclosure are listed in U.S. patent application publication nos. 2013/0189684 A1 or 2014/0080715 A1, each of which is incorporated herein by reference.
The ability to determine placental or fetal methylation patterns from maternal plasma provides a non-invasive method of determining, detecting and monitoring pregnancy-associated conditions such as preeclampsia, intrauterine growth retardation, preterm birth and others. For example, detecting disease-specific aberrant methylation signatures allows for screening, diagnosis and monitoring of such pregnancy-associated conditions.
In addition, the methods set forth herein yield diagnostic or prognostic information for other conditions. For example, liver tissue may be analyzed to determine methylation patterns specific to the liver, which may be used to identify liver lesions. Other tissues that may also be analyzed include brain cells, bone, lung, heart, muscle, kidney, and the like. DNA can be obtained from a blood sample and analyzed in the methods set forth herein in order to determine the status of any of a variety of tissues that contribute DNA to blood.
In addition, the methylation pattern of a transplanted organ can be determined from the plasma DNA of the recipient of the organ transplant. The plasma-based graft analysis may be a synergistic technique of plasma-based graft genomic analysis, such as the techniques listed in: zheng et al 2012 Clin Chem 58:549-558 parts of the total weight of the composition; lo et al 1998 Lancet 351:1329-1330; or Snyder et al 2011 Proc Natl Acad Sci USA;108:6229-6234, each of which is incorporated herein by reference).
The methylation pattern of various tissues can change over time, for example, as a result of development, aging, disease progression (e.g., inflammation, cancer, or cirrhosis), or treatment. The dynamic nature of DNA methylation makes such assays potentially very valuable for monitoring physiological and pathological processes. For example, if a change in the plasma methylation pattern of an individual is detected compared to a baseline value obtained when the individual is healthy, a disease process in an organ that contributes plasma DNA can be detected.
Unless otherwise indicated, terms used herein will be understood to have their ordinary meaning in the relevant art. Several terms used herein and their meanings are listed below.
As used herein, the term "cell-free" when used in reference to DNA is intended to mean DNA that has been removed from a cell in vivo. Removal of DNA may be a natural process such as necrosis or apoptosis. Cell-free DNA is typically obtained from blood or a fraction thereof such as plasma. Cell-free DNA can be obtained from other body fluids or tissues.
As used herein, the term "cell type" is intended to identify a cell based on morphology, phenotype, developmental origin, or other known or discernible distinctive cellular characteristic. A variety of different cell types may be obtained from a single organism (or from the same species of organism). <xnotran> , , α, β, , , B , , , , , , , , , , B , , , , , , , , , , , , B , , , , , , , , , , , B , , T , T , , B , , , , , , , , , , B , , , B , , (liver Alexander), , , , , B , (lung Schwann), </xnotran> Lung squamous cells, lung macrophages, lung osteoblasts, neuroendocrine cells, alveoli, gastric epithelial cells, and gastric fibroblasts. In some embodiments, two cells may be considered to be the same type of cell, although one of the cells has been phenotypically or morphologically altered by a condition or disease, such as cancer. For purposes of comparison, a first cell that has been altered by a disease or condition can be compared to a second cell based on a known or suspected state of the first cell prior to being altered. For example, cancerous pancreatic ductal epithelial cells can be considered to be the same type of cells as non-cancerous pancreatic ductal epithelial cells.
As used herein, the term "circulating" when used in reference to DNA is intended to mean DNA that has now or previously moved through the circulatory system of an organism, whether in cell-free form or within a circulating cell.
As used herein, the term "cover," when used in reference to a genetic locus, is intended to mean the number of detection events (e.g., sequence reads) that align with or "cover" the locus. In some embodiments, the term refers to the average number of detection events (e.g., sequence reads) that align with or "cover" multiple loci. In general, the level of coverage obtained from a sequencing method is directly related to the confidence in the accuracy of calls (e.g., nucleotide type or methylation state) determined at a particular base position or genetic locus. At higher coverage levels, loci are covered by a greater number of aligned sequence reads, so calls can be made with higher confidence.
As used herein, the term "CpG site" is intended to mean a position in a nucleic acid molecule or a representation of the sequence of the molecule in which cytosine and guanine nucleotides occur, the 3 'oxygen of a cytosine nucleotide being covalently linked to the 5' phosphate of a guanine nucleotide. The nucleic acid is typically DNA. Cytosine nucleotides can optionally contain a methyl moiety, hydroxymethyl moiety, or hydrogen moiety at the 5 position of the pyrimidine ring.
As used herein, the term "derived" when used in relation to DNA is intended to refer to the source from which the DNA was obtained or the origin of the DNA synthesis. In the case of biologically derived DNA, the term may be used to refer to the in vivo source from which the DNA was obtained or the in vivo origin of DNA synthesis. Exemplary origins include, but are not limited to, a cell type, a tissue type, an organism, or a species of an organism. In the case of synthetically derived DNA, the term may be used to refer to the in vitro source from which the DNA was obtained or the in vitro origin of the DNA synthesis. However, DNA molecules derived from a particular source or origin may be subsequently copied or amplified. The sequence of the resulting copy or amplicon may be referred to as being derived from the source or origin.
As used herein, the term "each," when used in relation to a collection of items, is intended to identify an individual item in the collection, but does not necessarily refer to each item in the collection. Exceptions may occur if explicit disclosure or context clearly dictates otherwise.
As used herein, the term "methylation difference" is intended to mean a qualitative or quantitative marker that two nucleotides or nucleic acids do not have the same methylation state. Methylation differences can be indicated for nucleotides at aligned positions on different nucleic acids. In some cases, the methylation difference can be the sum or summation of multiple aligned positions. When two or more nucleic acids are aligned, the methylation difference can be an average across one or more aligned positions.
As used herein, the term "methylation state" when used in reference to a locus (e.g., cpG sites or polynucleotide fragments) spanning several molecules having this locus refers to one or more characteristics of the locus that correlate with the presence or absence of a methyl moiety. Non-limiting examples of such features include whether any cytosine (C) base within a locus is methylated, the location of the methylated C base, the percentage of methylated C bases at a particular locus, and allelic differences in methylation due to, for example, differences in the origin of the alleles. Reference to the methylation state of a particular CpG site in a nucleic acid molecule relates to the presence or absence of a methyl moiety at the 5 position of the pyrimidine ring of cytosine. The term can apply to one or more cytosine nucleotides (or representations thereof, e.g., chemical formulas) or one or more nucleic acid molecules (or representations thereof, e.g., sequence representations). The term can also refer to the relative or absolute amount (e.g., concentration) of methylated C or unmethylated C at a particular locus in a nucleic acid. The methylation state is sometimes over-methylated and sometimes under-methylated. For example, if all or most of the C bases within a locus are methylated, the methylation state can be referred to as "hypermethylated". In another example, if all or most of the C bases within a locus are unmethylated, the methylation state can be referred to as "under-methylated". Likewise, if all or most of the C bases within a locus are methylated as compared to a reference, the methylation state is considered hypermethylated as compared to the reference. Alternatively, if all or most of the C bases within a locus are not methylated compared to a reference, the methylation status is considered to be under-methylated compared to the reference.
A "methylation site" is a locus at which methylation has occurred or has the potential to occur in a nucleic acid. Methylation sites are sometimes a C base or multiple C bases in a region, and sometimes methylation sites are CpG sites in a locus. Each methylation site in a locus may or may not be methylated. Methylation sites can be susceptible to methylation, either due to naturally occurring events in vivo or due to events that chemically methylate nucleotides in vitro.
As used herein, the term "mixture," when used in reference to two or more components, is intended to mean that the two or more components are present in a fluid or container at the same time. The components are typically capable of contacting each other by diffusion or agitation. The components can be separate molecules (e.g., two or more nucleic acid fragments), or the components can be part of a single molecule (e.g., a sequence region on a long nucleic acid molecule).
As used herein, the term "tissue" is intended to mean a collection or aggregation of cells that act together to perform one or more specific functions in an organism. The cells may optionally be morphologically similar. Exemplary tissues include, but are not limited to, eye, muscle, skin, tendon, vein, artery, blood, heart, spleen, lymph node, bone marrow, lung, bronchus, trachea, intestine, small intestine, large intestine, colon, rectum, salivary gland, tongue, gallbladder, appendix, liver, pancreas, brain, stomach, skin, kidney, ureter, bladder, urethra, gonad, testis, ovary, uterus, fallopian tube, thymus, pituitary, thyroid, adrenal, or parathyroid. The tissue may be derived from any of a variety of organs of the human body or other bodies.
The embodiments listed below and recited in the claims are understood from the above definitions.
The present disclosure provides a method for differentiating abnormal methylation levels of DNA from a first cell type. The method may comprise the steps of: (a) Providing a test data set comprising (i) methylation status of a plurality of sites (e.g., cpG sites) of test genomic DNA from at least one test organism, and (ii) coverage at each site (e.g., cpG site) for detecting methylation status; (b) Providing methylation status of a plurality of sites (e.g., cpG sites) in a reference genomic DNA from one or more reference individual organisms, (c) determining, for each site (e.g., cpG site), a methylation difference between the test genomic DNA and the reference genomic DNA, thereby providing a normalized methylation difference for each site (e.g., cpG site); and (d) weighting the normalized methylation difference for each site (e.g., cpG site) by coverage at each site (e.g., cpG site) to determine an aggregate coverage-weighted normalized methylation difference score. Optionally, the sites from the test genomic DNA are derived from a plurality of different cell types from the individual test organisms, and alternatively, the cell type from which each site is derived is unknown. In another optional embodiment, the individual test organism and the one or more reference individual organisms are of the same species.
Also provided is a method for distinguishing between abnormal methylation levels of DNA of a sample containing DNA from a plurality of different cell types, comprising the steps of: (a) Providing a sample containing a mixture of genomic DNA from a plurality of different cell types from at least one test organism, thereby providing a test genomic DNA; (b) Detecting the methylation status of a plurality of sites (e.g., cpG sites) in the test genomic DNA; (c) Determining coverage at each site (e.g., cpG site) used to detect methylation status; (d) Providing methylation status of a plurality of sites (e.g., cpG sites) in reference genomic DNA from at least one reference individual, the at least one test organism and the reference individual optionally being of the same species; (e) Determining, for each site (e.g., cpG site), a methylation difference between the test genomic DNA and the reference genomic DNA, thereby providing a normalized methylation difference for each site (e.g., cpG site); and (f) weighting the normalized methylation difference for each site (e.g., cpG site) by coverage at each site (e.g., cpG site) to determine an aggregate coverage-weighted normalized methylation difference score.
The invention also provides an alternative sensitivity method for distinguishing abnormal methylation levels of DNA from a first cell type.
The first stage of the method involves establishing a methylation baseline, which includes the steps of: (a) Providing methylation status of a plurality of sites (e.g., cpG sites) in baseline genomic DNA from two or more normal individual organisms; and (b) determining the mean methylation level and the standard deviation of the methylation level of the baseline genomic DNA for each site (e.g., cpG site). In some embodiments, the number of normal individual organisms that provide the baseline genomic DNA is at least 3, at least 5, at least 10, at least 20, at least 50, or at least 100.
The second stage of the method involves determining the aggregate methylation score of a plurality of training samples, comprising the steps of: (c) Providing a training set of normal genomic DNA samples from two or more normal individual organisms comprising (i) the methylation status of a plurality of sites (e.g., cpG sites) in the training set of normal genomic DNA samples, and optionally (ii) a coverage at each site (e.g., cpG site) for detecting the methylation status; (d) Determining, for each site (e.g., cpG site), a methylation difference between each normal genomic DNA sample of the training set and the baseline genomic DNA, thereby providing a normalized methylation difference for each normal genomic DNA sample of the training set at each site (e.g., cpG site); (e) Converting the normalized methylation difference for each normal genomic DNA sample of the training set at each site (e.g., cpG site) to a probability (e.g., unilateral p-value) that such or greater normalized methylation difference is observed, and optionally weighting the probability of such an event; (f) Determining an aggregate methylation score for each normal genomic DNA sample of the training set to obtain a training set methylation score; and (g) calculating the mean methylation score and standard deviation of the training set methylation scores. In some embodiments, the number of normal individual organisms that provide genomic DNA of the training set is at least 3, at least 5, at least 10, at least 20, at least 50, or at least 100.
The third stage of the method (which may be performed before, after, or concurrently with the second stage) involves determining the aggregate methylation fraction of a given test sample, which includes the steps of: (h) Providing a test data set comprising (i) methylation status of a plurality of sites (e.g., cpG sites) of test genomic DNA from at least one test organism, and optionally (ii) coverage at said sites (e.g., cpG sites) for detecting methylation status; (i) Determining, for each site (e.g., cpG site), a methylation difference between the test genomic DNA and the baseline genomic DNA, thereby providing a normalized methylation difference for the test genomic DNA; (j) Converting the normalized methylation difference for the test genomic DNA at each site (e.g., cpG site) to a probability (e.g., a one-sided p-value) that such or greater normalized methylation difference is observed, and optionally weighting the probability of such an event; and (k) determining the aggregate methylation fraction of the test genomic DNA.
The fourth phase of the method involves the steps of: (1) The methylation fraction of the test genomic DNA is compared to the average methylation fraction in the training set of normal genomic DNA and the standard deviation of the methylation fraction to determine the number of standard deviations of the distribution of the methylation fraction of the test genomic DNA from the methylation fraction in the training set of normal genomic DNA. In the event that the number of standard deviations exceeds a predetermined threshold (e.g., 2.0, 2.5, 3.0, 3.5, 4.0, 4.5, 5.0, etc.), the test sample is deemed to have an abnormal level of DNA methylation.
Optionally, the methylation sites (e.g., cpG sites) from the test genomic DNA are derived from a plurality of different cell types from the individual test organism, and alternatively, the cell type from which each site (e.g., cpG site) is derived is unknown. In another optional embodiment, the individual test organism and one or more of the baseline individual organisms, the training individual organisms, or a combination thereof are of the same species.
An alternative sensitive method for distinguishing between abnormal methylation levels of DNA in samples containing DNA from a plurality of different cell types is also provided.
The first stage of the method involves establishing a methylation baseline, which includes the steps of: (a) Providing methylation status of a plurality of sites (e.g., cpG sites) in baseline genomic DNA from two or more normal individual organisms; and (b) determining the mean methylation level and the standard deviation of the methylation level of the baseline genomic DNA for each site (e.g., cpG site). In some embodiments, the number of normal individual organisms that provide the baseline genomic DNA is at least 3, at least 5, at least 10, at least 20, at least 50, or at least 100.
The second stage of the method involves determining the aggregate methylation score of a plurality of training samples, comprising the steps of: (c) Providing a training set of normal genomic DNA samples from two or more normal individual organisms comprising (i) the methylation status of a plurality of sites (e.g., cpG sites) in the training set of normal genomic DNA samples, and optionally (ii) a coverage at each site (e.g., cpG site) for detecting the methylation status; (d) Determining, for each site (e.g., cpG site), a methylation difference between each normal genomic DNA sample of the training set and the baseline genomic DNA, thereby providing a normalized methylation difference for each normal genomic DNA sample of the training set at each site (e.g., cpG site); (e) Converting the normalized methylation difference for each normal genomic DNA sample of the training set at each site (e.g., cpG site) to a probability (e.g., a unilateral p-value) that such or greater normalized methylation difference is observed, and optionally weighting the probabilities; (f) Determining an aggregate methylation score for each normal genomic DNA sample of the training set to obtain a training set methylation score; and (g) calculating the mean methylation score and standard deviation of the methylation scores of the training set. In some embodiments, the number of normal individual organisms that provide genomic DNA of the training set is at least 3, at least 5, at least 10, at least 20, at least 50, or at least 100.
The third stage of the method (which may be performed before, after, or concurrently with the second stage) involves determining the aggregate methylation fraction of a given test sample, which includes the steps of: (h) Providing a mixture of genomic DNA from a test organism suspected of having a condition (e.g., cancer) associated with abnormal DNA methylation levels, wherein the mixture comprises genomic DNA from a plurality of different cell types of the test organism, thereby providing a test genomic DNA; (i) Detecting the methylation status of a plurality of sites (e.g., cpG sites) in the test genomic DNA, and optionally determining coverage at each site (e.g., cpG site) used to detect the methylation status; (j) Determining, for each site (e.g., cpG site), a methylation difference between the test genomic DNA and the baseline genomic DNA, thereby providing a normalized methylation difference for the test genomic DNA; (k) Converting the normalized methylation difference of the test genomic DNA at each site (e.g., cpG site) to a probability (e.g., a one-sided p-value) that such or greater normalized methylation difference is observed, and optionally weighting the probability of such an event; and (1) determining the aggregate methylation fraction of the test genomic DNA.
The fourth phase of the method involves the steps of: (m) comparing the methylation score of the test genomic DNA to the average methylation score in the training set of normal genomic DNA and the standard deviation of the methylation scores to determine the number of standard deviations of the distribution of the methylation scores of the test genomic DNA and the methylation scores in the training set of normal genomic DNA. In the event that the number of standard deviations exceeds a predetermined threshold (e.g., 1.5, 2.0, 2.5, 3.0, 3.5, 4.0, 4.5, 5.0, etc.), the test sample is deemed to have an abnormal level of DNA methylation.
The methods set forth herein may be performed for any of a variety of test organisms. Exemplary organisms include, but are not limited to, eukaryotic (single or multi-cellular) organisms. Exemplary eukaryotic organisms include mammals such as rodents, mice, rats, rabbits, guinea pigs, ungulates, horses, sheep, pigs, goats, cows, cats, dogs, primates, humans or non-human primates; plants such as Arabidopsis thaliana (Arabidopsis thaliana), maize (corn (Zea mays)), sorghum, oats (rice sativa), wheat, rice, canola, or soybean; algae such as Chlamydomonas reinhardtii (Chlamydomonas reinhardtii); nematodes such as Caenorhabditis elegans (Caenorhabditis elegans); insects such as Drosophila melanogaster (Drosophila melanogaster), mosquitoes, fruit flies, bees, or spiders; fish such as zebrafish (Danio rerio); a reptile: amphibians such as frogs or toads (Xenopus laevis); dictyostelium discodermatum (Dictyostelium discoidea); fungi such as Pneumocystis carinii (Pneumocystis carinii), takifugu rubripes (Takifugu rubripes), yeasts such as saccharomyces cerevisiae (saccharomyces cerevisiae) or Schizosaccharomyces pombe (Schizosaccharomyces pombe); or Plasmodium falciparum (Plasmodium falciparum). The methods of the present disclosure may also be used to assess methylation in organisms such as prokaryotes, examples of which include bacteria, escherichia coli, staphylococcus (staphylococcus), or Mycoplasma pneumoniae (Mycoplasma pneumoconiae); archaea; viruses, examples of which include hepatitis c virus or human immunodeficiency virus; or a viroid.
When applied to multicellular organisms, particular embodiments of the methods set forth herein may provide advantages in that the methods provide for determining the methylation state of genomic DNA derived from a particular cell or tissue in the context of nucleic acids derived from other cells or tissues. Thus, the methods set forth herein may be particularly useful for mammals such as humans. In some cases, the methods may be performed on samples containing a mixture of nucleic acids from several different cell types or tissue types, such as samples obtained from the blood or other biological fluids of a multicellular organism. Furthermore, the methods set forth herein may be advantageously used to assess the methylation state of genomic DNA obtained from somatic cells of a pregnant female mammal (such as a pregnant female human) and/or genomic DNA obtained from somatic cells of one or more prenatal offspring borne by the female.
In some embodiments, the methods can be performed on a mixture of genomic DNA from several different cell types of a mixture organism environment (e.g., a metagenomic sample), such as an ecological sample (e.g., pond, ocean, thermovent, etc.) or a digestive system sample (e.g., mouth, intestine, colon, etc.). Thus, the methods may be practiced on mixed organism samples where individual species are not isolated or cultured.
As is apparent from several exemplary embodiments set forth herein, cpG sites from test genomic DNA evaluated in the methods of the present disclosure may optionally be derived from a variety of different cell types from an individual test organism. As another alternative, the cell type from which each of the CpG sites is derived need not be known. This is often the case when the sample used in the method is derived from blood or another biological fluid or metagenomic sample.
In particular embodiments, a test sample for use in a method set forth herein can comprise circulating tumor DNA and circulating non-tumor DNA. This may be the case when the test sample comprises DNA obtained from, for example, blood from an individual known or suspected to have cancer.
Particular embodiments of the methods set forth herein may be practiced using the methylation status of multiple sites of test genomic DNA from an individual test organism. In some cases, the data is provided to an individual or system implementing the method. Alternatively, embodiments of the method may include one or more steps for detecting the methylation status of a plurality of sites in a test genome.
Methylation of sites (such as CpG dinucleotide sequences) can be measured using any of a variety of techniques used in the art for analyzing such sites. For example, methylation can be measured by employing a restriction enzyme-based technique that utilizes a methylation sensitive restriction endonuclease to distinguish between methylated cytosines and unmethylated cytosines. Restriction enzyme-based techniques include, for example, restriction digestion with methylation sensitive restriction enzymes followed by nucleic acid sequencing (e.g., massively parallel sequencing or next generation sequencing), southern blot analysis, real-time PCR, restriction-tagged genomic scan (RLGS), or Differential Methylation Hybridization (DMH).
Restriction enzymes characteristically hydrolyze DNA upon and/or after recognition of a specific sequence or recognition of a motif of typically between 4 and 8 bases in length. Among such enzymes, methylation-sensitive restriction enzymes are distinguished by the fact that: they cleave or do not cleave DNA depending on the cytosine methylation state of the recognition motif present, in particular the CpG sequence. In methods employing such methylation sensitive restriction enzymes, the digested DNA fragments can be differentially isolated (e.g., based on size or hybridization affinity to complementary probes), differentially amplified (e.g., based on affinity to amplification primers), or differentially detected (e.g., by microarray detection techniques or nucleic acid sequencing techniques), such that the methylation state of the sequences can be deduced accordingly.
In some embodiments employing methylation sensitive restriction enzymes, a post-digestion PCR amplification step is added, in which a set of two oligonucleotide primers (one on each side of the methylation sensitive restriction site) is used to amplify the digested genomic DNA. PCR products are generated and unrestricted template is detected (e.g., due to the presence of methylation restriction sites), while no PCR product is generated when digestion of the subtended methylation sensitive restriction enzyme sites occurs. Techniques for restriction enzyme-based analysis of genomic methylation are well known in the art and include the following: differential Methylation Hybridization (DMH) (Huang et al, 1999, human mol. Genet.8, 459-70); differential methylation hybridization based on non-I (e.g., WO02/086163A 1); restriction marker genome scan (RLGS) (Plass et al, 1999, genomics 58; methylation sensitive arbitrary primer PCR (AP-PCR) (Gonzalog et al, 1997, cancer Res.57, 594-599); methylated CpG site amplification (MCA) (Toyota et al, 1999, cancer Res.59. Other useful methods for detecting genomic methylation are described, for example, in U.S. patent application publication 2003/0170684 A1 or WO 04/05122. The references cited above are incorporated herein by reference.
Methylation of CpG dinucleotide sequences can also be measured by: DNA sequence analysis is followed by a cytosine transformation-based technique that relies on methylation state-dependent chemical modification of CpG sequences within isolated genomic DNA or fragments thereof. Chemical reagents that can distinguish between methylated and unmethylated CpG dinucleotide sequences include hydrazine and bisulfite, which cleaves nucleic acids. Bisulfite treatment, followed by alkaline hydrolysis, specifically converts unmethylated cytosines to uracil, without modification of 5-methylcytosine, as described below: olek A.,1996, nucleic Acids Res.24:5064-6 or Frommer et al, 1992, proc. Natl. Acad. Sci. USA 89:1827-1831, each of which is incorporated herein by reference. The bisulfite treated DNA can then be analyzed by molecular techniques such as PCR amplification, sequencing, and detection including oligonucleotide hybridization (e.g., using a nucleic acid microarray).
Techniques for analyzing bisulfite-treated DNA may employ methylation sensitive primers for analyzing CpG methylation status of isolated genomic DNA, e.g., as described below: herman et al, 1996, proc.natl.acad.sci.usa 93:9821-9826 or U.S. patent nos. 5,786,146 or 6,265,171, each of which is incorporated herein by reference. Methylation Sensitive PCR (MSP) allows the detection of specific methylated CpG positions within, for example, regulatory regions of a gene. The DNA of interest is treated such that methylated and unmethylated cytosines are differentially modified, for example by bisulfite treatment, in a manner discernable by their hybridization behavior. PCR primers specific for each of the methylated and unmethylated states of DNA are used in PCR amplification. The products of the amplification reaction are then detected, allowing the methylation status of CpG positions within the genomic DNA to be deduced. Other methods for analyzing bisulfite-treated DNA include methylation-sensitive single nucleotide primer extension (Ms-SNuPE) (see, e.g., gonzalgo and Jones,1997 nucleic Acids res.25 2529-2531 or U.S. Pat. No. 6,251,594, each of which is incorporated herein by reference), or using real-time PCR-based methods, such as the fluorescence-based real-time PCR technique recognized in the art, methyLight TM (see, e.g., eads et al, 1999 cancer Res.59, 2302-2306, U.S. Pat. No. 6,331,393 or Heid et al, 1996, genome Res.6, 986-994, each of which is incorporated herein by reference). It will be appreciated that various methylation assay methods can be used to determine the methylation status of a particular genomic CpG position. By usingMethods of bisulfite conversion include, for example, bisulfite sequencing, methylation specific PCR, methylation sensitive single nucleotide primer extension (Ms-SnuPE), MALDI mass spectrometry, and methylation specific oligonucleotide arrays, e.g., as described in U.S. Pat. No. 7,611,869 or international patent application WO2004/051224, each of which is incorporated herein by reference.
In particular embodiments, methylation of genomic CpG positions in a sample can be detected using an array of probes. In such embodiments, a plurality of different probe molecules may be attached to a substrate or otherwise spatially differentiated in an array. Exemplary arrays that can be used in the present invention include, but are not limited to, slide arrays, silicon wafer arrays, liquid arrays, bead-based arrays, and other arrays known in the art or otherwise detailed herein. In preferred embodiments, the methods of the invention can be practiced using array technology that combines a miniaturized array platform, high-level assay multiplexing, and scalable automation for sample processing and data processing. Particularly useful arrays are described in U.S. Pat. nos. 6,355,431;6,429,027;6,890,741;6,913,884 or 7,582,420; or U.S. patent application publication No. 2002/0102578 A1;2005/0053980 A1;2005/0181440 A1; or 2009/0186349 A1, each of which is incorporated herein by reference. Other examples of arrays that may be used include those described in: U.S. Pat. nos. 6,023,540, 6,200,737 or 6,327,410; or PCT publication nos. WO9840726, WO9918434 or WO9850782, each of which is incorporated herein by reference.
The complexity of the arrays used in the present invention may vary depending on the probe composition and the desired use of the array. For example, the complexity of nucleic acids (or CpG sites) detected in an array can be at least 10, 100, 1,000, 10,000, 0.1 million, 1 million, 10 million, 100 million, or more. Alternatively or additionally, the complexity may be selected to be no more than 100 million, 10 million, 1 million, 0.1 million, 10,000, 1,000, 100, or less. Of course, the complexity may be between one of the lower limits and one of the upper limits selected from the above ranges. A similar range of complexity can be achieved using nucleic acid sequencing methods, such as those known in the art, e.g., next generation sequencing or massively parallel sequencing.
Various commercially available bead-based products for detecting methylation can be used, including, for example, methylation EPIC TM BeadChip TM (Illumina, san Diego, calif.) which allows quantitative interrogation of more than 850,000 methylation sites across the human genome at single nucleotide resolution. Also useful are methylated microarrays available from Agilent (Santa C1ara, calif.) and other commercial suppliers of nucleic acid arrays. The array product can be tailored for detection of a wide variety of methylation sites in the human or other genome.
Detection of one or more nucleic acids obtained or generated in the techniques set forth herein may employ sequencing procedures, such as sequencing-by-synthesis (SBS) techniques or other techniques known in the art, such as large-scale sequencing or next generation sequencing. Briefly, SBS can be initiated by contacting a target nucleic acid with one or more labeled nucleotides, a DNA polymerase, and the like. The target nucleic acid can be derived from methylation detection techniques, such as bisulfite conversion or restriction with a methyl-sensitive restriction endonuclease. Those features in which the primer is extended using the target nucleic acid as a template will incorporate labeled nucleotides that can be detected. Optionally, the labeled nucleotides may also include a reversible termination feature that terminates further primer extension once a nucleotide is added to the primer. For example, a nucleotide analog having a reversible terminator moiety can be added to a primer such that subsequent extension cannot occur until a deblocking agent is delivered to remove the moiety. Thus, for embodiments using reversible termination, the deblocking agent can be delivered to the flow cell (either before or after detection occurs). Washing may be performed between each delivery step. The cycle may then be repeated n times to extend the primer n nucleotides, thereby detecting a sequence of length n. Exemplary SBS procedures, fluidic systems, and detection platforms that may be readily adapted for use with the methods of the present disclosure are described, for example, in Bentley et al, nature 456:53-59 (2008), WO 04/018497; WO 91/06678; WO 07/123744; U.S. Pat. nos. 7,057,026;7,329,492;7,211,414;7,315,019 or 7,405,281, or U.S. patent application publication No. 2008/0108082 A1, each of which is incorporated herein by reference.
Other sequencing procedures that detect large numbers of nucleic acids in parallel, such as pyrosequencing, can be used. Pyrosequencing detects the release of inorganic pyrophosphate (PPi) when specific nucleotides are incorporated into a nascent nucleic acid strand (Ronaghi, et al, analytical Biochemistry 242 (1), 84-9 (1996); ronaghi, genome Res.11 (1), 3-11 (2001); ronaghi et al Science 281 (5375), 363 (1998); or U.S. Pat. Nos. 6,210,891, 6,258,568 or 6,274,320, each of which is incorporated herein by reference). Sequencing-by-ligation reactions are also useful, including, for example, those described in: shendere et al Science 309:1728-1732 (2005); or U.S. Pat. nos. 5,599,675 or 5,750,341, each of which is incorporated herein by reference. Some embodiments may include sequencing-by-hybridization procedures, as described, for example, in Bains et al, journal of Theoretical Biology 135 (3), 303-7 (1988); drmanac et al, nature Biotechnology 16, 54-58 (1998); fodor et al, science 251 (4995), 767-773 (1995); or WO 1989/10977, each of which is incorporated herein by reference. Techniques employing Fluorescence Resonance Energy Transfer (FRET) and/or zero mode waveguiding may be used, such as those described in: leven et al Science 299, 682-686 (2003); lundquist et al opt.33, 1026-1028 (2008); or Korlach et al proc.natl.acad.sci.usa 105, 1176-1181 (2008), the disclosures of which are incorporated herein by reference. Also useful are sequencing techniques that employ detection of protons released upon incorporation of nucleotides into the extension product, such as those commercially available from Ion Torrent (Guilford, CT, life Technologies, inc.) or described in: U.S. patent application publication No. 2009/0026082 A1;2009/0127589 A1;2010/0137143 A1; or 2010/0282617 A1, each of which is incorporated herein by reference.
Particularly useful sequencing platforms that can be employed include those available from IlluminaThose commercially available from Ses (San Diego, calif.), such as MiSeq from nucleic acid sequencer
TM 、NextSeq
TM Or HiSeq
TM Series; 454 sequencing systems commercially available from Roche Life Sciences (Basel, switzerland); ion Torrent sequencing system available from Life Technologies (subsidiary of Thermo Fisher Scientific (Waltham, MA)); or a Nanopore sequencing system commercially available from Oxford Nanopore (Oxford, england). TruSeq
TM DNA methylation kits are available from Illumina corporation and can be used to generate bisulfite sequencing libraries that can be detected on an Illumina sequencer. Useful commercial products for preparing nucleic acid samples for detecting methylation on a sequencing platform from Illumina or other suppliers include, for example, methylation assay sample preparation products available from Thermo Fisher Scientific (Waltham, MA), methods for detecting methylation, and methods for detecting methylation,
Methylation sequencing DNA library kit (Swift Biosciences, ann Arbor, MI), available from New England BioLabs (Beverley, mass.)>
Methylated DNA enrichment kit, pico Methyl-Seq available from Zymoresearch (Irvine, calif.)
TM Library preparation kit, or Methylamp obtainable from EpiGentek (Farmingdale, NY)
TM General methylated DNA preparation kit.
Particular embodiments may include the step of manipulating a nucleic acid sample to enrich for a desired nucleic acid. For example, a sample provided for use in the methods set forth herein may be subjected to targeted selection of a subset of genomic DNA fragments comprising a predetermined set of target CpG sites. Targeting selection can occur before or after treatment of the nucleic acid with bisulfite, methyl-sensitive endonucleases, or other agents used to distinguish methylation sites from non-methylation sites. Useful target selection techniques are listed in example I below.
Particular embodiments of the methods set forth herein will evaluate and/or use coverage determined for each site for which methylation status has been determined or will be determined. In some cases, the coverage data is provided to an individual or system implementing the method. Alternatively, embodiments of the method may include one or more steps for determining coverage at each site.
For embodiments in which methylation status is detected by sequencing techniques, coverage can be considered to describe the average number of sequencing reads that align with or "cover" a particular site (e.g., a CpG site). The next generation sequencing coverage level often determines whether a particular sequence or site can be characterized with some confidence. At higher coverage levels, each site is covered by a greater number of aligned sequence reads, so characterization can be done with higher confidence. Available guidance for determining coverage is provided by: illumina technical Specification "EstimationSequengcover" publication No. 770-2011-022 (12/1/2014), which is incorporated herein by reference. Similar coverage criteria can be applied to other detection techniques in addition to next generation sequencing techniques.
Particular embodiments of the present invention may use a coverage of at least 10x, 30x, 50x, 100x, 1,000x, 5,000x, 10,000x or more at each site. Alternatively or additionally, the coverage can be up to 10,000x, 5,000x, 1,000x, 100x, 50x, 30x, 10x, or less. In view of the number of sites assessed and the amount of DNA used in the method, the coverage can be selected based on the confidence required to determine the methylation pattern.
As the number of sites evaluated increases, the confidence in the site characterization will also increase. This means that lower coverage may be acceptable. In particular embodiments, the number of loci assessed can be at least 10 loci, 100 loci, 500 loci, 1x10 3 Site, 5X10 3 Site, 1X10 4 Single site, 1X10 5 Single site, 1X10 6 Multiple sites or more. Alternatively or additionally, the number of sites evaluated may be at most 1x10 6 Single site, 1X10 5 Site, 1X10 4 Site, 1X10 3 One site, 100 sites or 10 sites.
The amount of DNA used in the methods set forth herein will depend on several factors, such as the sample used and the analytical steps performed on the sample. A typical blood draw will provide 30ng of circulating DNA. However, larger or smaller amounts of DNA may be provided by varying the volume of blood drawn, by using different types of samples (such as those exemplified elsewhere herein), and/or by utilizing sample extraction techniques with higher or lower yields. Thus, the methods of the invention can be practiced using amounts of at least 3ng, 10ng, 30ng, 50ng, 100ng, 500ng or more of DNA. Alternatively or additionally, the amount of DNA may be up to 500ng, 100ng, 50ng, 30ng, 10ng or 3ng.
Furthermore, in some embodiments, the DNA used in the methods for assessing methylation status is a mixture of DNA from a target cell or tissue in a background of DNA from other cells or tissues (e.g., non-tumor DNA). The percentage of DNA from the target tissue or cell may be up to 90%, 50%, 25%, 10%, 1%, 0.1%, 0.01% or less. Alternatively or additionally, the percentage of DNA from the target tissue or cell may be at least 0.01%, 0.1%, 1%, 10%, 25%, 50%, 90% or higher.
The above parameters of DNA amount, coverage, number of sites, and percentage of DNA from a target cell or tissue can be adjusted, for example, within the ranges exemplified above, to accommodate the desired level of confidence in characterizing the methylation state of a nucleic acid in the methods set forth herein.
Particular embodiments of the methods set forth herein include the step of providing methylation states of a plurality of sites in reference genomic DNA from one or more reference individual organisms. Optionally, the method may comprise one or more steps for detecting the methylation state of a plurality of sites in reference genomic DNA from one or more reference individual organisms. In one aspect, the reference genomic DNA can comprise, for example, a baseline sample. Any of the methods listed herein for determining the methylation state of a test DNA can be used to determine the methylation state of a reference DNA.
The reference genomic DNA (such as a baseline sample) used in the methods of the present disclosure may be from one or more organisms of the same species as the test organism. For example, where the test organism is an individual human, the reference genomic DNA may be from a different human individual. In some embodiments, the reference genomic DNA is from the same individual that provided the test genomic DNA material. For example, the test DNA may be from a tissue suspected of having a particular condition, while the reference DNA is from a tissue known not to have the condition. In particular embodiments, the test DNA may be from a tumor sample obtained from an individual, while the reference DNA is from normal tissue obtained from the same individual. The tissues or cell types may be the same, but in fact, one of the tissues or cell types has a pathology that the other tissue or cell type does not have. Alternatively, different tissues or cell types may be obtained from an individual, one of which provides test DNA and the other provides reference DNA. The reference genomic DNA can be obtained from a metagenomic sample (e.g., an environmental or community sample), e.g., for comparison to a test metagenomic sample.
The test DNA may be derived from one or more test organisms at a different time than the reference DNA (such as a baseline sample) is derived from the one or more test organisms. For example, a reference DNA sample may be obtained from an individual at a time before the suspected presence of a disease or condition, and then a test DNA sample may be obtained from the individual at a time after the suspected individual has the disease or condition. In such embodiments, the test DNA and the reference DNA may be obtained from similar tissues, populations, or cell types or from different tissues, populations, or cell types.
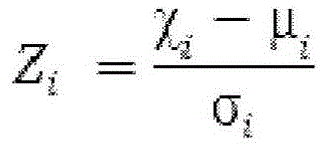
In one embodiment, the method of the present disclosure may include the step of determining a methylation difference between the test genomic DNA and the reference genomic DNA for a plurality of sites (e.g., cpG sites), thereby providing a normalized methylation difference for each site (e.g., cpG site). In particular embodiments, the normalized methylation difference (also referred to as z-score) at a particular site (e.g., a CpG site) is determined according to the following formula
Wherein Z i Representing the normalized methylation difference, χ, at a particular site identified as i i Indicates the methylation level at site i in the test genomic DNA, μ i Denotes the mean methylation level at site i in the reference genome, and σ i Represents the standard deviation of the methylation level at site i in the reference genomic DNA. The use of the formula for determining methylation differences is illustrated in example I below.
The methods of the present disclosure may further comprise the step of weighting the normalized methylation difference for each site (e.g., cpG site) by coverage at each site (e.g., cpG site) to determine an aggregate coverage-weighted normalized methylation difference score. In a specific embodiment, the aggregate coverage-weighted normalized methylation difference score (denoted A) is determined according to the following equation
Wherein w i Denotes coverage at site i, and k denotes the total number of sites. The use of the formula for determining the aggregate coverage weighted normalized methylation difference score is illustrated in example I below.
In particular embodiments, the methods set forth herein can be used to identify changes in the methylation state of a test organism or to monitor such changes over time. Accordingly, the present disclosure provides a method comprising the steps of: (a) Providing a test data set comprising (i) methylation status of a plurality of sites of test genomic DNA from at least one test organism, and (ii) coverage at each site for detecting methylation status; (b) Providing the methylation status of a plurality of sites in reference genomic DNA from one or more reference individual organisms, (c) determining for each site a methylation difference between the test genomic DNA and the reference genomic DNA, thereby providing a normalized methylation difference for each site; (d) Weighting the normalized methylation difference for each site by coverage at each site to determine an aggregate coverage weighted normalized methylation difference score and (e) repeating steps (a) - (d) using a second test dataset comprising (i) the methylation status of a plurality of sites of a second test genomic DNA from an individual test organism, and (ii) coverage at each site for detecting the methylation status, and using the same reference genomic DNA from at least one reference individual, and (f) determining whether the aggregate coverage weighted normalized methylation difference score between the test genomic DNA and the second test genomic DNA has changed.
There is also provided a method comprising the steps of: (a) Providing a sample containing a mixture of genomic DNA from a plurality of different cell types from at least one test organism, thereby providing a test genomic DNA; (b) Detecting the methylation status of a plurality of sites in the test genomic DNA; (c) Determining coverage at each site for detecting methylation status; (d) Providing methylation status of a plurality of sites in reference genomic DNA from at least one reference individual, the at least one test organism and the reference individual optionally being of the same species; (e) Determining for each site a methylation difference between the test genomic DNA and the reference genomic DNA, thereby providing a normalized methylation difference for each site; (f) Weighting the normalized methylation difference for each site by coverage at each site, thereby determining an aggregate coverage-weighted normalized methylation difference score; (g) Repeating steps (a) through (f) using a second test genomic DNA provided from a sample comprising a mixture of genomic DNAs from a plurality of different cell types of at least one test organism and using the same reference genomic DNA from at least one reference individual, and (h) determining whether the aggregate coverage-weighted normalized methylation difference score between the test genomic DNA and the second test genomic DNA changes.
In another embodiment, the method is modified to take into account the changes observed in aggregate DNA methylation within a normal population. The test genomic DNA is not directly compared to the reference genomic DNA; instead, an intermediate step of evaluating a training set of normal genomic DNA samples against a reference genomic DNA (referred to as a baseline sample in this embodiment) to assess the change in aggregate DNA methylation within the normal population is inserted. This involves calculating the "methylation score" of each member of the training set of normal genomic DNA samples, and determining the mean and standard deviation of the methylation scores of the training set population, thereby yielding information about the distribution of methylation scores in the normal population. In some embodiments, the number of normal individual organisms providing genomic DNA of the training set is at least 3, at least 5, at least 10, at least 20, at least 50, or at least 100.
In this embodiment, the method may comprise determining for each CpG site i the average level of methylation (μ) observed for a population of reference genomic DNA i ) And standard deviation (. Sigma.) of methylation level i ) The first step of (1). Here, the reference or baseline genomic DNA takes the form of a population of normal genomic DNA samples. The selected genomic DNA can then be compared to a baseline DNA population to assess changes in methylation levels. More specifically, the methylation level at each site i (e.g., a CpG site) in the selected genomic DNA can be compared to the population average μ of the baseline sample i A comparison is made to generate a methylation score for the selected genomic DNA. In one embodiment, the selected genomic DNA is a set of training controls, and in another embodiment, the selected genomic DNA is a test genomic DNA. The methylation level can be determined by conventional and known methods to the skilled person. For example, the methylation level can be calculated as the fraction of 'C' bases at the target CpG site in 'C' + 'U' bases after bisulfite treatment, or the fraction of 'C' bases at the target CpG site in the total of 'C' + 'T' bases after bisulfite treatment and subsequent nucleic acid amplification, as described herein.
The methylation fraction (MS) of the selected genomic DNA can be calculated by: normalized methylation differences (z-scores) at specific sites i (e.g., cpG sites) are determined with reference to a set of baseline samples, the z-score for each site is converted to a probability of observing such or greater z-scores (e.g., a one-sided p-value), and the p-values are combined into a final aggregate methylation score. Optionally, the p-values are weighted. Each of these steps is described in detail herein and immediately below.
Methylation scores were initially determined against a training set of normal genomic DNA samples. First, normalized methylation differences (z-scores) at specific sites i (e.g., cpG sites) are determined according to the following formula
Wherein Z i Denotes the normalized methylation difference, χ, at a particular site identified as i i Representing the level of methylation at site i in members of the training set of normal genomic DNA,. Mu. i Represents the mean methylation level at site i in the baseline sample, and σ i Represents the standard deviation of the methylation level at site i in the baseline sample.
The Z-score (Z) for each CpG site i is then determined i ) Into the probability that such or a larger z-score is observed. In one aspect, the probability is calculated by converting the z-score to a one-sided p-value (p) i ) To calculate. The probability of a normal distribution, a t distribution, or a binomial distribution can be calculated. Statistical tools for such calculations are well known to the skilled person and readily available.
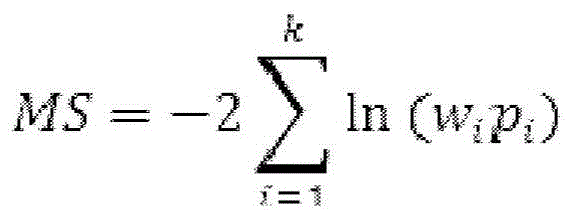
Next, the Methylation Score (MS), i.e., the sum of the probabilities of observed normalized methylation differences, is determined by combining the p-values according to the Fisher's formula:
wherein p is i Denotes the unilateral p-value at site i, and k denotes the total number of sites. Methylation scores were calculated for each member of the training set of normal genomic DNA.
Optionally, each CpG positionThe p-value at a spot can be determined by assigning the p-value at each CpG site i (p) i ) And a weighting factor w i Weighted by multiplication, where w i May correspond to the significance of CpG sites obtained from a priori knowledge, the depth of coverage associated with the sites, or any other ranking method. In this regard, the methylation score (expressed as MS) was determined by combining the weighted p-values according to Fisher's formula:
wherein p is i Denotes the unilateral p-value at site i, k denotes the total number of sites, and w i Indicating the significance of site i, e.g. coverage. The use of this formula for determining the weighted methylation score of a training set of normal genomic DNA samples is shown in example III.
Statistical analysis of the training set methylation scores is then performed. Calculation of average methylation fraction (. Mu.) of training set of Normal genomic DNA MS ) And standard deviation of methylation fraction (. Sigma.) MS ). This characterizes the distribution of methylation scores in the normal population and can be used to determine whether the genomic DNA of the test genomic sample has an abnormal level of methylation.
The Methylation Score (MS) of the test genomic DNA is then determined with reference to a baseline sample (as described above for the members of the training set) and compared to the distribution of methylation scores determined for the training set of normal genomic DNA.
As described above in connection with the training set, the normalized methylation difference (z-score) at a particular site i (e.g., cpG site) is first determined according to the following equation
Wherein Z i Representing the normalized methylation difference, χ, at a particular site identified as i i Indicates the level of methylation at site i, μ in the test genomic DNA i Expressed in the baseline sampleAverage methylation level at site i in the product, and σ i Represents the standard deviation of the methylation level at site i in the baseline sample.
The Z-score (Z) for each CpG site i is then determined i ) Into the probability that such or a larger z-score is observed. In one aspect, the probability is calculated by converting the z-score to a one-sided p-value (p) i ) To calculate. The probability of a normal distribution, a t distribution, or a binomial distribution can be calculated. Methylation Scores (MS) of the test genomic DNA were determined by combining the p-values according to Fisher's formula:
wherein p is i Denotes the unilateral p-value at site i, and k denotes the total number of sites.
Optionally, the p-value at each CpG site can be determined by assigning the p-value at each CpG site i (p) i ) And weight w i Weighted by multiplication, where w i May correspond to the significance of CpG sites obtained from a priori knowledge, the depth of coverage associated with the site, or any other ranking method. Methylation Scores (MS) of the test genomic DNA were determined by combining weighted p-values according to Fisher's formula:
wherein p is i Denotes the unilateral p-value at site i, k denotes the total number of sites, and w i Indicating the significance of site i, e.g. coverage. The use of this formula for determining the weighted methylation fraction of a test genomic DNA sample is shown in examples II and III.
Finally, the mean methylation score (μ) for the training set from normal genomic DNA MS ) And standard deviation of methylation fraction (. Sigma.) MS ) The expressed distribution of methylation scores determined for the training clusters evaluates the methylation score of the test genomic DNA. Determination of test genomic DNA according to the following equationMethylation score vs mean methylation score of training set of normal genomic DNA (. Mu.s) MS ) Number of standard deviations of
Wherein Z MS Denotes normalized methylation score difference, MS denotes methylation score of test sample, μ MS Mean methylation score of the training set representing normal genomic DNA, and σ MS Standard deviation of methylation scores of the training set representing normal genomic DNA. The use of this formula for determining normalized methylation score difference is shown in example III. Z greater than 1.5, greater than 2, greater than 2.5, or greater than 3 standard deviations MS The values indicate that the test genomic DNA has an abnormal DNA methylation level. In preferred embodiments, Z is greater than 3 standard deviations MS The value is used as an indication that the test genomic DNA has an abnormal level of DNA methylation.
In another embodiment, the methods set forth herein may be used to identify changes in the methylation state of a test organism or to monitor such changes over time. Accordingly, the present disclosure provides a method comprising the steps of: (a) Providing methylation status of a plurality of sites (e.g., cpG sites) in baseline genomic DNA from two or more normal individual organisms; (b) Determining the mean methylation level and the standard deviation of the methylation level for baseline genomic DNA for each site (e.g., cpG site); (c) Providing a test data set comprising (i) methylation status of a plurality of sites (e.g., cpG sites) of a first test genomic DNA from at least one test organism, and optionally (ii) coverage at each site (e.g., cpG site) for detecting methylation status; (d) Determining, for each site (e.g., cpG site), a methylation difference between the first test genomic DNA and the baseline genomic DNA, thereby providing a normalized methylation difference for the first test genomic DNA; (e) Converting the normalized methylation difference of the first test genomic DNA at each site (e.g., cpG site) to a probability (e.g., a unilateral p-value) that such or greater normalized methylation difference is observed, and optionally weighting the probability of such an event; (f) determining the methylation fraction of the first test genomic DNA; (g) Repeating steps (c) to (f) using a second test genomic DNA provided from a sample comprising a mixture of genomic DNAs from a plurality of different cell types of at least one test organism and using the same baseline genomic DNA; and (h) determining whether there is a change in methylation fraction between the first test genomic DNA and the second test genomic DNA.
An alternative method of monitoring changes in DNA methylation over time comprises the steps of: (a) Providing methylation status of a plurality of sites (e.g., cpG sites) in baseline genomic DNA from two or more normal individual organisms; (b) Determining the mean methylation level and standard deviation of methylation level of the baseline genomic DNA for each site (e.g., cpG site); (c) Providing a mixture of genomic DNA from a test organism suspected of having a condition (e.g., cancer) associated with abnormal DNA methylation levels, wherein the mixture comprises genomic DNA from a plurality of different cell types of the test organism, thereby providing a first test genomic DNA; (d) Detecting the methylation status of a plurality of sites (e.g., cpG sites) in the first test genomic DNA, and optionally determining coverage at each site (e.g., cpG site) used to detect the methylation status; (e) Determining, for each site (e.g., cpG site), a methylation difference between the first test genomic DNA and the baseline genomic DNA, thereby providing a normalized methylation difference for the first test genomic DNA; (f) Converting the normalized methylation difference of the first test genomic DNA at each site (e.g., cpG site) to a probability (e.g., a one-sided p-value) that such or greater normalized methylation difference is observed, and optionally weighting the probability of such an event; (g) determining the methylation fraction of the first test genomic DNA; (h) Repeating steps (c) to (g) using a second test genomic DNA provided from a sample comprising a mixture of genomic DNAs from a plurality of different cell types from at least one test organism and using the same baseline genomic DNA; and (i) determining whether there is a change in methylation fraction between the first test genomic DNA and the second test genomic DNA.
The first and second test genomic DNA samples (or test data sets) compared in the methods set forth herein may be derived from the same type of cell, population, tissue, or fluid, but at different time points. Thus, the methods set forth herein may be used to identify or monitor changes that occur over time. In some embodiments, the different points in time may occur before, during, and/or after a particular treatment. For example, in the case of monitoring or predicting cancer, samples may be obtained from an individual before and after initiating treatment (such as surgery, chemotherapy, or radiotherapy). In addition, multiple samples may be obtained at different time points during the course of treatment. For example, samples can be obtained and evaluated at a point in time throughout the surgery (e.g., to assess whether the surrounding has cleared cancerous tissue) or at a different point in time throughout the course of chemotherapy or radiotherapy. Different samples may be obtained from an individual and tested after treatment, for example to test for relapse and remission.
In another example, intestinal metagenomic samples can be obtained before and after treatment (e.g., for digestive disorders). The methylation status of the samples can be evaluated and compared to identify changes in the intestinal bacterial flora due to the treatment. The changes can in turn be used to monitor treatment and determine the prognosis of the treated individual.
Any of the various sample types listed herein or known in the art that contain tumor DNA may be used in methods for identifying or monitoring changes in the methylation state of an individual. The observed changes may provide a basis for diagnosis, prognosis, or screening of individuals with a particular condition, such as cancer.
The methods set forth herein may also be used to screen or test for candidate treatments, for example, in experimental cell cultures, tissues, or organisms. Thus, the methods set forth herein can be used to identify or monitor changes over time in cell cultures, tissues or organisms tested in a clinical or laboratory setting. In some embodiments, the different points in time may occur before, during, and/or after a particular candidate treatment. For example, samples may be obtained from a test organism before and after initiation of a candidate treatment (such as surgery, chemotherapy, or radiation therapy). In addition, multiple samples may be obtained at different time points during the course of a candidate treatment. For example, samples can be obtained and evaluated at a point in time throughout the surgery (e.g., to assess whether the surrounding has cleared cancerous tissue) or at a different point in time throughout the course of a candidate chemotherapy or radiotherapy. Different samples may be obtained from the test organism and tested after the candidate treatment, for example to assess relapse and remission. Control organisms that have not been subjected to a candidate treatment and/or do not have a particular condition may also be tested using similar methods. Comparison of results between a sample subjected to a candidate treatment and a control can be used to determine the efficacy and/or safety of a particular candidate treatment
Any of the various sample types listed herein or known in the art that contain tumor DNA can be used in methods for identifying or screening candidate treatments. The changes, whether or not compared to a particular control, can be used to assess the efficacy and/or safety of a particular candidate treatment.
In particular embodiments, the present disclosure provides a method for detecting a condition, such as cancer. The method may comprise the steps of: (a) Providing a mixture of genomic DNA from an individual suspected of having the condition (e.g., cancer), wherein the mixture comprises genomic DNA from a plurality of different cell types of the individual, thereby providing test genomic DNA; (b) Detecting the methylation status of a plurality of sites (e.g., cpG sites) in the test genomic DNA; (c) Determining coverage at each site (e.g., cpG site) used to detect methylation status; (d) Providing methylation status of a plurality of sites (e.g., cpG sites) in reference genomic DNA from at least one reference individual known to have the condition (e.g., cancer) or known not to have the condition (e.g., cancer); (e) Determining, for each site (e.g., cpG site), a methylation difference between the test genomic DNA and the reference genomic DNA, thereby providing a normalized methylation difference for each site (e.g., cpG site); (f) Weighting the normalized methylation difference for each site (e.g., cpG site) by coverage at each site (e.g., cpG site) to determine an aggregate coverage-weighted normalized methylation difference score; and (g) determining whether the individual has or does not have the condition (e.g., cancer) based on the aggregated coverage-weighted normalized methylation difference scores. In some embodiments, the sample is blood, and the DNA may, for example, comprise cell-free DNA from blood.
A method for identifying changes in a pathology such as cancer is also provided. The method may comprise the steps of: (a) Providing a mixture of genomic DNA from an individual suspected of having the condition (e.g., cancer), wherein the mixture comprises genomic DNA from a plurality of different cell types of the individual, thereby providing a test genomic DNA; (b) Detecting the methylation status of a plurality of sites (e.g., cpG sites) in the test genomic DNA; (c) Determining coverage at each site (e.g., cpG site) used to detect methylation status; (d) Providing methylation status of a plurality of sites (e.g., cpG sites) in reference genomic DNA from at least one reference individual known to have the condition (e.g., cancer) or known not to have the condition (e.g., cancer); (e) Determining, for each site (e.g., cpG site), a methylation difference between the test genomic DNA and the reference genomic DNA, thereby providing a normalized methylation difference for each site (e.g., cpG site); (f) Weighting the normalized methylation difference for each site (e.g., cpG site) by coverage at each site (e.g., cpG site) to determine an aggregate coverage-weighted normalized methylation difference score; and (g) repeating steps (a) through (f) using a second mixture of genomic DNA from an individual suspected of having the condition (e.g., cancer) and using the same reference genomic DNA from at least one reference individual, and (h) determining whether the aggregate coverage-weighted normalized methylation difference score of a second test genomic DNA changes as compared to the test genomic DNA, thereby determining whether the condition (e.g., cancer) has or has not changed based on the aggregate coverage-weighted normalized methylation difference score.
In particular embodiments, the present disclosure provides a method for detecting a condition, such as cancer. The method may comprise the steps of: (a) Providing methylation status of a plurality of sites (e.g., cpG sites) in baseline genomic DNA from at least one normal individual organism; (b) Determining the mean methylation level and the standard deviation of the methylation level for baseline genomic DNA for each site (e.g., cpG site); (c) Providing a training set of normal genomic DNA samples from two or more normal individual organisms comprising (i) the methylation status of a plurality of sites (e.g., cpG sites) in the training set of normal genomic DNA samples, and optionally (iI) coverage at each site (e.g., cpG site) for detecting the methylation status; (d) Determining, for each site (e.g., cpG site), a methylation difference between each normal genomic DNA sample of the training set and the baseline genomic DNA, thereby providing a normalized methylation difference for each normal genomic DNA sample of the training set at each site (e.g., cpG site); (e) Converting the normalized methylation difference for each normal genomic DNA sample of the training set at each site (e.g., cpG site) to a probability that such or a greater normalized methylation difference is observed, and optionally weighting the probability of such an event; (f) Determining a methylation score for each normal genomic DNA sample of the training set to obtain a training set methylation score; (g) Calculating the average methylation score and standard deviation of the methylation scores of the training set; (h) Providing a mixture of genomic DNA from a test organism suspected of having the condition (e.g., cancer), wherein the mixture comprises genomic DNA from a plurality of different cell types of the test organism, thereby providing a test genomic DNA; (i) Detecting the methylation status of a plurality of sites (e.g., cpG sites) in the test genomic DNA, and optionally determining coverage at each site (e.g., cpG site) used to detect the methylation status; (j) Determining a methylation difference between the test genomic DNA and the baseline genomic DNA for each site (e.g., cpG site), thereby providing a normalized methylation difference for the test genomic DNA; (k) Converting the normalized methylation difference of the test genomic DNA at each site (e.g., cpG site) to a probability (e.g., a one-sided p-value) that such or greater normalized methylation difference is observed, and optionally weighting the probability of such an event; (l) determining the methylation fraction of the test genomic DNA; and (m) comparing the methylation score of the test genomic DNA to the average methylation score in the training set of normal genomic DNA and the standard deviation of the methylation scores to determine the number of standard deviations of the distribution of the methylation scores of the test genomic DNA and the methylation scores in the training set of normal genomic DNA. In the event that the number of standard deviations exceeds a predetermined threshold (e.g., 1.5, 2.0, 2.5, 3.0, 3.5, 4.0, 4.5, 5.0, etc.), the test sample is deemed to have an abnormal level of DNA methylation.
Optionally, the sites from the test genomic DNA are derived from a plurality of different cell types from the individual test organism, and alternatively, the cell type from which each site (e.g., cpG site) is derived is unknown. In another optional embodiment, the individual test organism and one or more of the baseline individual organisms, the training individual organisms, or a combination thereof are of the same species. In some embodiments, the mixture of genomic DNA from an individual suspected of having the condition is blood, and the DNA may, for example, comprise cell-free DNA (cfDNA) or circulating tumor DNA (ctDNA) from blood.
Also provided herein is a method for identifying changes over time in a condition, such as cancer. The method may comprise the steps of: (a) Providing methylation status of a plurality of sites (e.g., cpG sites) in baseline genomic DNA from at least one normal individual organism; (b) Determining the mean methylation level and the standard deviation of the methylation level for baseline genomic DNA for each site (e.g., cpG site); (c) Providing a first mixture of genomic DNA from a test organism suspected of having the condition (e.g., cancer), wherein the first mixture comprises genomic DNA from a plurality of different cell types of the test organism, thereby providing a first test genomic DNA; (d) Detecting the methylation status of a plurality of sites (e.g., cpG sites) in the first test genomic DNA, and optionally determining coverage at each site (e.g., cpG site) used to detect the methylation status; (e) Determining, for each site (e.g., cpG site), a methylation difference between the first test genomic DNA and the baseline genomic DNA, thereby providing a normalized methylation difference for the first test genomic DNA; (f) Converting the normalized methylation difference of the first test genomic DNA at each site (e.g., cpG site) to a probability (e.g., a unilateral p-value) that such or greater normalized methylation difference is observed, and optionally weighting the probability of such an event; (g) determining the methylation fraction of the first test genomic DNA; (h) Repeating steps (c) through (g) using a second mixture of genomic DNA from a test organism suspected of having the condition (e.g., cancer), wherein the second mixture comprises a second test genomic DNA, and (i) determining whether the methylation score of the second test genomic DNA changes as compared to the first test genomic DNA, thereby determining whether the condition (e.g., cancer) has changed or not based on the change in the methylation score.
Methylation states determined using the methods set forth herein can be used for Molecular classification and cancer prediction using guidelines for gene expression and development of other genomic data (see, e.g., golub et al (1999) Molecular classification of cancer: class discovery and class prediction by gene expression monitoring, science,286, 531-537.). Other classification systems that may be used include those that molecularly classify in breast cancer for the development of relevant global changes in Methylation patterns (see, e.g., huang et al (1999) Methylation profiling of CpG sites in human breast cancer cells. Hum Mol Genet,8, 459-470) or those that develop for relevant Methylation patterns of tumor suppressor genes (e.g., p16, a cyclin-dependent kinase inhibitor) in certain human cancer types (see, e.g., herman et al (1995) activation of the CDKN2/p16/MTS1 gene is derived from expressed with polypeptide DNA strategies Res,55, 4525-4530; otteron et al (1995) cDNA profiling 2 gene profiling in cancer cells, 55, 4525-4530; otteron et al (1995) gene profiling of cancer gene binding DNA, n2 gene binding protein, and 5, 1216-12). The above references are incorporated herein by reference.
In some applications of the methylation analysis methods set forth herein, models can be developed to predict disease type without prior pathological diagnosis. Thus, in some embodiments, the methods set forth herein are used to determine methylation patterns of staged tumor samples relative to matched normal tissue from the same patient. The defined differences in methylation patterns between tumor and normal tissue can be used to model the prognosis, diagnosis or monitoring of cancer. For example, a methylation pattern determined for a test sample can be compared to methylation patterns from known normal and/or from known tumors, and a diagnosis can be made based on the degree of similarity of the test sample to one or both of these references.
In addition, the methods set forth herein may facilitate the identification, classification, and prognostic evaluation of tumors. This information can in turn be used to identify a subset of tumors with relevant characteristics. Such classification can be used to identify the etiology and predict clinical behavior of various cancer types.
In a particular embodiment of the method of the invention, cancer is predicted, detected, identified, classified or monitored from cell-free DNA of a cancer patient. For example, determining methylation patterns from plasma samples can be used to screen for cancer. When the methylation pattern of a plasma sample is abnormal compared to a healthy reference, the occurrence of cancer may be suspected. Further confirmation and assessment of cancer type or tissue origin of the cancer can then be performed by determining plasma profiles of methylation at different genomic loci or detecting tumor-associated copy number aberrations, chromosomal translocations, and single nucleotide variants by plasma genomic analysis. Alternatively, radiation and imaging surveys (e.g., computed tomography, magnetic resonance imaging, positron emission tomography) or endoscopy (e.g., upper gastrointestinal endoscopy or colonoscopy) can be used to further investigate individuals suspected of having cancer based on plasma methylation level analysis.
In one aspect of the invention, provided herein is a method for using methylation levels to identify or classify a particular cancer type in a test organism, preferably a mammalian organism, more preferably a human. In this regard, the methylation levels of test genomic DNA are evaluated for a subset of preselected methylation sites (referred to herein as "hypermethylation" sites) associated with known cancer types, and then ranked from low to high. The cancer type corresponding to the highest mean methylation level is considered to be associated with the test genomic DNA, i.e. the cancer type is considered to be present in the test organism.
As a starting point, the method may comprise identifying a particular cancer that may be used as a type of cancer in an identification or classification algorithm according to this aspect of the invention. The cancer type is a cancer that can be used as a member of a particular cancer group to determine whether a test organism has a particular cancer type, e.g., breast invasive carcinoma, colon adenocarcinoma, lung adenocarcinoma, and the like.
Determining whether a cancer can be used as a type of cancer in the methods of the invention includes obtaining genomic DNA sequence data from a clinical sample. Genomic DNA sequence data useful herein can be readily obtained from known databases characterizing genomic and epigenomic changes (such as changes in methylation status) in different cancer types. The greater the number of clinical samples of cancer in the database, the more likely the cancer may be used as a cancer type. A cancer type suitable for the methods of the invention can be defined using genomic DNA sequence data from at least 10, at least 15, at least 20, at least 25, at least 30, at least 40, at least 50, at least 75, or at least 100 clinical samples of a particular cancer.
Once a suitable group of cancer types is defined, a list of so-called "hypermethylation" sites specific for each cancer type is combined. In some embodiments, available methylation sites that can be evaluated for methylation status include selected CpG sites of the pan-cancer group listed in table I (methylation sites listed from genome construction 37) and/or listed in table II (methylation sites listed from genome construction 37). In other embodiments, available methylation that can be assessed for methylation status, among othersSites include those present in cancer genomic maps (see, e.g., cancer genomic map research network et al, nature Genetics 45. All cited documents are incorporated herein by reference in their entirety. All or a subset of the sites listed herein or in the references listed herein may be used in the identification or classification methods listed herein. E.g. at least 100, 1x10 3 1x10 of 4 1x10 of 5 1x10 of 6 One or more methylation sites can be used as a starting point. In some embodiments, the entire methylation set (i.e., the full set of methylation sites in the genome of the test organism) can be used to select hypermethylation sites suitable for the methods of the invention.
Table I: pan-cancer group
Table II: CRC groups
The choice of the hypermethylation site according to the method of the invention is defined below. For each clinical sample of a particular cancer type in a database (e.g., a cancer genomic map), the methylation level is determined for each methylation site i from an initial set of sites as described in the preceding paragraph. For example, the methylation status at each CpG site listed in tables I and II is determined for each clinical sample from a set of colon adenocarcinoma samples in a cancer genomic map, and the average methylation level at each site I is calculated as described elsewhere in the application. In some embodiments, the methylation level can be determined as the fraction of 'C' bases out of the total bases of 'C' + 'U' at the target CpG site i after bisulfite treatment. In other embodiments, the methylation level can be determined as the fraction of 'C' bases in the total 'C' + 'T' bases at site i after bisulfite treatment and subsequent nucleic acid amplification. The average methylation level at each site is then evaluated to determine whether one or more thresholds are met. In some embodiments, the threshold selects those sites with the highest ranked average methylation values for a particular cancer type. For example, the threshold may be those sites that have an average methylation level of the top 50%, 40%, 30%, 20%, 10%, 5%, 4%, 3%, 2%, or 1% across all sites i tested for a particular cancer type (e.g., colon adenocarcinoma). Alternatively, the threshold may be those sites having an average methylation level on a percentage scale greater than or equal to 50, 60, 70, 80, 90, 95, 96, 97, 98, or 99. In other embodiments, the threshold may be based on the absolute value of the average methylation level. For example, the threshold may be those sites having an average methylation level greater than 99%, greater than 98%, greater than 97%, greater than 96%, greater than 95%, greater than 90%, greater than 80%, greater than 70%, greater than 60%, greater than 50%, greater than 40%, greater than 30%, greater than 20%, greater than 10%, greater than 9%, greater than 8%, greater than 7%, greater than 6%, greater than 5%, greater than 4%, greater than 3%, or greater than 2%. The relative and absolute thresholds can be applied individually or in combination to the average methylation level at each site i. As an illustration of the application of the combination threshold, a subset of sites that are in the first 3% of all sites tested by mean methylation level and also have an absolute mean methylation level greater than 6% can be selected. The result of this selection process is a plurality of lists of specific hypermethylated sites (e.g., cpG sites) that are considered to be most informative for this cancer type, one for each cancer type. These lists are then used to identify or classify test genomic DNA samples from the test organism, i.e., to determine whether the test organism has a particular cancer type.
In the next step of the method of the invention, a test genomic DNA sample from a test organism is analyzed by determining the methylation level at each site i on the list of hypermethylated sites for each cancer type, and then averaging these methylation levels for each site to calculate the average methylation level across the methylation sites for each cancer type. For example, for each hypermethylated site i of a colon adenocarcinoma, the methylation level at each site i on the list of hypermethylated sites of the colon adenocarcinoma is determined, and then these methylation levels are averaged to provide a single average methylation level. This process is repeated using the previously defined list of hypermethylation sites for each cancer type and the results of the set of average methylation levels, each corresponding to a different cancer type. The average methylation levels were then ranked from low to high. The cancer type corresponding to the highest mean methylation level is considered to be associated with the test genomic DNA, i.e. the cancer type is considered to be present in the test organism. It will be appreciated that normalized methylation differences or z-scores may also be used in the methods of the invention in place of methylation levels at each CpG site.
For cancer screening or detection, determining the methylation level of a plasma (or other biological) sample can be used in conjunction with other formats for cancer screening or detection, such as prostate-specific antigen measurement (e.g., for prostate cancer), carcinoembryonic antigen (e.g., for colorectal cancer, gastric cancer, pancreatic cancer, lung cancer, breast cancer, medullary thyroid cancer), alpha-fetoprotein (e.g., for liver cancer or germ cell tumors), and CA19-9 (e.g., for pancreatic cancer).
Available methylation sites that can be detected in the methods set forth herein, for example, to assess cancer, include those present in a cancer genomic map (see, e.g., cancer genomic map research network et al, nature Genetics 45 1113-1120 (2013)) or selected CpG sites of the pan-cancer group set forth in table I (the methylation sites listed are from genome construction 37). Further examples of CpG sites which can be used, for example, for identifying or monitoring colorectal cancer are described in Worthley et al Oncogene 29, 1653-1662 (2010) or listed in Table II (methylation sites listed are from genome construct 37). Useful methylation markers for detecting ovarian cancer are listed in U.S. patent application publication No. 2008/0166728A1, which is incorporated herein by reference. All or a subset of the markers listed herein and/or listed in the above references may be used in the methods listed herein. For example, at least 10, 25, 50, 100, 1x10 may be used 3 1x10 of 4 One or more markers.
Analysis of methylation, prognostic or diagnostic information derived from the methods set forth herein can be conveniently performed using a variety of computer-implemented algorithms and programs. Thus, certain embodiments employ processes involving data stored in or communicated through one or more computer systems or other processing systems. Embodiments of the present invention also relate to apparatuses for performing these operations. This apparatus may be specially constructed for the required purposes, or it may be a general-purpose computer (or a group of computers) selectively activated or reconfigured by a computer program and/or data structure stored in the computer. In some embodiments, a set of processors perform some or all of the enumerated analysis operations in concert (e.g., via network or cloud computing) and/or in parallel. The processor or set of processors for performing the methods described herein may be of various types, including microcontrollers and microprocessors such as programmable devices (e.g., CPLDs and FPGAs) and non-programmable devices such as gate arrays ASICs or general purpose microprocessors.
In addition, certain embodiments relate to tangible and/or non-transitory computer-readable media or computer program products that include program instructions and/or data (including data structures) for performing various computer-implemented operations. Examples of computer readable media include, but are not limited to, semiconductor memory devices, magnetic media such as disk drives, magnetic tape, optical media such as CDs, magneto-optical media, and hardware devices specifically configured to store and execute program instructions, such as read only memory devices (ROM) and Random Access Memory (RAM). The computer readable medium may be directly transmitted to the terminalEnd-user control, or the medium may be indirectly controlled by the end-user. Examples of directly controlled media include media located at a user facility and/or media that is not shared with other entities. Examples of indirectly controlled media include media that is indirectly accessible to users through an external network and/or through a service that provides shared resources (such as the "cloud"). A particularly useful cloud is one that is configured and managed to store and analyze genetic data, such as BasePate TM Service (Illumina corporation, san Diego CA) or cloud services described in: U.S. patent application publication nos. 2013/0275486 A1 or 2014/0214579 A1 (each of which is incorporated herein by reference). Examples of program instructions include both machine code, such as produced by a compiler, and files containing higher level code that may be executed by the computer using an interpreter.
In some embodiments, the data or information employed in the disclosed methods and apparatus is provided in an electronic format. Such data or information can include reads derived from nucleic acid samples, reference sequences, methylation status, patterns of methylation status, methylation difference scores, normalized methylation difference scores, aggregated coverage-weighted normalized methylation difference scores, methylation scores, coverage-weighted methylation scores, counseling recommendations, diagnostics, and the like. As used herein, data or other information provided in an electronic format may be used to be stored on the machines and transferred between the machines. Conventionally, data in electronic format is provided digitally and may be stored in bits and/or bytes in various data structures, lists, databases, etc. The data may be embodied electronically, optically, and the like.
In addition, certain embodiments relate to tangible and/or non-transitory computer-readable media or computer program products that include instructions and/or data (including data structures) for performing various computer-implemented operations. One or more steps of the methods set forth herein may be implemented by a computer program residing in a tangible and/or non-transitory computer readable medium or using computer hardware.
For example, a computer program product is provided and includes a non-transitory computer readable medium on which program instructions are provided for the steps of: (a) Obtaining a test data set comprising (i) methylation status of a plurality of sites of test genomic DNA from at least one test organism, and (ii) coverage at each site for detecting methylation status; (b) Obtaining the methylation status of a plurality of sites in a reference genomic DNA from one or more reference individual organisms, (c) determining for each site a methylation difference between the test genomic DNA and the reference genomic DNA, thereby providing a normalized methylation difference for each site; and (d) weighting the normalized methylation difference for each site by coverage at each site to determine an aggregate coverage weighted normalized methylation difference score, and (e) storing or transmitting the aggregate coverage weighted normalized methylation difference score.
The methods disclosed herein may also be performed using a computer processing system adapted or configured to perform a method for identifying a methylation state or other characteristic of a nucleic acid. Accordingly, in one embodiment, the invention provides a computer processing system adapted or configured to perform a method as described herein. In one embodiment, the apparatus comprises a nucleic acid detection device, such as a nucleic acid sequencing device, adapted or configured to determine the methylation state and/or other characteristics of a nucleic acid. The device may further comprise means for processing a sample from the test organism and/or the reference organism. Such components are described elsewhere herein.
Nucleic acid sequences, methylation status, methylation patterns, or other data can be input into a computer or stored directly or indirectly on a computer readable medium. In one embodiment, the computer system is directly connected to a nucleic acid detection device (e.g., a sequencing device) that determines the methylation state of nucleic acids from a sample. Data or other information from such tools is provided through an interface in a computer system. Alternatively, the methylation data processed by the system is provided from a data storage source, such as a database or other repository. Once available to the processing apparatus, the memory device or mass storage device at least temporarily collects or stores the methylation state or other characteristic of the nucleic acid. Additionally, as described herein, the memory device can store methylation differences, normalized methylation differences, aggregated weighted normalized methylation differences, methylation scores, or overlay weighted methylation scores. The memory may also store various routines and/or programs for analyzing or presenting such information. Such programs/routines may include programs for performing statistical analysis, and the like.
In one example, a user provides a sample to a nucleic acid sequencing device. The data is collected and/or analyzed by a sequencing device connected to a computer. Software on a computer implements data acquisition and/or analysis. The data may be stored, displayed (e.g., via a monitor or other similar device), and/or transmitted to another location. The computer may be connected to the internet for transmitting data to a handheld device and/or cloud environment utilized by a remote user (e.g., a physician, scientist, or analyst). It is to be understood that the data may be stored and/or analyzed prior to transmission. In some embodiments, raw data is collected and sent to a remote user or device that analyzes and/or stores the data. The transmission may occur over the internet, but may also occur over a satellite or other connection. Alternatively, the data may be stored on a computer readable medium, and the medium may be transmitted to the end user (e.g., by mail). The remote users may be in the same or different geographic locations including, but not limited to, buildings, cities, states, countries, or continents.
In some embodiments, the method further comprises collecting data about a plurality of polynucleotide sequences (e.g., reads, tags, and/or methylation states) and transmitting the data to a computer or other computing system. For example, the computer may be connected to laboratory equipment, such as a sample collection device, a nucleotide amplification device, a nucleotide sequencing device, or a hybridization device. The computer may then collect the applicable data collected by the laboratory device. The data may be stored on the computer at any step, for example, at the time of real-time acquisition, before transmission, during or in conjunction with transmission, or after transmission. The data may be stored on a computer readable medium that may be extracted from the computer. The collected or stored data may be transmitted from the computer to a remote location, for example, over a local network or a wide area network such as the internet. As described below, various operations may be performed on the transmitted data at the remote location.
The types of electronically formatted data that may be stored, transmitted, analyzed, and/or manipulated in the systems, devices, and methods disclosed herein are the following: reads obtained by sequencing nucleic acids in a test sample, methylation status of a site in a nucleic acid, one or more reference genomes or sequences, methylation difference scores, normalized methylation difference scores, aggregated coverage weighted normalized methylation difference scores, methylation scores, or coverage weighted methylation scores, as described herein.
These various types of data may be obtained, stored, transmitted, analyzed, and/or manipulated at one or more locations using different devices. The processing options span a wide range. Towards one end of the range, all or many of this information is stored and used at the location where the test sample is processed (e.g., a physician's office or other clinical environment). Towards the other extreme, a sample is obtained at one location, processed (e.g., prepared, detected, or sequenced) at a second location, data is analyzed (e.g., sequencing reads are aligned) and methylation characteristics are determined at a third location (or locations), and a diagnosis, recommendation, and/or plan is made at a fourth location (or location where the sample was obtained).
In various embodiments, methylation data is generated on a nucleic acid detection device (e.g., a sequencing device) and then transmitted to a remote site where they are processed to determine methylation characteristics. At this remote location, for example, a methylation difference score, a normalized methylation difference score, an aggregated coverage-weighted normalized methylation difference score, a methylation score, or a coverage-weighted methylation score can be determined. Also at remote locations, methylation signatures can be evaluated to make prognostic or diagnostic determinations.
Any one or more of these operations may be automated, as described elsewhere herein. Typically, detection of nucleic acids and analysis of sequence data is performed computationally. Other operations may be performed manually or automatically.
Examples of locations where sample collection may be performed include a health practitioner's office, clinic, the patient's home (where the sample collection tool or kit is provided), and a mobile health care cart. Examples of locations where sample processing prior to methylation detection can be performed include a health practitioner's office, clinic, patient's home (where a sample processing device or kit is provided), mobile health care vehicle, and facilities of a nucleic acid analysis provider. Examples of locations where nucleic acid detection (e.g., sequencing) may be performed include a health practitioner's office, a clinic, a patient's home (where a sample sequencing device and/or kit is provided), a mobile health care cart, and a nucleic acid analysis provider's facility. The location at which nucleic acid detection occurs can be equipped with a dedicated network connection for transmitting sequence data (typically reads) in electronic format. Such a connection may be wired or wireless and may be configured to send data to a site where the data may be processed and/or aggregated prior to transmission to the processing site. The data aggregator may be maintained by a health organization, such as a Health Maintenance Organization (HMO).
The analysis operation may be performed at any of the foregoing locations or alternatively at another location dedicated to the computation and/or service of analyzing nucleic acid sequence data. Such locations include, for example, clusters such as general server clusters, facilities for genetic analysis services, and the like. In some embodiments, the computing device used to perform the analysis is leased or rented. The computing resources may be part of an internet-accessible set of processors, such as processing resources colloquially referred to as a "cloud," examples of which are provided elsewhere herein. In some cases, the computations are performed by parallel or massively parallel processor groups, which may or may not be related to each other. The processing may be implemented using distributed processing, such as cluster computing, grid computing, and the like. In such embodiments, the cluster or grid of computing resources collectively form a super virtual computer comprised of a plurality of processors or computers that act together to perform the analysis and/or derivation described herein. These techniques, as well as more conventional supercomputers, can be used to process sequence data as described herein. Each in the form of parallel computations dependent on a processor or computer. In the case of grid computing, the processors (often the entire computer) are connected by a conventional network protocol, such as Ethernet, over a network (private, public, or the Internet). In contrast, a supercomputer has many processors connected by a local high-speed computer bus.
In certain embodiments, the diagnosis (e.g., determining that the patient has a particular type of cancer) is generated at the same location as the analysis procedure. In other embodiments, it is performed at a different location. In some embodiments, reporting the diagnosis is done at the location of the sampling, although this is not necessarily the case. Examples of locations where diagnosis and/or planning can be generated or reported include healthcare practitioner's offices, clinics, computer accessible internet sites, and handheld devices with wired or wireless network connections, such as cell phones, tablets, smart phones, and the like. Examples of locations where consultation is performed include healthcare practitioner's offices, clinics, computer accessible internet sites, handheld devices, and the like.
In some embodiments, the sample collection, sample processing, and methylation state detection operations are performed at a first location, and the analysis and derivation operations are performed at a second location. However, in some cases, sample collection is collected at one location (e.g., a health practitioner's office or clinic) and sample processing and methylation state detection are performed at a different location, which is optionally the same location where analysis and derivation occurs.
In various embodiments, a series of the above-listed operations may be triggered by a user or entity initiating sample collection, sample processing, and/or methylation state detection. After one or more of these operations begin to be performed, the other operations may naturally occur in succession. For example, nucleic acid sequencing operations may cause reads to be automatically collected and sent to a processing device, which then performs methylation state analysis and determination of a methylation difference score, a normalized methylation difference score, an aggregated coverage-weighted normalized methylation difference score, a methylation score, or a coverage-weighted methylation score, often automatically and possibly without additional user intervention. In some implementations, the results of this processing operation are then automatically delivered to a system component or entity that processes or reports information to a health professional and/or patient, possibly reformatted as a diagnosis. As explained, such information may also be automatically processed to generate treatment, testing, and/or monitoring plans, possibly along with advisory information. Thus, initiating an early stage operation may trigger an end-to-end process in which a health professional, patient, or other interested party is provided with a diagnosis, plan, consultation, and/or other information that may be used to take action on the medical condition. This can be achieved even if parts of the overall system are physically separated and may be remote from the location of, for example, the sample collection and nucleic acid detection apparatus.
In some embodiments, the results of the methods set forth herein will be communicated to the individual by a genetic consultant, physician (e.g., attending physician, obstetrician, etc.), or other qualified medical professional. In some embodiments, the consultation is provided face-to-face, however, it is recognized that in some instances, the consultation may be provided through remote access (e.g., through text, cell phone application, tablet application, the internet, etc.).
In some embodiments, the disclosure of the results to a medical professional or to a patient may be delivered by a computer system. For example, a "smart advice" system may be provided that provides genetic counseling information in response to test results, instructions from a medical care provider, and/or in response to queries (e.g., from a patient). In certain embodiments, the information will be specific to clinical information provided by a physician, a health care system, and/or a patient. In some embodiments, the information may be provided in an iterative manner. Thus, for example, the patient may provide a "what if" query, and the system may return information such as diagnostic options, risk factors, time, and meaning of various results.
In particular embodiments, the results or other information generated in the methods set forth herein may be provided in a transitory manner (e.g., presented on a computer screen). In certain embodiments, the information may be provided in a non-transitory manner. Thus, for example, information can be printed out (e.g., as a list of options and/or suggestions optionally associated with time, etc.) and/or stored on a computer-readable medium (e.g., a magnetic medium such as a local hard drive, a server, etc., an optical medium, flash memory, etc.).
It will be appreciated that typically such systems will be configured to provide sufficient security such that patient privacy is maintained, for example, according to prevailing standards in the medical field.
The foregoing discussion of genetic counseling is intended to be illustrative and non-limiting. Genetic counseling is a well established branch of medical science and is within the scope and skill of practitioners with respect to the incorporation of counseling components into the methods described herein. Furthermore, it is recognized that as the field progresses, the nature of genetic counseling and associated information and recommendations may change.
The invention also relates to the following embodiments:
1. a method for differentiating abnormal methylation levels of DNA of a sample containing DNA from a plurality of different cell types, comprising:
(a) Providing a sample comprising a mixture of genomic DNA from a plurality of different cell types of an individual test organism, thereby providing a test genomic DNA;
(b) Detecting the methylation status of a plurality of CpG sites in the test genomic DNA;
(c) Determining coverage at each of said CpG sites for detecting said methylation status;
(d) Providing the methylation status of the plurality of CpG sites in reference genomic DNA from at least one reference individual;
(e) Determining for each of said CpG sites a methylation difference between said test genomic DNA and said reference genomic DNA, thereby providing a normalized methylation difference for each CpG site; and
(f) Weighting said normalized methylation difference for each CpG site by said coverage at each said CpG site, thereby determining an aggregate coverage-weighted normalized methylation difference score.
2. The method of embodiment 1, wherein the sample comprises circulating tumor DNA and circulating non-tumor DNA.
3. The method of embodiment 1, wherein the sample comprises cell-free DNA from blood.
4. The method of any one of embodiments 1 to 3, wherein the individual test organism is a pregnant female and the test genomic DNA comprises genomic DNA derived from somatic cells of the female and genomic DNA derived from somatic cells of a prenatal offspring of the female.
5. The method of any one of embodiments 1 to 4, wherein said providing said sample in step (a) comprises targeted selection of a subset of genomic DNA fragments comprising a predetermined set of target CpG sites.
6. The method of embodiment 5, wherein said providing said sample in step (a) further comprises bisulfite treating said subset of genomic DNA fragments.
7. The method of any one of embodiments 1 to 6, wherein said detecting in step (b) comprises a sequencing technique that continuously distinguishes nucleotides in said test genomic DNA.
8. The method of any one of embodiments 1 to 7, comprising:
(I) Repeating steps (a) to (f) using a second test genomic DNA provided from a sample comprising a mixture of genomic DNAs from a plurality of different cell types of the individual test organism and using the same reference genomic DNA from the at least one reference individual, and
(II) determining whether the aggregate coverage weighted normalized methylation difference score between the test genomic DNA and the second test genomic DNA changes.
9. The method of any one of embodiments 1 to 8, wherein said normalized methylation difference at a specific CpG site is determined according to
Wherein Z i Denotes the normalized methylation difference, χ, of a particular CpG site identified as i i Represents the methylation level at CPG site i in the test genomic DNA,. Mu. i Represents the mean methylation level at CpG site i in the reference genome, and σ i Represents the standard deviation of the methylation level at CpG site i in the reference genomic DNA.
10. The method of embodiment 9, wherein the aggregate coverage-weighted normalized methylation difference score (denoted as A) is determined according to
Wherein w i Indicates coverage at CpG site i, and k indicates the total number of CpG sites.
11. A method for differentiating abnormal methylation levels of DNA from a first cell type, the method comprising:
(a) Providing an average methylation level and a standard deviation of methylation levels for each CpG site in baseline genomic DNA from two or more normal individual baseline organisms for a plurality of CpG sites in the baseline genomic DNA;
(b) Providing a test data set comprising:
(ii) the methylation status of the plurality of CpG sites of a first test genomic DNA from an individual test organism, wherein the CpG sites are derived from a sample,
(c) Determining for each of said CpG sites a methylation difference between said first test genomic DNA and said baseline genomic DNA, thereby providing a normalized methylation difference for each CpG site; and
(d) Converting the normalized methylation difference for each CpG site to a one-sided p-value;
(e) Determining an aggregate methylation score for the combination of single sided p-values for each CpG site of the first test genomic DNA.
12. The method of embodiment 11, wherein (a) comprises providing the methylation status of the plurality of CpG sites in the baseline genomic DNA from the two or more normal individual organisms, and determining the mean methylation level and the standard deviation of the methylation level of the baseline genomic DNA for each of the CpG sites.
13. The method of embodiment 11, further comprising
Providing a second test data set comprising:
(ii) the methylation status of the plurality of CpG sites of a second test genomic DNA from the individual test organism, and wherein the CpG sites are derived from a sample;
determining a methylation difference between the second test genomic DNA and the baseline genomic DNA for each of the CpG sites, thereby providing a normalized methylation difference for each CpG site of the second test genomic DNA; and
converting the normalized methylation difference for each CpG site of the second test genomic DNA to a single sided p-value;
determining an aggregate methylation score for the combination of single sided p-values for each CpG site of the second test genomic DNA; and
comparing the aggregate methylation fraction of the first test genomic DNA and the second test genomic DNA to determine whether there is a change in the aggregate methylation fraction between the first and the second test genomic DNA.
14. The method of embodiment 11, further comprising:
(f) Providing a training data set comprising:
(ii) the methylation status of the plurality of CpG sites of training genomic DNA from two or more normal individual training organisms, wherein the CpG sites are derived from a plurality of different cell types from the normal individual training organisms;
(g) Determining for each of said CpG sites a methylation difference between each training genomic DNA from said normal individual training organism and said baseline genomic DNA, thereby providing a normalized methylation difference for each CpG site of each training genomic DNA;
(h) Converting the normalized methylation difference for each CpG site to a one-sided p-value; and
(i) Determining the aggregate methylation score for the combination of single sided p-values for each CpG site for each training genomic DNA;
(j) Calculating an average aggregate methylation fraction of the training genomic DNA and a standard deviation of the aggregate methylation fraction using the aggregate methylation fraction of each training genomic DNA to obtain a distribution of the aggregate methylation fraction of the training genomic DNA; and
(k) Evaluating an aggregate methylation score of the first test genomic DNA against the distribution of the aggregate methylation scores of the training genomic DNAs.
15. The method of any one of embodiments 11 to 14, wherein said normalized methylation difference at a specific CpG site is determined according to the following formula:
wherein Z i Denotes the normalized methylation difference, χ, of a particular CpG site identified as i i Represents the methylation level at CPG site i in the first test genomic DNA or the training genomic DNA,. Mu. i Represents the mean methylation level at CpG site i in the baseline genome, and σ i Represents the standard deviation of the methylation level at CpG site i in the baseline genomic DNA.
16. The method of any one of embodiments 14-15, wherein said assessing of step (k) determines a normalized methylation score difference according to the formula:
wherein Z MS Represents the normalized methylation score difference, MS represents the aggregate methylation score of the first test genomic DNA, μ MS Mean methylation score of the training set representing normal genomic DNA, and σ MS Standard deviation of the aggregate methylation fraction of the training set representing normal genomic DNA.
17. The method of any one of embodiments 11-16, wherein the aggregate Methylation Score (MS) is determined according to the formula:
wherein p is i Indicates the unilateral p-value at site i, and k indicates the total number of CpG sites.
18. The method of any one of embodiments 11-17, wherein the aggregate Methylation Score (MS) is determined according to the formula:
wherein p is i Denotes the unilateral p-value at site i, k denotes the total number of CpG sites, and w i Indicates coverage of the site i.
19. The method of any one of embodiments 11-18, wherein the sample from the individual test organism comprises circulating tumor DNA and circulating non-tumor DNA.
20. The method of any one of embodiments 11-19, wherein the sample comprises cell-free DNA from blood.
21. The method of any one of embodiments 11 to 20, wherein the individual test organism is a pregnant female and the first test genomic DNA comprises genomic DNA derived from somatic cells of the female and genomic DNA derived from somatic cells of a prenatal offspring of the female.
22. The method of any one of embodiments 11 to 21, wherein said providing said sample in step (b) comprises targeted selection of a subset of genomic DNA fragments comprising a predetermined set of target CpG sites.
23. The method of any one of embodiments 11-22, wherein said providing said sample in step (b) further comprises treating said subset of genomic DNA fragments with bisulfite.
24. The method of any one of embodiments 11 to 23, wherein said providing said sample in step (b) comprises detecting the methylation status of said CpG sites.
25. The method of any one of embodiments 11 to 24, wherein said detecting the methylation status of said CpG sites comprises a sequencing technique that sequentially recognizes nucleotides in said first test genomic DNA.
26. The method of embodiment 16, wherein if Z is Ms Is greater than 3, the first test genomic DNA is classified as having an abnormal level of methylation.
27. A method for identifying a cancer present in an individual organism, comprising:
(a) Providing a data set comprising:
methylation status of a plurality of CpG sites i of genomic DNA from a clinical sample known to comprise a particular cancer;
(b) Identifying hypermethylated CpG sites i specific for a cancer type comprising:
(i) Determining an average methylation level for each CpG site i in the genomic DNA of the clinical sample known to comprise the particular cancer,
(ii) Determining which CpG sites i meet a first threshold, a second threshold, or a combination thereof,
wherein determining the first threshold comprises (1) determining the absolute value of the mean methylation level for each CpG site i; (2) Ranking said average methylation level of each CpG site i from low to high, and (3) selecting those CpG sites i having an average methylation level on a percentage scale that is greater than or equal to a first preselected value, and
wherein determining the second threshold comprises (1) determining an absolute value of the mean methylation level for each CpG site i; and (2) selecting those CpG sites i having an average level of methylation greater than a second preselected value;
(iii) Compiling a list of hypermethylation sites specific to the cancer type,
(c) Repeating (a) and (b) for each specific cancer to generate a plurality of lists of hypermethylation sites specific to additional cancer types;
(d) Providing a test data set comprising:
(ii) the methylation level of each hypermethylated site of test genomic DNA from an individual test organism, wherein the hypermethylated site is from one of the list of hypermethylated sites specific to the cancer type identified in steps (b) and (c);
(e) Averaging the methylation levels of each of the hypermethylated sites to produce a single average methylation level of the test genomic DNA for the cancer type identified in steps (b) and (c);
(f) Repeating step (e) for each cancer type to generate an average methylation level for each cancer type;
(g) Ranking the average methylation levels for each cancer type from low to high, wherein the cancer type corresponding to the highest average methylation level is the cancer present in the individual test organism.
28. The method of embodiment 27, wherein said first preselected value is a percentage rating of greater than or equal to 97.
29. The method of any one of embodiments 27-28, wherein the second preselected value is greater than 6%.
30. The method of any one of embodiments 27-29, wherein the test genomic DNA from the individual test organism comprises circulating tumor DNA and circulating non-tumor DNA.
31. The method of any one of embodiments 27-30, wherein the test genomic DNA comprises cell-free DNA from blood.
32. The method of any one of embodiments 27 to 31, wherein in step (d) said providing said test data set comprises targeted selection of a subset of genomic DNA fragments comprising a set of predetermined target CpG sites.
33. The method of any one of embodiments 27 to 32, wherein said providing said test data set in step (d) further comprises treating said subset of genomic DNA fragments with bisulfite.
34. The method of any one of embodiments 27 to 33, wherein said providing said test data set in step (d) comprises detecting the methylation status of said CpG sites.
35. The method of any one of embodiments 27 to 34, wherein said detecting the methylation status of said CpG sites comprises a sequencing technique that sequentially recognizes nucleotides in said first test genomic DNA.
Example I
Analytical sensitivity of ctDNA methylation-based cancer detection using aggregated normalized coverage weighted methylation differences
This example describes a highly sensitive assay for detecting methylation in circulating tumor DNA (ctDNA). Aberrant DNA methylation is a common phenomenon in cancer and is probably one of the earliest changes in tumorigenesis. The assays described in this example can be used for cancer screening.
The general approach applied here involves targeted methylation sequencing of the affected multiple CpG sites in cancer.
Technical challenges addressed by the methods include providing ultra-high sensitivity and specificity beneficial for screening applications, providing protocols for targeted methylation sequencing from low-input ctDNA, and providing bioinformatics algorithms for analysis of methylation levels across a large number of targeted sites.
Targeted capture probe design
Two targeted methylation groups were developed. The pan-cancer group targets 9,921 CpG sites affected in 20 major cancer types as selected from the cancer genomic profile database. The CpG sites included in the pan-cancer group are listed in table I. The CRC group targets 1,162 CpG sites affected in colorectal cancer. The CpG sites included in the CRC group are listed in table II. The CpG sites listed in tables I and II refer to the genome construction 37.
The probe sequence for CpG sites was selected from Infinium HM450 array (Illumina, san Diego, calif.). The design principle of the probe is shown in fig. 1. Two probes were used for targets with more than 4 CpG sites, including fully methylated probes (with G nucleotides complementary to the C position of each CpG site) and fully unmethylated probes (with a nucleotides complementary to the U expected to result from bisulfite conversion of each C position of a CpG site), as shown in fig. 1. In contrast, only one probe is used for targets with 4 or fewer CpG sites (the probe includes a degenerate nucleotide R complementary to U or C at the C position of each CpG site).
Isolation and extraction of cfDNA from plasma
Plasma samples were obtained from human blood draws. Cell-free DNA (cfDNA) was extracted using QIAamp circulating nucleic acid kit (Qiagen, hilden, germany). Targeted ctDNA methylation sequencing was performed according to the workflow shown in fig. 2 and as listed below in the context of assessing titration and detection sensitivity.
Titration and detection sensitivity
NA12878 genomic DNA was purchased from Coriell Institute (Coriell Institute, camden, NJ) and LS1034 genomic DNA was purchased from ATCC (ATCC, manassas, VA). Genomic DNA was fragmented using Covaris M200 (Covaris, woburn, MA) and size-selected to be 130-250bp using bluenippin (Sage Science, beverly, MA) to mimic the size distribution of cfDNA. Using Quant-iT
TM The dsDNA assay kit (ThermoFisher Scientific, grand Island, N.Y.) performs DNA quantification. Adding 10%, 1% or 0.1% LS1034 DNA to the NA12878 DNA background to prepare a DNA mixture. 30ng was used in library preparation100% NA12878 or 100% LS1034 DNA. Three replicate libraries were generated for each titration level. A set of six replicates of NA12878 was used as baseline reference genome.
Extracted cfDNA or genomic DNA subjected to shearing and size selection was bisulfite-treated and purified using EZ DNA Methylation-Lightning kit (Zymo Research, irvine, CA).
Use of
Methylation sequencing DNA library kit (Swift Biosciences, ann Arbor, MI) prepared bisulfite sequencing libraries.
Targeted capture of bisulfite sequencing libraries was performed using probes complementary to fragments having CpG sites listed in table I or table II. Capture probes were synthesized and biotinylated at Illumina. Illumina TruSight was used according to the manufacturer's instructions TM The rapid capture kit performs target capture except that a custom capture probe is used and hybridization and washing steps are performed at 48C.
The products of the capture step were sequenced using 2x100 cycle runs on an Illumina HiSeq2500 sequencer according to the manufacturer's instructions, with four samples in fast run mode.
Bioinformatics analysis
The FASTQ sequence is demultiplexed followed by computer demethylation, whereby all cs on read 1 are converted to T and all gs on read 2 are converted to a. These "demethylated" FASTQ sequences were then aligned to the index (index) comprising the "demethylated" hg19 genome using BWA (v 0.7.10-r 789). BWA alignment is described in Li and Durbin (2010) Fast and acid long-read alignment with Burrows-Wheeler transform. 20080505], which is incorporated herein by reference. After alignment, the "demethylated" FASTQ sequence is replaced with the original FASTQ sequence. Methylation levels were calculated as the fraction of 'C' bases at the target CpG site in 'C' + 'T' total bases.
After calculating the methylation levels at each sample and each CpG site of the replicates, the aggregate coverage weighted normalized methylation difference z-scores were calculated as follows.
(1) The methylation level at each CpG site was normalized by subtracting the mean methylation level from the baseline and dividing by the standard deviation of the methylation level in the baseline to obtain the z-score for each site. Specifically, the normalized methylation difference at each CpG site was determined according to the following formula:
wherein Z i Representing the normalized methylation difference, χ, at a particular site identified as i i Indicates the level of methylation at site i, μ in the test genomic DNA i Denotes the mean methylation level at site i in the reference genome, and σ i Represents the standard deviation of the methylation level at site i in the reference genomic DNA.
(2) The z-score at each CpG site is multiplied by the coverage observed at the CpG site and then the z-scores weighted for coverage across all CpG sites are summed and then divided by the sum of the squares of coverage at each CpG site. More specifically, the aggregate coverage-weighted methylation difference z-score (example a of aggregate coverage-weighted normalized methylation difference scores) is determined according to the following equation:
wherein w i Denotes coverage at site i, and k denotes the total number of sites.
As a result, the
Titration experiments were performed using colorectal cancer cell line LS1034 and normal cell line NA12878 to demonstrate assay sensitivity. That is, targeted ctDNA methylation sequencing was performed in triplicate for LS1034 titrated into NA12878 at 0.1%, 1%, and 10%, along with pure LS1034 and pure NA12878, using both pan-cancer and CRC groups. Aggregate coverage weighted methylation difference z-scores were calculated for each of the 15 sample replicates using the normal NA12878 sample as baseline (fig. 3). The results indicate that the variation within the sample is much less than the variation between titration levels. Specifically, a significant difference in titration of LS1034 at 0.1% into NA12878 from NA12878 samples indicates that the assay and the attendant aggregate coverage weighted methylation difference z-fraction can achieve a 0.1% detection limit.
The results obtained using the method of this example provide a highly sensitive assessment of the cumulative effect of multiple affected CpG sites throughout the genome. By providing a method for detecting methylation patterns, the method of this example can provide improved Cancer diagnosis over methods that rely on the detection of somatic mutations, as evidenced by improved consistency of the alternation between CRC tissues and corresponding Plasma when assessing DNA methylation markers as compared to somatic mutations (see, e.g., danese et al, "comparative of Genetic and Epigenetic identities of Primary Tumors and Matched Plasma Samples in Patients with Coloractive Cancer" ploS ONE10 (5): e0126417.Doi:10.1371/journal. Plant. 0126417 (20156417), which is incorporated herein by reference). The method described in this example also provides for identification of the tissue origin of the cancer. In particular, tissue-specific methylation markers have been shown to be useful in tracking the tissue origin of particular ctDNA sequences (see, e.g., sun et al, "plasmid DNA mapping by gene-side methylation sequence for biochemical prediction, cancer, and translation analysis" Proc. Natl. Acad. Sci, USA 112 (40) E5503-E5512 (2015), which is incorporated herein by reference).
Example II
Analytical sensitivity of ctDNA methylation-based cancer detection using coverage-weighted methylation scores
This example describes an alternative highly sensitive assay for detecting methylation in circulating tumor DNA (ctDNA). The assays described in this example can also be used for cancer screening, monitoring disease progression, or assessing a patient's response to a therapeutic treatment.
Targeted capture probe design
For this study, the two targeted methylation groups described in example I were pooled together. The pan-cancer group targets 9,921 CpG sites affected in 20 major cancer types as selected from the cancer genomic profile database. The CpG sites included in the pan-cancer group are listed in table I. The CRC group targets 1,162 CpG sites affected in colorectal cancer. The CpG sites included in the CRC group are listed in table II. The CpG sites of the combinations listed in tables I and II refer to the genome construction 37.
The probe sequence for CpG sites was selected from Infinium HM450 array (Illumina, san Diego, calif.). The design principle of the probe is shown in fig. 1. Two probes were used for targets with more than 4 CpG sites, including fully methylated probes (with G nucleotides complementary to the C position of each CpG site) and fully unmethylated probes (with a nucleotides complementary to the U expected to result from bisulfite conversion of each C position of a CpG site), as shown in fig. 1. In contrast, only one probe is used for targets with 4 or fewer CpG sites (the probe includes a degenerate nucleotide R complementary to U or C at the C position of each CpG site).
Isolation and extraction of cfDNA from plasma
Plasma samples were obtained from human blood draws. Cell-free DNA (ctDNA) was extracted using the QIAamp circulating nucleic acid kit (Qiagen, hilden, germany). Targeted ctDNA methylation sequencing was performed according to the workflow shown in fig. 2 and as listed below in the context of assessing titration and detection sensitivity.
Titration and detection sensitivity
As described above, NA12878 genomic DNA was purchased from Coriell Institute (Coriell Institute, camden, NJ), and LS1034 genomic DNA was purchased from ATCC (ATCC, manassas, va.). Genomic DNA was fragmented using Covaris M200 (Covaris, woburn, MA) and its size was selected to be 130-250bp using B1uePippin (Sage Science, beverly, MA) to mimic the size distribution of cfDNA. Using Quant-iT
TM The dsDNA assay kit (ThermoFisher Scientific, grand Island, N.Y.) performs DNA quantification. Adding 10%, 1% or 0.1% LS1034 DNA to the NA12878 DNA background to prepare a DNA mixture. 30ng of each mixture used in the library preparation, 100%NA12878 or 100%. Three replicate libraries were generated for each titration level. A set of six replicates of NA12878 was used as baseline reference genome.
Extracted cfDNA or genomic DNA subjected to splicing and size selection was subjected to bisulfite treatment and purified using EZ DNA Methylation-Lightning kit (Zymo Research, irvine, calif.).
Use of
Methylation sequencing DNA library kit (Swift Biosciences, ann Arbor, MI) prepared bisulfite sequencing libraries.
Targeted capture of bisulfite sequencing libraries was performed using probes complementary to fragments having CpG sites listed in table I or table II. Capture probes were synthesized and biotinylated at Illumina. Tlluminia TruSight was used according to the manufacturer's instructions TM The rapid capture kit performs target capture except that a custom capture probe is used and hybridization and washing steps are performed at 48C.
The products of the capture step were sequenced on an Illumina HiSeq2500 sequencer using 2x100 cycle runs, four samples in fast run mode, according to the manufacturer's instructions.
Bioinformatics analysis
The FASTQ sequence is demultiplexed followed by computer demethylation, whereby all cs on read 1 are converted to T and all gs on read 2 are converted to a. These "demethylated" FASTQ sequences were then aligned to the index (index) comprising the "demethylated" hg19 genome using BWA (v 0.7.10-r 789). BWA alignment is described in Li and Durbin (2010) Fast and acid long-read alignment with Burrows-Wheeler transform. 20080505], which is incorporated herein by reference. After alignment, the "demethylated" FASTQ sequence is replaced with the original FASTQ sequence. Methylation levels were calculated as the fraction of 'C' bases at the target CpG sites in 'C' + 'T' total bases.
After calculating the methylation level at each sample and each CpG site of the replicates, coverage weighted methylation scores were calculated as follows.
(1) The methylation level at each CpG site was normalized by subtracting the mean methylation level from the baseline and dividing by the standard deviation of the methylation level in the baseline to obtain the z-score for each site. Specifically, the normalized methylation difference at each CpG site was determined according to the following formula:
wherein Z i Denotes the normalized methylation difference, χ, at a particular site identified as i i Indicates the level of methylation at site i, μ in the test genomic DNA i Denotes the mean methylation level at site i in the reference genome, and σ i Represents the standard deviation of the methylation level at site i in the reference genomic DNA.
(2) By converting z-scores into one-sided p-values (p) i ) To determine the Z-score (Z) of each CpG site i i ) Into the probability of such or greater z-scores being observed. The probability of being a normal distribution is calculated, although other distributions (e.g., t-distributions or binomial distributions) may be used.
(3) By assigning a p-value (p) at each CpG site i i ) Multiplication by the coverage observed at CpG sites (w) i ) To weight the p-value at each CpG site and determine the coverage weighted Methylation Score (MS) by combining the weighted p-values according to the following formula:
wherein p is i Denotes the unilateral p-value at site i, k denotes the total number of sites, and w i Indicates coverage at site i.
Results
Titration experiments were performed using colorectal cancer cell line LS1034 and normal cell line NA12878 to demonstrate assay sensitivity. That is, targeted ctDNA methylation sequencing was performed in triplicate with LS1034 and pure NA12878 titrated at 0.1%, 1%, and 10% into NA12878 using a pan-cancer and CRC panel in combination. Coverage weighted methylation scores were calculated for each of the 15 sample replicates using the normal NA12878 sample as baseline (fig. 4). The results indicate that the variation within the sample is much less than the variation between titration levels. Specifically, a significant difference in titration of LS1034 at 0.1% into NA12878 from NA12878 samples indicates that the assay and the attendant coverage-weighted methylation fraction can achieve a 0.1% detection limit (see inset of fig. 4).
Similar to the results in example I, the results obtained using the method of this example provide a highly sensitive assessment of the cumulative effect of multiple affected CpG sites throughout the genome. By providing an alternative method for detecting methylation patterns, the method of this embodiment can provide a more sensitive diagnosis of cancer than methods that rely on the detection of somatic mutations.
Example III
Clinical performance of ctDNA methylation-based cancer detection using normalized coverage weighted methylation score differences
This example uses normalized coverage weighted methylation score differences to assess the clinical sensitivity and specificity of methylation-based cancer detection in circulating tumor DNA (ctDNA). As noted above, the assays described in this example can be used for cancer screening, monitoring disease progression, or assessing a patient's response to a therapeutic treatment.
Targeted capture probe design
For this study, the two targeted methylation groups described in example I were pooled together. Pan-cancer group targets 9,921 CpG sites affected in 20 major cancer types as selected from cancer genomic profile database. The CpG sites included in the pan-cancer group are listed in table I. The CRC group targets 1,162 CpG sites affected in colorectal cancer. The CpG sites included in the CRC group are listed in table II. The CpG sites of the combinations listed in tables I and II refer to the genome construction 37.
The probe sequence for CpG sites was selected from Infinium HM450 array (Illumina, san Diego, calif.). The design principle of the probe is shown in fig. 1. Two probes were used for targets with more than 4 CpG sites, including fully methylated probes (having G nucleotides complementary to the C position of each CpG site) and fully unmethylated probes (having a nucleotides complementary to the U expected to result from bisulfite conversion of each C position of a CpG site), as shown in figure 1. In contrast, only one probe is used for targets with 4 or fewer CpG sites (the probe includes a degenerate nucleotide R complementary to U or C at the C position of each CpG site).
Blood sample collection and processing
Cancer patients are recruited at the MD anderson cancer center (Houston, texas). A total of 70 blood samples taken from 63 advanced stage cancer patients of the three cancer types (n =30 for colorectal cancer (CRC), n =14 for breast cancer (BRCA) and n =19 for lung cancer) were used in this study. Four CRC patients had blood samples taken at multiple time points. Three breast cancer samples and one colorectal cancer sample did not meet sample quality control and were therefore excluded from the analysis, resulting in a final set of 66 cancer samples (36 CRC,11 BRCA, and 19 lungs), representing 59 different patients (29crc, 11 BRCA, and 19 lungs). A total of 65 normal blood samples were collected from healthy subjects for use as baseline methylation controls (20), training controls (20), and test controls (25), as described herein.
Plasma was separated by centrifugation at 1600G for 10 min. The supernatant was transferred to a 15mL centrifuge tube and centrifuged at 3000G for 10 minutes at room temperature. The supernatant was transferred to a fresh 15mL centrifuge tube and stored in a freezer (-80 ℃) and shipped on dry ice. Plasma samples from healthy donors were obtained from bioreduction ivt (Westbury, new York). All samples were de-identified.
Isolation and extraction of cfDNA from plasma
Cell-free DNA (cfDNA) was extracted using QIAamp circulating nucleic acid kit (Qiagen, hilden, germany). Targeted ctDNA methylation sequencing was performed according to the workflow shown in fig. 2 and as listed below in the context of assessing titration and detection sensitivity.
Targeted bisulfite sequencing library preparation and sequencing
The cfDNA was bisulfite treated and purified using EZ DNA Methylation-Lightning kit (Zymo Research, irvine, california).
Use of
Methylation sequencing DNA library kits (Swift Biosciences, ann Arbor, michigan) perform whole genome amplification of bisulfite converted DNA.
Targeted capture of bisulfite sequencing libraries was performed using probes complementary to fragments having CpG sites listed in table I or table II. The capture probe was synthesized at Illumina (San Diego, california) and biotinylated. Illumina TruSight was used according to the manufacturer's instructions TM The rapid capture kit performs target capture. Hybridization and wash conditions were modified to produce the best capture efficiency.
The products of the capture step were sequenced using 2x100 cycle runs on an Illumina Hiseq2500 sequencer according to the manufacturer's instructions, with four samples in fast run mode.
Bioinformatics analysis
The FASTQ sequence is demultiplexed followed by computer demethylation, whereby all cs on read 1 are converted to T and all gs on read 2 are converted to a. These "demethylated" FASTQ sequences were then aligned to the index (index) comprising the "demethylated" hg19 genome using BWA (v 0.7.10-r 789). BWA alignment is described in Li and Durbin (2010) Fast and acid long-read alignment with Burrows-Wheeler transform. 20080505], which is incorporated herein by reference. After alignment, the "demethylated" FASTQ sequence is replaced with the original FASTQ sequence. Methylation levels were calculated as the fraction of 'C' bases at the target CpG site in 'C' + 'T' total bases.
After calculating the methylation level at each sample and at each CpG site of the replicates, coverage weighted methylation scores were calculated as follows.
(1) Methylation scores were initially determined against a training set of 20 normal genomic DNA samples. First, the normalized methylation difference (z-score) at a particular site i (e.g., a CpG site) is determined according to the following formula:
wherein Zi represents the normalized methylation difference for the specific site identified as i, χ i Representing the methylation level at site i in members of the training set of normal genomic DNA,. Mu. i Represents the mean methylation level at site i in the baseline sample, and σ i Represents the standard deviation of the methylation level at site i in the baseline sample.
(2) By converting z-scores into one-sided p-values (p) i ) To determine the Z-score (Z) of each CpG site i i ) Into the probability that such or a larger z-score is observed. The probability of being a normal distribution is calculated, although other distributions (e.g., t-distributions or binomial distributions) may be used.
(3) By assigning a p-value (p) at each CpG site i i ) Multiplication by the coverage observed at CpG sites (w) i ) To weight the p-value at each CpG site and determine the coverage weighted Methylation Score (MS) by combining the weighted p-values according to the following formula:
wherein p is i Denotes the unilateral p-value at site i, k denotes the total number of sites, and w i Indicating the significance of site i, e.g. coverage.
(4) Statistical analysis of the training set methylation scores is then performed. Calculation of average methylation fraction (. Mu.) of training set of Normal genomic DNA MS ) And standard deviation of methylation fraction (. Sigma.) MS ) Thereby characterizing the distribution of methylation scores in the normal population.
(5) Next, methylation scores were determined for 66 cancer genomic DNA samples and 25 test controls. First, the normalized methylation difference (z-score) at each CpG site was determined according to the following formula:
wherein Z i Representing the normalized methylation difference, χ, at a particular site identified as i i Indicates the level of methylation at site i, μ in the test genomic DNA i Denotes the mean methylation level at site i in the reference genome, and σ i Represents the standard deviation of the methylation level at site i in the reference genomic DNA.
(6) By converting the z-score to a one-sided p-value (p) i ) To determine the Z-score (Z) of each CpG site i i ) Into the probability that such or a larger z-score is observed. The probability of being a normal distribution is calculated, although other distributions (e.g., t-distributions or binomial distributions) may be used.
(7) By assigning a p-value (p) at each CpG site i i ) Multiplication by the coverage observed at CpG sites (w) i ) To weight the p-value at each CpG site and determine the coverage weighted Methylation Score (MS) by combining the weighted p-values according to the following formula:
wherein p is i Representing a one-sided p-value at site i,k represents the total number of sites, and w i Indicates coverage at site i.
(8) Finally, the mean methylation score (μ) for the training set from normal genomic DNA MS ) And standard deviation of methylation fraction (. Sigma.) MS ) The distribution of methylation scores determined for the training clusters represented evaluates the methylation score of the test genomic DNA sample. The mean methylation score (μ) of the methylation scores of the test genomic DNA and the training set of normal genomic DNA was determined according to the following formula MS ) Number of standard deviations therebetween:
wherein Z MS Denotes normalized methylation score difference, MS denotes methylation score of test sample, μ MS Mean methylation score of the training set representing normal genomic DNA, and σ MS Standard deviation of methylation scores of the training set representing normal genomic DNA. ZM of greater than 3 standard deviations S The value is used as a threshold for identifying cancer samples.
Results
As noted above, the objective of this experiment was to evaluate the clinical performance of the normalized coverage weighted methylation score difference algorithm, including its clinical sensitivity and specificity. The 66 cancer samples and 25 normal samples were subjected to methylation score analysis as described herein, including determining the z-score for each CpG site listed in tables I and II, converting the z-score to a unilateral p-value based on normal distribution presentation, weighting the p-values by overlay, and summing the individual weighted p-values into a single methylation score using the Fisher formula. The methylation scores obtained are used to differentiate cancer samples from normal samples. Figures 5 and 6 show that the normalized coverage weighted methylation score difference algorithm is able to detect 34 out of 36 CRC samples (94.4% sensitivity), 8 out of 11 BRCA samples (72.7% sensitivity), and 10 out of 19 lung cancer samples (52.6% sensitivity). The algorithm showed 100% specificity, correctly identifying all 25 test control samples as normal.
The results obtained using the method of this example provide a highly sensitive and specific assessment of the cumulative effect of multiple affected CpG sites throughout the genome. By providing an alternative method for detecting methylation patterns, the method of this example can provide a more sensitive and specific diagnosis of cancer than methods that rely on the detection of somatic mutations.
Example IV
Clinical performance of cancer type classification methods based on average methylation levels across a preselected subset of methylation sites
This example evaluates the clinical sensitivity of a method for cancer type classification based on the mean methylation level across a preselected subset of CpG methylation sites referred to herein as "hypermethylation sites". The assays described in this example can be used to identify the source of a tumor in circulating cell-free DNA.
Correlation of methylation profiles between plasma and tissue DNA samples
As an initial query, it was first determined how methylation profiles of circulating tumor DNA (ctDNA) isolated from plasma samples correlated with those of DNA isolated from tumor tissue. A high degree of correlation will increase the confidence in the following view: methylation profiles of cfDNA can be used to classify tumors of origin. To this end, the methylation profiles of the colorectal, breast and lung cancer samples detected in example III were compared to the mean methylation profile of each of the 32 cancer types from TCGA (cancer genomic profile) with a minimum of 30 cancer samples in the database. Methylation profiles essentially as described in examples I-III and consisting of methylation levels at 9,242 CpG sites were determined (filtering out poorly performing methylation sites from the original CpG group to improve accuracy).
Comparisons were performed in a pairwise fashion between each cancer-positive plasma sample from example III and each of the 32 cancer types from TCGA, resulting in a correlation coefficient ranging from 0 to 1. The correlation is plotted as a two-dimensional correlation graph, which is shown in fig. 7. The darker areas of the graph correspond to higher correlation, while the lighter areas of the graph represent lower correlation. The observed correlation between methylation profiles is generally highest for matched tumor types. For example, in plasma-derived breast cancer samples, the correlation is highest for breast cancer tissue (breast invasive carcinoma) and lower in all other tumor tissue types. Similarly, the correlation was highest for colon and rectal tissues (e.g., colon adenocarcinoma, esophageal carcinoma, colon adenocarcinoma, and gastric adenocarcinoma) for the CRC plasma samples. The correlation is less pronounced in lung cancer samples.
Development and testing of cancer type classification
It has been determined that there is a significant correlation between ctDNA and methylation profiles of DNA from tumor tissues, and computer cancer type classification methods continue to be developed and tested.
First, 24 cancer types with more than 100 samples in the TCGA database were identified. For each of these types, a list of "hypermethylated" sites was created, defined as sites with an average methylation level (across the sample) that spans the first 3% of the entire group and is greater than 6% in absolute value.
Given a test sample, its cancer type is determined in a three-step process. First, the methylation level of each "hypermethylated" site on the list was determined as described in examples I-III for each of the 24 cancer types. Next, for each of the 24 cancer types, the average methylation level across the "hypermethylated" sites was calculated. Finally, each of the 24 cancer types was ranked by its average methylation level across the "hypermethylated" site, and the test sample was classified by the cancer type with the highest average methylation level.
The method then proceeds to retest for each of the TCGA tissue samples used to generate the list of "hypermethylated" sites. The accuracy of the method is defined as the ratio of the number of correctly identified cancer samples of a particular type to the total number of samples of that cancer type. The results of this analysis are shown in fig. 8. As can be readily seen from this figure, 22 of the 24 cancer types were identified with an accuracy of over 75%. In fact, in about 90% or more of cases, many of the cancer types are correctly identified. Only two types-esophageal cancer and testicular germ cell tumors-failed to exceed the 75% threshold.
Cancer type classification of plasma samples
52 plasma samples (34 CRC,8 BRCA, and 10 lungs) correctly identified as cancer samples in example III were subjected to cancer type classification analysis as described above. The results of this analysis are shown in fig. 9. The cancer classification algorithm correctly identified 28 of the 34 CRC samples (82%), 7 of the 8 BRCA samples (88%), and 7 of the 10 lung cancer samples (70%). These results demonstrate that the cancer type classification methods described herein can be used with high clinical sensitivity to identify the tissue of origin in ctDNA from plasma samples.
Throughout this application, reference has been made to various publications, patents, or patent applications. The disclosures of these publications in their entireties are hereby incorporated by reference into this application in order to more fully describe the state of the art to which this invention pertains.
The term "comprising" is intended herein to be open-ended, including not only the recited elements, but also any additional elements.
While the invention has been described with reference to the embodiments provided above, it will be understood that various modifications may be made without departing from the invention. Accordingly, the invention is limited only by the claims.