CN112381369A - Water body pollution tracing and risk prediction evaluation method based on online spectrum identification - Google Patents
Water body pollution tracing and risk prediction evaluation method based on online spectrum identification Download PDFInfo
- Publication number
- CN112381369A CN112381369A CN202011203001.8A CN202011203001A CN112381369A CN 112381369 A CN112381369 A CN 112381369A CN 202011203001 A CN202011203001 A CN 202011203001A CN 112381369 A CN112381369 A CN 112381369A
- Authority
- CN
- China
- Prior art keywords
- water quality
- water
- pollution
- online
- time
- Prior art date
- Legal status (The legal status is an assumption and is not a legal conclusion. Google has not performed a legal analysis and makes no representation as to the accuracy of the status listed.)
- Granted
Links
Images


Classifications
-
- G—PHYSICS
- G06—COMPUTING OR CALCULATING; COUNTING
- G06Q—INFORMATION AND COMMUNICATION TECHNOLOGY [ICT] SPECIALLY ADAPTED FOR ADMINISTRATIVE, COMMERCIAL, FINANCIAL, MANAGERIAL OR SUPERVISORY PURPOSES; SYSTEMS OR METHODS SPECIALLY ADAPTED FOR ADMINISTRATIVE, COMMERCIAL, FINANCIAL, MANAGERIAL OR SUPERVISORY PURPOSES, NOT OTHERWISE PROVIDED FOR
- G06Q10/00—Administration; Management
- G06Q10/06—Resources, workflows, human or project management; Enterprise or organisation planning; Enterprise or organisation modelling
- G06Q10/063—Operations research, analysis or management
- G06Q10/0635—Risk analysis of enterprise or organisation activities
-
- G—PHYSICS
- G01—MEASURING; TESTING
- G01N—INVESTIGATING OR ANALYSING MATERIALS BY DETERMINING THEIR CHEMICAL OR PHYSICAL PROPERTIES
- G01N21/00—Investigating or analysing materials by the use of optical means, i.e. using sub-millimetre waves, infrared, visible or ultraviolet light
- G01N21/17—Systems in which incident light is modified in accordance with the properties of the material investigated
- G01N21/25—Colour; Spectral properties, i.e. comparison of effect of material on the light at two or more different wavelengths or wavelength bands
- G01N21/31—Investigating relative effect of material at wavelengths characteristic of specific elements or molecules, e.g. atomic absorption spectrometry
- G01N21/33—Investigating relative effect of material at wavelengths characteristic of specific elements or molecules, e.g. atomic absorption spectrometry using ultraviolet light
-
- G—PHYSICS
- G06—COMPUTING OR CALCULATING; COUNTING
- G06Q—INFORMATION AND COMMUNICATION TECHNOLOGY [ICT] SPECIALLY ADAPTED FOR ADMINISTRATIVE, COMMERCIAL, FINANCIAL, MANAGERIAL OR SUPERVISORY PURPOSES; SYSTEMS OR METHODS SPECIALLY ADAPTED FOR ADMINISTRATIVE, COMMERCIAL, FINANCIAL, MANAGERIAL OR SUPERVISORY PURPOSES, NOT OTHERWISE PROVIDED FOR
- G06Q10/00—Administration; Management
- G06Q10/04—Forecasting or optimisation specially adapted for administrative or management purposes, e.g. linear programming or "cutting stock problem"
-
- G—PHYSICS
- G06—COMPUTING OR CALCULATING; COUNTING
- G06Q—INFORMATION AND COMMUNICATION TECHNOLOGY [ICT] SPECIALLY ADAPTED FOR ADMINISTRATIVE, COMMERCIAL, FINANCIAL, MANAGERIAL OR SUPERVISORY PURPOSES; SYSTEMS OR METHODS SPECIALLY ADAPTED FOR ADMINISTRATIVE, COMMERCIAL, FINANCIAL, MANAGERIAL OR SUPERVISORY PURPOSES, NOT OTHERWISE PROVIDED FOR
- G06Q50/00—Information and communication technology [ICT] specially adapted for implementation of business processes of specific business sectors, e.g. utilities or tourism
- G06Q50/10—Services
- G06Q50/26—Government or public services
-
- Y—GENERAL TAGGING OF NEW TECHNOLOGICAL DEVELOPMENTS; GENERAL TAGGING OF CROSS-SECTIONAL TECHNOLOGIES SPANNING OVER SEVERAL SECTIONS OF THE IPC; TECHNICAL SUBJECTS COVERED BY FORMER USPC CROSS-REFERENCE ART COLLECTIONS [XRACs] AND DIGESTS
- Y02—TECHNOLOGIES OR APPLICATIONS FOR MITIGATION OR ADAPTATION AGAINST CLIMATE CHANGE
- Y02A—TECHNOLOGIES FOR ADAPTATION TO CLIMATE CHANGE
- Y02A20/00—Water conservation; Efficient water supply; Efficient water use
- Y02A20/152—Water filtration
Landscapes
- Business, Economics & Management (AREA)
- Engineering & Computer Science (AREA)
- Human Resources & Organizations (AREA)
- Physics & Mathematics (AREA)
- Strategic Management (AREA)
- Economics (AREA)
- Tourism & Hospitality (AREA)
- General Physics & Mathematics (AREA)
- Marketing (AREA)
- Theoretical Computer Science (AREA)
- General Business, Economics & Management (AREA)
- Entrepreneurship & Innovation (AREA)
- Development Economics (AREA)
- Game Theory and Decision Science (AREA)
- Spectroscopy & Molecular Physics (AREA)
- Quality & Reliability (AREA)
- Operations Research (AREA)
- General Health & Medical Sciences (AREA)
- Educational Administration (AREA)
- Health & Medical Sciences (AREA)
- Primary Health Care (AREA)
- Analytical Chemistry (AREA)
- Immunology (AREA)
- Biochemistry (AREA)
- Pathology (AREA)
- Life Sciences & Earth Sciences (AREA)
- Chemical & Material Sciences (AREA)
- Investigating Or Analysing Materials By Optical Means (AREA)
- Management, Administration, Business Operations System, And Electronic Commerce (AREA)
Abstract
本发明公开了基于在线光谱识别的水体污染溯源和风险预测评估方法,属于地表水污染物监测、溯源及风险评估技术领域,勘察目标水域可能污染物种类及相应来源,构建污染物图谱;测量当地河湖水体水质背景值;利用浸入式UV水质在线分析仪进行水质实时监测并反馈水质数据;构建云计算平台收集水质分析仪反馈的河湖实时水质监测数据并进行水质数据实时比对;根据比对结果,若判定有污染物泄露发生,则采用基于卡尔曼滤波方法的高精度水质溯源模型进行污染物溯源;根据溯源结果可快速进行污染风险评估。本发明构建的系统包含实时在线监测和云计算功能,实现集数据平台化、识别精准化、计算高速化、操作简单化等特征于一体的溯源及风险评估目标。
The invention discloses a water pollution source traceability and risk prediction assessment method based on online spectrum identification, which belongs to the technical field of surface water pollutant monitoring, source traceability and risk assessment. Background value of water quality of rivers and lakes; use immersion UV water quality online analyzer to monitor water quality in real time and feed back water quality data; build a cloud computing platform to collect real-time water quality monitoring data of rivers and lakes fed back by water quality analyzers and perform real-time comparison of water quality data; For the results, if it is determined that there is a pollutant leakage, a high-precision water quality traceability model based on the Kalman filter method is used to trace the source of the pollutant; according to the traceability result, the pollution risk assessment can be quickly performed. The system constructed by the invention includes the functions of real-time online monitoring and cloud computing, and realizes the traceability and risk assessment goals that integrate the characteristics of data platformization, accurate identification, high-speed calculation, and simplified operation.
Description
技术领域technical field
本发明属于地表水污染物监测、溯源及风险评估技术领域,具体涉及基于在线光谱识别的水体污染溯源和风险预测评估方法。The invention belongs to the technical field of surface water pollutant monitoring, traceability and risk assessment, and in particular relates to a water body pollution traceability and risk prediction assessment method based on online spectrum identification.
背景技术Background technique
近年来突发性水污染事件有逐年增加的趋势,突发性水污染事故具有不确定性、危害紧急性,在短时间内迅速影响供水系统,导致停水事件,并经由蔓延、转化、耦合等机理严重影响到城市生态系统,进而引发复杂的社会问题,成为影响饮用水源地安全的首要威胁因素。为了最大程度降低水污染事故带来的恶劣影响,除了加强水质实时监测之外,建立能够在线识别水体污染事件及污染物溯源、风险评预报的系统技术显得非常必要。In recent years, sudden water pollution incidents have been increasing year by year. Sudden water pollution incidents are uncertain and hazard urgent. They rapidly affect the water supply system in a short period of time, leading to water outages. Such mechanisms seriously affect the urban ecosystem, which in turn causes complex social problems and becomes the primary threat factor affecting the safety of drinking water sources. In order to minimize the adverse effects of water pollution accidents, in addition to strengthening real-time monitoring of water quality, it is necessary to establish a system technology that can identify water pollution events, trace pollutants, and risk assessment and forecast online.
现有针对水污染的监测、溯源技术或系统功能单一,仅限于单功能的水质监测或溯源工作,无法实时在线识别水体中污染物超标以及自动溯源、风险评估,欠缺在水污染中较为重要的时效性,同时智能化较为片面,未形成系统化。Existing monitoring and traceability technologies or systems for water pollution have a single function, which is limited to single-function water quality monitoring or traceability work. Time-effectiveness, and at the same time, intelligence is relatively one-sided and not systematic.
发明内容SUMMARY OF THE INVENTION
发明目的:针对水污染问题中及其重要的时效性,本发明的目的在于提供基于在线光谱识别的水体污染溯源和风险预测评估方法。Purpose of the invention: Aiming at the water pollution problem and its important timeliness, the purpose of the present invention is to provide a water pollution source traceability and risk prediction assessment method based on online spectral identification.
技术方案:为实现上述目的,本发明提供如下技术方案:Technical scheme: in order to realize the above-mentioned purpose, the present invention provides the following technical scheme:
基于在线光谱识别的水体污染溯源和风险预测评估方法,包括如下步骤:The water pollution source traceability and risk prediction assessment method based on online spectral identification includes the following steps:
1)调查目标水域可能出现的污染物质及来源;1) Investigate possible pollutants and sources in the target waters;
2)将浸入式UV水质在线分析仪在需要监测的目标水域中放置一段时间,获取当地河湖水体水质的背景值;2) Place the immersion UV water quality online analyzer in the target water area to be monitored for a period of time to obtain the background value of the water quality of the local river and lake;
3)构建云计算平台;3) Build a cloud computing platform;
4)对受潜在污染源影响的水域布置浸入式UV水质在线分析仪进行实时在线监测,UV水质在线分析仪内含独立通讯设备,将水质数据实时上传至云计算平台应用服务器进行数据保存及处理;4) Real-time online monitoring of the immersion UV water quality online analyzer is arranged in the water area affected by potential pollution sources. The UV online water quality analyzer contains independent communication equipment, and the water quality data is uploaded to the cloud computing platform application server in real time for data storage and processing;
5)根据实时上传的水质数据,通过云计算平台中嵌入的水体污染识别计算程序进行水体污染在线识别计算,实时判别在当地河湖水质背景浓度下是否存在相应污染物泄露情况;水体污染识别计算程序根据水体本底值及已定相关物质控制指标,进行数据筛选过滤,根据光谱数据峰值对应光谱范围确定浓度超标物质种类;5) According to the water quality data uploaded in real time, the online identification and calculation of water pollution is carried out through the water pollution identification calculation program embedded in the cloud computing platform, and the corresponding pollutant leakage is determined in real time under the background concentration of local river and lake water quality; water pollution identification calculation The program performs data screening and filtering according to the background value of the water body and the established control indicators of related substances, and determines the types of substances with excessive concentrations according to the spectral range corresponding to the peak of the spectral data;
6)当浸入式UV水质在线分析仪检测出异样物质浓度超标,采用云计算平台中嵌入的溯源程序进行污染源定位及释放历史识别;6) When the immersion UV water quality online analyzer detects that the concentration of abnormal substances exceeds the standard, the traceability program embedded in the cloud computing platform is used to locate the pollution source and identify the release history;
7)根据溯源结果通过云计算平台中嵌入的风险预警程序快速进行监测水域附近未来一段时间内的污染风险评估;基于步骤6)溯源程序中的二维物质输运正向模型,模型中污染源项参数源自溯源参数的计算结果,对目标水域下游未来污染物扩散进行风险预测预警及评估。7) According to the traceability results, the risk early-warning program embedded in the cloud computing platform is used to quickly conduct pollution risk assessment in the vicinity of the monitoring waters for a period of time in the future; The parameters are derived from the calculation results of the traceability parameters, and carry out risk prediction, early warning and assessment for the future diffusion of pollutants in the downstream of the target waters.
进一步地,步骤1)中,所述的调查目标水域可能出现的污染物质及来源是调查目标水域附近具备潜在污染性的污染源头,并制作污染指纹图谱方便对照查询判断污染物来源。Further, in step 1), the pollutants and sources that may appear in the survey target water area are the pollution sources with potential pollution near the survey target water area, and a pollution fingerprint is made to facilitate comparison and query to determine the source of pollutants.
进一步地,所述的步骤2)具体为浸入式UV水质在线分析仪分时段观测目标实体水质,时间间隔为1h;观测期间包括两种对比情形:晴雨不同天气状况、工厂高低峰不同生产状态;根据重复观测结果,分段时取平均值作为该时段的水质本体值;所能监测到的污染物质应具有吸收200nm-800nm光的性质,监测指标包括COD、高锰酸盐、硝态氮、金属离子、叶绿素。Further, described step 2) is specifically that immersion type UV water quality on-line analyzer observes target entity water quality by time interval, and the time interval is 1h; During the observation period, two kinds of contrast situations are included: different weather conditions, different production states of high and low peaks of the factory; According to the repeated observation results, the average value is taken as the water quality body value of the period; the pollutants that can be monitored should have the property of absorbing light at 200nm-800nm, and the monitoring indicators include COD, permanganate, nitrate nitrogen, Metal ions, chlorophyll.
进一步地,所述的步骤3)中,所述的云计算平台包括应用服务器和通信服务器;所述应用服务器与所述通信服务器连接,应用服务器用于记录实时上传的水质数据和处理相关业务逻辑,其中业务逻辑包括水体污染识别计算程序、溯源程序、风险预警程序,所述通信服务器用于与移动终端和监控终端与应用终端的通信,其中监控终端为浸入式UV水质在线分析仪。Further, in the described step 3), the cloud computing platform includes an application server and a communication server; the application server is connected with the communication server, and the application server is used to record the water quality data uploaded in real time and process related business logic , wherein the business logic includes a water pollution identification calculation program, a traceability program, and a risk warning program. The communication server is used for communication with the mobile terminal, the monitoring terminal and the application terminal, wherein the monitoring terminal is an immersion UV water quality online analyzer.
进一步地,所述的步骤6)中,所述的溯源程序是基于卡尔曼滤波法的不确定性优化模型,由卡尔曼滤波优化模块和二维物质输运模块耦合,所述卡尔曼滤波优化模块的抽样算法采用蒙特卡洛随机抽样法,所述物质输运模块基于二维对流扩散方程和有限体积差分方法。Further, in the described step 6), the traceability program is based on the uncertainty optimization model of the Kalman filter method, and is coupled by the Kalman filter optimization module and the two-dimensional material transport module, and the Kalman filter optimization The sampling algorithm of the module adopts the Monte Carlo random sampling method, and the material transport module is based on the two-dimensional convection-diffusion equation and the finite volume difference method.
进一步地,其特征在于:所述的溯源程序中二维物质输运模型基于如下公式(1)的基本控制方程:Further, it is characterized in that: the two-dimensional material transport model in the traceability program is based on the basic governing equation of the following formula (1):

式中:H为水深(m);C为等深的物质浓度(kg/m3);t为时间(s);u和v分别为x、y方向上速度(m/s);Kxx,Kxy,Kyx以及Kyy为二维扩散系数张量(m2/s)。In the formula: H is the water depth (m); C is the concentration of the substance at the constant depth (kg/m 3 ); t is the time (s); u and v are the speeds in the x and y directions (m/s), respectively; K xx , K xy , K yx and K yy are two-dimensional diffusion coefficient tensors (m 2 /s).
进一步地,对于所述的公式(1)分成如下对流项和扩散项方程:Further, the formula (1) is divided into the following equations of convection term and diffusion term:
对流项:
扩散项:
利用有限体积法对上面对流项和扩散项进行差分计算,模拟污染物浓度场。Using the finite volume method, the above convection term and diffusion term are differentially calculated to simulate the pollutant concentration field.
进一步地,所述的溯源程序中卡尔曼滤波优化模块流程包括预测、更新两个步骤:Further, in the described traceability program, the Kalman filter optimization module process comprises two steps of prediction and update:
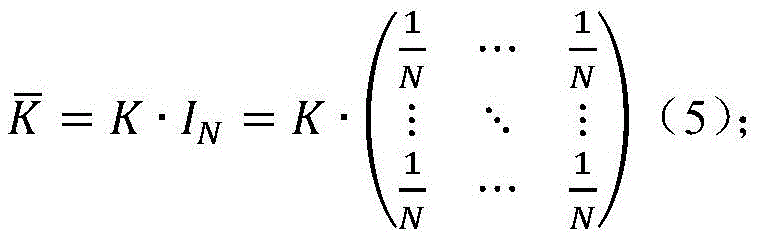
首先,用K表示预测模型的状态变量集合(污染物质浓度),集合个体由蒙特卡洛随机抽样算法得到,


上式(5)中IN为平均值算子,N为状态变量集合数量;P表示K的误差协方差矩阵,上标f和a分别表示预测值和分析值,则Pf和Pa分别表示状态变量的预测值和分析值误差协方差矩阵;In the above formula (5), I N is the average operator, N is the number of state variable sets; P represents the error covariance matrix of K, and the superscript f and a represent the predicted value and the analysis value respectively, then P f and P a respectively Represents the predicted and analyzed error covariance matrix of the state variable;
Pf=Kf′(Kf′)T (6);P f =K f' (K f' ) T (6);
Pa=Ka′(Ka′)T (7);P a =K a' (K a' ) T (7);
其中,
进一步地,所述的溯源程序中卡尔曼滤波优化模块流程包括预测、更新两个步骤具体包括如下步骤:Further, in the described source tracing program, the Kalman filter optimization module process includes two steps of prediction and update, and specifically includes the following steps:
1)预测步骤通过下式来表示1) The prediction step is represented by the following formula

式中:i表示状态变量集合成员序号,此处由于只含有污染物质浓度这一个状态变量,因此i只为1;


2)更新步骤通过下式来表示2) The update step is represented by the following formula
[A][A]

其中,Si,t+1表示t+1时刻第i个集合成员观测状态变量的向量;Q为转换矩阵,本模型中为单位矩阵;e2i表示观测误差,误差服从e2i~N(0,Y),根据观测仪器与观测条件,本模型Y取1%;
E为观测误差矩阵,如下式:E is the observation error matrix, as follows:
E=(ε1,ε2,…,εN)∈Rm×N (10);E=(ε 1 , ε 2 ,...,ε N )∈R m×N (10);
式中m为观测值数量,N为状态变量集合数量,ε为状态变量观测误差;where m is the number of observations, N is the number of state variable sets, and ε is the state variable observation error;
Re为观测误差协方差矩阵,如下式: Re is the observation error covariance matrix, as follows:
Re=E′(E′)T (11); Re = E'(E') T (11);
其中,
[B][B]

其中,Gt+1表示t+1时刻的增益矩阵,可用下式表示:Among them, G t+1 represents the gain matrix at time t+1, which can be expressed by the following formula:

式中,Yt+1为t+1时刻所有集合中状态变量的方差Y组成的矩阵;In the formula, Y t+1 is the matrix composed of the variance Y of all state variables in the set at time t+1;
更新的状态误差协方差矩阵

式中,I为单位矩阵。In the formula, I is the identity matrix.
针对水污染问题中及其重要的时效性,构建云计算平台,基于云计算平台强大的数据库及计算能力,开发并嵌入污染物超标在线识别、溯源和预警技术,及时发现污染超标现象并进行自动化溯源、预警,同时有利于相关部门采取必要的管控措施和治理方案,对污染事件的追责提供必要的技术支撑。Aiming at the water pollution problem and its important timeliness, build a cloud computing platform. Based on the powerful database and computing power of the cloud computing platform, develop and embed the online identification, traceability and early warning technology of pollutants exceeding the standard, so as to detect and automate the phenomenon of excessive pollution in time. Traceability and early warning are also helpful for relevant departments to take necessary control measures and governance plans, and provide necessary technical support for the accountability of pollution incidents.
有益效果:与现有技术相比,本发明通过构建具有强大数据库和计算能力的云计算平台,并在平台中嵌入中自行开发的污染物超标在线识别、溯源和风险预测评估计算模块,正常情况下可满足实时监测水域水质数据的获取,污染物超标情况下可自行识别超标污染物种类及浓度并自动进行溯源、风险预警计算,可作为相关部门紧急决策的技术支撑。该系统的设计具有高度的智能化和集成化,能够保证处理紧急事件的时效性。同时,系统基于云计算平台的可塑性很强,能够随时更新硬件设备和扩展计算模板,将会满足未来很长一个阶段内硬件技术和人工智能化发展对系统的要求。Beneficial effect: Compared with the prior art, the present invention builds a cloud computing platform with powerful database and computing power, and embeds the self-developed online identification, traceability and risk prediction evaluation calculation module of pollutants in the platform. It can meet the acquisition of real-time monitoring water quality data under the condition of pollutants exceeding the standard, and can automatically identify the type and concentration of pollutants exceeding the standard, and automatically perform traceability and risk early warning calculations, which can be used as technical support for emergency decision-making by relevant departments. The design of the system is highly intelligent and integrated, which can ensure the timeliness of dealing with emergencies. At the same time, the system is highly malleable based on the cloud computing platform, and can update hardware devices and expand computing templates at any time, which will meet the system requirements for the development of hardware technology and artificial intelligence for a long period of time in the future.
附图说明Description of drawings
图1是基于在线光谱识别的水体污染溯源和风险预测评估方法的结构示意图;Figure 1 is a schematic diagram of the structure of a water pollution traceability and risk prediction assessment method based on online spectral identification;
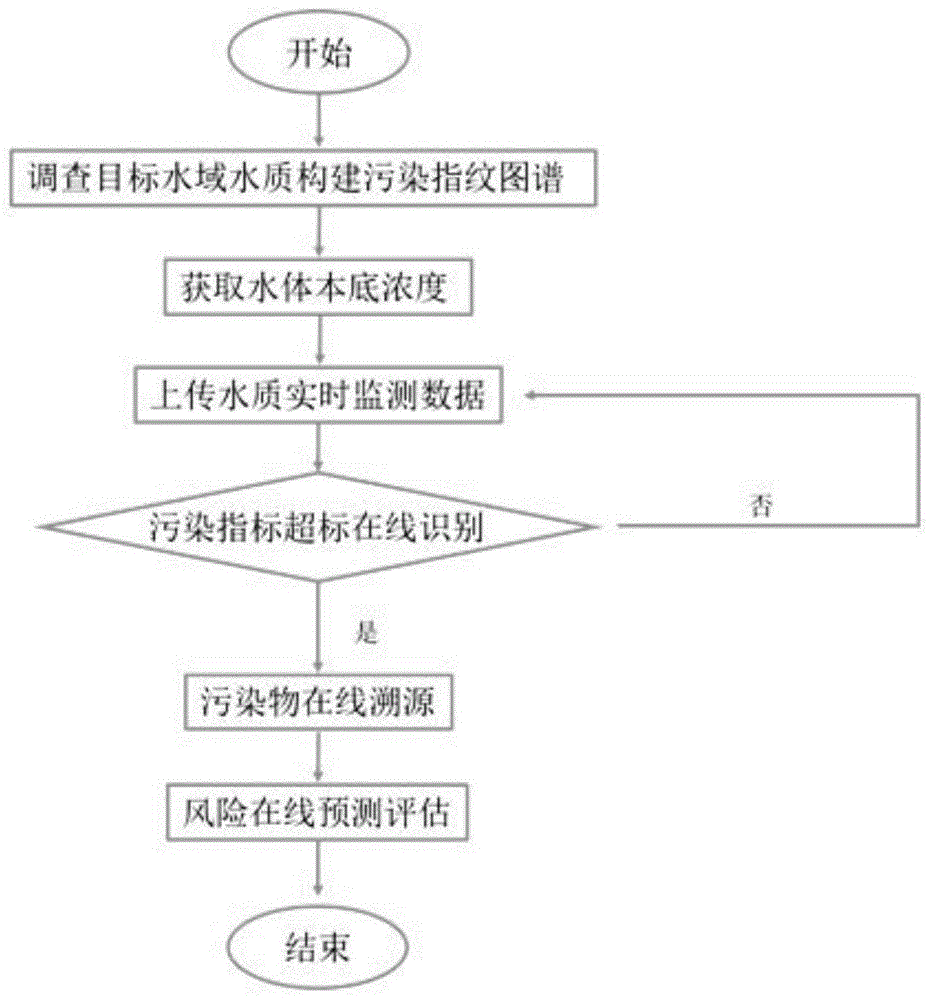
图2是基于在线光谱识别的水体污染溯源和风险预测评估方法的工作流程示意图。Figure 2 is a schematic diagram of the workflow of the water pollution source traceability and risk prediction assessment method based on online spectral identification.
具体实施方式Detailed ways
下面结合附图和具体实施例对本发明作更进一步的说明。The present invention will be further described below with reference to the accompanying drawings and specific embodiments.
如图1-2所示,基于在线光谱识别的水体污染溯源和风险预测评估方法,包括如下步骤:As shown in Figure 1-2, the water pollution source traceability and risk prediction assessment method based on online spectral identification includes the following steps:
1)调查目标水域可能出现的污染物质及来源;1) Investigate possible pollutants and sources in the target waters;
调查目标水域附近工厂、排污管道、农田入河缺口等具备潜在污染性的污染源头,并制作污染指纹图谱方便对照查询判断污染物可能来源;Investigate potentially polluting sources such as factories, sewage pipelines, and gaps between farmland and rivers near the target waters, and make pollution fingerprints to facilitate comparison and query to determine the possible sources of pollutants;
2)将浸入式UV水质在线分析仪在需要监测的目标水域中放置一段时间,获取当地河湖水体水质的背景值;2) Place the immersion UV water quality online analyzer in the target water area to be monitored for a period of time to obtain the background value of the water quality of the local river and lake;
浸入式UV水质在线分析仪需要分时段观测目标实体水质,时间间隔为1h;观测期间应着重注意以下两种对比情形:晴雨不同天气状况、工厂高低峰不同生产状态;根据多次重复观测结果,分段时取平均值作为该时段的水质本体值;The immersion UV water quality online analyzer needs to observe the water quality of the target entity in different time periods, and the time interval is 1h; during the observation period, the following two comparison situations should be paid attention to: different weather conditions in sunny and rainy conditions, and different production states of high and low peaks of the factory; according to the repeated observation results, When segmenting, the average value is taken as the water quality body value of this period;
所能监测到的污染物质应具有吸收200nm-800nm光的性质,监测指标包括溶解态COD、总有机碳、硝态氮、叶绿素、重金属离子;The pollutants that can be monitored should have the property of absorbing 200nm-800nm light, and the monitoring indicators include dissolved COD, total organic carbon, nitrate nitrogen, chlorophyll, and heavy metal ions;
3)构建云计算平台;3) Build a cloud computing platform;
云计算平台包括应用服务器和通信服务器;所述应用服务器与所述通信服务器连接,应用服务器用于记录实时上传的水质数据和处理相关业务逻辑,其中业务逻辑包括水体污染识别计算程序、溯源程序、风险预警程序,所述通信服务器用于与移动终端和监控终端与应用终端的通信,其中监控终端为浸入式UV水质在线分析仪;The cloud computing platform includes an application server and a communication server; the application server is connected to the communication server, and the application server is used to record the real-time uploaded water quality data and process related business logic, wherein the business logic includes a water pollution identification calculation program, a traceability program, Risk warning program, the communication server is used for communication with the mobile terminal, the monitoring terminal and the application terminal, wherein the monitoring terminal is an immersion UV water quality online analyzer;
4)对可能受附近工厂、污水处理厂、排污管道或其他一些潜在污染源影响的水域布置浸入式UV水质在线分析仪进行实时在线监测,UV水质在线分析仪内含独立通讯设备,可在有电话信号区域范围内将水质数据实时上传至云计算平台应用服务器进行数据保存及处理;4) Real-time online monitoring of immersion UV water quality online analyzers in water areas that may be affected by nearby factories, sewage treatment plants, sewage pipelines or some other potential pollution sources. The water quality data is uploaded to the cloud computing platform application server in real time within the signal area for data storage and processing;
5)根据实时上传的水质数据,通过云计算平台中嵌入的水体污染识别计算程序进行水体污染在线识别计算,实时判别在当地河湖水质背景浓度下是否存在相应污染物泄露情况;水体污染识别计算程序根据水体本底值及已定相关物质控制指标,进行数据筛选过滤,根据光谱数据峰值对应光谱范围确定浓度超标物质种类;5) According to the water quality data uploaded in real time, the online identification and calculation of water pollution is carried out through the water pollution identification calculation program embedded in the cloud computing platform, and the corresponding pollutant leakage is determined in real time under the background concentration of local river and lake water quality; water pollution identification calculation The program performs data screening and filtering according to the background value of the water body and the established control indicators of related substances, and determines the types of substances with excessive concentrations according to the spectral range corresponding to the peak of the spectral data;
6)当浸入式UV水质在线分析仪检测出异样物质浓度超标,采用云计算平台中嵌入的溯源程序进行污染源定位及释放历史识别;6) When the immersion UV water quality online analyzer detects that the concentration of abnormal substances exceeds the standard, the traceability program embedded in the cloud computing platform is used to locate the pollution source and identify the release history;
溯源程序是基于卡尔曼滤波法的不确定性优化模型,由卡尔曼滤波优化模块和二维物质输运模块耦合,所述卡尔曼滤波优化模块的抽样算法采用蒙特卡洛随机抽样法,所述物质输运模块基于二维对流扩散方程和有限体积差分方法。The traceability program is an uncertainty optimization model based on the Kalman filter method, which is coupled by a Kalman filter optimization module and a two-dimensional material transport module. The sampling algorithm of the Kalman filter optimization module adopts the Monte Carlo random sampling method. The Mass Transport Module is based on the two-dimensional convective-diffusion equation and finite volume difference method.
溯源程序中二维物质输运模型基于如下基本控制方程:The two-dimensional material transport model in the traceability program is based on the following basic governing equations:

式中:H为水深(m);C为等深的物质浓度(kg/m3);t为时间(s);u和v分别为x、y方向上速度(m/s);Kxx,Kxy,Kyx以及Kyy为二维扩散系数张量(m2/s)。In the formula: H is the water depth (m); C is the concentration of the substance at the constant depth (kg/m 3 ); t is the time (s); u and v are the speeds in the x and y directions (m/s), respectively; K xx , K xy , K yx and K yy are two-dimensional diffusion coefficient tensors (m 2 /s).
对于式(1)分成如下对流项和扩散项方程:For equation (1), it is divided into the following convection term and diffusion term equation:
对流项:
扩散项:
利用有限体积法对上面对流项和扩散项进行差分计算,模拟污染物浓度场。溯源程序中所述的卡尔曼滤波优化模块流程主要包括预测、更新两个步骤:Using the finite volume method, the above convection term and diffusion term are differentially calculated to simulate the pollutant concentration field. The Kalman filter optimization module process described in the traceability program mainly includes two steps of prediction and update:
首先,用K表示预测模型的状态变量集合(污染物质浓度),集合个体由蒙特卡洛随机抽样算法得到,


上式(5)中IN为平均值算子,N为状态变量集合数量,本模型中取20。In the above formula (5), I N is the average operator, and N is the number of state variable sets, which is taken as 20 in this model.
P表示K的误差协方差矩阵,上标f和a分别表示预测值和分析值,则Pf和Pa分别表示状态变量的预测值和分析值误差协方差矩阵。P represents the error covariance matrix of K, the superscripts f and a represent the predicted value and the analyzed value, respectively, then P f and P a represent the predicted value and the analyzed value of the state variable, respectively, the error covariance matrix.
Pf=Kf′(Kf′)T (6);P f =K f' (K f' ) T (6);
Pa=Ka′(Ka′)T (7);P a =K a' (K a' ) T (7);
其中,
(1)预测步骤通过下式来表示(1) The prediction step is represented by the following equation

式中:i表示状态变量集合成员序号,此处由于只含有污染物质浓度这一个状态变量,因此i只为1;


(2)更新步骤(2) Update steps
[A][A]
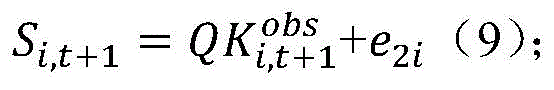
其中,Si,t+1表示t+1时刻第i个集合成员观测状态变量的向量;Q为转换矩阵,本模型中为单位矩阵;e2i表示观测误差,误差服从e2i~N(0,Y),根据观测仪器与观测条件,本模型Y取1%;
E为观测误差矩阵,如下式:E is the observation error matrix, as follows:
E=(ε1,ε2,…,εN)∈Rm×N (10);E=(ε 1 , ε 2 ,...,ε N )∈R m×N (10);
式中m为观测值数量,N为状态变量集合数量,ε为状态变量观测误差。where m is the number of observations, N is the number of state variable sets, and ε is the state variable observation error.
Re为观测误差协方差矩阵,如下式: Re is the observation error covariance matrix, as follows:
Re=E′(E′)T (11); Re = E'(E') T (11);
其中,
[B][B]

其中,Gt+1表示t+1时刻的增益矩阵,可用下式表示:Among them, G t+1 represents the gain matrix at time t+1, which can be expressed by the following formula:
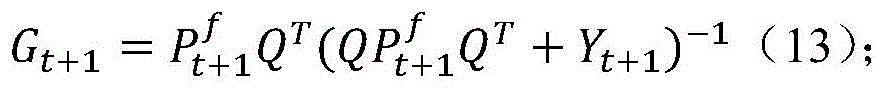
式中,Yt+1为t+1时刻所有集合中状态变量的方差Y组成的矩阵。In the formula, Y t+1 is the matrix composed of the variance Y of all state variables in the set at time t+1.
更新的状态误差协方差矩阵

式中,I为单位矩阵。In the formula, I is the identity matrix.
7)根据溯源结果可通过云计算平台中嵌入的风险预警程序快速进行监测水域附近未来一段时间内的污染风险评估。基于步骤6)溯源程序中的二维物质输运正向模型,模型中污染源项参数源自溯源参数的计算结果,对目标水域下游未来污染物扩散进行风险预测预警及评估。7) According to the traceability results, the risk early-warning program embedded in the cloud computing platform can quickly conduct a pollution risk assessment near the monitoring waters for a period of time in the future. Based on the two-dimensional material transport forward model in the traceability program in step 6), the pollution source item parameters in the model are derived from the calculation results of the traceability parameters, and the risk prediction, early warning and assessment of the future pollutant diffusion in the downstream of the target water area are performed.
本发明与现有技术相比,具有以下优点:通过构建具有强大数据库和计算能力的云计算平台,并在平台中嵌入中自行开发的污染物超标在线识别、溯源和风险预测评估计算模块,正常情况下可满足实时监测水域水质数据的获取,污染物超标情况下可自行识别超标污染物种类及浓度并自动进行溯源、风险预警计算,可作为相关部门紧急决策的技术支撑。该系统的设计具有高度的智能化和集成化,能够保证处理紧急事件的时效性。同时,系统基于云计算平台的可塑性很强,能够随时更新硬件设备和扩展计算模板,将会满足未来很长一个阶段内硬件技术和人工智能化发展对系统的要求。Compared with the prior art, the present invention has the following advantages: by constructing a cloud computing platform with powerful database and computing power, and embedding in the platform a self-developed online identification, traceability and risk prediction evaluation calculation module for pollutants exceeding the standard, normal Under certain circumstances, it can meet the acquisition of real-time monitoring of water quality data. When the pollutants exceed the standard, it can identify the types and concentrations of pollutants that exceed the standard, and automatically perform traceability and risk early warning calculations, which can be used as technical support for emergency decision-making by relevant departments. The design of the system is highly intelligent and integrated, which can ensure the timeliness of dealing with emergencies. At the same time, the system is highly malleable based on the cloud computing platform, and can update hardware devices and expand computing templates at any time, which will meet the system requirements for the development of hardware technology and artificial intelligence for a long period of time in the future.
Claims (9)


Priority Applications (1)
| Application Number | Priority Date | Filing Date | Title |
|---|---|---|---|
| CN202011203001.8A CN112381369B (en) | 2020-11-02 | 2020-11-02 | An evaluation method for water pollution source traceability and risk prediction based on online spectral identification |
Applications Claiming Priority (1)
| Application Number | Priority Date | Filing Date | Title |
|---|---|---|---|
| CN202011203001.8A CN112381369B (en) | 2020-11-02 | 2020-11-02 | An evaluation method for water pollution source traceability and risk prediction based on online spectral identification |
Publications (2)
| Publication Number | Publication Date |
|---|---|
| CN112381369A true CN112381369A (en) | 2021-02-19 |
| CN112381369B CN112381369B (en) | 2022-09-23 |
Family
ID=74577110
Family Applications (1)
| Application Number | Title | Priority Date | Filing Date |
|---|---|---|---|
| CN202011203001.8A Active CN112381369B (en) | 2020-11-02 | 2020-11-02 | An evaluation method for water pollution source traceability and risk prediction based on online spectral identification |
Country Status (1)
| Country | Link |
|---|---|
| CN (1) | CN112381369B (en) |
Cited By (8)
| Publication number | Priority date | Publication date | Assignee | Title |
|---|---|---|---|---|
| CN113588617A (en) * | 2021-08-02 | 2021-11-02 | 清华大学 | Water quality multi-feature early warning traceability system and method |
| CN114663112A (en) * | 2022-03-02 | 2022-06-24 | 广东省农业科学院农业经济与信息研究所 | Live pig supply chain service and production and marketing butt joint system |
| CN115389439A (en) * | 2022-10-28 | 2022-11-25 | 湖南长理尚洋科技有限公司 | River pollutant monitoring method and system based on big data |
| CN115902142A (en) * | 2022-12-19 | 2023-04-04 | 河海大学 | Water body point source tracing method based on improved ensemble Kalman filtering algorithm |
| CN116338132A (en) * | 2023-05-23 | 2023-06-27 | 苏州北控环保科技有限公司 | A water environment monitoring device and its control system based on river restoration |
| CN116416108A (en) * | 2023-06-12 | 2023-07-11 | 生态环境部华南环境科学研究所(生态环境部生态环境应急研究所) | Risk assessment method for urban small and micro water bodies based on simultaneous analysis of multiple factors |
| CN117886381A (en) * | 2024-03-13 | 2024-04-16 | 甘肃省水利水电勘测设计研究院有限责任公司 | A method and system for controlling the addition of water treatment agents |
| CN119863170A (en) * | 2025-03-21 | 2025-04-22 | 中国地质科学院水文地质环境地质研究所 | Groundwater pollution source analysis and risk assessment method and system |
Citations (4)
| Publication number | Priority date | Publication date | Assignee | Title |
|---|---|---|---|---|
| CN102467605A (en) * | 2010-11-08 | 2012-05-23 | 同济大学 | Pollution source tracking and positioning information processing method for sudden pollution accident of water supply pipe network |
| CN108008099A (en) * | 2017-11-01 | 2018-05-08 | 佛山科学技术学院 | A kind of pollution sources localization method |
| US20200018738A1 (en) * | 2018-07-11 | 2020-01-16 | Shandong Normal University | Method and system for comprehensive evaluation of organic compound and heavy metal pollution in water based on fish electrocardio |
| CN111861421A (en) * | 2020-08-01 | 2020-10-30 | 生态环境部南京环境科学研究所 | A rapid source tracing method for sudden water pollution in a river basin |
-
2020
- 2020-11-02 CN CN202011203001.8A patent/CN112381369B/en active Active
Patent Citations (4)
| Publication number | Priority date | Publication date | Assignee | Title |
|---|---|---|---|---|
| CN102467605A (en) * | 2010-11-08 | 2012-05-23 | 同济大学 | Pollution source tracking and positioning information processing method for sudden pollution accident of water supply pipe network |
| CN108008099A (en) * | 2017-11-01 | 2018-05-08 | 佛山科学技术学院 | A kind of pollution sources localization method |
| US20200018738A1 (en) * | 2018-07-11 | 2020-01-16 | Shandong Normal University | Method and system for comprehensive evaluation of organic compound and heavy metal pollution in water based on fish electrocardio |
| CN111861421A (en) * | 2020-08-01 | 2020-10-30 | 生态环境部南京环境科学研究所 | A rapid source tracing method for sudden water pollution in a river basin |
Cited By (11)
| Publication number | Priority date | Publication date | Assignee | Title |
|---|---|---|---|---|
| CN113588617A (en) * | 2021-08-02 | 2021-11-02 | 清华大学 | Water quality multi-feature early warning traceability system and method |
| CN114663112A (en) * | 2022-03-02 | 2022-06-24 | 广东省农业科学院农业经济与信息研究所 | Live pig supply chain service and production and marketing butt joint system |
| CN115389439A (en) * | 2022-10-28 | 2022-11-25 | 湖南长理尚洋科技有限公司 | River pollutant monitoring method and system based on big data |
| CN115902142A (en) * | 2022-12-19 | 2023-04-04 | 河海大学 | Water body point source tracing method based on improved ensemble Kalman filtering algorithm |
| CN115902142B (en) * | 2022-12-19 | 2024-08-09 | 河海大学 | Water point source tracing method based on improved ensemble Kalman filter algorithm |
| CN116338132A (en) * | 2023-05-23 | 2023-06-27 | 苏州北控环保科技有限公司 | A water environment monitoring device and its control system based on river restoration |
| CN116416108A (en) * | 2023-06-12 | 2023-07-11 | 生态环境部华南环境科学研究所(生态环境部生态环境应急研究所) | Risk assessment method for urban small and micro water bodies based on simultaneous analysis of multiple factors |
| CN117886381A (en) * | 2024-03-13 | 2024-04-16 | 甘肃省水利水电勘测设计研究院有限责任公司 | A method and system for controlling the addition of water treatment agents |
| CN117886381B (en) * | 2024-03-13 | 2024-05-14 | 甘肃省水利水电勘测设计研究院有限责任公司 | A method and system for controlling the addition of water treatment agents |
| CN119863170A (en) * | 2025-03-21 | 2025-04-22 | 中国地质科学院水文地质环境地质研究所 | Groundwater pollution source analysis and risk assessment method and system |
| CN119863170B (en) * | 2025-03-21 | 2025-05-27 | 中国地质科学院水文地质环境地质研究所 | Groundwater pollution source analysis and risk assessment method and system |
Also Published As
| Publication number | Publication date |
|---|---|
| CN112381369B (en) | 2022-09-23 |
Similar Documents
| Publication | Publication Date | Title |
|---|---|---|
| CN112381369B (en) | An evaluation method for water pollution source traceability and risk prediction based on online spectral identification | |
| Wen et al. | Research on the progress of regional ecological security evaluation and optimization of its common limitations | |
| CN112270633B (en) | Public welfare litigation clue studying and judging system and method based on big data driving | |
| CN112734694A (en) | Water quality monitoring method based on big data | |
| CN118823679A (en) | Assessment Method for Regional Heavy Metal Pollution in Marine Environment | |
| CN120259059B (en) | Ecological monitoring system and method based on intelligent fusion of community specific species and multiple sources | |
| CN116090710B (en) | Management method, system, electronic equipment and medium for enterprise pollution discharge permission | |
| CN113487470A (en) | Environmental protection hidden danger accurate monitoring and positioning method based on big data | |
| CN113484489A (en) | Remote monitoring and early warning method for water eutrophication | |
| CN119643485A (en) | Intelligent sewage detection method and system for municipal construction | |
| CN115296933A (en) | Industrial production data risk level assessment method and system | |
| CN117314705B (en) | Environment comprehensive evaluation prediction method based on remote sensing image | |
| CN120124868A (en) | A water quality monitoring and analysis method and system for a water conservancy system | |
| Nie et al. | An improved CNN model in image classification application on water turbidity | |
| CN118445605A (en) | Rainwater runoff pollution source identification management system | |
| CN119274085B (en) | Seawater quality monitoring method and system based on automatic multi-source data assimilation | |
| CN120104993A (en) | A method for constructing an automated early warning network for water quality monitoring in estuaries entering the sea | |
| CN116187204B (en) | A risk decision-making method for inversion of water environment pollution by remote sensing of water areas | |
| Szeląg et al. | Application of multispectral images from unmanned aerial vehicles to analyze operations of a wastewater treatment plant | |
| CN117753213A (en) | Membrane fouling prediction methods, devices, equipment, storage media and program products | |
| CN119151704B (en) | Agricultural remote sensing pollution early warning method and early warning system based on knowledge graph | |
| ArunaKumari et al. | Air contamination prediction and comparison using machine learning algorithms | |
| CN120559180B (en) | A method and device for environmental monitoring and pollution tracing in chemical parks | |
| Andrea | Water Pollution Early Warning Method Based on Cloud Platform | |
| Kedar et al. | A Comprehensive Evaluation Method for Environmental Pollution in Tourist Attractions Based on Improved Principle Component Analysis |
Legal Events
| Date | Code | Title | Description |
|---|---|---|---|
| PB01 | Publication | ||
| PB01 | Publication | ||
| SE01 | Entry into force of request for substantive examination | ||
| SE01 | Entry into force of request for substantive examination | ||
| GR01 | Patent grant | ||
| GR01 | Patent grant |