CN112352158A - Portable imaging flow cytometer capable of deep learning for label-free analysis of water samples - Google Patents
Portable imaging flow cytometer capable of deep learning for label-free analysis of water samples Download PDFInfo
- Publication number
- CN112352158A CN112352158A CN201980043900.5A CN201980043900A CN112352158A CN 112352158 A CN112352158 A CN 112352158A CN 201980043900 A CN201980043900 A CN 201980043900A CN 112352158 A CN112352158 A CN 112352158A
- Authority
- CN
- China
- Prior art keywords
- image
- flow cytometer
- phase
- processing software
- image processing
- Prior art date
- Legal status (The legal status is an assumption and is not a legal conclusion. Google has not performed a legal analysis and makes no representation as to the accuracy of the status listed.)
- Pending
Links
Images


Classifications
-
- G—PHYSICS
- G01—MEASURING; TESTING
- G01N—INVESTIGATING OR ANALYSING MATERIALS BY DETERMINING THEIR CHEMICAL OR PHYSICAL PROPERTIES
- G01N15/00—Investigating characteristics of particles; Investigating permeability, pore-volume or surface-area of porous materials
- G01N15/10—Investigating individual particles
- G01N15/14—Optical investigation techniques, e.g. flow cytometry
- G01N15/1429—Signal processing
- G01N15/1433—Signal processing using image recognition
-
- B—PERFORMING OPERATIONS; TRANSPORTING
- B01—PHYSICAL OR CHEMICAL PROCESSES OR APPARATUS IN GENERAL
- B01L—CHEMICAL OR PHYSICAL LABORATORY APPARATUS FOR GENERAL USE
- B01L3/00—Containers or dishes for laboratory use, e.g. laboratory glassware; Droppers
- B01L3/50—Containers for the purpose of retaining a material to be analysed, e.g. test tubes
- B01L3/502—Containers for the purpose of retaining a material to be analysed, e.g. test tubes with fluid transport, e.g. in multi-compartment structures
- B01L3/5027—Containers for the purpose of retaining a material to be analysed, e.g. test tubes with fluid transport, e.g. in multi-compartment structures by integrated microfluidic structures, i.e. dimensions of channels and chambers are such that surface tension forces are important, e.g. lab-on-a-chip
- B01L3/502715—Containers for the purpose of retaining a material to be analysed, e.g. test tubes with fluid transport, e.g. in multi-compartment structures by integrated microfluidic structures, i.e. dimensions of channels and chambers are such that surface tension forces are important, e.g. lab-on-a-chip characterised by interfacing components, e.g. fluidic, electrical, optical or mechanical interfaces
-
- G—PHYSICS
- G01—MEASURING; TESTING
- G01N—INVESTIGATING OR ANALYSING MATERIALS BY DETERMINING THEIR CHEMICAL OR PHYSICAL PROPERTIES
- G01N15/00—Investigating characteristics of particles; Investigating permeability, pore-volume or surface-area of porous materials
- G01N15/10—Investigating individual particles
- G01N15/14—Optical investigation techniques, e.g. flow cytometry
- G01N15/1434—Optical arrangements
-
- G—PHYSICS
- G01—MEASURING; TESTING
- G01N—INVESTIGATING OR ANALYSING MATERIALS BY DETERMINING THEIR CHEMICAL OR PHYSICAL PROPERTIES
- G01N15/00—Investigating characteristics of particles; Investigating permeability, pore-volume or surface-area of porous materials
- G01N15/10—Investigating individual particles
- G01N15/14—Optical investigation techniques, e.g. flow cytometry
- G01N15/1456—Optical investigation techniques, e.g. flow cytometry without spatial resolution of the texture or inner structure of the particle, e.g. processing of pulse signals
- G01N15/1459—Optical investigation techniques, e.g. flow cytometry without spatial resolution of the texture or inner structure of the particle, e.g. processing of pulse signals the analysis being performed on a sample stream
-
- G—PHYSICS
- G01—MEASURING; TESTING
- G01N—INVESTIGATING OR ANALYSING MATERIALS BY DETERMINING THEIR CHEMICAL OR PHYSICAL PROPERTIES
- G01N15/00—Investigating characteristics of particles; Investigating permeability, pore-volume or surface-area of porous materials
- G01N15/10—Investigating individual particles
- G01N15/14—Optical investigation techniques, e.g. flow cytometry
- G01N15/1468—Optical investigation techniques, e.g. flow cytometry with spatial resolution of the texture or inner structure of the particle
- G01N15/147—Optical investigation techniques, e.g. flow cytometry with spatial resolution of the texture or inner structure of the particle the analysis being performed on a sample stream
-
- G—PHYSICS
- G01—MEASURING; TESTING
- G01N—INVESTIGATING OR ANALYSING MATERIALS BY DETERMINING THEIR CHEMICAL OR PHYSICAL PROPERTIES
- G01N15/00—Investigating characteristics of particles; Investigating permeability, pore-volume or surface-area of porous materials
- G01N15/10—Investigating individual particles
- G01N15/14—Optical investigation techniques, e.g. flow cytometry
- G01N15/1484—Optical investigation techniques, e.g. flow cytometry microstructural devices
-
- G—PHYSICS
- G01—MEASURING; TESTING
- G01N—INVESTIGATING OR ANALYSING MATERIALS BY DETERMINING THEIR CHEMICAL OR PHYSICAL PROPERTIES
- G01N33/00—Investigating or analysing materials by specific methods not covered by groups G01N1/00 - G01N31/00
- G01N33/18—Water
- G01N33/186—Water using one or more living organisms, e.g. a fish
- G01N33/1866—Water using one or more living organisms, e.g. a fish using microorganisms
-
- G—PHYSICS
- G01—MEASURING; TESTING
- G01N—INVESTIGATING OR ANALYSING MATERIALS BY DETERMINING THEIR CHEMICAL OR PHYSICAL PROPERTIES
- G01N33/00—Investigating or analysing materials by specific methods not covered by groups G01N1/00 - G01N31/00
- G01N33/48—Biological material, e.g. blood, urine; Haemocytometers
- G01N33/483—Physical analysis of biological material
-
- G—PHYSICS
- G03—PHOTOGRAPHY; CINEMATOGRAPHY; ANALOGOUS TECHNIQUES USING WAVES OTHER THAN OPTICAL WAVES; ELECTROGRAPHY; HOLOGRAPHY
- G03H—HOLOGRAPHIC PROCESSES OR APPARATUS
- G03H1/00—Holographic processes or apparatus using light, infrared or ultraviolet waves for obtaining holograms or for obtaining an image from them; Details peculiar thereto
- G03H1/0005—Adaptation of holography to specific applications
-
- G—PHYSICS
- G03—PHOTOGRAPHY; CINEMATOGRAPHY; ANALOGOUS TECHNIQUES USING WAVES OTHER THAN OPTICAL WAVES; ELECTROGRAPHY; HOLOGRAPHY
- G03H—HOLOGRAPHIC PROCESSES OR APPARATUS
- G03H1/00—Holographic processes or apparatus using light, infrared or ultraviolet waves for obtaining holograms or for obtaining an image from them; Details peculiar thereto
- G03H1/04—Processes or apparatus for producing holograms
- G03H1/0443—Digital holography, i.e. recording holograms with digital recording means
-
- G—PHYSICS
- G03—PHOTOGRAPHY; CINEMATOGRAPHY; ANALOGOUS TECHNIQUES USING WAVES OTHER THAN OPTICAL WAVES; ELECTROGRAPHY; HOLOGRAPHY
- G03H—HOLOGRAPHIC PROCESSES OR APPARATUS
- G03H1/00—Holographic processes or apparatus using light, infrared or ultraviolet waves for obtaining holograms or for obtaining an image from them; Details peculiar thereto
- G03H1/04—Processes or apparatus for producing holograms
- G03H1/0465—Particular recording light; Beam shape or geometry
-
- G—PHYSICS
- G03—PHOTOGRAPHY; CINEMATOGRAPHY; ANALOGOUS TECHNIQUES USING WAVES OTHER THAN OPTICAL WAVES; ELECTROGRAPHY; HOLOGRAPHY
- G03H—HOLOGRAPHIC PROCESSES OR APPARATUS
- G03H1/00—Holographic processes or apparatus using light, infrared or ultraviolet waves for obtaining holograms or for obtaining an image from them; Details peculiar thereto
- G03H1/04—Processes or apparatus for producing holograms
- G03H1/08—Synthesising holograms, i.e. holograms synthesized from objects or objects from holograms
- G03H1/0866—Digital holographic imaging, i.e. synthesizing holobjects from holograms
-
- G—PHYSICS
- G06—COMPUTING OR CALCULATING; COUNTING
- G06F—ELECTRIC DIGITAL DATA PROCESSING
- G06F18/00—Pattern recognition
- G06F18/20—Analysing
- G06F18/21—Design or setup of recognition systems or techniques; Extraction of features in feature space; Blind source separation
- G06F18/214—Generating training patterns; Bootstrap methods, e.g. bagging or boosting
-
- G—PHYSICS
- G06—COMPUTING OR CALCULATING; COUNTING
- G06T—IMAGE DATA PROCESSING OR GENERATION, IN GENERAL
- G06T7/00—Image analysis
- G06T7/0002—Inspection of images, e.g. flaw detection
- G06T7/0012—Biomedical image inspection
-
- G—PHYSICS
- G06—COMPUTING OR CALCULATING; COUNTING
- G06T—IMAGE DATA PROCESSING OR GENERATION, IN GENERAL
- G06T7/00—Image analysis
- G06T7/20—Analysis of motion
- G06T7/215—Motion-based segmentation
-
- G—PHYSICS
- G06—COMPUTING OR CALCULATING; COUNTING
- G06T—IMAGE DATA PROCESSING OR GENERATION, IN GENERAL
- G06T7/00—Image analysis
- G06T7/20—Analysis of motion
- G06T7/254—Analysis of motion involving subtraction of images
-
- G—PHYSICS
- G06—COMPUTING OR CALCULATING; COUNTING
- G06V—IMAGE OR VIDEO RECOGNITION OR UNDERSTANDING
- G06V20/00—Scenes; Scene-specific elements
- G06V20/60—Type of objects
- G06V20/69—Microscopic objects, e.g. biological cells or cellular parts
- G06V20/698—Matching; Classification
-
- H—ELECTRICITY
- H04—ELECTRIC COMMUNICATION TECHNIQUE
- H04N—PICTORIAL COMMUNICATION, e.g. TELEVISION
- H04N23/00—Cameras or camera modules comprising electronic image sensors; Control thereof
- H04N23/56—Cameras or camera modules comprising electronic image sensors; Control thereof provided with illuminating means
-
- B—PERFORMING OPERATIONS; TRANSPORTING
- B01—PHYSICAL OR CHEMICAL PROCESSES OR APPARATUS IN GENERAL
- B01L—CHEMICAL OR PHYSICAL LABORATORY APPARATUS FOR GENERAL USE
- B01L2200/00—Solutions for specific problems relating to chemical or physical laboratory apparatus
- B01L2200/02—Adapting objects or devices to another
- B01L2200/026—Fluid interfacing between devices or objects, e.g. connectors, inlet details
- B01L2200/027—Fluid interfacing between devices or objects, e.g. connectors, inlet details for microfluidic devices
-
- B—PERFORMING OPERATIONS; TRANSPORTING
- B01—PHYSICAL OR CHEMICAL PROCESSES OR APPARATUS IN GENERAL
- B01L—CHEMICAL OR PHYSICAL LABORATORY APPARATUS FOR GENERAL USE
- B01L2300/00—Additional constructional details
- B01L2300/06—Auxiliary integrated devices, integrated components
- B01L2300/0627—Sensor or part of a sensor is integrated
- B01L2300/0663—Whole sensors
-
- B—PERFORMING OPERATIONS; TRANSPORTING
- B01—PHYSICAL OR CHEMICAL PROCESSES OR APPARATUS IN GENERAL
- B01L—CHEMICAL OR PHYSICAL LABORATORY APPARATUS FOR GENERAL USE
- B01L2400/00—Moving or stopping fluids
- B01L2400/04—Moving fluids with specific forces or mechanical means
- B01L2400/0475—Moving fluids with specific forces or mechanical means specific mechanical means and fluid pressure
- B01L2400/0487—Moving fluids with specific forces or mechanical means specific mechanical means and fluid pressure fluid pressure, pneumatics
-
- G—PHYSICS
- G01—MEASURING; TESTING
- G01N—INVESTIGATING OR ANALYSING MATERIALS BY DETERMINING THEIR CHEMICAL OR PHYSICAL PROPERTIES
- G01N15/00—Investigating characteristics of particles; Investigating permeability, pore-volume or surface-area of porous materials
- G01N15/10—Investigating individual particles
- G01N2015/1006—Investigating individual particles for cytology
-
- G—PHYSICS
- G01—MEASURING; TESTING
- G01N—INVESTIGATING OR ANALYSING MATERIALS BY DETERMINING THEIR CHEMICAL OR PHYSICAL PROPERTIES
- G01N15/00—Investigating characteristics of particles; Investigating permeability, pore-volume or surface-area of porous materials
- G01N15/10—Investigating individual particles
- G01N15/14—Optical investigation techniques, e.g. flow cytometry
- G01N15/1434—Optical arrangements
- G01N2015/1454—Optical arrangements using phase shift or interference, e.g. for improving contrast
-
- G—PHYSICS
- G01—MEASURING; TESTING
- G01N—INVESTIGATING OR ANALYSING MATERIALS BY DETERMINING THEIR CHEMICAL OR PHYSICAL PROPERTIES
- G01N15/00—Investigating characteristics of particles; Investigating permeability, pore-volume or surface-area of porous materials
- G01N15/10—Investigating individual particles
- G01N15/14—Optical investigation techniques, e.g. flow cytometry
- G01N2015/1497—Particle shape
-
- G—PHYSICS
- G03—PHOTOGRAPHY; CINEMATOGRAPHY; ANALOGOUS TECHNIQUES USING WAVES OTHER THAN OPTICAL WAVES; ELECTROGRAPHY; HOLOGRAPHY
- G03H—HOLOGRAPHIC PROCESSES OR APPARATUS
- G03H1/00—Holographic processes or apparatus using light, infrared or ultraviolet waves for obtaining holograms or for obtaining an image from them; Details peculiar thereto
- G03H1/0005—Adaptation of holography to specific applications
- G03H2001/0033—Adaptation of holography to specific applications in hologrammetry for measuring or analysing
-
- G—PHYSICS
- G03—PHOTOGRAPHY; CINEMATOGRAPHY; ANALOGOUS TECHNIQUES USING WAVES OTHER THAN OPTICAL WAVES; ELECTROGRAPHY; HOLOGRAPHY
- G03H—HOLOGRAPHIC PROCESSES OR APPARATUS
- G03H1/00—Holographic processes or apparatus using light, infrared or ultraviolet waves for obtaining holograms or for obtaining an image from them; Details peculiar thereto
- G03H1/04—Processes or apparatus for producing holograms
- G03H1/0443—Digital holography, i.e. recording holograms with digital recording means
- G03H2001/0445—Off-axis recording arrangement
-
- G—PHYSICS
- G03—PHOTOGRAPHY; CINEMATOGRAPHY; ANALOGOUS TECHNIQUES USING WAVES OTHER THAN OPTICAL WAVES; ELECTROGRAPHY; HOLOGRAPHY
- G03H—HOLOGRAPHIC PROCESSES OR APPARATUS
- G03H1/00—Holographic processes or apparatus using light, infrared or ultraviolet waves for obtaining holograms or for obtaining an image from them; Details peculiar thereto
- G03H1/04—Processes or apparatus for producing holograms
- G03H1/0443—Digital holography, i.e. recording holograms with digital recording means
- G03H2001/0447—In-line recording arrangement
-
- G—PHYSICS
- G03—PHOTOGRAPHY; CINEMATOGRAPHY; ANALOGOUS TECHNIQUES USING WAVES OTHER THAN OPTICAL WAVES; ELECTROGRAPHY; HOLOGRAPHY
- G03H—HOLOGRAPHIC PROCESSES OR APPARATUS
- G03H2210/00—Object characteristics
- G03H2210/50—Nature of the object
- G03H2210/55—Having particular size, e.g. irresolvable by the eye
-
- G—PHYSICS
- G03—PHOTOGRAPHY; CINEMATOGRAPHY; ANALOGOUS TECHNIQUES USING WAVES OTHER THAN OPTICAL WAVES; ELECTROGRAPHY; HOLOGRAPHY
- G03H—HOLOGRAPHIC PROCESSES OR APPARATUS
- G03H2210/00—Object characteristics
- G03H2210/62—Moving object
-
- G—PHYSICS
- G03—PHOTOGRAPHY; CINEMATOGRAPHY; ANALOGOUS TECHNIQUES USING WAVES OTHER THAN OPTICAL WAVES; ELECTROGRAPHY; HOLOGRAPHY
- G03H—HOLOGRAPHIC PROCESSES OR APPARATUS
- G03H2222/00—Light sources or light beam properties
- G03H2222/10—Spectral composition
- G03H2222/13—Multi-wavelengths wave with discontinuous wavelength ranges
-
- G—PHYSICS
- G03—PHOTOGRAPHY; CINEMATOGRAPHY; ANALOGOUS TECHNIQUES USING WAVES OTHER THAN OPTICAL WAVES; ELECTROGRAPHY; HOLOGRAPHY
- G03H—HOLOGRAPHIC PROCESSES OR APPARATUS
- G03H2222/00—Light sources or light beam properties
- G03H2222/10—Spectral composition
- G03H2222/16—Infra Red [IR]
-
- G—PHYSICS
- G03—PHOTOGRAPHY; CINEMATOGRAPHY; ANALOGOUS TECHNIQUES USING WAVES OTHER THAN OPTICAL WAVES; ELECTROGRAPHY; HOLOGRAPHY
- G03H—HOLOGRAPHIC PROCESSES OR APPARATUS
- G03H2222/00—Light sources or light beam properties
- G03H2222/34—Multiple light sources
-
- G—PHYSICS
- G03—PHOTOGRAPHY; CINEMATOGRAPHY; ANALOGOUS TECHNIQUES USING WAVES OTHER THAN OPTICAL WAVES; ELECTROGRAPHY; HOLOGRAPHY
- G03H—HOLOGRAPHIC PROCESSES OR APPARATUS
- G03H2223/00—Optical components
- G03H2223/15—Colour filter, e.g. interferential colour filter
-
- G—PHYSICS
- G03—PHOTOGRAPHY; CINEMATOGRAPHY; ANALOGOUS TECHNIQUES USING WAVES OTHER THAN OPTICAL WAVES; ELECTROGRAPHY; HOLOGRAPHY
- G03H—HOLOGRAPHIC PROCESSES OR APPARATUS
- G03H2223/00—Optical components
- G03H2223/24—Reflector; Mirror
-
- G—PHYSICS
- G06—COMPUTING OR CALCULATING; COUNTING
- G06T—IMAGE DATA PROCESSING OR GENERATION, IN GENERAL
- G06T2207/00—Indexing scheme for image analysis or image enhancement
- G06T2207/10—Image acquisition modality
- G06T2207/10024—Color image
-
- G—PHYSICS
- G06—COMPUTING OR CALCULATING; COUNTING
- G06T—IMAGE DATA PROCESSING OR GENERATION, IN GENERAL
- G06T2207/00—Indexing scheme for image analysis or image enhancement
- G06T2207/10—Image acquisition modality
- G06T2207/10028—Range image; Depth image; 3D point clouds
-
- G—PHYSICS
- G06—COMPUTING OR CALCULATING; COUNTING
- G06T—IMAGE DATA PROCESSING OR GENERATION, IN GENERAL
- G06T2207/00—Indexing scheme for image analysis or image enhancement
- G06T2207/10—Image acquisition modality
- G06T2207/10056—Microscopic image
-
- G—PHYSICS
- G06—COMPUTING OR CALCULATING; COUNTING
- G06T—IMAGE DATA PROCESSING OR GENERATION, IN GENERAL
- G06T2207/00—Indexing scheme for image analysis or image enhancement
- G06T2207/20—Special algorithmic details
- G06T2207/20084—Artificial neural networks [ANN]
-
- G—PHYSICS
- G06—COMPUTING OR CALCULATING; COUNTING
- G06T—IMAGE DATA PROCESSING OR GENERATION, IN GENERAL
- G06T2207/00—Indexing scheme for image analysis or image enhancement
- G06T2207/30—Subject of image; Context of image processing
- G06T2207/30242—Counting objects in image
Landscapes
- Engineering & Computer Science (AREA)
- Physics & Mathematics (AREA)
- Chemical & Material Sciences (AREA)
- General Physics & Mathematics (AREA)
- Health & Medical Sciences (AREA)
- Life Sciences & Earth Sciences (AREA)
- General Health & Medical Sciences (AREA)
- Analytical Chemistry (AREA)
- Theoretical Computer Science (AREA)
- Pathology (AREA)
- Immunology (AREA)
- Biochemistry (AREA)
- Dispersion Chemistry (AREA)
- Computer Vision & Pattern Recognition (AREA)
- Multimedia (AREA)
- Biomedical Technology (AREA)
- Signal Processing (AREA)
- Hematology (AREA)
- Computing Systems (AREA)
- Molecular Biology (AREA)
- Food Science & Technology (AREA)
- Medicinal Chemistry (AREA)
- Data Mining & Analysis (AREA)
- Quality & Reliability (AREA)
- Nuclear Medicine, Radiotherapy & Molecular Imaging (AREA)
- Medical Informatics (AREA)
- Radiology & Medical Imaging (AREA)
- Clinical Laboratory Science (AREA)
- Chemical Kinetics & Catalysis (AREA)
- Evolutionary Computation (AREA)
- Evolutionary Biology (AREA)
- Microbiology (AREA)
- Bioinformatics & Computational Biology (AREA)
- Bioinformatics & Cheminformatics (AREA)
- Artificial Intelligence (AREA)
- General Engineering & Computer Science (AREA)
- Biophysics (AREA)
- Urology & Nephrology (AREA)
- Investigating Or Analysing Biological Materials (AREA)
- Image Analysis (AREA)
Abstract
An imaging flow cytometer device includes a housing containing a polychromatic illumination source configured for pulsed or continuous wave operation. A microfluidic channel is disposed in the housing and is fluidly coupled to a fluid source containing an object flowing through the microfluidic channel. A color image sensor is disposed adjacent to the microfluidic channel and receives light from the illumination source that passes through the microfluidic channel. The image sensor captures image frames of a raw holographic image containing a moving object passing through the microfluidic channel. The image frames are image processed to reconstruct a phase and/or intensity image of the moving object for each color. The reconstructed phase and/or intensity images are then input to a trained deep neural network that outputs phase-recovered images of the moving object. The trained deep neural network may also be trained to classify the object type.
Description
RELATED APPLICATIONS
This application claims priority from U.S. provisional patent application No. 62/680,374, filed on 4.6.2018, which is incorporated herein by reference. Priority is required in accordance with 35u.s.c. § 119 and any other applicable regulations.
Technical Field
The technical field generally relates to field-portable and cost-effective imaging flow cytometers. More particularly, the technical field relates to a deep learning capable flow cytometer that automatically captures phase contrast color images of the contents of a flowing water sample.
Statement regarding federally sponsored
Research and development
The invention was made with government support granted by the U.S. department of defense under grant number W56 HZV-16-C-0122. The government has certain rights in the invention.
Background
Plankton forms the basis of the marine food chain and is therefore an important component of the entire marine ecosystem. Phytoplankton account for about half of our planet's primary productivity of photoautotrophy. High resolution mapping of phytoplankton composition over a long period is important but challenging because the composition and relative populations of different species vary rapidly over time. In addition, the controlling factors for phytoplankton concentration and composition are not fully understood, and their population dynamics are disturbed. Changes in the seasonal flowering cycle can also have significant environmental and economic impacts. Most phytoplankton species are harmless, but some species of phytoplankton produce neurotoxins that can enter the food chain, accumulate, and poison fish, mammals, and ultimately humans. Notable examples include: short-lived carlunella producing short toxins and causing neurotoxic shellfish poisoning, alexander producing saxon and causing paralytic shellfish poisoning, fin crested algae producing actin leading to diarrhetic shellfish poisoning with okadaic acid, and rhomboidium forming domoic acid leading to amnesic shellfish poisoning and possibly even death. Currently, monitoring the concentration of these species in coastal areas, including california, usa, is typically performed by manually collecting samples from coastal waters using planktonic nets and then transporting the samples to a central laboratory for light microscope-based analysis, which is cumbersome, slow and expensive, requiring several manual steps by a professional.
As an alternative to optical microscope based analysis, flow cytometry has been used to analyze phytoplankton samples for over 35 years. This technique relies on the use of sheath flow to confine the planktonic sample to the focal point of the illuminating laser beam and to measure the forward and side scatter intensities of each individual object/particle within the sample volume. To aid in classification, it is often combined with fluorescence readings to detect autofluorescence of chlorophyll, phycocyanin, and phycoerythrin found in algae and cyanobacteria. Several field-portable devices based on flow cytometry have been successfully used to analyze the nanoscale and picoplankton distribution in natural water samples. However, classification identification based solely on scatter and fluorescence data is generally not feasible in flow cytometers, and therefore these devices require additional microscopic image analysis, or enhancement by some form of imaging.
Thus, imaging flow cytometry has become a widely used technique in which a sample (e.g., algae) within a fluid flow is imaged using a microscope objective. Image capture is triggered by the fluorescence detector, thus imaging the object with detectable autofluorescence. Some widely used and commercially available imaging flow cytometers include Flowcam (fluidics), imaging flowcytobots (mclaien research laboratory), and CytoSense (Cytobouy b.v.). Although these systems are capable of imaging plankton in the flow, they still have some important limitations. The use of microscope objectives provides a strong compromise mechanism between image resolution and volumetric flux for these systems; therefore, in order to obtain high quality images, the measured sample volume should be limited to a few milliliters per hour (e.g., 3-15 milliliters per hour). Using a lower magnification objective lens can magnify the low flux by a factor of about 10 at the expense of image quality. In addition, the shallow depth of field of a microscope objective requires hydrodynamic focusing of the liquid sample into a layer several microns thick using a stable sheath flow. This also limits the size of the object that can be imaged (e.g., <150 μm) and the flow rate, limiting the throughput of the system, which requires the use of other expensive techniques, such as acoustic focusing. As a result of these factors, imaging flow cytometers currently used in the field of environmental microbiology are rather bulky (e.g., 9 to 30 kilograms) and expensive (> $ 40,000 to $ 100,000), which limits their widespread use.
In contrast to some of these existing fluorescence-based methods, holographic imaging of planktonic samples provides an unmarked alternative; in fact, its application in environmental microbiology began more than 40 years ago with photographic film, and then continued to be used with digital cameras and reconstruction techniques. Holography provides a volumetric imaging technique that uses coherent or partially coherent light to record the interference intensity pattern of an object. This hologram can then be reconstructed to digitally focus the object. The hologram contains information about the complex refractive index distribution of the object, and therefore, not only the absorbance of the sample but also its phase distribution can be obtained. Several implementations of digital holography are used to image fluid flow.
These digital holographic microscopy systems can be classified according to the presence of an external reference wave (on-line or off-axis), the magnification of the imaging volume and illumination with a lens or spherical wavefront. An off-axis system can retrieve phase information directly from the captured hologram; however, their spatial bandwidth product and image quality are generally inferior to online systems. There are also commercially available on-line holographic imaging flow cytometer systems, such as LISST-Holo2 (sequoia science, bellevue, washington). The platform is a monochrome system (i.e., does not provide color information) and the image quality is relatively poor compared to conventional imaging flow cytometers. The flux and spatial resolution are coupled in this device and therefore it can enable high-flux volume imaging at the expense of limited resolution (equivalent spherical diameter of about 25-2500 μm and feature resolution of 4 μm), which is only used to detect and identify larger organisms. Systems of high resolution and better image quality using a microscope objective in the light path are also described, but using a microscope objective not only makes these systems more expensive, but also limits the achievable field of view (FOV) and depth field and thus greatly reduces the throughput of the system, e.g. about 0.8 mL/h.
Disclosure of Invention
In one embodiment, a powerful yet mobile and inexpensive imaging flow cytometer device is provided for environmental microbiology and related uses. An online holographic imaging flow cytometer is provided that is capable of automatically detecting and providing in real time or near real time color images of label-free objects in flowing water samples at a throughput of about 100mL/h or more. In one embodiment, the high throughput imaging flow cytometer weighs about 1kg and has dimensions of about 15.5cm by 15cm by 12.5 cm. Imaging flow cytometers obtain images of objects in flowing water samples based on a deep learning capable phase recovery and holographic reconstruction framework running on a computing device such as a laptop computer, which in some embodiments is also used to control the imaging flow cytometer device. Imaging flow cytometer devices are significantly more compact, lighter in weight and cost-effective than other imaging flow cytometers, with total parts costs less than $ 2500, which is only a fraction of the cost of existing imaging flow cytometers. The imaging flow cytometer device can continuously examine the liquid pumped through a microfluidic chip 0.8mm thick without any fluorescence trigger or hydrodynamic focusing of the sample, thus also making the device robust and very easy to operate, covering a large dynamic range of object sizes from microns to hundreds of microns.
In some embodiments, an imaging flow cytometer apparatus may be used to image aquatic microorganisms. Aquatic microorganisms include plankton and nano-plankton and algae. Other microorganisms, including parasites, etc., may also be imaged with the imaging flow cytometer device. Examples of such aquatic parasites include, for example, Giardia (Giardia). Giardia is a microscopic parasite that causes a diarrheal disease called giardiasis. In other embodiments, the imaging flow cytometer device may be used to count or quantify the number of aquatic microorganisms in a sample. This includes the total number of aquatic microorganisms, as well as the specific sub-counts that determine a specific class or category of microorganisms. In other embodiments, the flow cytometer device can classify the identified microorganisms as belonging to a particular species, class, or phenotype.
The function of the portable holographic imaging flow cytometer is demonstrated by imaging the composition of the micro-plankton and the nano-plankton of the marine sample along the coastline of los angeles, the concentration of the potentially harmful algae, namely the rhombohedral alga, is measured, and good consistency is achieved with independent measurement performed by the California Department of Public Health (CDPH). Of course, other microorganisms may also be imaged as described herein. These field results demonstrate the effectiveness of high throughput imaging flow cytometers. In other embodiments, the imaging flow cytometer device may form the basis of a network of multiple imaging flow cytometers that may be deployed for large-scale, continuous monitoring and quantifying microscopic components of a water sample. For example, an environmental observer on site may use the device to monitor the status or health of various bodies of water. This may include oceans, rivers, lakes, streams, ponds, drinking water sources, and the like.
In one embodiment, a portable imaging flow cytometer device is disclosed that includes a housing or enclosure containing an illumination source comprising a plurality of colored Light Emitting Diodes (LEDs) (multiple colored LEDs may be present on a single chip) configured for simultaneous, pulsed, or continuous wave operation. The apparatus also includes one or more band pass filters configured to spectrally filter light from the plurality of colored LEDs to adjust coherence of the light illuminating the fluid sample. The imaging flow cytometer device includes a microfluidic device having a microfluidic channel fluidly coupled to a pump (also located in the housing or enclosure in one embodiment) configured to pump a water-based fluid through the microfluidic channel of the microfluidic device. A color image sensor is disposed adjacent to the microfluidic channel and positioned along an optical path containing spectrally filtered light from the plurality of color LEDs. The color image sensor is configured to capture an image frame containing a raw holographic image of an object (e.g., a microorganism) contained in water passing through the microfluidic channel.
In one embodiment, the optical path from the light source to the color image sensor is a folded optical path. This advantageously reduces the overall size of the apparatus. In one embodiment, this may be accomplished using a mirror (e.g., a convex mirror) located in a housing or enclosure. Alternatively, the optical path is not folded, but this may lead to larger device sizes. In one embodiment, the plurality of colored LEDs are pulsed by one or more capacitors that are charged using a charging circuit also included in the device. The portable imaging flow cytometer device also includes or is associated with a computing device configured to receive a plurality of image frames generated by the color image sensor. The computing device may be formed separately from a housing or enclosure that houses the various components of the imaging flow cytometer device. The computing device may include a computer, such as a laptop, personal computer, tablet, etc., co-located with the imaging flow cytometer device. Alternatively, or in addition, a remote computer such as a server or the like may be used for image processing. Preferably, the computing device uses a Graphics Processing Unit (GPU) for image processing to increase the processing speed of the imaging flow cytometer device so that it can produce real-time or near real-time results. The computing device includes image processing software embodied therein (or executed thereby) that is configured to, among other things, perform background subtraction and automatically detect objects in acquired image frames. In one embodiment, a user of the imaging flow cytometer device interfaces with image processing/control software using a Graphical User Interface (GUI).
The image processing software is further configured to reconstruct a phase and/or intensity image of the detected object for each of the acquired LED color holograms. In one particular embodiment, the reconstruction is performed using a wave propagation algorithm, such as an angular spectrum-based wave propagation algorithm, to obtain a reconstructed phase image and intensity image (for a total of six images about the candidate object of interest) for each color channel. In a preferred embodiment, the image processing software also includes a trained deep neural network that utilizes the reconstructed phase and/or intensity images as input. The trained deep neural network then outputs phase-recovered phase and/or intensity images, which are then digitally generated (e.g., combined) to create a phase-contrast image of the detected object, in one embodiment. In an alternative embodiment, the image processing software is configured to automatically characterize or identify the type of object detected. The image processing software may be implemented in any number of software programs or languages. Examples include, but are not limited to, C/C + + and CUDA Application Program Interfaces (APIs). The deep neural network may be implemented using the NVIDIA CUDA deep neural network library (cuDNN), although the invention is not limited to this particular implementation.
In one embodiment, a method of imaging an object using an imaging flow cytometer device includes: while pumping or otherwise flowing a fluid containing an object through the microfluidic channel, a plurality of image frames of the object are obtained. Background subtraction operations are performed using image processing software to remove artifacts, dust, dirt, etc. Then, potential objects of interest are identified after background subtraction using image processing software. Next, the image processing software reconstructs an intensity and phase image of the subject. These reconstructed object intensity and phase images, although improved in resolution compared to holograms, still have artifacts such as double image artifacts. To address this problem, the reconstructed intensity and phase images of the subject are then input into a trained deep neural network executed by image processing software, wherein the trained deep neural network outputs phase-recovered intensity and phase images of the subject. Phase-recovered intensity and phase images of the subject may then be digitally generated or computed (e.g., combined) to create a phase-recovered phase-contrast image of the detected subject.
In another embodiment, an imaging flow cytometer device uses a monochromatic image sensor and a corresponding light source that may include a single light source. For example, this configuration may be sufficient for object or particle counts or object classifications that do not require additional color information.
In another embodiment, the color image sensor is used in conjunction with a near Infrared (IR) light source. This may include LEDs, laser diodes, or other light sources. Additionally, in various embodiments, one or more filters may be omitted (which includes monochrome embodiments as well as color embodiments). For example, if more narrow band imaging sources are used, the filter can be omitted altogether.
In one embodiment, some or all of the objects may be identified prior to reconstruction (e.g., using the hologram itself). In this embodiment, for example, only a small subset of objects may then be reconstructed, as opposed to the entire image frame.
Imaging flow cytometer devices require computing devices for processing acquired data (i.e., images) and/or controlling the imaging flow cytometer device itself. This may be done using a local computing device connected to or integrated into the imaging flow cytometer device itself. For example, any number of local interfaces may be used, including wired connections such as USB, GigE, Ethernet, and the like. Wireless connections may also be used. In other embodiments, some aspects of the processing of the acquired data and/or the control of the imaging flow cytometer device may be divided between the local computing device and the remote computing device. For example, a local computing device may be used to control the operating parameters of the imaging flow cytometer device, while a remote computer (e.g., a server) may be used for image processing.
In one embodiment, a portable imaging flow cytometer device is provided that includes a housing or enclosure. At least one illumination source is disposed in the housing or enclosure and is configured for pulsed or continuous wave operation. A microfluidic channel (e.g., a portion of a microfluidic device) is disposed in the housing and is fluidly coupled to a fluid source containing an object therein that is configured to flow through the microfluidic channel. An image sensor is disposed adjacent to the microfluidic channel and on an optical path that receives light from the at least one illumination source that passes through the microfluidic channel, the image sensor configured to capture a plurality of image frames containing a raw holographic image of an object that passes through the microfluidic channel.
The portable image flow cytometer device is in communication with a computing device having image processing software executed thereon or thereby configured to perform background subtraction and automatically detect moving objects (e.g., microorganisms) in a plurality of image frames. The image processing software is further configured to segment the moving object in a plurality of frames and autofocus the moving object to identify a height (z) location of the moving object within the microfluidic channel. In one embodiment, the image processing software is further configured to reconstruct a phase and/or intensity image of the moving object for each color (e.g., red, blue, green). For example, the reconstruction may be performed using a wave propagation algorithm based on an angular spectrum. The image processing software may further include a trained deep neural network, wherein the reconstructed phase and/or intensity images are input to the trained deep neural network that outputs phase-recovered intensity and/or phase images of the moving object. Alternatively or additionally, the phase recovered intensity and phase images may be combined to generate a phase recovered phase-contrast image of the moving object.
In another embodiment, a method of imaging an object using a flow cytometer device includes: a plurality of image frames are obtained while flowing a fluid containing an object (e.g., a microorganism) through a microfluidic channel. A background subtraction operation is performed using image processing software to remove artifacts. After background subtraction using image processing software, a moving object is identified in a plurality of image frames. Reconstructed intensity and phase images of the moving object are generated using image processing software. The reconstructed intensity and phase images of the moving object are then input into a trained deep neural network executed by image processing software, wherein the trained deep neural network outputs phase-recovered intensity and/or phase images of the moving object or phase-recovered phase-contrast images of the moving object.
In another embodiment, the trained deep neural network (used to output the phase-recovered images) is replaced with a trained neural network classifier that classifies the observed moving objects into one or more object types. For example, a trained neural network classifier receives as input reconstructed intensity and phase images of a moving object and then outputs whether the object is a particular type of binary output (i.e., yes or no). For example, a trained neural network classifier can be used to classify microorganisms as a particular species or phenotype.
In another embodiment, a method of imaging an object using a flow cytometer device includes: obtaining a plurality of image frames while flowing a fluid containing an object through a microfluidic channel; and performing a background subtraction operation using image processing software to remove the artifacts. The moving object is identified in a plurality of image frames after background subtraction by image processing software. Image processing software is used to reconstruct intensity and phase images of the moving object. The reconstructed intensity and phase images of the moving object are then input into a trained deep neural network executed by image processing software, wherein the trained deep neural network outputs a refractive index profile inside the moving object. Alternatively, or in addition to the refractive index profile inside the moving object, the trained deep neural network may also output the thickness of the moving object. In one particular embodiment, the refractive index profile may be used as a surrogate to measure the composition (e.g., chemical or lipid content) of a microorganism.
Drawings
Fig. 1 shows a photograph of a flow cytometer imaging system including an imaging flow cytometer device, a sample-containing fluid source, and a computing device. A schematic of the microfluidic channels and imaging subsystem of the flow cytometer device is also shown in panel a. Panel B shows a photographic image of the housing or shell of the imaging flow cytometer device in an open state, showing the various components. The side of panel B is a photographic image of the dashed area of panel B showing the microfluidic device with microfluidic channels. Also seen in the illumination source and filter.
Fig. 2 shows a photograph taken by the imaging flow cytometer device with the housing or case open.
Fig. 3 shows a cross-sectional view of a microfluidic channel showing a moving object (in the direction of arrow a) flowing through the microfluidic channel.
Fig. 4A shows an exploded view of components of an imaging flow cytometer device in accordance with one embodiment.
Fig. 4B shows a perspective view of the assembled imaging flow cytometer device of fig. 4A with the top or cover removed for clarity (with the mirror and frame visible).
Fig. 5 shows one example of a Graphical User Interface (GUI) for use on a computing device (e.g., a laptop computer) used in conjunction with an imaging flow cytometer device. The image shows the complete field of view (FOV).
Fig. 6 shows another example of a Graphical User Interface (GUI) for use on a computing device (e.g., a laptop computer) used in conjunction with an imaging flow cytometer device. The smaller images show different reconstructed images of the cropped object detected in a single frame.
Fig. 7 schematically illustrates the operation of image pre-processing, high resolution color reconstruction and Deep Neural Network (DNN) based phase recovery. Image pre-processing involves background subtraction to remove artifacts, followed by resampling, object segmentation and auto-focusing to identify candidates of interest. High resolution color reconstruction may generate reconstructed intensity and phase images based on holographic images of the object. The reconstructed intensity and phase images for each color channel are input into a trained neural network to generate recovered intensity and/or phase images. The phase-recovered intensity and phase images in the red, green and blue channels are fused to generate the final phase-contrast image for each subject (shown within the black dashed box on the right).
Fig. 8 illustrates a segmentation algorithm utilized by image processing software used with an imaging flow cytometer device. The spatial gradient of the full field of view background subtraction hologram is calculated to detect a rapidly oscillating holographic diffraction pattern of objects present in the image. The gradients are set to a threshold to create a binary image, and morphological sealing is performed to obtain a single mask signature from each object. The center coordinates of the mask are calculated and used to segment the entire field-of-view hologram into sub-holograms containing a single object (e.g., a living being).
Fig. 9A shows the architecture of a Convolutional Neural Network (CNN) for holographic image reconstruction. For the RGB intensity (× 3) and RGB phase channels (× 3), each input matrix is 1024 × 1024 pixels, i.e., 6 channels are formed in total. The network output is the RGB intensity and RGB phase for phase recovery and dual image cancellation of the flowing object. They can be combined to create the final phase contrast image of the object.
Fig. 9B schematically shows a computing device docked with an imaging flow cytometer device. The computing device includes image processing software and control software for controlling various aspects of the imaging flow cytometer device.
FIG. 10 shows images of various marine plankton detected by flow cytometry on the coastline of los Angeles, represented by their (a-1 to 1-24) original holograms and (b-1 to b-24) phase pair weights built after phase recovery. The organism is identified as: (1) hirsutella lofoenum, (2) chaetoceros mollissima, (3) chaetomium globosum, (4) laodera, (5) leptocystis, (6) nitzschia, (7) fuscophyta, (8) chaetoceros bifidus, (9) eucommia cutis, (10) sporulopsis, (11) senecia, and (12) ostemonis, (13) ciliate, (14) chaetoceros, (15) schoenophyta, (16) detritus, (17) sargassum, (18) klebsiella kerkenensis, (19) saratina, (20) oceanic protodinoflagellate, (21) zoysia multilateralis, (22) finula, (23) small-grade diatoms (siliceous skeleton), and (24) collina. The dashed rectangle in panel (a-1) represents a segmented and 45 rotated region corresponding to the reconstructed image.
Figure 11 shows a phase contrast color image depicting plankton found near the coastline of los angeles and imaged by a flow cytometer at a flow rate of 100 mL/h.
Figure 12 shows a map of the coastline of the region of los angeles and a chart showing the prevalence of rhomboidium in the ocean. Samples were collected according to california public health department (CDPH) protocol. A portion of each sample was analyzed by the imaging flow cytometer system and the remaining portion was sent to the CDPH for subsequent analysis, which is in good agreement with our measurements. The inset shows an example of phase contrast reconstruction of a rhombohedral alga that can produce alginic acid, a dangerous neurotoxin that can cause amnestic shellfish poisoning.
Fig. 13 shows a chart showing field test results from a series of seawater measurements obtained at the thunderpest beach. Up to 1.5m of the ocean was sampled every 2 hours and changes in plankton concentration were measured or observed over time. Measurements were started at sunrise (6.21AM) and each sample was imaged in situ using a flow cytometer. The results show that total plankton counts increased during the day, while the number of rhombohedral algae peaked in the morning hours.
Fig. 14A to 14F show the effect of increasing the liquid flow rate in the system on the image quality. The relative flow velocity distribution within the rectangular channel cross section is at the upper left (fig. 14F). These measurements were performed on a marine sample containing a high concentration of Pholiota fuliginea, and thus, it was used as a model organism for this test. The samples were tested at various flow rates above 100mL/h, keeping the 120- μ s-illumination pulse length constant. Objects located near the region of maximum flow velocity (usually the central region) within the channel are selected and their positions are displayed as points. Fig. 14A to 14E are reconstructed intensities corresponding to different flow rates. The flow rate (mL/h) and the theoretically calculated displacement (μm) during the illumination pulse are also shown.
Fig. 15 shows a deep learning based extended depth of field (DOF) reconstruction of giardia migratoria. The raw hologram captured by the image sensor is divided into a number of individual color channels and reconstructed at a height approximately corresponding to the center of the channel. This initial reconstruction is used as an input to a deep neural network that is trained to reconstruct holograms in a single step, regardless of their object height, thus automatically performing the functions of auto-focusing and phase recovery; thereby generating an extended depth of field image of the scene by reconstructing the focus images of all the particles simultaneously. (bottom row) the same original hologram was reconstructed separately by auto-focusing each particle. The particles are rebuilt at different heights of the flow channel height (0-800 μm); comparison between the top and bottom rows clearly shows that the entire volume can be merged into one plane (top right) using extended DOF reconstruction based on deep neural networks, so that dense water samples can be reconstructed without being limited by locally available computational power.
Fig. 16 shows the imaging performance of the imaging flow cytometer device. The air force test chart of 1951 was placed at seven different distances (z) from the plane of the CMOS sensor, corresponding to the height range of the microfluidic channel. The graph with a height of about 550 μm is element 3 of group 8, corresponding to a line width of 1.55 μm. Above this height, the coherence of the light steadily decreases the achievable resolution with z-distance, and the top of the channel resolves to a line width of 1.95 μm, corresponding to element 1 of group 8.
Fig. 17A schematically illustrates a flow cytometer imaging system used in conjunction with a neural network classifier trained on reconstructed images to detect and enumerate specific microorganisms.
Fig. 17B shows details of a DenseNet neural network classifier network according to one embodiment.
Fig. 18 shows an example of optical path length difference measurement using an imaging flow cytometer device. For each object in the field of view, the cytometer device obtains not only the intensity, but also phase information for each of the red, green, and blue channels (represented by the corresponding frame colors). The transparent part of the plankton (tiger flea larvae (tigrinopus nauplii)) is not visible in the conventional brightfield (combined intensity) color image, but becomes visible in phase (combined phase) due to the refractive index mismatch between the exoskeleton and the surrounding water. For visualization, a phase contrast image may be generated to fuse intensity and phase to obtain a high contrast color image of the object. Also, an optical path length difference (optical path difference image-lower right) containing information on the thickness of the object and the refractive index distribution can be calculated.
Detailed Description
Fig. 1 shows a photographic image of a flow cytometer imaging system 2 incorporating an imaging flow cytometer device 10 that, in one embodiment, obtains an image of a moving object 12 moving in the direction of arrow a, such as the image seen in fig. 3, the moving object 12 passing through a microfluidic channel 14 of a microfluidic device 16. The moving object 12 is carried in a flowing fluid within the microfluidic channel 14. The flowing fluid is typically a water-based fluid, such as water. Fig. 1 also shows a schematic diagram of various internal components of the imaging flow cytometer device 10 (in image panel a). Image panel B shows a photographic view of the internal workings of imaging flow cytometer device 10 with housing or enclosure 18 in an open state. The housing or enclosure 18 may include a bottom 20, as best seen in fig. 4A, the bottom 20 containing most of the components of the imaging flow cytometer device 10. Housing 18 may include a lid or top 22 that, in one embodiment, is hinged or connected to bottom 20 and may open/close to provide access to the interior of housing 18. The overall size of the imaging flow cytometer device 10 housed in the housing or enclosure 18 is small enough that the imaging flow cytometer device 10 is portable and can be moved from one location to another. In one embodiment, the imaging flow cytometer device 10 weighs about 1kg or less and has a total volume of less than about 3,000cm3. For example, the imaging flow cytometer device 10 may have dimensions of, for example, approximately 15.5cm by 15cm by 12.5 cm. The imaging flow cytometer apparatus 10 is significantly more compact, lighter in weight and extremely cost effective than other imaging flow cytometers, with component costs below $ 2500, which is only a fraction of the cost of existing imaging flow cytometers.
As shown in fig. 1 and 9B, the system 2 further includes a computing device 24 operatively connected to the imaging flow cytometer device 10. In one embodiment, the computing device 24 is used to control various operational aspects of the flow cytometer device 10 using the control software 30 and/or image processing software 28. This includes controlling the rate at which fluid containing subject 12 is pumped through imaging flow cytometer device 10, imaging parameters (e.g., the intensity of the various colored light sources described herein), and camera settings (e.g., frame rate, exposure time of the LEDs, gain, color ratio, etc.).
The control software 30 and/or image processing software 28 of the computing device 24 may also be used to view, control, or modify reconstruction parameters used to reconstruct phase and amplitude images, as described herein. The control software 30 and/or the image processing software 28 may also be used to calibrate parameters required to reconstruct a high resolution image of the subject. This includes angular compensation (θ, Ψ) for the red, green, and blue LEDs. The control software 30 and/or image processing software 28 of the computing device 24 may also be used to view and save various images (including holographic images, reconstructed images, and phase-restored images). For example, in one particular embodiment, the phase recovered intensity image and the phase recovered phase image are combined or merged to generate a phase recovered phase-contrast image of subject 12. These may be displayed on a display 26 or the like associated with the computing device 24. Fig. 5 and 6 illustrate an exemplary Graphical User Interface (GUI)110 for viewing data and images and controlling various operational aspects of the imaging flow cytometer device 10.
In one embodiment, the computing device 24 includes image processing software 28 for performing imaging and other operations as described more fully herein. This includes, for example, image pre-processing operations such as background subtraction, image resampling, object segmentation, object focusing operations. The image processing software 28 also performs high resolution color reconstruction, in which the holographic image is reconstructed as an intensity and/or phase image. The image processing software 28 may also execute a trained neural network (e.g., a deep neural network or DNN) for generating phase-recovered intensity and/or phase images (or phase-recovered phase-contrast images combining the two). The trained neural network may also be used to identify or classify the type of subject 12 being imaged.
The image processing software 28 is also used to acquire and store a number of image files collected during operation of the imaging flow cytometer device 10. In some modes, real-time data and images may be generated by the image processing software 28. In other modes, image processing software 28 may be used to analyze previously captured images and then transfer them to a computing device or storage medium accessible to computing device 24. The transfer of the image file may occur via wired transmission or wireless transmission. In some embodiments described herein, the image processing software 28 is capable of automatically identifying or classifying the object 12. For example, where the imaging flow cytometer device 10 is used to evaluate a body of water, the image processing software 28 may identify the type of plankton or other microorganisms. The type may refer to a particular microbial species, or may refer to a particular phenotype.
The computing device 24 that may be used with the flow cytometer imaging system 2 may include any number of computing devices, such as a Personal Computer (PC), a laptop computer, a tablet computer, a mobile phone (e.g., a smartphone), a server, and so forth. As described herein, the image processing software 28 preferably executes on a computing device 24 having one or more Graphics Processing Units (GPUs) (which increases the speed at which the image processing software 28 generates images or other output). The computing device 24 may interface with the imaging flow cytometer device 10 via a wired (e.g., USB, etc.) and/or wireless connection (Wi-Fi, bluetooth, etc.). The imaging flow cytometer device 10 may be powered by a power source that may be connected to an AC outlet (and converted to 5V DC by the power source). Alternatively, the imaging flow cytometer device 10 may be powered by one or more batteries (e.g., a 5V battery pack) that may be internal or external to the housing or enclosure 18.
Still referring to fig. 1, imaging flow cytometer apparatus 10 is used in conjunction with a fluid source in which objects 12 are contained. The fluid source may be contained in a receptacle 32, such as a test tube, cuvette, vial, or the like. As shown in fig. 1, two such receivers 32 are provided. Each receptacle 32 is connected by tubing 34 to an inlet 40 and an outlet 42 (best seen in fig. 2) respectively of a microfluidic device 16 containing a microfluidic channel 14 as described herein. First receiver 32 is used to draw fluid into imaging flow cytometer device 10, while second receiver 32 is used to receive fluid that has passed through imaging flow cytometer device 10. Thus, one receptacle 32 is for fluid input and the other receptacle 32 is for fluid output. The fluid source 32 contained in the receiver 32 that passes through the imaging flow cytometer apparatus 10 is one embodiment, an aqueous or water-based fluid. The aqueous-based fluid may comprise a sample of water obtained at a natural or artificial body of water. Examples include oceans, rivers, lakes, streams, ponds, drinking water sources, and the like.
Referring to fig. 1 and 2, an imaging flow cytometer device 10 includes a microfluidic device 16 having a microfluidic channel 14 formed in the microfluidic device 16 in communication with an inlet 40 and an outlet 42. The microfluidic device 16 may be formed as a laminate or unitary structure and held within a holder 39 within the housing or enclosure 18. The microfluidic device 16 may take the form of, for example, a chip or a flow cell. The microfluidic device 16 may be inserted into the holder 39 and removed from the holder 39 as needed (e.g., the microfluidic device 16 may be a disposable component that is replaced after each use). The microfluidic device 26 is formed of an optically transparent material (e.g., an optically transparent polymer or glass) such that light from a light source can pass through the microfluidic channel 14, thereby enabling a holographic image of the object 12 contained in the fluid to be captured by an image sensor as described herein. The size of the microfluidic channel 14 may vary from tens or hundreds of micrometers to greater than 1 mm. The dimensions of the microfluidic channel 14 should be large enough so that the microfluidic channel 14 does not become clogged in response to fluid flow. The microfluidic channel 14 of the test described herein has a height of 800 μm and a width of about 5 mm. By increasing the cross-sectional dimension (e.g., height or width), higher flux rates can be achieved.
A pump 44 is disposed in the housing or enclosure 18 and is used to pump fluid containing the subject 12 from the receptacle 32 into the microfluidic channel 14 of the microfluidic device 16. Fluid exits the receptacle 32 and is pumped by the pump 44 into the inlet 40 where it continues to flow down the microfluidic channel 14 and then out through the outlet 42. Fluid exiting the microfluidic device 16 is emptied into the receiving receptacle 32 through the conduit 34. The pump 44 may comprise a peristaltic pump (e.g., Instech p625) as described herein. Other types of pumps 44 include microfluidic pumps or any other pump capable of pumping fluid through the microfluidic channel 14. The control software 30 may be used to vary the flow rate of the pump 44. In some embodiments, the presence of the pump 44 in the imaging flow cytometer device 10 is optional. For example, the pump 44 may be external to the imaging flow cytometer device 10. In another embodiment, the imaging flow cytometer device 10 may be placed in series with another system or process, and the pumped flow may be used to push or pull fluid through the microfluidic channel 14.
The image sensor 46 is disposed adjacent to the microfluidic device 16 and the microfluidic channel 14 such that an active area of the image sensor 46 surrounds an area of the microfluidic channel 14. As described herein, the active area of the image sensor 46 may be centered on the center of the microfluidic channel 14. There may be a small air gap of a few microns or the like on the bottom surface of the microfluidic channel of the active area of the image sensor 46, although in other embodiments the active area may be in contact with the surface of the microfluidic channel 14. In one embodiment, when a multicolor light source is used, the image sensor 46 used is a color image sensor 46. Examples of such color image sensors include a camera 47 having a CMOS color image sensor 46 with a pixel size of 1.4 μm, such as Basler aca4600-10uc (Basler AG, Germany). The color image sensor 46 may be powered via a cable (e.g., a USB cable) that is also used to transmit images (i.e., image frames) captured by the color image sensor 46. In some other embodiments, the imaging flow cytometer device 10 may use a monochrome image sensor 46. In such an embodiment, a multicolor light source is not required. For example, when a lower level of resolution is required, such as object counting, the monochrome image sensor 46 can be used.
A light source 50 is disposed in the housing or enclosure 18 and is used to provide illumination for illuminating objects 12 contained in the fluid flowing through the microfluidic channel 14. In one embodiment, light source 50 is a polychromatic light source that emits light in a plurality of discrete wavelength ranges or bands. For example, multi-color LEDs may be used to emit red, green, and blue light. Examples include surface-mountable RGBW LEDs with individually addressable red, blue and green LED dies that are used to create polychromatic light while driving the polychromatic light to illuminate microfluidic channel 14 containing a flowing fluid. An example of such a multi-colored light source 50 is an LZ4-04MDPB emitter manufactured by LED engine. A three-way output LED driver controller circuit 52(LT3797, linear driver) is provided to drive the light source 50.
Referring to fig. 1 and 4A, in one embodiment, a plurality of filters 54 are provided to adjust the coherence of the light illuminating the microfluidic channel 14. Fig. 1 shows two such filters 54, which are triple bandpass optical filters (Edmund optics #87-246, Chroma inc.69015m) to increase the temporal coherence of the illumination. The filter is spaced from the spacer 55 and held in a holder 57 and held by a cap 59 (see fig. 4A). However, it should be understood that in other embodiments, only a single filter 54 may be required. In other embodiments, where the coherence of the light source 50 is sufficiently narrow, the filter 54 may not even be needed.
During operation of the imaging flow cytometer device 10, different LEDs of the polychromatic light source 50 are simultaneously pulsed on. The image sensor 45 operates in a global reset release mode and the pulse width is adjusted to not allow an object 12 traveling at maximum speed within the microfluidic channel 14 to move beyond the width of a single sensor pixel. For a flow rate of 100mL/h, this corresponds to a pulse length of 120. mu.s.
To pulse the different LEDs, the high current pulses are stored in three 0.1-F capacitors 56, which are charged to 12V using a capacitor charger controller 58(LT3750, Linear Technologies). The capacitor charge is initiated by an image sensor flash window trigger signal that is active during frame capture and whose length can be controlled by the camera/image sensor 46 software driver. The charger controller 58 attains an "on" state and continues to charge the capacitor until a preset voltage level of 12V is reached. During the short illumination pulse, the voltage on the capacitor only drops slightly, and the capacitor is recharged immediately at each frame capture reset charge cycle, allowing continuous operation.
The LEDs are synchronized and their constant current operation is ensured by the drive circuit 52. The controller 58 uses the same flash window signal from the image sensor 46 to turn on the LEDs of the light source 50 for the software-set exposure duration. The current per LED per pulse of the circuit remains constant and therefore the illumination intensity per holographic frame remains constant.
In another alternative embodiment, the light source 50 operates in continuous wave operation without producing light pulses. For example, when the image sensor 46 is operated in a "pulsed" mode to capture multiple image frames, the multi-color LED of the light source 50 may be simultaneously illuminated for successive periods of time (e.g., while performing sample analysis). The image sensor 46 can be operated at, for example, very fast shutter/image capture speeds using various options well known to modern camera systems. In this regard, the moving object 12 produces a similar image, but instead of the pulsed light source 50, the image sensor 46 operates in a pulsed mode. Of course, the use of the continuous wave light source 50 eliminates the need for the capacitor 56 and associated charge controller 58.
Referring to fig. 1, 4A, 4B, the housing or shell 18 includes a mirror 60, which in one embodiment is a convex mirror 60 mounted in the lid or top 22 by a mirror mount 62. The reflector 60 reflects light from the light source 50 before reaching the microfluidic channel 14, thereby increasing spatial coherence while allowing a compact and lightweight optical setup. In this regard, a folded optical path is formed whereby light emitted by the light source 50 is reflected onto the microfluidic channel 14, whereby a hologram of the object 12 in the fluid is projected onto the image sensor 46 and captured by the image sensor 46. In an alternative configuration, the light path between the light source 50 and the microfluidic channel 14 is not folded, however, this will move the light source 50 further away and increase the overall size of the device 10. While single reflection is used as part of the folded optical path, it should be understood that additional reflection (i.e., folded optical paths) other than that shown may be used.
As best seen in fig. 4A, a frame or support 64 is provided and secured within the bottom 20 of the housing 18 that houses the various components. This includes, for example, a mounting bracket 66 for the camera 47 and a mounting bracket or holder 68 for the LED driver circuitry 52 and the light source 50 (e.g., LED chip). A separate bracket 70 is provided for the pump 44. A holder 72 is also provided for the microfluidic device holder 39. The frame 64 also includes a support 74 for a microcontroller 76, which serves as an interface for i2c communication.
Experiment of
Imaging flow cytometer apparatus 10 was tested for water samples taken from the coastline ocean in los angeles. The sample is imaged at a flow rate of 100mL/h and the original full FOV image information is saved in the computing device 24 in the form of a laptop computer (also used to control the operation of the imaging flow cytometer device 10). As shown in fig. 5 and 6, the plankton holograms have been automatically subdivided as described in detail herein (e.g., fig. 7, 8, and related descriptions) and reconstructed by the computing device 24 using a deep convolutional network, and phase contrast color images of planktons are computed and stored into the local laptop computing device 24, which also controls the imaging flow cytometer via the customized GUI 110. Fig. 10 highlights the performance of the reconstruction process employed by the image processing software executed by the computing device 24, which enables automatic depth learning, and the image quality achieved by the imaging flow cytometer device 10, showing several plankton with the initial segmented original image (hologram) and the final phase contrast image (in one preferred embodiment, color). Most of these plankton types are detected by the imaging flow cytometer device 10 based on the reconstructed image, as detailed in the image of fig. 10. Figure 11 also shows other options for unidentified plankton imaged in the same marine sample. A portion of each measured water sample is also sent by their expert to CDPH for comparative microscopy analysis, and the qualitative composition of the different species found in each water sample is in good agreement with the measurements of the imaging flow cytometer device 10. In addition, for quantitative comparison to routine analysis performed on CDPH, potentially toxic rhomboidium algae were selected and their relative abundance was assessed at six different measurement locations (i.e., public beaches) on the coastline of los angeles. As summarized in fig. 12, the flow cytometer imaging results also agreed well with CDPH analysis results.
The field portability of the imaging flow cytometer device 10 was performed by operating the imaging flow cytometer device 10 on site at the leidongduo beach terminal, where the experiment was performed for 8 hours. The imaging flow cytometer device 10 itself is powered by a 5V battery and may run for several hours. During field experiments (from 6:30AM to 2:30PM), the laptop computing device 24 was powered using a 500-Wh 19-V external battery pack. In these field experiments, the time evolution of the total concentration of plankton in the ocean was measured in the morning and it was found that during the day, the number of micro-plankton increases at 1.5m on top of the seawater, possibly due to vertical migration (see fig. 13). The number of rhomboidogyne found in these samples was also counted manually and was observed to peak in the morning (about 8: 30AM) and then steadily decline (fig. 13); overall, the prediction of these trends is rather complex, as they are influenced by various factors, such as the composition of the local microbial community, the tide and rise/sink patterns. These results demonstrate that the imaging flow cytometer apparatus 10 is capable of periodically measuring and tracking plankton composition and concentration of a water sample on site for continuous hours without the need for connection to a power grid.
The throughput of any imaging flow cytometer is determined by several factors, but most importantly it is controlled by the desired image quality. Imaging flow cytometer device 10 is designed to achieve the highest resolution allowed by the pixel size of image sensor 46, resulting in a tight photon budget due to the loss of illumination intensity that does not achieve sufficient spatial and temporal coherence over the sample volume, and the need for pulsed illumination to eliminate motion blur. Due to the rapid flow of the object 12 in the microfluidic channel 14, the resolution of the reconstructed image cannot be increased to the sub-pixel level using the pixel super resolution method. The experiment was carried out at a rate of 100 mL/h; however, this throughput can be increased by a factor of three without any modification of the device 10, at the cost of some motion blur. By using a microfluidic channel 14 with a higher height (e.g. >1mm), its throughput can be increased even further. To demonstrate this, we imaged marine samples with a flow rate of up to 480 ml/hour (see fig. 14A to 14F). The reconstruction results obtained show that the imaged algae (horn harpoons) are still easily identifiable despite the increased flow rate.
In addition to physical volume throughput, the processing speed of the computing device 24 (e.g., laptop) may also be a limiting factor, primarily affecting the maximum density of samples that can be processed in real-time. The imaging flow cytometer device 10 is designed to enable real-time operation, i.e., the computing device 24 processes information faster than the information provided by the image sensor 46 to avoid memory overflow. Currently, the imaging flow cytometer device 10 may operate in three modes depending on the sample density. In the first mode, the imaging flow cytometer device 10 may acquire and save the complete FOV hologram and perform all reconstruction and phase recovery steps after the measurement, which is a necessary method for high concentration samples (e.g., >2,000 and 3,000 objects/mL). Even dense samples can be analyzed by the imaging flow cytometer device 10, for example by diluting them accordingly or reducing throughput. In the second mode, the image processing software of the computing device 24 may reconstruct the hologram, but does not perform phase recovery of the detected object 12 during the measurement. Currently, the image segmentation and reconstruction process takes approximately 320 milliseconds per complete FOV frame, where seven (7) objects can be reconstructed for each image by parallel computations on a GTX 1080 GPU. The main calculation operations are: (1) the entire FOV hologram is segmented for object detection (about 70ms), (2) holographic autofocus and reconstruction (about 12 ms/object), and (3) the final amplitude and phase images (8 bits, 1024 × 1024 pixels × 3 color channels) are transferred from the device (i.e., GPU) to the host (i.e., central processor) and saved on an internal solid state drive (about 10-20 ms per object). Thus, in the case of reconstructing rather than phase recovering the subject 12, the imaging flow cytometer device 10 may image a sample having approximately 700 subjects/mL in real-time at a flow rate of 100 mL/h.
In a third mode of operation, the imaging flow cytometer device 10 involves performing image reconstruction and phase recovery steps on all of the flowing objects 12 during a measurement. Currently, the phase recovery step based on deep learning is the most intensive part of the image processing algorithm, with a run time of about 250 milliseconds per object. Thus, if real-time phase recovery is required in this third mode of operation, it will limit the sample density to about 100 objects/mL at a flow rate of 100 mL/h. As GPU performance increases by an average of 1.5 times per year, these computational performance limitations will be partially overcome over time as GPU performance increases. Furthermore, a convolutional neural network can be used to focus all objects in the hologram simultaneously, which extends the depth of field of the holographic reconstruction by >25 times compared to conventional methods. This would allow combining the phase recovery, autofocus and image reconstruction steps into a single neural network, making the computation time of the full FOV independent of the density of the particles, allowing real-time imaging of high density fluid samples. In practice, this method has been tested to reconstruct objects 12 in a microfluidic channel 14 of 800 μm (height) and found to produce good results regardless of the height of the objects 12 inside the microfluidic channel 14 (see fig. 15).
Although the imaging flow cytometer device 10 tested was field portable, this particular embodiment was not completely waterproof and could not be operated above water level. This prototype can be run within 100 meters of the control computing device 24 (e.g., a laptop computer) by simply changing the USB3 camera connection to GigE and constructing a remote microcontroller communication setup similar to the OpenROV diving platform. System 2 has a very low cost (< $ 2,500) for its components due to its low hardware complexity compared to other imaging flow cytometer technologies, and is capable of high volume production, and therefore less than $ 760 for its manufacturing cost (see table 1 below). This extraordinary cost-effectiveness provides various exciting opportunities for environmental microbiology research, and may allow the creation of computational imaging cytometry networks at affordable prices for large-scale, continuous monitoring of marine plankton composition and marine microbiome (or other bodies of water).
TABLE 1
| Assembly | Single Device (USD) | Mass apparatus (USD) |
| Pump and method of operating the same | $700 | ~$420 |
| Image sensor with a plurality of pixels | $676 | ~$115 |
| Lighting circuit | ~$300 | ~$110 |
| Optical filter | $400+$375 | <$100 |
| Flow channel | ~$15 | <$10 |
| Total price | ~$2466 | <$755 |
Method of producing a composite material
Optical system
The imaging flow cytometer device 10 uses a color image sensor 46 with a pixel size of 1.4 μm (Basler aca4600-10 uc). The housing of the camera 47 is removed and the circuitry rearranged to allow the microfluidic device 16 to be placed directly in contact with the protective cover glass of the image sensor 46 (see fig. 1 and 3). There may be a small air gap (a few microns) between the bottom of the microfluidic device 16 and the image sensor 46. Illumination of imaging flow cytometer device 10 is provided by using red, green, and blue emitters from LED light source 50(Ledengin LZ4-04 MDPB). The spatial and temporal coherence of the light emitted from the LED-based light source 50 is increased to achieve the maximum resolution allowed by the sensor pixel size. Spatial coherence is adjusted to increase the optical path by using a convex mirror 60(Edmund optics # 64-061). The LED light is also spectrally filtered by two triple bandpass optical filters 54(Edmund Optics #87-246, Chroma Inc.69015m) to increase the temporal coherence of the illumination. The placement of the optical components is intended to adjust the bandpass of the spectral filter angles to better match the maximum emission of the LED. The increase in spatial and temporal coherence of the LEDs also reduces the intensity reaching the image sensor 46. The short exposure time required to avoid motion blur necessitates our configuration to utilize a linear sensor gain of 2 when imaging the subject 12 with fast flow. The additional noise generated by the gain is low enough not to interfere with the image reconstruction process.
Micro-fluid channelChannel and flow design
A microfluidic channel 14(Ibidi μ -Slide I) with an internal height of 0.8mm was placed on top of the image sensor 46, fixed using a 3D printed holder 39, and connected to a peristaltic pump 44(Instech p 625). The size of the active area of the image sensor 46 is slightly smaller than the width of the microfluidic channel 14 (4.6mm versus 5mm) and the microfluidic channel 14 is positioned such that the image sensor 46 measures the center of the liquid flow. The flow curve inside the microfluidic channel 14 was calculated by solving the Navier-Stokes equation for the incompressible liquid assumed to be a non-slip boundary condition (see fig. 14F). The results show that the image sensor measures about 98% of the total volume flowing through the microfluidic channel 14. The flow profile is a two-dimensional paraboloid with the maximum flow rate at the center of the microfluidic channel 14, which measures about 1.66 times higher than the average velocity of the liquid (see fig. 14F). To obtain a sharp, focused image of object 12 in a continuously flowing liquid, image sensor 46 operates in a global reset release mode and illuminates the sample with a flash pulse, wherein the length of the illumination pulse is adjusted such that the amplitude of movement of object 12 moving at maximum speed within microfluidic channel 14 is greater than the width of a single sensor pixel. For a flow rate of 100mL/h, this corresponds to a pulse length of 120. mu.s.
Pulse lighting, power supply and control circuit
By operating the LED colors in the current range of 2.2-5A, the brightness of the LED light source 50 can be maximized, since shortening the illumination time also limits the available photon budget. The current is set for each LED emitter to produce a similar level of brightness at the image sensor 46 to ensure that the sample is adequately illuminated in each color, which is a requirement to obtain a color image. The green LED spectrum is inherently wider than the red and blue counterparts, and therefore, the spectral filter 54 will reduce its intensity to the maximum. Thus, the green LED operates at the experimentally determined maximum possible current of 5A. The red and blue LEDs require a current of about 2.2A to match the intensity of the green LED on the image sensor 46 to correct the white balance. The components of the imaging flow cytometer device 10 are controlled using control circuitry. The circuit is powered by a 5V wall-mounted power supply or a mobile phone charger battery pack. The control circuit accomplishes four main tasks: the peristaltic pump 44 is powered, the capacitor 56 is charged to power the LED-based light source 50, the LEDs are synchronized with the image sensor 46 and generate stable, short, high current pulses, and finally, an interface for remote control is provided through the computing device 24 using an inter-integrated circuit (i2c) interface to set various parameters. The peristaltic pump 44 was powered by an efficient boost DC-DC converter at 16V (TPS61086, Texas Instruments) with speed controlled by a potentiometer through an i2c assembly (TPL0401B, Texas Instruments). The charge of the high current pulses is stored in three 0.1F capacitors 56, which are charged to 12V using a capacitor charger controller 58(LT3750, Linear Technologies). The capacitor charge is initiated by an image sensor flash window trigger enable signal, which is active during frame capture and whose length can be controlled by the camera software driver. The charger controller 58 attains an "on" state and continues to charge the capacitor 56 until a preset voltage level of 12V is reached. During the short illumination pulse, the voltage on capacitor 56 decreases only slightly, and as each frame captures the reset charge period, they charge immediately, enabling continuous operation. The LEDs are ensured to be synchronized and to operate at constant current by a three-way output LED driver controller 52(LT3797, Linear Technologies). The controller 52 uses the same flash window signal from the image sensor 46 to turn on the LEDs of the light source 50 for the exposure duration set by the software. The current to each LED was controlled between 0-12.5A using a digital i2c potentiometer (TPL0401B, Texas Instruments) and held constant by the circuit 52 for subsequent pulses, maintaining the same illumination intensity for each holographic frame. During start-up, approximately 3-4 frames are required for circuit 52 to settle at a constant light level. To avoid having multiple devices with the same address on the i2c line, an address translator (LTC4317, Linear Technologies) was used to interface with the potentiometers controlling the red and blue LEDs. To control the circuitry, the computing device 24 (e.g., a laptop computer) communicates with an Arduino microcontroller 76 (TinyDuino from tinycircus) that serves only as an interface for i2c communications.
Hologram reconstruction based on object detection and based on deep learning
Referring to fig. 7, for automated detection and holographic reconstruction of target objects 12 found in a continuously flowing water sample, the static objects 12 (e.g., dust particles in the flow channel) found in the original full FOV image 80 need to be eliminated first. This is achieved by calculating a time-averaged image of about the first 20 images 80 (containing only static objects) and subtracting it from the current original hologram. To ensure proper reconstruction quality, the mean of this subtracted image is uniformly added back to the current frame. This results in a background subtracted full FOV image 82 in which only the hologram of the object 12 newly introduced by the stream is displayed, as shown in fig. 7. These objects 12 are automatically detected and segmented from the full FOV for individual processing as shown in fig. 8. The full FOV background subtracted hologram 82 is first gaussian filtered and then converted to a binary image by a hard threshold 86 with its statistical value (mean +1.5 x standard deviation), as shown in operation 84 (fig. 8), thereby isolating the peak of the holographic signature created by the object contained in the FOV. The binary contour with several pixel regions is removed to reduce false detection events due to sensor noise. A close operation is performed in the generated binary image 88 to create a continuous patch for each object 12. The resulting binary contours represent the shape and position of the object 12 present in the FOV and their morphological information is used to filter each contour by some desired criteria (e.g., principal axis). The center coordinates of the filtered contours are used to segment their respective holograms. By this approach, not only all objects 12 in the FOV may be extracted, but objects 12 of interest may also be prioritized for a particular target. Using this method, the computational resources of the computing device 24 can be better utilized and real-time processing of the higher density samples maintained.
After segmentation, as seen in operation 90 (fig. 7), the hologram of the bayer array is separated into three monochromatic (i.e., red, green, and blue) holograms, which correspond to the illumination wavelengths. To fully exploit the spatial resolution of the optical system, the orientation of the bayer array green pixels is rotated by 45 ° to adjust its sampling grid. At the same time, the red and blue monochromatic holograms are up-sampled by a factor of two, and then a 45 rotation is applied to these up-sampled holograms as shown in operation 92. Note that the full FOV de-bayer image may first be segmented (operation 92) without applying any rotation. After the segmentation is complete, the raw bayer, background subtracted hologram is then subjected to a rotation operation 92. Holographic autofocus using Tamura of complex gradients, as shown in operation 94, is performed on each segmented object 12 using only a single monochromatic hologram to accurately estimate the distance of the respective object 12 from the imaging plane of the image sensor 46. At this point, each object 12 in the stream is positioned in 3D (by FOV). The coordinates of each detected object 12 are then used in conjunction with the calculated estimated flow profile and the position of each object 12 is predicted in the next frame. If an object 12 is found at the predicted coordinates, it is marked as deleted from the total number and processing workflow to avoid reconstructing and counting the same object 12 multiple times.
The next step is to maximize the resolution of the reconstruction by further up-sampling the resampled hologram by a factor of four as seen in operation 96. Each color channel is then propagated by the wave propagation algorithm to the obtained reconstruction distance, focusing it, as shown in operation 98. In a particular embodiment, the wave propagation algorithm is an angular spectrum based wave propagation algorithm. Details regarding wave propagation algorithms based on angular spectra may be found in Z.& ozcan, found in biomedical imaging on a chip, IEEE version. Eng.6, 29-46 (2013), which is incorporated herein by reference. By performing four (4) successive angular spectrum propagations, each corresponding to a material and its respective thickness, the different refractive indices of the materials present in the optical path, i.e. the air gap between the cover glass of the
 image sensor 46, the image sensor 46 and the bottom of the microfluidic channel 14, are taken into account separatelyA microfluidic channel 14, and water or other liquid therein. As described above, the image sensor 46 cover glass, air gap, and bottom thickness of the microfluidic channel 14 are constant for each object 12, while the distance of the object from the bottom of the microfluidic channel 14 is varied and is given by the results of the autofocus algorithm 94 performed for a single color. Slight differences in incident angle between the red, green and blue emitters of the LED chip light source 50 are corrected by modifying the propagation kernel accordingly. To assess the resolution of the imaging flow cytometer device 10 of the subject 12 located inside the microfluidic channel 14, the flow channel was replaced with a 1951 air force test chart (see fig. 16). Due to the partially coherent nature of the illumination, the resolution depends on the distance of the object to the sensor; therefore, measurements are taken by placing test patterns at different heights above the image sensor 46. The width of the minimum resolving line varies between 1.55 μm and 1.95 μm depending on the height of the object 12, where 1.55 μm corresponds to the smallest resolvable feature of the majority of the flowing objects 12 imaged by the imaging flow cytometer device 10 during its normal operation.
However, these raw reconstructed phase and intensity images 100 (including the reconstructed intensity image 100i and the reconstructed phase image 100p) are all contaminated by self-interference and dual image noise, which are characteristic of online digital holographic imaging systems due to the loss of phase information of the holograms at the plane of the image sensor 46. Therefore, to achieve accurate image reconstruction without these artifacts, a digital holographic phase recovery method based on deep learning is employed, pre-trained using a trained deep neural network 102 (e.g., convolutional neural network) (see fig. 7, 9A, 9B), and various phase recovery reconstructions of the aquatic object 12 are captured using the imaging flow cytometer device 10. A ground truth or "golden standard" reconstruction of phase recovery may be obtained using, for example, a multi-height image of the subject 12, where the phase recovery is performed using multi-height phase recovery, as disclosed in lienson et al, phase recovery and holographic image reconstruction using deep learning in neural networks (Light sci.appl.7.17141 (2018)), which is incorporated herein by reference. This enables the spectral morphology of the object 12 to be automatically and accurately acquired without sacrificing high throughput operation of the imaging flow cytometer apparatus 10, which would otherwise be very challenging because other existing phase recovery methods require static repetitive measurements and/or time consuming iterative calculations, which are not suitable for flowing objects 12.
The trained deep neural network 102 outputs a phase recovery image 104, which includes a phase recovery intensity image 104i and a phase recovery phase image 104 p. As shown in fig. 7, the phase recovered intensity image 104i and the phase recovered phase image 104p may be combined or merged to create a phase recovered phase-contrast image 106. Fig. 7 also shows a phase-recovered phase-contrast image 106 in the panel of the trained deep neural network 102. To visualize transparent objects 12 such as plankton, a complex-valued reconstructed color phase-contrast image 106 based on red, green and blue channels helps to accurately resolve fine features and internal structures of various aqueous microorganisms with high chromatic aberration (see, e.g., fig. 10).
Graphic User Interface (GUI)
The GUI110 is used to operate the device with which the user interacts via the display 26 of the computing device 24 (fig. 5 and 6). Through the GUI110, all relevant measurement parameters can be specified, such as liquid flow rate, drive current, incident angle of red, green and blue LEDs, flash pulse duration, camera sensor gain, etc. The GUI110 presents real-time full-field reconstructed images at the center of the microfluidic channel 14, allowing visual inspection during flow with and without background subtraction, and displaying the total number of detected objects 12 in the current frame. The GUI110 is also capable of visualizing up to twelve (12) segmented, autofocus, and reconstructed objects 12 in real-time (or more or fewer objects 12 may of course be displayed). The user may specify whether any combination of the original, background subtracted hologram, or reconstructed image (e.g., image 106) is to be digitally saved. The GUI110 may also operate in a presentation mode, allowing previously captured image data sets to be analyzed without the imaging flow cytometer device 10.
Sample preparation and analysis
The sampling protocol for obtaining marine samples recommended by CDPH (usa) was followed. A vertical trawl with a total length of 15m (5 x 3m) was run from the end of the wharf at each dockside sampling location (maribub, san moneka, venes, manhattan and radon beach, ca, usa) using a 25cm diameter plankton net. The durometontory has no wharf and is therefore towed horizontally from the shoreline. The plankton net concentrates the micro-and nano-plankton found in the ocean to a sample of about 250mL, i.e., in this case, the condensation ratio is about 3000 times. A 1mL concentrated sample was extracted and re-diluted with 50mL filtered seawater and its contents imaged using the imaging flow cytometer device 10. The remaining sample is sent to CDPH for subsequent analysis (for comparison purposes). During the field test, the same plankton net was used, but only one vertical tow from a depth of 1.5m was made per measurement. 1mL of the resulting sample was re-diluted with 20mL of filtered seawater. To conserve battery power of the control computing device 24 (i.e., laptop), approximately 12mL of this sample was imaged in the field. The imaging flow cytometer device 10 automatically detects and saves a reconstructed image 106 of all detected plankton and provides real-time feedback to the user regarding the total number of detected plankton. The rhomboid algae were specifically counted manually by scanning the dataset of saved images and visually identifying the rhomboid algae.
In another embodiment and referring to fig. 17A, flow cytometer imaging system 2 is used with a neural network classifier 114 configured to detect and count particular types of objects 12, such as particular types of microorganisms. In this alternative embodiment, the previously described trained deep neural network 102 is replaced with a neural network classifier 114, which, in one embodiment, is trained to output a binary determination (i.e., yes/no) as to whether a particular microorganism is of a particular type or species. For example, the neural network classifier 114 is used to detect and count giardia cysts at various concentrations. The neural network classifier 114 trained for this purpose is a variant of the DenseNet-121 network, Huang et al, computer Vision and Pattern recognition IEEE conference proceedings, pages 4700 and 4708 (2017), which is incorporated by reference.
Changes to the DenseNet-121 network include omitting the batch specification layer and using 0.3 drop (dropout). The network optimizer of choice is adaptive moment estimation (ADAM). A total of 40000 giardia images and 40000 dirt particle images were used to train the neural network classifier 114. 8000 images of each category were used as the validation set. Data enhancement techniques of image rotation and flipping have also been used to increase the diversity of sample images. The neural network classifier 114 is trained and subsequent decisions are made on the reconstructed but not phase-recovered phase and amplitude images. As in the case of the phase recovery trained neural network 102, the inputs to the neural network classifier 114 are also the reconstructed red, green and blue intensity and phase images (i.e., images 100i, 100p in fig. 7) (1024 × 1024 × 6 layers). Since the pixel size of the imaging flow cytometer device 10 and the size of giardia cysts are small, the central 256 × 256 area of each image of the first step is cropped. The entire network architecture can be seen in fig. 17B.
Giardia samples were prepared according to EPA 1623.1 method (EPA 1623.1, section 7.12) of national laboratory of health, Madison, WI, and irradiation of samples was performed by waterborn Inc. The test samples had giardia cysts counts of 10, 50, 100 and 500 in 1ml of manufacturer standard buffer, respectively. These samples were re-diluted into 50ml bottled water before being analyzed by the imaging flow cytometer device 10. Training of the neural network classifier 114 was performed on a single high-concentration giardia sample (250000 cysts/ml) that could produce a large number of giardia images. Several water samples without standards were imaged to provide an image of typical soil particles found in the buffered water.
After the training process is complete, the neural network classifier 114 with the best validation accuracy (97% for giardia, about 99.5% for fouling) is selected. The verification accuracy of giardia cannot be expected to reach 100% because even high concentrations of giardia samples contain some dirt in the buffered water, which can lead to a noisy signature of the giardia image. After training the neural network classifier 114, the performance of the system 2 was tested using a low concentration giardia sample. The samples were imaged at a throughput of 100ml/h and the effluent of the imaging flow cytometer device 10 was collected and filtered onto a membrane for fluorescence microscopy comparison. The filter membrane containing giardia cysts flowing through the imaging flow cytometer apparatus 10 was treated with fluorescein-labeled giardia specific antibody (product No. a300FLR-20X, waterborn Inc.) and incubated overnight at 37 ℃. The fluorescently labeled cysts were counted manually using a bench microscope. The results showed good agreement and are summarized in table 2 below.
TABLE 2

Table 2 shows the performance of the imaging flow cytometer apparatus 10 in detecting and automatically classifying giardia cysts. 50ml water samples were imaged at a flow rate of 100ml/h for about 30 minutes. To address the problem of cysts adhering to the manufacturer's sample containers and subsequently being lost during sample preparation, the samples are collected and filtered after leaving the cytometer. The filter-captured giardia was fluorescently stained with a giardia specific dye and counted manually using a fluorescence microscope. The results showed good consistency.
In another embodiment and referring to fig. 18, the flow cytometer imaging system 2 is used to calculate the thickness of the object 12 or, alternatively, the refractive index profile within the object 12. Calculating the refractive index profile within an object 12, such as a microorganism, can be used to infer, for example, a particular biochemical state or characteristic present within the microorganism. As one particular example, a refractive index profile may be calculated for the microorganism 12 and used as a surrogate for determining the chemical content of the biological object. For example, the chemical content may include the lipid content of the living subject. This may have great potential for identification and screening of microorganisms such as algae in biofuel applications.
The optical path difference is a measure of the light propagation distance inside the object of interest 12 (i.e. plankton) multiplied by the refractive index difference between the object of interest 12 and the surrounding medium. If the optical path length difference is defined as Δ L (x, y), the phase distribution of the objective lens at each wavelength can be written as φk(x,y)=2π·ΔL(x,y)/λk. The phase of the wavefront is a 2 pi period measure, so phase wrapping may occur with thicker objects and larger optical path lengths. The phase of this wrap is phik,wrapped(x,y)=φk(x, y) ± 2N pi, wherein-pi < phik,wrappedπ and N is an integer. These final wrapped phase maps φ generated from the three-phase retrieved reconstruction at three wavelengths may be processedk,wrappedI.e. pixel super-resolution using wavelength scanning, by an optimization algorithm, in Luo et al (Light: Science)&Applications (2016)5, e16060), incorporated herein by reference, finds the optimal path length Δ Lopt (x, y) for each spatial point on an image (x, y) by minimizing a cost function defined as:
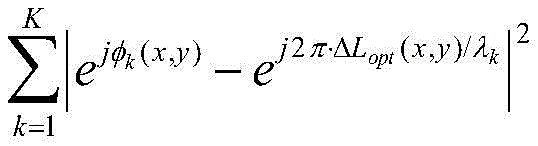
in one implementation, to reduce computational cost/time, a search range [ Δ L ] may be defined0-min{λk}/2,ΔL0+min{λk}/2]Wherein Δ L0Is a preliminary guess of the optical path length:

where the total number of wavelengths (K ═ 3). Within this search interval, these values may be scanned to find the optical path length Δ L that minimizes the cost functionopt(x, y) thereby causing a difference in optical path. Fig. 18 shows an example of this process. The optical path difference is a measure of coupling together the refractive index profile of the object 12 and the thickness of the object. If the refractive index profile of the object 12 is known, the correct calculation can be madeIs measured. In contrast, if the thickness of the object 12 and the refractive index of the surrounding medium are known, the refractive index distribution inside the object 12 can be calculated. In one possible application, obtaining the refractive index profile inside a microorganism, such as an alga, can be used to infer its lipid (or other chemical) content.
While embodiments of the present invention have been shown and described, various modifications may be made without departing from the scope of the invention. For example, although the invention has been primarily described in the context of a color imaging sensor, some embodiments may use a monochrome image sensor. Additionally, in some embodiments, only a single light source (no multiple colors) may be required. Additionally, in some embodiments, a near infrared light source may be used in place of the multi-color LED. Likewise, in an alternative embodiment, one or more light sources may operate in a continuous wave mode, wherein image frames are acquired by an image sensor operating in a "pulsed mode" to capture similar image frames. Accordingly, the invention is not to be restricted except in light of the attached claims and their equivalents.
Claims (38)
Applications Claiming Priority (3)
| Application Number | Priority Date | Filing Date | Title |
|---|---|---|---|
| US201862680374P | 2018-06-04 | 2018-06-04 | |
| US62/680,374 | 2018-06-04 | ||
| PCT/US2019/035376 WO2019236569A1 (en) | 2018-06-04 | 2019-06-04 | Deep learning-enabled portable imaging flow cytometer for label-free analysis of water samples |
Publications (1)
| Publication Number | Publication Date |
|---|---|
| CN112352158A true CN112352158A (en) | 2021-02-09 |
Family
ID=68770728
Family Applications (1)
| Application Number | Title | Priority Date | Filing Date |
|---|---|---|---|
| CN201980043900.5A Pending CN112352158A (en) | 2018-06-04 | 2019-06-04 | Portable imaging flow cytometer capable of deep learning for label-free analysis of water samples |
Country Status (5)
| Country | Link |
|---|---|
| US (1) | US11501544B2 (en) |
| EP (1) | EP3803384B1 (en) |
| CN (1) | CN112352158A (en) |
| CA (1) | CA3102297A1 (en) |
| WO (1) | WO2019236569A1 (en) |
Cited By (1)
| Publication number | Priority date | Publication date | Assignee | Title |
|---|---|---|---|---|
| CN116223447A (en) * | 2022-12-26 | 2023-06-06 | 大连理工大学 | Real-time monitoring method and device for marine organisms in nuclear power cooling water channel |
Families Citing this family (35)
| Publication number | Priority date | Publication date | Assignee | Title |
|---|---|---|---|---|
| US11331670B2 (en) | 2018-05-23 | 2022-05-17 | Abs Global, Inc. | Systems and methods for particle focusing in microchannels |
| FR3085072B1 (en) * | 2018-08-14 | 2021-04-16 | Commissariat Energie Atomique | SAMPLE OBSERVATION PROCESS |
| WO2020139430A1 (en) * | 2018-09-28 | 2020-07-02 | Arizona Board Of Regents On Behalf Of The University Of Arizona | Quantitative large area binding sensor for detecting biomarkers |
| EP3647765A1 (en) * | 2018-10-31 | 2020-05-06 | INESC TEC - Instituto de Engenharia de Sistemas e Computadores, Tecnologia e Ciência | Device and method for detecting and identifying extracellular vesicles in a liquid dispersion sample |
| JP2022507259A (en) | 2018-11-15 | 2022-01-18 | ザ リージェンツ オブ ザ ユニバーシティ オブ カリフォルニア | Systems and methods for converting holographic microscopic images into microscopic images of various modality |
| WO2020117780A1 (en) * | 2018-12-03 | 2020-06-11 | Bio-Rad Laboratories, Inc. | Liquid level determination |
| US11946854B2 (en) | 2018-12-26 | 2024-04-02 | The Regents Of The University Of California | Systems and methods for two-dimensional fluorescence wave propagation onto surfaces using deep learning |
| EP3931344B1 (en) * | 2019-03-01 | 2024-09-04 | Agricam Aktiebolag | Method and system for detection of micro organisms |
| US11262286B2 (en) | 2019-04-24 | 2022-03-01 | The Regents Of The University Of California | Label-free bio-aerosol sensing using mobile microscopy and deep learning |
| US11460395B2 (en) | 2019-06-13 | 2022-10-04 | The Regents Of The University Of California | System and method for measuring serum phosphate levels using portable reader device |
| EP3751342A1 (en) * | 2019-06-13 | 2020-12-16 | Stichting VU | Metrology method and method for training a data structure for use in metrology |
| JP7026853B2 (en) * | 2019-06-28 | 2022-02-28 | 富士フイルム株式会社 | Image processing equipment, evaluation system, image processing program and image processing method |
| CN114072630B (en) | 2019-07-02 | 2023-02-03 | 布伦特伍德工业公司 | Cooling tower splash bar hanger and related assembly |
| US20230003632A1 (en) * | 2019-09-20 | 2023-01-05 | Kansas State University Research Foundation | Methods and apparatus for contactless orthographic imaging of aerosol particles |
| EP3796212B1 (en) * | 2019-09-23 | 2024-06-26 | Max-Planck-Gesellschaft zur Förderung der Wissenschaften e.V. | Device for image-based cell classification, method therefor and use thereof |
| EP3839636B1 (en) * | 2019-12-20 | 2024-03-13 | Imec VZW | A device for detecting particles in air |
| BR112022011915A2 (en) | 2019-12-23 | 2022-09-06 | Univ California | MICROSCOPIC IMAGES DIGITAL DYEING METHOD AND SYSTEM USING DEEP LEARNING |
| US11211222B2 (en) * | 2019-12-30 | 2021-12-28 | Fei Company | Method and system for automatic zone axis alignment |
| WO2021154876A1 (en) | 2020-01-28 | 2021-08-05 | The Regents Of The University Of California | Systems and methods for the early detection and classification of live microorganisms using time-lapse coherent imaging and deep learning |
| US11625002B2 (en) * | 2020-01-29 | 2023-04-11 | Regents Of The University Of Minnesota | Machine learning holography for particle field imaging |
| US11915360B2 (en) | 2020-10-20 | 2024-02-27 | The Regents Of The University Of California | Volumetric microscopy methods and systems using recurrent neural networks |
| US12430554B2 (en) | 2020-10-20 | 2025-09-30 | The Regents Of The University Of California | Device and method for neural-network based on-chip spectroscopy using a plasmonic encoder |
| JP2023547610A (en) | 2020-10-21 | 2023-11-13 | エイビーエス グローバル、インコーポレイテッド | Methods and systems for processing genetic samples to determine identity or detect contamination |
| CN112362440B (en) * | 2020-11-13 | 2021-07-06 | 江西省科学院 | Automatic detection device for chlorophyll a in water body |
| EP4248190A4 (en) * | 2020-11-23 | 2024-12-25 | ABS Global, Inc. | Modular flow cytometry systems and methods of processing samples |
| KR102730646B1 (en) * | 2021-01-19 | 2024-11-15 | 한국전자통신연구원 | Method and apparatus for processing phase information |
| EP4423480A4 (en) * | 2021-10-27 | 2025-02-19 | Ramot at Tel-Aviv University Ltd. | MACHINE VISION SYSTEM FOR AQUATIC LARVALENT BREEDING |
| EP4453537A4 (en) * | 2021-12-21 | 2025-03-26 | Ramot at Tel-Aviv University Ltd. | METHOD AND SYSTEM FOR VISUALIZING THE STRUCTURE OF BIOLOGICAL CELLS |
| TWI820645B (en) * | 2022-03-23 | 2023-11-01 | 英業達股份有限公司 | System for obtaining identification in advance to pair circuit board after mounting and method thereof |
| WO2024050321A1 (en) * | 2022-08-29 | 2024-03-07 | The Regents Of The University Of California | Virtual impactor-based label-free particulate matter detection using holography and deep learning |
| CN115452769B (en) * | 2022-09-16 | 2025-12-09 | 浙江大学 | Holographic imaging-based red tide algae three-dimensional detection method and device |
| AU2022279500B1 (en) * | 2022-12-01 | 2023-11-23 | Provectus IP Pty Ltd | Automated cell analyser and method |
| CN118730921A (en) | 2023-03-28 | 2024-10-01 | 香港大学 | Method and device for identifying microplastics based on polarization digital holography |
| US12488431B2 (en) | 2023-04-20 | 2025-12-02 | The Regents Of The University Of California | Deep neural network for hologram reconstruction with superior external generalization |
| CN118746578B (en) * | 2024-06-07 | 2025-03-07 | 青岛道万科技有限公司 | A target determination system for a continuous plankton sampling net |
Citations (13)
| Publication number | Priority date | Publication date | Assignee | Title |
|---|---|---|---|---|
| US20080292555A1 (en) * | 2004-09-17 | 2008-11-27 | The Regents Of The University Of Michigan | Quantitative Two-Photon Flow Cytometry |
| US20100284016A1 (en) * | 2009-05-06 | 2010-11-11 | The Regents Of The University Of California | Optical cytometry |
| WO2011049965A1 (en) * | 2009-10-20 | 2011-04-28 | The Regents Of The University Of California | Incoherent lensfree cell holography and microscopy on a chip |
| US20120148141A1 (en) * | 2010-12-14 | 2012-06-14 | Aydogan Ozcan | Compact automated semen analysis platform using lens-free on-chip microscopy |
| WO2012088351A2 (en) * | 2010-12-21 | 2012-06-28 | The Regents Of The University Of California | Compact wide-field fluorescent imaging on a mobile device |
| US20130126618A1 (en) * | 2011-11-17 | 2013-05-23 | WenLiang Gao | Systems and methods for reading color optical codes |
| US20130157351A1 (en) * | 2010-12-21 | 2013-06-20 | The Regents Of The University Of California | Compact wide-field fluorescent imaging on a mobile device |
| US20130162999A1 (en) * | 2011-11-23 | 2013-06-27 | University Of South Carolina | Classification Using Multivariate Optical Computing |
| US20140192405A1 (en) * | 2013-01-09 | 2014-07-10 | Lumencor, Inc. | Adjustable collimator for coupling a light guide to a microscope |
| US20140226059A1 (en) * | 2013-02-12 | 2014-08-14 | Non-Typical, Inc. | Illumination assembly for a scouting camera |
| US20140355829A1 (en) * | 2013-05-31 | 2014-12-04 | Samsung Sds Co., Ltd. | People detection apparatus and method and people counting apparatus and method |
| EP2985719A1 (en) * | 2014-08-15 | 2016-02-17 | IMEC vzw | A system and method for cell recognition |
| US20160258859A1 (en) * | 2015-03-06 | 2016-09-08 | Becton, Dickinson And Company | Light collection systems and methods for making and using thereof |
Family Cites Families (38)
| Publication number | Priority date | Publication date | Assignee | Title |
|---|---|---|---|---|
| US7493227B2 (en) | 2005-03-17 | 2009-02-17 | The Board Of Trustees Of The Leland Stanford Junior University | Method for determining the complex scattering function of an optical coherence tomography sample |
| CN101344518B (en) * | 2008-08-15 | 2012-04-11 | 东南大学 | Multi-mode set integration dielectric characterization apparatus and method of micro-nano biological particle |
| WO2010063001A1 (en) * | 2008-11-26 | 2010-06-03 | Wireless Environment, Llc | Wireless lighting devices and applications |
| JP2013525811A (en) | 2010-05-03 | 2013-06-20 | ザ リージェンツ オブ ザ ユニバーシティ オブ カリフォルニア | On-chip wide-field lens-free fluorescence imaging |
| WO2012054351A2 (en) | 2010-10-18 | 2012-04-26 | The Regents Of The University Of California | Microscopy method and system incorporating nanofeatures |
| US20120225475A1 (en) * | 2010-11-16 | 2012-09-06 | 1087 Systems, Inc. | Cytometry system with quantum cascade laser source, acoustic detector, and micro-fluidic cell handling system configured for inspection of individual cells |
| US9605941B2 (en) | 2011-01-06 | 2017-03-28 | The Regents Of The University Of California | Lens-free tomographic imaging devices and methods |
| US8866063B2 (en) | 2011-03-31 | 2014-10-21 | The Regents Of The University Of California | Lens-free wide-field super-resolution imaging device |
| US20140160236A1 (en) | 2011-07-29 | 2014-06-12 | The Regents Of The University Of California | Lensfree holographic microscopy using wetting films |
| WO2013047315A1 (en) * | 2011-09-30 | 2013-04-04 | 三洋電機株式会社 | Beam splitter and observation device |
| US9715099B2 (en) | 2011-11-07 | 2017-07-25 | The Regents Of The University Of California | Maskless imaging of dense samples using multi-height lensfree microscope |
| US8916390B2 (en) | 2012-02-06 | 2014-12-23 | The Regents Of The University Of California | Portable rapid diagnostic test reader |
| US20150153558A1 (en) | 2012-06-07 | 2015-06-04 | The Regents Of The University Of California | Wide-field microscopy using self-assembled liquid lenses |
| US9103760B2 (en) * | 2012-06-09 | 2015-08-11 | E. I. Spectra, Llc | Fluorescence flow cytometry device and method |
| US9588037B2 (en) | 2012-07-13 | 2017-03-07 | The Regents Of The University Of California | High throughput lens-free three-dimensional tracking of sperm |
| US20140120563A1 (en) | 2012-10-29 | 2014-05-01 | The Regents Of The University Of California | Allergen testing platform for use with mobile electronic devices |
| WO2015017046A1 (en) | 2013-07-31 | 2015-02-05 | The Regents Of The University Of California | Fluorescent imaging using a flatbed scanner |
| WO2015108820A1 (en) | 2014-01-14 | 2015-07-23 | The Regents Of The University Of California | Method and device for detection and spatial mapping of mercury concentration in water samples |
| EP3175302B1 (en) | 2014-08-01 | 2021-12-29 | The Regents of the University of California | Device and method for iterative phase recovery based on pixel super-resolved on-chip holography |
| US20160070092A1 (en) | 2014-09-04 | 2016-03-10 | The Regents Of The University Of California | Method and device for fluorescent imaging of single nano-particles and viruses |
| US10175215B2 (en) | 2014-12-23 | 2019-01-08 | The Regents Of The University Of California | Method and device for quantification of plant chlorophyll content |
| US20180052425A1 (en) | 2015-01-22 | 2018-02-22 | The Regents Of The University Of California | Device and method for nanoparticle sizing based on time-resolved on-chip microscopy |
| DE102015005656A1 (en) * | 2015-05-02 | 2016-11-03 | Testo Ag | Cytometry and cytometer unit |
| US10088663B2 (en) | 2015-05-13 | 2018-10-02 | The Regents Of The University Of California | Device and method for tunable vapor condensed nanolenses |
| WO2017053592A1 (en) * | 2015-09-23 | 2017-03-30 | The Regents Of The University Of California | Deep learning in label-free cell classification and machine vision extraction of particles |
| US10248838B2 (en) | 2015-12-04 | 2019-04-02 | The Regents Of The University Of California | Method and device for single molecule imaging |
| US20170168285A1 (en) | 2015-12-14 | 2017-06-15 | The Regents Of The University Of California | Systems and methods for image reconstruction |
| US10838192B2 (en) | 2016-05-10 | 2020-11-17 | The Regents Of The University Of California | Method and device for high-resolution color imaging using merged images from holographic and lens-based devices |
| WO2017196995A1 (en) | 2016-05-11 | 2017-11-16 | The Regents Of The University Of California | Method and system for pixel super-resolution of multiplexed holographic color images |
| WO2017201060A1 (en) | 2016-05-17 | 2017-11-23 | The Regents Of The University Of California | Enhanced fluorescence readout and reduced inhibition for nucleic acid amplification tests |
| US20190137932A1 (en) | 2016-05-25 | 2019-05-09 | The Regents Of The University Of California | Wide-field imaging of birefringent crystals and other materials using lens-free polarized microscope |
| WO2018102346A1 (en) | 2016-11-29 | 2018-06-07 | The Regents Of The University Of California | Antimicrobial susceptibility testing device and method for use with portable electronic devices |
| US11054357B2 (en) | 2017-03-10 | 2021-07-06 | The Regents Of The University Of California | Mobile microscopy system for air quality monitoring |
| US20190346369A1 (en) | 2017-03-27 | 2019-11-14 | The Regents Of The University Of California | Mobile phone based fluorescent multi-well plate reader |
| US11450121B2 (en) | 2017-06-27 | 2022-09-20 | The Regents Of The University Of California | Label-free digital brightfield analysis of nucleic acid amplification |
| US11514325B2 (en) | 2018-03-21 | 2022-11-29 | The Regents Of The University Of California | Method and system for phase recovery and holographic image reconstruction using a neural network |
| US11222415B2 (en) | 2018-04-26 | 2022-01-11 | The Regents Of The University Of California | Systems and methods for deep learning microscopy |
| US11262286B2 (en) | 2019-04-24 | 2022-03-01 | The Regents Of The University Of California | Label-free bio-aerosol sensing using mobile microscopy and deep learning |
-
2019
- 2019-06-04 CN CN201980043900.5A patent/CN112352158A/en active Pending
- 2019-06-04 EP EP19815495.7A patent/EP3803384B1/en active Active
- 2019-06-04 WO PCT/US2019/035376 patent/WO2019236569A1/en not_active Ceased
- 2019-06-04 CA CA3102297A patent/CA3102297A1/en active Pending
- 2019-06-04 US US15/734,225 patent/US11501544B2/en active Active
Patent Citations (14)
| Publication number | Priority date | Publication date | Assignee | Title |
|---|---|---|---|---|
| US20080292555A1 (en) * | 2004-09-17 | 2008-11-27 | The Regents Of The University Of Michigan | Quantitative Two-Photon Flow Cytometry |
| US20100284016A1 (en) * | 2009-05-06 | 2010-11-11 | The Regents Of The University Of California | Optical cytometry |
| WO2011049965A1 (en) * | 2009-10-20 | 2011-04-28 | The Regents Of The University Of California | Incoherent lensfree cell holography and microscopy on a chip |
| CA2778284C (en) * | 2009-10-20 | 2018-04-24 | The Regents Of The University Of California | Incoherent lensfree cell holography and microscopy on a chip |
| US20120148141A1 (en) * | 2010-12-14 | 2012-06-14 | Aydogan Ozcan | Compact automated semen analysis platform using lens-free on-chip microscopy |
| US20130157351A1 (en) * | 2010-12-21 | 2013-06-20 | The Regents Of The University Of California | Compact wide-field fluorescent imaging on a mobile device |
| WO2012088351A2 (en) * | 2010-12-21 | 2012-06-28 | The Regents Of The University Of California | Compact wide-field fluorescent imaging on a mobile device |
| US20130126618A1 (en) * | 2011-11-17 | 2013-05-23 | WenLiang Gao | Systems and methods for reading color optical codes |
| US20130162999A1 (en) * | 2011-11-23 | 2013-06-27 | University Of South Carolina | Classification Using Multivariate Optical Computing |
| US20140192405A1 (en) * | 2013-01-09 | 2014-07-10 | Lumencor, Inc. | Adjustable collimator for coupling a light guide to a microscope |
| US20140226059A1 (en) * | 2013-02-12 | 2014-08-14 | Non-Typical, Inc. | Illumination assembly for a scouting camera |
| US20140355829A1 (en) * | 2013-05-31 | 2014-12-04 | Samsung Sds Co., Ltd. | People detection apparatus and method and people counting apparatus and method |
| EP2985719A1 (en) * | 2014-08-15 | 2016-02-17 | IMEC vzw | A system and method for cell recognition |
| US20160258859A1 (en) * | 2015-03-06 | 2016-09-08 | Becton, Dickinson And Company | Light collection systems and methods for making and using thereof |
Non-Patent Citations (1)
| Title |
|---|
| YOUNGJU JO ET AL.: "Holographic deep learning for rapid optical screening of anthrax spores", 《SCIENCE ADVANCES》 * |
Cited By (1)
| Publication number | Priority date | Publication date | Assignee | Title |
|---|---|---|---|---|
| CN116223447A (en) * | 2022-12-26 | 2023-06-06 | 大连理工大学 | Real-time monitoring method and device for marine organisms in nuclear power cooling water channel |
Also Published As
| Publication number | Publication date |
|---|---|
| CA3102297A1 (en) | 2019-12-12 |
| WO2019236569A1 (en) | 2019-12-12 |
| EP3803384A1 (en) | 2021-04-14 |
| EP3803384A4 (en) | 2021-08-11 |
| EP3803384B1 (en) | 2025-08-06 |
| US11501544B2 (en) | 2022-11-15 |
| US20210209337A1 (en) | 2021-07-08 |
Similar Documents
| Publication | Publication Date | Title |
|---|---|---|
| CN112352158A (en) | Portable imaging flow cytometer capable of deep learning for label-free analysis of water samples | |
| Melanthota et al. | Deep learning-based image processing in optical microscopy | |
| US10488344B2 (en) | System for rapid assessment of water quality and harmful algal bloom toxins | |
| Seo et al. | High-throughput lens-free blood analysis on a chip | |
| US9007433B2 (en) | Incoherent lensfree cell holography and microscopy on a chip | |
| CN114062231B (en) | Analysis device | |
| Mullen et al. | Underwater microscopy for in situ studies of benthic ecosystems | |
| Blagodatski et al. | Under-and over-water halves of Gyrinidae beetle eyes harbor different corneal nanocoatings providing adaptation to the water and air environments | |
| WO2022137243A1 (en) | Optical technique for analyzing insects, shrimp and fish | |
| US12504615B2 (en) | System and method for parallelized volumetric microscope imaging | |
| Vaughan et al. | A review of microscopic cell imaging and neural network recognition for synergistic cyanobacteria identification and enumeration | |
| Sutton et al. | Multisensor sampling of pelagic ecosystem variables in a coastal environment to estimate zooplankton grazing impact | |
| Dahms et al. | Perspectives of underwater optics in biological oceanography and plankton ecology studies | |
| Feller et al. | Long-wavelength reflecting filters found in the larval retinas of one mantis shrimp family (Nannosquillidae) | |
| Santos et al. | Remote 3D Imaging and Classification of Pelagic Microorganisms with A Short‐Range Multispectral Confocal LiDAR | |
| Santos et al. | Confocal LiDAR for remote high-resolution imaging of auto-fluorescence in aquatic media | |
| US20220113671A1 (en) | Portable uv holographic microscope for high-contrast protein crystal imaging | |
| Júnior et al. | Complete holography‐based system for the identification of microparticles in water samples | |
| Tolomeev et al. | Underwater video imaging systems to study zooplankton abundance and diversity: challenges and opportunities | |
| Ziccarelli et al. | A novel method of obtaining near real-time observations of phytoplankton from a mobile autonomous platform | |
| Mills et al. | Diatom lensless imaging using laser scattering and deep learning | |
| Chen et al. | Deep focus-extended darkfield imaging for in situ observation of marine plankton | |
| TOLOMEEV et al. | JOURNAL OF SIBERIAN FEDERAL UNIVERSITY. BIOLOGY | |
| Nielsen et al. | Dual-band fluorosensor for discriminating non-eating from algae-eating zooplankton in aquatic environments | |
| Tian et al. | DeepLeMiN: Deep-learning-empowered Physics-aware Lensless Miniscope |
Legal Events
| Date | Code | Title | Description |
|---|---|---|---|
| PB01 | Publication | ||
| PB01 | Publication | ||
| SE01 | Entry into force of request for substantive examination | ||
| SE01 | Entry into force of request for substantive examination | ||
| WD01 | Invention patent application deemed withdrawn after publication | ||
| WD01 | Invention patent application deemed withdrawn after publication |
Application publication date: 20210209 |