CN112165897A - Photoplethysmographic data analysis and presentation - Google Patents
Photoplethysmographic data analysis and presentation Download PDFInfo
- Publication number
- CN112165897A CN112165897A CN201980034920.6A CN201980034920A CN112165897A CN 112165897 A CN112165897 A CN 112165897A CN 201980034920 A CN201980034920 A CN 201980034920A CN 112165897 A CN112165897 A CN 112165897A
- Authority
- CN
- China
- Prior art keywords
- computer program
- heartbeat
- program product
- determining
- ppg signal
- Prior art date
- Legal status (The legal status is an assumption and is not a legal conclusion. Google has not performed a legal analysis and makes no representation as to the accuracy of the status listed.)
- Pending
Links
- 238000007405 data analysis Methods 0.000 title abstract description 10
- 238000000034 method Methods 0.000 claims abstract description 108
- 238000004590 computer program Methods 0.000 claims abstract description 93
- 230000033764 rhythmic process Effects 0.000 claims description 103
- 206010003658 Atrial Fibrillation Diseases 0.000 claims description 100
- 238000001514 detection method Methods 0.000 claims description 45
- 238000012545 processing Methods 0.000 claims description 26
- 238000012067 mathematical method Methods 0.000 claims description 25
- 238000004458 analytical method Methods 0.000 claims description 19
- 230000008859 change Effects 0.000 claims description 17
- 238000013475 authorization Methods 0.000 claims description 12
- 230000000694 effects Effects 0.000 claims description 12
- 208000001871 Tachycardia Diseases 0.000 claims description 5
- 230000006794 tachycardia Effects 0.000 claims description 5
- 230000005540 biological transmission Effects 0.000 claims description 4
- 208000006218 bradycardia Diseases 0.000 claims description 4
- 230000036471 bradycardia Effects 0.000 claims description 4
- 238000013186 photoplethysmography Methods 0.000 abstract description 206
- 238000004891 communication Methods 0.000 description 26
- 238000010586 diagram Methods 0.000 description 25
- 230000036541 health Effects 0.000 description 20
- 238000007781 pre-processing Methods 0.000 description 18
- 238000013480 data collection Methods 0.000 description 16
- 230000015654 memory Effects 0.000 description 14
- 238000004422 calculation algorithm Methods 0.000 description 10
- 230000008569 process Effects 0.000 description 10
- 238000000354 decomposition reaction Methods 0.000 description 9
- 230000003287 optical effect Effects 0.000 description 9
- 238000012806 monitoring device Methods 0.000 description 8
- 238000005070 sampling Methods 0.000 description 8
- 238000009826 distribution Methods 0.000 description 6
- 238000001914 filtration Methods 0.000 description 6
- 230000008901 benefit Effects 0.000 description 5
- 238000003066 decision tree Methods 0.000 description 5
- 238000012544 monitoring process Methods 0.000 description 5
- 238000000718 qrs complex Methods 0.000 description 5
- 238000013459 approach Methods 0.000 description 4
- 238000004364 calculation method Methods 0.000 description 4
- 230000001788 irregular Effects 0.000 description 4
- 238000003860 storage Methods 0.000 description 4
- 239000013598 vector Substances 0.000 description 4
- 238000012800 visualization Methods 0.000 description 4
- 206010003119 arrhythmia Diseases 0.000 description 3
- 230000006793 arrhythmia Effects 0.000 description 3
- 230000001746 atrial effect Effects 0.000 description 3
- 230000009286 beneficial effect Effects 0.000 description 3
- 230000006870 function Effects 0.000 description 3
- 238000004519 manufacturing process Methods 0.000 description 3
- 239000003550 marker Substances 0.000 description 3
- 238000012986 modification Methods 0.000 description 3
- 230000004048 modification Effects 0.000 description 3
- 230000000877 morphologic effect Effects 0.000 description 3
- 230000000007 visual effect Effects 0.000 description 3
- 206010015856 Extrasystoles Diseases 0.000 description 2
- WQZGKKKJIJFFOK-GASJEMHNSA-N Glucose Natural products OC[C@H]1OC(O)[C@H](O)[C@@H](O)[C@@H]1O WQZGKKKJIJFFOK-GASJEMHNSA-N 0.000 description 2
- 208000000418 Premature Cardiac Complexes Diseases 0.000 description 2
- 238000003491 array Methods 0.000 description 2
- 239000008280 blood Substances 0.000 description 2
- 210000004369 blood Anatomy 0.000 description 2
- 230000036772 blood pressure Effects 0.000 description 2
- 230000000747 cardiac effect Effects 0.000 description 2
- 230000015556 catabolic process Effects 0.000 description 2
- 239000003795 chemical substances by application Substances 0.000 description 2
- 239000003086 colorant Substances 0.000 description 2
- 238000006731 degradation reaction Methods 0.000 description 2
- 238000005516 engineering process Methods 0.000 description 2
- 230000014509 gene expression Effects 0.000 description 2
- 239000008103 glucose Substances 0.000 description 2
- 230000003993 interaction Effects 0.000 description 2
- 238000013178 mathematical model Methods 0.000 description 2
- 238000005259 measurement Methods 0.000 description 2
- NJPPVKZQTLUDBO-UHFFFAOYSA-N novaluron Chemical compound C1=C(Cl)C(OC(F)(F)C(OC(F)(F)F)F)=CC=C1NC(=O)NC(=O)C1=C(F)C=CC=C1F NJPPVKZQTLUDBO-UHFFFAOYSA-N 0.000 description 2
- 238000005457 optimization Methods 0.000 description 2
- 230000002093 peripheral effect Effects 0.000 description 2
- 238000003825 pressing Methods 0.000 description 2
- 238000000638 solvent extraction Methods 0.000 description 2
- 230000002861 ventricular Effects 0.000 description 2
- 206010003662 Atrial flutter Diseases 0.000 description 1
- 208000003734 Supraventricular Tachycardia Diseases 0.000 description 1
- 238000007792 addition Methods 0.000 description 1
- 208000008784 apnea Diseases 0.000 description 1
- 210000001367 artery Anatomy 0.000 description 1
- 238000013528 artificial neural network Methods 0.000 description 1
- 230000017531 blood circulation Effects 0.000 description 1
- 239000002131 composite material Substances 0.000 description 1
- 238000010205 computational analysis Methods 0.000 description 1
- 230000008602 contraction Effects 0.000 description 1
- 230000003247 decreasing effect Effects 0.000 description 1
- 230000001934 delay Effects 0.000 description 1
- 238000003745 diagnosis Methods 0.000 description 1
- 238000000537 electroencephalography Methods 0.000 description 1
- 238000002567 electromyography Methods 0.000 description 1
- 230000005284 excitation Effects 0.000 description 1
- 230000001747 exhibiting effect Effects 0.000 description 1
- 239000000835 fiber Substances 0.000 description 1
- 230000003862 health status Effects 0.000 description 1
- 238000012880 independent component analysis Methods 0.000 description 1
- 239000004973 liquid crystal related substance Substances 0.000 description 1
- 238000010801 machine learning Methods 0.000 description 1
- 239000011159 matrix material Substances 0.000 description 1
- 239000000203 mixture Substances 0.000 description 1
- 238000012856 packing Methods 0.000 description 1
- 230000010412 perfusion Effects 0.000 description 1
- 230000000737 periodic effect Effects 0.000 description 1
- 230000001766 physiological effect Effects 0.000 description 1
- 238000012805 post-processing Methods 0.000 description 1
- 238000002360 preparation method Methods 0.000 description 1
- 230000009467 reduction Effects 0.000 description 1
- 230000004213 regulation of atrial cardiomyocyte membrane depolarization Effects 0.000 description 1
- 230000034225 regulation of ventricular cardiomyocyte membrane depolarization Effects 0.000 description 1
- 238000009877 rendering Methods 0.000 description 1
- 230000002336 repolarization Effects 0.000 description 1
- 230000029058 respiratory gaseous exchange Effects 0.000 description 1
- 230000036387 respiratory rate Effects 0.000 description 1
- 230000004044 response Effects 0.000 description 1
- 230000001953 sensory effect Effects 0.000 description 1
- 238000000926 separation method Methods 0.000 description 1
- 231100000430 skin reaction Toxicity 0.000 description 1
- 239000007787 solid Substances 0.000 description 1
- 230000001629 suppression Effects 0.000 description 1
- 230000002123 temporal effect Effects 0.000 description 1
- 238000012546 transfer Methods 0.000 description 1
- 230000001052 transient effect Effects 0.000 description 1
- 238000002604 ultrasonography Methods 0.000 description 1
- 210000000707 wrist Anatomy 0.000 description 1
Images


Classifications
-
- A—HUMAN NECESSITIES
- A61—MEDICAL OR VETERINARY SCIENCE; HYGIENE
- A61B—DIAGNOSIS; SURGERY; IDENTIFICATION
- A61B5/00—Measuring for diagnostic purposes; Identification of persons
- A61B5/02—Detecting, measuring or recording for evaluating the cardiovascular system, e.g. pulse, heart rate, blood pressure or blood flow
- A61B5/024—Measuring pulse rate or heart rate
- A61B5/02416—Measuring pulse rate or heart rate using photoplethysmograph signals, e.g. generated by infrared radiation
-
- A—HUMAN NECESSITIES
- A61—MEDICAL OR VETERINARY SCIENCE; HYGIENE
- A61B—DIAGNOSIS; SURGERY; IDENTIFICATION
- A61B5/00—Measuring for diagnostic purposes; Identification of persons
- A61B5/02—Detecting, measuring or recording for evaluating the cardiovascular system, e.g. pulse, heart rate, blood pressure or blood flow
- A61B5/024—Measuring pulse rate or heart rate
- A61B5/02438—Measuring pulse rate or heart rate with portable devices, e.g. worn by the patient
-
- A—HUMAN NECESSITIES
- A61—MEDICAL OR VETERINARY SCIENCE; HYGIENE
- A61B—DIAGNOSIS; SURGERY; IDENTIFICATION
- A61B5/00—Measuring for diagnostic purposes; Identification of persons
- A61B5/02—Detecting, measuring or recording for evaluating the cardiovascular system, e.g. pulse, heart rate, blood pressure or blood flow
- A61B5/024—Measuring pulse rate or heart rate
- A61B5/0245—Measuring pulse rate or heart rate by using sensing means generating electric signals, i.e. ECG signals
- A61B5/02455—Measuring pulse rate or heart rate by using sensing means generating electric signals, i.e. ECG signals provided with high/low alarm devices
-
- A—HUMAN NECESSITIES
- A61—MEDICAL OR VETERINARY SCIENCE; HYGIENE
- A61B—DIAGNOSIS; SURGERY; IDENTIFICATION
- A61B5/00—Measuring for diagnostic purposes; Identification of persons
- A61B5/24—Detecting, measuring or recording bioelectric or biomagnetic signals of the body or parts thereof
- A61B5/316—Modalities, i.e. specific diagnostic methods
- A61B5/318—Heart-related electrical modalities, e.g. electrocardiography [ECG]
- A61B5/346—Analysis of electrocardiograms
- A61B5/349—Detecting specific parameters of the electrocardiograph cycle
- A61B5/361—Detecting fibrillation
-
- A—HUMAN NECESSITIES
- A61—MEDICAL OR VETERINARY SCIENCE; HYGIENE
- A61B—DIAGNOSIS; SURGERY; IDENTIFICATION
- A61B5/00—Measuring for diagnostic purposes; Identification of persons
- A61B5/72—Signal processing specially adapted for physiological signals or for diagnostic purposes
- A61B5/7235—Details of waveform analysis
-
- A—HUMAN NECESSITIES
- A61—MEDICAL OR VETERINARY SCIENCE; HYGIENE
- A61B—DIAGNOSIS; SURGERY; IDENTIFICATION
- A61B5/00—Measuring for diagnostic purposes; Identification of persons
- A61B5/74—Details of notification to user or communication with user or patient; User input means
- A61B5/742—Details of notification to user or communication with user or patient; User input means using visual displays
- A61B5/743—Displaying an image simultaneously with additional graphical information, e.g. symbols, charts, function plots
-
- A—HUMAN NECESSITIES
- A61—MEDICAL OR VETERINARY SCIENCE; HYGIENE
- A61B—DIAGNOSIS; SURGERY; IDENTIFICATION
- A61B5/00—Measuring for diagnostic purposes; Identification of persons
- A61B5/74—Details of notification to user or communication with user or patient; User input means
- A61B5/746—Alarms related to a physiological condition, e.g. details of setting alarm thresholds or avoiding false alarms
Landscapes
- Health & Medical Sciences (AREA)
- Life Sciences & Earth Sciences (AREA)
- Cardiology (AREA)
- Engineering & Computer Science (AREA)
- Animal Behavior & Ethology (AREA)
- General Health & Medical Sciences (AREA)
- Biophysics (AREA)
- Biomedical Technology (AREA)
- Heart & Thoracic Surgery (AREA)
- Medical Informatics (AREA)
- Molecular Biology (AREA)
- Surgery (AREA)
- Physics & Mathematics (AREA)
- Pathology (AREA)
- Public Health (AREA)
- Veterinary Medicine (AREA)
- Physiology (AREA)
- Signal Processing (AREA)
- Artificial Intelligence (AREA)
- Computer Vision & Pattern Recognition (AREA)
- Psychiatry (AREA)
- Nuclear Medicine, Radiotherapy & Molecular Imaging (AREA)
- Radiology & Medical Imaging (AREA)
- Measuring Pulse, Heart Rate, Blood Pressure Or Blood Flow (AREA)
Abstract
公开了可以用于光体积描记图数据分析和呈现的系统、方法和计算机程序产品。例如,如由用户佩戴的可穿戴设备的PPG传感器所传达的那样接收光体积描记图(PPG)信号数据。可以至少从PPG信号数据确定心跳间隔。此外,可以在图形界面上生成跨越心跳间隔的心电图(ECG)型波形。
Systems, methods, and computer program products that can be used for photoplethysmographic data analysis and presentation are disclosed. For example, photoplethysmography (PPG) signal data is received as communicated by a PPG sensor of a wearable device worn by the user. The heartbeat interval can be determined from at least the PPG signal data. Additionally, electrocardiogram (ECG)-type waveforms across heartbeat intervals can be generated on a graphical interface.
Description
RELATED APPLICATIONS
The priority and benefit of U.S. provisional application No. 62/649,527 entitled "system and method for heart beat detection" filed on 3/28/2018, U.S. provisional application No. 62/649,530 entitled "system and method for detecting atrial fibrillation" filed on 3/28/2018, and U.S. patent application No. 62/649,533 entitled "system and method for photoplethysmogram data analysis and presentation" filed on 3/28/2018, the disclosures of each of which are incorporated herein by reference.
Background
The electrical and physiological properties of the human heart may be measured using a sensor, such as an Electrocardiogram (ECG) sensor or a photoplethysmography (PPG) sensor. The signals from such sensors may then be analyzed to determine the patient's useful and informative health status, such as heart rate, specific heart rhythm, etc.
Disclosure of Invention
Systems, methods, and computer program products are disclosed that may be used for photoplethysmogram data analysis and presentation. For example, photoplethysmogram (PPG) signal data is received as communicated by a PPG sensor of a wearable device worn by the user. The heartbeat interval may be determined from at least the PPG signal data. Further, Electrocardiogram (ECG) -type waveforms spanning the heartbeat intervals may be generated on a graphical interface.
In some embodiments, the ECG-type waveform includes a PQRST waveform that includes features indicative of electrical activity in the heart. Based at least on the PPG signal data, it may be detected whether an atrial fibrillation rhythm is represented in the PPG signal data. Also, when an atrial fibrillation rhythm is detected, the P-waves displayed within the ECG-type waveform may be suppressed. In some embodiments, based at least on the PPG signal data, it may be detected whether an atrial fibrillation rhythm is represented in the PPG signal data. When an atrial fibrillation rhythm is not detected, the P-wave may be displayed as part of an ECG-type waveform.
In some embodiments, the first heartbeat interval may be calculated based at least on PPG signal data. A second heartbeat interval may be calculated based at least on the PPG signal data, the second heartbeat interval occurring after the first heartbeat interval. The graphical interface may generate a scatter plot depicting changes in the heartbeat interval, the scatter plot including graphical elements at locations determined by at least the first heartbeat interval and the second heartbeat interval. In some embodiments, the graphical interface may display an ECG-type waveform and a scatter plot.
Implementations of the present subject matter may include, but are not limited to, methods consistent with the description provided herein, as well as articles of manufacture including a tangibly embodied machine-readable medium operable to cause one or more machines (e.g., computers, etc.) to cause operations implementing one or more of the features described above. Similarly, computer systems are also contemplated that may include one or more processors and one or more memories coupled to the one or more processors. The memory, which may include a computer-readable storage medium, may include, encode, store, etc., one or more programs that cause one or more processors to perform one or more of the operations described herein. A computer-implemented method consistent with one or more implementations of the present subject matter may be implemented by one or more data processors residing in a single computing system or across multiple computing systems. Such multiple computing systems may be connected and may exchange data and/or commands or other instructions or the like via one or more connections, including, but not limited to, over a network (e.g., the internet, a wireless wide area network, a local area network, a wide area network, a wired network, etc.), over a direct connection between one or more of the multiple computing systems, or the like.
The details of one or more variations of the subject matter described herein are set forth in the accompanying drawings and the description below. Other features and advantages of the subject matter described herein will be apparent from the description and drawings, and from the claims. While certain features of the presently disclosed subject matter have been described for illustrative purposes in connection with certain embodiments, it should be readily understood that such features are not intended to be limiting. The claims following this disclosure are intended to define the scope of the claimed subject matter.
Drawings
The accompanying drawings incorporated in and forming a part of the specification illustrate certain aspects of the subject matter disclosed herein and, together with the description, help explain some of the principles associated with the disclosed embodiments.
FIG. 1 illustrates an exemplary system that may provide monitoring of a user's health characteristics and provide health-related guidance, in accordance with certain aspects of the present disclosure.
Fig. 2 illustrates an embodiment of a user-wearable device in accordance with certain aspects of the present disclosure.
Fig. 3 illustrates an embodiment of a communication device in accordance with certain aspects of the present disclosure.
Fig. 4 illustrates an embodiment of a server according to certain aspects of the present disclosure.
Figure 5 illustrates an example PPG signal and corresponding PPG signal gradients according to certain aspects of the present disclosure.
Fig. 6 illustrates an exemplary embodiment of a heartbeat determination method in accordance with certain aspects of the present disclosure.
Fig. 7 is a diagram illustrating an exemplary process for determining the presence of atrial fibrillation according to certain aspects of the present disclosure.
Fig. 8 is a diagram illustrating an example scatter plot representing normal heart rhythms in accordance with certain aspects of the present disclosure.
Fig. 9 is a diagram illustrating an example moving window used in the generation of a scatter plot, according to certain aspects of the present disclosure.
Fig. 10 is a diagram illustrating an exemplary method for determining an occupancy metric from a scatter plot representing an irregular heart rhythm, according to certain aspects of the present disclosure.
Fig. 11 is a diagram illustrating an exemplary method for determining a distance metric from a scatter plot representing an irregular heart rhythm, according to certain aspects of the present disclosure.
Fig. 12 is a diagram illustrating an exemplary method for determining an interval variability metric from heartbeat interval data, according to certain aspects of the present disclosure.
Fig. 13 is a diagram illustrating an exemplary method for determining three-dimensional space and differentiating planes to determine heart rhythm type according to certain aspects of the present disclosure.
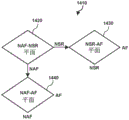
Fig. 14 is a diagram illustrating an example decision tree for determining a heart rhythm type in accordance with certain aspects of the present disclosure.
Fig. 15 is a diagram illustrating an exemplary patient dashboard, according to certain aspects of the present disclosure.
Fig. 16 is a diagram illustrating an example viewer in accordance with certain aspects of the present disclosure.
Fig. 17 is a diagram illustrating an exemplary viewer including an expanded view of a waveform having ECG-type characteristics, according to certain aspects of the present disclosure.
Fig. 18 is a diagram illustrating an exemplary viewer including a waveform with ECG-type characteristics and an expanded view of a suppressed P-wave, in accordance with certain aspects of the present disclosure.
Fig. 19 is a diagram illustrating an exemplary viewer including a scatter plot of points representing changes in heartbeat intervals, according to certain aspects of the present disclosure.
Fig. 20 is a diagram illustrating an exemplary method of generating an ECG-type waveform according to certain aspects of the present disclosure.
Detailed Description
The subject matter described herein relates to systems, methods, and software for monitoring the health of a user and providing health guidance to the user.
Fig. 1 illustrates an example system 100 that can provide monitoring of health characteristics of a user (e.g., a human patient or other living organism) and can provide health guidance to the user based on the health characteristic monitoring.
In some implementations, the exemplary system 100 depicted in fig. 1 may include elements such as: user wearable device 108 (e.g., a smart watch), communication devices 102, 104, and 106 (e.g., mobile phones or PCs), user monitoring devices 110 and 112 (e.g., a separate smart scale or blood glucose monitor), data analysis device 114, server 116 (e.g., including processor 117 and database 118), and network 120. The server 116 and devices shown in fig. 1 may include communication lines or ports to allow information to be exchanged within a network (e.g., network 120) or within other computing platforms via wired or wireless techniques (e.g., ethernet, fiber optic, coaxial cable, WiFi, bluetooth, near field communication, or other techniques).
It should be noted that although one or more operations are described herein as being performed by a particular component of system 100, in some embodiments those operations may be performed by other components of system 100. By way of example, although one or more operations are described herein as being performed by components of the data analysis device 114, in other embodiments, those operations may be performed by components of the user-wearable device 108, by components of the communication devices 102, 104, and 106, and/or by other components of the system 100.
The user-wearable device 108 may be a smart Watch (e.g., three star Gear, Apple Watch, etc.), or any other device that the user may wear. The user-wearable device 108 may include one or more sensors integrated within the device. For example, the user-wearable device 108 as a smart watch may include a motion sensor (e.g., an accelerometer), a bioimpedance sensor, an ECG sensor, a cardiograph sensor, an acoustic sensor (e.g., ultrasound), a photoplethysmogram (PPG) sensor that senses blood flow velocity using light-based techniques, and other sensors. Wearable device 108 may also be considered herein to include sensors worn on the user's body but not integrated within the main wearable portion (e.g., ECG sensors worn on the user's chest that are not integrated with the smart watch, but still communicate with the smart watch).
Fig. 2 shows wearable device 108, which includes processing circuitry 202, sensors 204, wearable user interface 206, wearable device application 208, and memory 210. As noted, the sensors 204 may include multiple sensors integrated with the main wearable portion of the device and/or sensors located elsewhere on the user's body. Wearable device application 208 and signals from sensors 204 may be stored in memory 210.
The user may interact with wearable user interface 206, for example, to enter data such as age, height, weight, and gender, or to view measured or calculated metrics such as heart rate, pulse rate variability, stress level, breathing guidance, and the like.
Wearable device 108 may experience certain configurations during the calibration period. For example, the user may wear the device 108 for a 24 hour calibration period at the time of first use to allow user information to be collected from the sensors 204. For example, the collection of features such as pulse rate or respiratory rate over a period of time may facilitate device calibration and provide user information that facilitates future analysis of the signals and provides health guidance to the user. In some beneficial embodiments, calibration may be performed while the user is wearing a single ECG or other sensor for reference purposes.
The communication devices 102, 104, and 106 may include any type of mobile or stationary device, such as a desktop computer, a notebook computer, a smart phone, a tablet computer, or other communication device. A user may interact with one or more wearable devices, one or more servers, or other components of system 100, for example, using one or more communication devices 102, 104, and 106.
Fig. 3 shows some components of an exemplary communication device 104, including processing circuitry 302, memory 304, a user interface 306, and a communication device application 308. The processing circuitry 302, memory 304, and user interface 306 function similarly to the processing circuitry 202, memory 210, and user interface 206, respectively, of fig. 2, although applications and user interfaces of communication devices will typically have greater functionality than wearable devices.
In some implementations, the communication device application 308 can be a mobile application (e.g., a smartphone application) or a web application. In some implementations, the communication device application 308 may communicate with the user-wearable device application 208 via bluetooth (or any other wired or wireless communication method) and/or may send measurements for archiving and post-processing to a cloud-based database (e.g., database 118). The communication device application 308 may aggregate data from other sensors (e.g., from the user monitoring devices 110 and 112), perform pre-transmission processing locally, and transmit the data for further processing or viewing.
In some embodiments, the user monitoring devices 110 and 112 may include blood pressure monitoring devices (e.g., blood pressure cuffs), weight monitoring devices (e.g., weight scales), blood glucose monitoring devices, and the like. The user monitoring device graphs 110 and 112 may measure a health state of the user that is different from the health state measured by the user-wearable device 108.
The health monitoring and coaching systems and methods detailed herein generally utilize signals from one or more sensors that can be in contact with a user's body and that are sensing information related to the user. The sensors may be integrated with the wearable device, communicate with the wearable device, or may instead be separate from the wearable device and communicate with the system 100 through other components.
As discussed further herein, the system 100 may include components and methods for acquiring specific signals, for processing such signals (e.g., noise reduction), and for modifying signal acquisition methods. Each of these activities may be performed by any component of system 100.
In one implementation, the user-wearable device 108 may capture an optical signal (e.g., a pulse signal) from an optical sensor using green and/or infrared wavelengths. Wearable device 108 may also capture motion signals that may be used to assess noise or interference caused by the motion of user-worn device 108, or to assess other parameters related to health analysis and instruction.
In some implementations, the light and motion signals may be buffered within a memory (e.g., memory 210 in fig. 2) of the user-wearable device 108 for a predetermined period of time, and then the light and motion signals may be provided to other processors to process the signals (e.g., processing circuitry 302 of the communication device 104 or circuitry of the data analysis device 114 in fig. 3). In this way, power consumption of the user-wearable device 108 may be saved or optimized. Optionally, in some embodiments, the processing circuitry 202 of the user-wearable device 108 may be used to process the light pulse signals and the motion signals captured by the user-wearable device 108.
Signals may be collected or acquired from the optical sensor at a sampling frequency of 12 to 50Hz, especially under optimal conditions, such as general lack of user motion plus low levels of perfusion and low ambient light interference. Various conditions may affect what is considered to be the optimal sampling rate, but one of the most influential conditions is the motion of the user wearing the device 108.
By adjusting various parameters related to signal acquisition, signal processing challenges caused by user motion can be overcome. For example, the performance of the optical sensor may be adjusted when activity is detected by a motion sensor (e.g., a three-axis accelerometer). In some embodiments, if motion is detected that exceeds a particular threshold, any or all of the following acquisition parameters of the optical sensor may be adjusted to overcome the noise level and improve the accuracy of the health feature determination: (i) sampling frequency, (ii) LED power, and/or (iii) pulses per sample. Conversely, in some embodiments, if motion below a particular threshold is detected, each of these acquisition parameters may be adjusted to maintain a particular level of performance and measurement accuracy while also conserving power.
A sampling frequency of about 20Hz may be suitable in the general absence of user motion, but in more challenging environments, the sampling frequency may be increased to 100 or 200Hz, or 1000Hz or higher if necessary, to ensure that a signal useful for analysis of the user's health characteristics is received. Other sampling frequencies are also contemplated.
The signals from the sensors discussed herein may be utilized to determine various health characteristics of the user. As one example, sensors associated with a user wearable device, such as a watch, may be used to determine a user's heart rate, Pulse Rate Variability (PRV), or Heart Rate Variability (HRV). Heart rate is typically described as beats per minute, while HRV and PRV both refer to the change in time interval between beats. HRV generally refers to a measure of variability based on an electrocardiogram and can be derived from the R-R interval in a standard PQRS waveform. HRV determination may utilize ECG sensors on the user that may communicate with wearable device 108. PRV, on the other hand, generally refers to a variability determination based on sensors placed near peripheral arteries (e.g., optical sensors on the wrist of the user) that provide a peripheral pulse waveform without the morphological information seen in the ECG signal.
The user health characteristics may be determined through signal analysis performed on the user wearable device 108 or other components of the system 100 (e.g., the communication device 102 or the data analysis device 114), or the analysis may be performed on more than one component of the system 100.
In some embodiments, the received sensor signal may be an ECG signal, and the time at which each heartbeat occurs may be determined, for example, from each R-spike in the ECG waveform. Alternatively, the time at which each heartbeat has occurred may be determined from the PPG signal. In one exemplary embodiment, the time of the heartbeat from the PPG signal may be determined using the maximum point of the PPG gradient map (e.g., see fig. 5). The improved resolution for this determination may be obtained by a variety of methods, such as spline interpolation, which will be discussed in further detail below.
After analyzing the received signal and determining the exact heart beat time (e.g., 10 seconds of sample time elapsed), the heart rate per minute heart beat may be determined.
Referring now to fig. 4 in conjunction with fig. 1, fig. 4 illustrates an exemplary embodiment of the server 116 of fig. 1. As shown in fig. 4, the server 116 includes a processor 117, a database 118, software code 419, a pre-processing module 420, a decomposition module 422, and a heart rate detection module 424. As further shown in fig. 4, the server 116 may be configured to receive the PPG signal 428 and send the heart rate 430 to any component of the system 100 over the network 120. As described above, the concepts described herein may be implemented on the server 116, the wearable device 108, the communication device 106, other elements of the system 100, or a combination thereof.
In other exemplary embodiments, the module components ( modules 420, 422, 424) of the server 117 may be implemented in hardware (including, for example, FPGAs and ASICs), firmware, software, and/or combinations thereof. As used herein, the term "module" is not meant to be limited to a particular physical form. A module may be implemented as firmware, software, hardware and/or combinations thereof based on the particular application. In an exemplary embodiment, the modules may be implemented as a dedicated circuit (e.g., part of an ASIC). This can increase speed and reduce power consumption. In another exemplary embodiment, the modules may be implemented as software running on a digital signal processor and/or a general purpose processor. Various combinations may be implemented. Furthermore, different modules may share common components or be implemented by the same component. There may or may not be explicit boundaries between each module component. Finally, the methods described herein need not be implemented entirely by modules. The modular structure described herein is provided merely as a potential implementation and example to facilitate description.
The "communication" between the modules may also take different forms depending on the form of the modules. For example, dedicated circuits may be coupled to each other by hardwiring or by accessing common registers or memory locations. Software "communication" can occur in a variety of ways to transfer information between modules (or between software and hardware, if this is the case). The term "in communication" is intended to include all of these, and is not intended to be limited to a hard-wired fixed connection between two components. In addition, intermediate elements may be present. For example, when two elements are described as being "in communication with", this does not mean that the elements are directly coupled to each other, nor does it mean that no other element is used between the two elements.
In an exemplary embodiment, the server 116 may be configured to receive, by the processor 417, a photoplethysmogram (PPG) signal 428 transmitted by a PPG sensor of the wearable device 108 worn by the subject. The server 116 may also be configured to process at least a portion of the PPG signal 428 by a band filter to create a band output corresponding to the range of heartbeat intervals. The server 116 may be further configured to determine the first heartbeat and the second heartbeat using the indicated one of the band outputs. Additionally, the server 116 may be configured to determine a heart rate 430 based at least on the first heartbeat and the second heartbeat, and cause the heart rate 430 to be transmitted at least to the wearable device 108.
In an exemplary embodiment, after receiving the PPG signal 428, the processor 117 may be configured to execute the software code 419 to detect the presence of noise in the PPG signal 428 and to perform the exemplary embodiments described herein. The PPG signal 428 may include an original signal that may or may not have noise and artifacts. By detecting the presence of noise in the PPG signal 428, unwanted or unnecessary noise removal operations may be avoided, thereby enabling faster, more efficient heart rate determination.
In an exemplary embodiment, detecting the presence of noise and artifacts may include determining an input instantaneous amplitude estimate of the PPG signal 428 and forming a time-smoothed version of the PPG signal 428. The instantaneous peak amplitude of the main component of the PPG signal 428 tends to stabilize when the signal is noise free. However, in the presence of noise, the instantaneous amplitude tends to fluctuate significantly. Thus, a large deviation of the time-smoothed version of the PPG signal 428 may correspond to a noise burst in the PPG signal 428.
In an exemplary embodiment, the processor 117 may be configured to detect large instantaneous amplitude deviations of the time-smoothed version of the PPG signal 428. When such instantaneous amplitude deviation exceeds a predetermined amount, the processor 117 may be configured to determine that noise and artifacts are present in the PPG signal 428.
In another exemplary embodiment, when the instantaneous amplitude deviation of the time-smoothed PPG signal 428 is less than a predetermined amount, the processor 117 may be configured to determine that noise and artifacts are not present in the PPG signal 428. When the PPG signal 428 is considered free of noise, exemplary embodiments may include not performing pre-processing of the PPG signal 428 to remove noise, as discussed further below.
In yet another exemplary embodiment, the instantaneous amplitude of the PPG signal 428 is compared to a moving average of the instantaneous amplitudes. For example, a moving average of the PPG signal 428 over 30 seconds. If the instantaneous amplitude is greater than the moving average by a predetermined multiplicative factor, then that portion of the PPG signal 428 is marked as noise. In an exemplary embodiment, the predetermined multiplication factor may be a factor of 1.5. In other exemplary embodiments, the predetermined multiplication factor may be greater than 1.5 and/or less than 2.
In one exemplary embodiment, as described above, to ensure complete coverage of the noise portion of the PPG signal 428 when a large instantaneous amplitude deviation is detected, the pre-processing module 420 may be configured to extend the duration of the PPG signal 428 that has been noise-flagged.
While utilizing a time-smoothed version of the PPG signal 428 to determine the instantaneous amplitude deviation of the PPG signal 428 is particularly suitable for detecting the presence of noise, other methods of determining the presence of noise in the PPG signal 428 may be used without departing from the scope and spirit of the exemplary embodiments described herein.
As described above, after processing the PPG signal 428 for noise detection, the server 116 may be configured by the pre-processing module 420 to perform pre-processing of the PPG signal 428.
In an exemplary embodiment, the pre-processing module 420 may be configured to receive the PPG signal 428 and perform pre-processing of the PPG signal 428. In one exemplary embodiment, the pre-processing of the PPG signal 428 may include removing high frequency noise and low frequency artifacts. The pre-processing may also include removing total end effects including noise floor (baseline wander), baseline drift, and DC offset in the PPG signal 428.
In one exemplary embodiment, processing the PPG signal 428 by the pre-processing module 420 may include first removing the total end effects due to the large slow time-varying DC noise floor inherent in the PPG signal 428. This can be achieved by implementing a basic straight-line detrending technique. Since a large DC offset occurs at the end of the original input signal, i.e., at the end of a portion of the PPG signal 428, the substantially straight-line detrending may be used to mitigate the end effects of the PPG signal 428.
In an exemplary embodiment, removing the total end effect may also include removing a pedestal at each end of at least a portion of the PPG signal 428. In an exemplary embodiment, the pedestal at each end of at least a portion of the PPG signal 428 may be estimated by taking an average of the PPG signal 428 signal vector from each end nominally over 2 seconds. A trend line may then be implemented from the first sample time to the end sample time of the PPG signal 428. Thus, the trend line passes through the average corresponding to the first sample time and the end sample time. The value calculated from this trend line is subtracted from the original input signal (i.e., PPG signal 428) to yield a detrended output signal (i.e., filtered PPG signal 428).
In an exemplary embodiment, removing the large artifacts may include implementing high pass and low pass filtering to suppress the large artifacts. The high-pass and low-pass filtering may include implementing cascaded low-pass and high-pass filters to suppress high-frequency and low-frequency artifacts, respectively. In another exemplary embodiment, the high pass filter may be implemented by subtracting the delay-centered output of the internal low pass filter from the input of the low pass filter.
In an exemplary embodiment, the pre-processing filtering may be implemented with a linear phase filter in order to preserve the main morphological features of the underlying PPG signal 428 and to align the time delay from input to output across all frequencies. In another exemplary embodiment, the pre-processing filtering may include utilizing a cascade of rectangular-wave vehicle filters. In one exemplary embodiment, preprocessing the PPG signal 428 may include utilizing band pass filters with corner frequencies of a band pass 0.5 hz high and a band pass 10 hz low.
In another exemplary embodiment, the PPG signal 428 may be subjected to further input processing to remove large artifacts present outside of the desired bandwidth of the PPG signal 428. In yet another exemplary embodiment, other filter schemes for removing noise and artifacts may be utilized, such as blind source separation with independent component analysis, to find independent source signal components and deduce a linear mixture of the underlying sources. Other noise removal filtering processes may be implemented without departing from the scope and spirit of the present embodiments described herein, and are fully contemplated.
In an exemplary embodiment, to eliminate the inherent latency delay associated with pre-processing the PPG signal 428, the output signal of the pre-processing module 420, i.e., the filtered PPG signal 428, may be the same length as the input signal, i.e., the original PPG signal 428, and also aligned in time. In another exemplary embodiment, the length of the output signal may be different from the length of the input signal, and the filtered PPG signals may not be aligned in time. Although the preprocessing methods described above are particularly suited for implementing the exemplary embodiments described herein, other methods of separating a time-series signal into composite subcomponents using signal references may be implemented without departing from the scope and spirit of the present embodiments and are fully contemplated herein.
As used herein, the filtered PPG signal 428 may be referred to simply as the PPG signal 428. Thus, any reference to the filtered PPG signal 428 or simply the PPG signal 428 may refer to a filtered or unfiltered PPG signal, and should not be construed as limiting the PPG signal 428 to a particular implementation.
In an exemplary embodiment, after performing the pre-processing of the PPG signal 428, the pre-processing module 420 may be configured to pass the filtered PPG signal 428 to the decomposition module 422. The decomposition module 422 may then perform operations on the filtered PPG signal 428 in preparation for detecting heart beats and determining a heart rate.
The decomposition module 422 may be configured to decompose the PPG signal 428. The decomposition may be implemented in the linear phase to preserve morphological features of the PPG signal 428. Decomposing the PPG signal 428 may also include separating the PPG signal 428 into a series of sub-signals that generally substantially include the PPG signal 428 (meaning substantially the differences are negligible). Thus, the decomposition module 422 may be used to decompose the PPG signal 428 by separating a set of PPG sub-signals from the PPG signal 428.
Decomposing the PPG signal 428 may include processing at least a portion of the PPG signal 428 through a band filter. In one exemplary embodiment, the band filters may correspond to bandwidth ranges of 0.55-1.37 Hz, 0.78-2.33 Hz, and 1.26-4.25 Hz, respectively. In another exemplary embodiment, the band filter is designed to be less than one octave wide. In other words, the bandwidth of the band filter is selected to prevent two or more consecutive harmonics of the PPG signal from being contained. In this way, for a locally periodic input signal in the frequency band, only the first harmonic of the input signal appears substantially at the output. Thus, at times around each heartbeat, a band filter having a passband (i.e., a bandwidth range) covering the local fundamental pulse rate will be most excited and will therefore exhibit maximum amplitude at the output.
In addition to having a maximum amplitude, the maximum amplitude output band of the band filter will also exhibit the maximum purity of the local sine wave, since only the fundamental harmonic appears at the output of the band filter. Thus, the frequency band output with the largest amplitude corresponds to the fundamental frequency of the input signal (i.e., the principal component of the input signal).
In an exemplary embodiment, the band filter may include a wavelet bank (wavelet bank) of a semi-binary cascade with successively increasing low/high pass intervals. In another exemplary embodiment, the decomposition module 422 may be configured to decompose the PPG signal 428 by a wavelet bank and produce an output. The wavelet bank output (i.e., the band output) may be delay aligned and centered in time on the input signal PPG signal 428. In this manner, inherent delays due to latency associated with the wavelet base may be removed to ensure accurate heart rate determination. Thus, processing at least a portion of the PPG signal 428 by a band filter may include creating a band output.
In one exemplary embodiment, decomposing the PPG signal 428 may include processing the PPG signal 428 through a band filter to create band outputs corresponding to a plurality of ranges of heartbeat intervals. The range of heartbeat intervals may correspond to a range of frequencies associated with an expected heart rate of the subject. For example, the heart beat interval range may correspond to a normal range, a tachycardia range, and a bradycardia range. In other implementations, the heartbeat interval range may correspond to a different range, which may be used to separate the PPG signal 428 into a frequency range corresponding to a range of possible heart rates for the user.
Further signal processing techniques may be implemented to ensure that the band filter produces an output that is robust and free of signal degradation complications. For example, in one exemplary embodiment, utilizing band filters may include applying an input vector gain between each successive cascade in order to address signal attenuation and other signal degradation issues. Various other methods may be used to filter the PPG signal 428, including: matched filter, second derivative, non-linear time scale decomposition, self-adaptive filtering, dynamic time warping, artificial neural network or hidden Markov model.
The decomposition module 422 may be configured to communicate the decomposed portion (e.g., frequency band output) of the PPG signal 428 to the heart rate detection module 424. In an exemplary embodiment, the heart rate detection module 424 may be configured to track the frequency band output of each communication and determine which frequency band output has the greatest amplitude by comparison. The maximum amplitude band output may indicate that the user's heart rate is within this band, and thus this band may be used to determine the heartbeat. Thus, the heart rate detection module 424 may be configured to determine the amplitudes of the band outputs and determine the band output of the largest amplitude of the band outputs, where the identification of the "indicated" band output corresponds to the largest amplitude band output. The indicated frequency band output may then be used to determine the first heartbeat, second heartbeat, and heart rate from the PPG signal 428, as discussed further below.
In another embodiment, the heart rate detection module 424 may be configured to utilize more than one frequency band output. For example, the heart rate detection module 424 may generate a running estimate of the amplitude of the band output and may perform further processing on the band output having the two highest amplitudes. This approach may provide faster heart rate determination/tracking in cases where the heart rate beats change rapidly and may move from one frequency band to another. Thus, in an exemplary embodiment, in addition to determining the maximum amplitude band output, the analysis module 424 may be configured to determine a second maximum amplitude band output and determine an "expected" heartbeat using the second maximum amplitude band output. The "expected" heartbeat may be the appropriate heartbeat to analyze whether the heart rate has moved to the new frequency band. The heart rate detection module 424 may thus be further configured to determine the heart rate 430 using expected heart beats as the indicated frequency band output changes to provide faster heart rate tracking and transmission to the wearable device 108.
For example, in one exemplary embodiment, the maximum amplitude band may correspond to a normal band range, while the second maximum amplitude band output may correspond to a tachycardia rate range. Tracking the two band outputs may then provide faster tracking in the case of rapidly changing heart rates, as may occur in the case of certain arrhythmias, such as atrial fibrillation.
In one embodiment, the heart rate detection module 424 may be configured to "qualify" the second maximum amplitude band for further processing (e.g., determining an expected heartbeat). Defining the second maximum amplitude band output may include, for example, determining whether the second maximum amplitude band output is a sufficient fraction of the maximum amplitude band output. In the event that the second maximum amplitude output is a sufficiently small fraction (e.g., < 0.85), the heart rate detection module 424 may forgo further processing of the second maximum amplitude output frequency band and determination of expected heartbeats in that frequency band.
The heart rate detection module 424 may also be configured to utilize the above-described frequency band output in determining a heartbeat (or, similarly, an expected heartbeat). Determining a heartbeat in this sense generally refers to determining when a heartbeat occurs. These times can then be used to determine the heart rate.
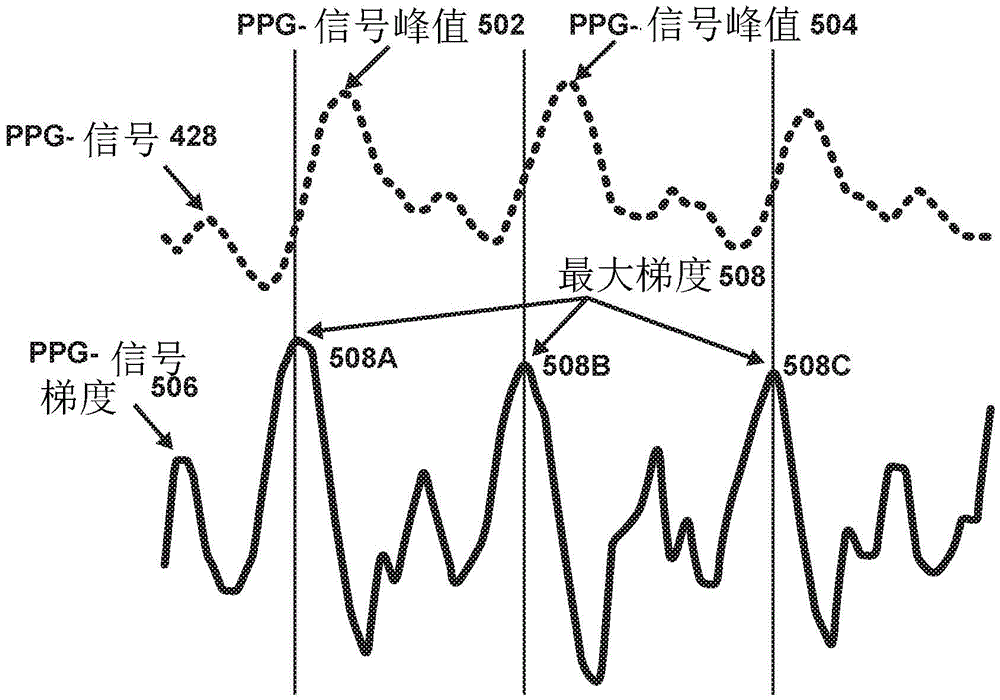
One technique contemplated by the present disclosure for determining the heartbeat utilizes the rate of change of the PPG signal (also referred to as the PPG signal gradient). Fig. 5 depicts an exemplary PPG signal 428 (having a first PPG signal peak 502 and a second PPG signal peak 504) and PPG signal gradient 506 (having maximum gradients 508A, 508B, and 508C).
In an exemplary embodiment, determining the first heartbeat and the second heartbeat may include determining the first heartbeat and the second heartbeat from a maximum gradient 508 of the PPG signal 526.
As shown in fig. 5, the maximum gradient 508 depicts the location of the fastest slope of the PPG signal 528, i.e., the maximum of the PPG signal gradient 506. These positions can then be considered as heartbeats (i.e. the time at which the heartbeat occurs). The heart beat may then be used to determine a heart rate.
The sample rate limitations inherent in the acquisition of PPG signal 428 may cause the PPG signal peaks (502 and 504) and gradient peak (508A, B, C) shown in fig. 5 to appear to be at different locations than the actual peak (which would be depicted if there were no sample rate limitations).
To overcome the sampling resolution limitations inherent in PPG sensing and increase the accuracy of heart rate determination, heart rate detection module 424 may be configured to determine more accurate gradient peaks using various methods. One such method may be explained with reference to fig. 6. Fig. 6 depicts the maximum gradient point 508A from fig. 5, and two other gradient curve points (depicted as PPG gradient points)T-1604 and PPG gradientsT+1606) It may be used, for example, with spline interpolation 610 to determine a more accurate gradient peak 608. Thus, the heart rate detection module 424 may be configured to determine the heartbeat using the maximum gradient 508A, at least two other data points from the gradient of the PPG signal 428, and a mathematical method.
In an exemplary embodiment, the mathematical model may include spline interpolation. Also, the at least two other points may comprise samples of the PPG signal gradient 506 immediately spaced before and after the maximum gradient 508, i.e. PPG gradientsT-1604 and PPG gradientsT+1606. As further shown in FIG. 6, this may be accomplished by using three points (gradients)T-1604. PPG gradientT+1606 and maximum gradient 508A) and spline interpolation determine a better calibrationThe determined gradient peak 608, thereby increasing the accuracy of the heart rate determination.
In one embodiment, a state-based sequence detector may be utilized to determine the other two data points from the gradient of the PPG signal and implement a mathematical approach. Although the state-based sequence detector is particularly suited for implementing the methods for determining other data points and implementing mathematical methods described herein, other implementations may be utilized without departing from the scope and spirit of the implementations described herein.
The above process may be repeated for other intervals that include heartbeats in the PPG signal 428, and the time interval between heartbeats allows the heart rate 430 to be determined. Accordingly, the heart rate detection module 424 may be configured to utilize the above-described example process to determine the heart rate 430 based on at least the first heartbeat and the second heartbeat, and cause the heart rate 430 to be transmitted to at least the wearable device 108 and/or any other component of the system 100.
In another heartbeat determination method, the PPG signal peak is used instead of the gradient peak. For example, heart rate detection module 424 may be configured to utilize the frequency band output signal to determine first and second PPG signal peaks 502, 504 from at least a portion of PPG signal 428 and then to determine first and second heartbeats from first and second PPG signal peaks 502, 504. For example, the heartbeat may be considered to be at the location of the peak of the PPG signal, or at a shift from the peak. The heart rate detection module 424 may then determine a heart rate 430 based on the first heartbeat and the second heartbeat.
To overcome the sampling resolution limitations inherent in the PPG sensing process and increase the accuracy of the heart rate determination, the heart rate detection module 424 may be configured to determine a more accurate PPG signal peak using various methods. One such method may be interpreted similar to the process described above with reference to fig. 6. In a similar manner, the heart rate detection module 424 may be configured to determine the heart beat using the PPG signal peak 502, at least two other data points from the PPG signal 428, and a mathematical approach.
In an exemplary embodiment, the mathematical model may include spline interpolation, but as noted above, other methods may be utilized.
In one embodiment, the at least two other points from the PPG signal 428 may include the PPG signal peak 502 closest to the positive and negative zero crossings. Such PPG signal zero crossings may be determined using a zero crossing narrowband filter. As described above, the zero-crossing narrowband filter may be included in the band filter. The narrow-band nature of the zero-crossing filter tends to produce output waveforms that are locally close to the sine wave of the waveform at each cycle time. Because these waveforms are substantially sinusoidal, they produce well-behaved and reliable zero-crossing signals. The zero-crossing narrowband component of the PPG signal 428 is time-aligned with the PPG signal 428. In this way, the zero crossing function combines (blacket) the PPG signal peaks 502, 504 in the PPG signal 428. As described above, a more accurate PPG signal peak can then be determined using zero crossings and mathematical methods with the original PPG signal peak.
In one embodiment, a state-based sequence detector may be utilized to determine the other two data points from the PPG signal and implement a mathematical approach. Although the state-based sequence detector is particularly suited for implementing the methods for determining other data points and implementing mathematical methods described herein, other implementations may be utilized without departing from the scope and spirit of the implementations described herein.
As discussed, the PPG signal peak or more accurate PPG signal peak may be used to identify the heartbeat at or from the peak location. These heartbeats may then be used to determine a user's heart rate, which may be sent to and displayed on wearable device 108 or any other component of system 100, for example.
As described throughout this disclosure, a user may monitor their cardiac activity with a wearable device (e.g., a smart watch including a PPG sensor). The system 100 may then be configured to alert a user, a healthcare provider, etc. when an arrhythmia type is detected through analysis of the received cardiac data. In one example, an alert may be provided when Atrial Fibrillation (AF) is detected.
Fig. 7 is a diagram illustrating an exemplary process for determining the presence of atrial fibrillation according to certain aspects of the present disclosure. This determination may be performed by executing one or more algorithms that analyze PPG sensor data. In some embodiments, a computer may receive photoplethysmogram (PPG) signal data transmitted by a PPG sensor of a wearable device worn by a user at 710. As discussed herein, the algorithm may determine a heartbeat from at least a portion of the PPG signal data at 720, and may determine a heart rhythm type based at least on the heartbeat at 730. As discussed in detail below, the system may also determine whether the heart rhythm type includes Atrial Fibrillation (AF) at 740. The operations may also include, at 750, displaying an AF detection alert on the wearable device when AF is detected. Details of exemplary algorithms and analysis to detect and identify various heart rhythm types (e.g., normal sinus rhythm or Atrial Fibrillation (AF)) are discussed further below.
Certain exemplary systems, methods, and software contemplated herein may analyze and detect heart rhythm utilizing poincare space (poincare space), which is a two-dimensional space that may be formed and visualized by plotting a current heart beat interval along one axis and a previous interval along another axis. For normal heart rhythms, the points tend to be closely and narrowly distributed around a local average interval. For AF, such points tend to be more widely distributed, with large jumps in intervals occurring with successive heartbeats.
In some example methods, the rhythm determination may utilize a metric based on the space. For example, a metric based on space occupation (e.g., how much space is occupied by the plotted points) and/or a metric based on the median of the distances measured from point to point. Other metrics, such as a metric based on variability of the heartbeat interval, may also be used. Such metrics may be computed over a moving window of consecutive heartbeats (e.g., 48 heartbeats) to balance local temporal focus with stability of the metrics. These metrics may be calculated and updated for each heartbeat and compared to corresponding thresholds, and then if the metrics exceed certain thresholds, a particular mode may be declared. To improve the accuracy of certain rhythm determinations, certain rhythm patterns may only be formally declared if a sufficient number of rhythm patterns are declared on a set of local heart beats.
Fig. 8 is a diagram illustrating an example scatter plot 810 representative of a normal heart rhythm, in accordance with certain aspects of the present disclosure. The scatter plot 810 includes points 820 determined to represent changes in heartbeat interval (or number of heartbeats, heartbeat interval, etc.) over a period of time. Point 820 may represent the variation between two adjacent (or local) heartbeat intervals. As used herein, "adjacent" means that one heartbeat interval may precede or follow another heartbeat interval.
Although such a point 820 is described with reference to fig. 8, it should be understood that the description is equally applicable to references to similar points in the present disclosure (e.g., as shown in fig. 9, 10, and 11). The determination of an exemplary point is further illustrated at the top of fig. 8, where heartbeat 1 and heartbeat 2 may define heartbeat interval 1. Likewise, heartbeat 2 and heartbeat 3 may define heartbeat interval 2, and heartbeat interval 1 and heartbeat interval 2 may together provide the X and Y coordinates of point 1.
The points 820 may be implemented as values stored in a computer memory, for example, in the form of variables, arrays, vectors, matrices, objects, or other such data structures. The dots 820 may be represented graphically or simply in computer memory. The points may be formatted, for example, to represent absolute changes (e.g., 0.5 seconds, -0.1 seconds, etc.) or ratios (e.g., 0.9-when one heartbeat interval is 90% of an adjacent heartbeat interval) of heartbeat intervals. Other expressions of points 820 representing changes in heartbeat interval over a period of time are also contemplated and considered within the scope of the present disclosure.
In further describing exemplary FIG. 8, the horizontal axis of scatter plot 810 refers to one heartbeat interval (e.g., interval n) and the vertical axis refers to a second interval (e.g., previous interval n-1). Point 820 may not change significantly over time when the heart exhibits a normal rhythm type. Thus, a map of points 820 of a normal heart rhythm will typically be localized in a limited region (as shown in FIG. 8). In the illustrated example, point 820 has been normalized by the average heart beat interval (e.g., for a heart beat interval n of 0.6 seconds, a heart beat interval n-1 of 0.4 seconds, this point would fall at point 1 in the example scatter plot). Thus, as shown in fig. 8, such points 820 will lie below the 45 degree line 830 as the heartbeat interval increases. Such a point 820 would be above the 45 degree line 830 when the heartbeat interval is reduced.
Fig. 9 is a diagram illustrating an example moving window 910 based on PPG signal data used in the generation of an example scatter plot 810, according to certain aspects of the present disclosure. A point 820 for determining the heart rhythm type may be determined for a moving window 910 (e.g., a time period) containing a number of heartbeats or heart beat intervals, etc. Accordingly, the points used to generate the exemplary scatter plot and/or the points used to determine the metrics discussed herein may be based on the moving window 910. One exemplary illustration of a moving window 910 is referenced in a spacing map 920 in the top of fig. 9. The moving window 910 contains a plurality of heartbeats or heartbeat intervals, in this example, including a current heartbeat and a current heartbeat interval 930. Although discussed with respect to fig. 8 and 9. The moving window 910 may also be used to generate any of the scatter plots or datasets described herein.
The moving window 910 may be designed to encompass a predetermined number of heartbeats prior to and/or including the current heartbeat. For example, in some embodiments, the moving window 910 may include 50 heartbeats, 100 heartbeats, 192 heartbeats, 500 heartbeats, or the like. In some embodiments, a particular number of heartbeats may be identified as providing an optimization between recency of the heartbeat data and accuracy of the rhythm type determination. For example, 48 heartbeats may be one such specific number.
Similarly, in some embodiments, the moving window 910 may be based on a predefined or optimized time period (e.g., 15 seconds, 30 seconds, one minute, five minutes, etc.). In other embodiments, the moving window 910 may be based on a predetermined number of heartbeat intervals (e.g., 10 heartbeat intervals, 20 heartbeat intervals, 48 heartbeat intervals, 100 heartbeat intervals, etc.), or may be designed to vary in range based on certain factors.
Fig. 10 is a diagram illustrating an example method for determining an occupancy metric from an example scattergram 1010 representing an irregular heart rhythm, in accordance with certain aspects of the present disclosure. The computational algorithms described herein may generate quantitative metrics that may be used to accurately determine the type of heart rhythm, such as AF. Comparing fig. 10 with fig. 8 or 9, it can be seen that the distribution of the points 1020 in fig. 10 is larger. Thus, in some embodiments, the algorithm may determine the occupancy metric based at least in part on the interval spread analysis. Subsequently, and as discussed in more detail below, determining the heart rhythm type may further include utilizing the occupancy metric.
As used herein, the term "interval spread analysis" refers to an analysis of the variation of the heart beat intervals performed by a computer. The change in the heartbeat interval may be represented or visualized as a point in a scatter plot, e.g., fig. 8, 9, 10, etc. The variation of the heartbeat interval can also be represented in the form of an array, table, in the computer memory or calculated from heartbeat data. In such embodiments, the interval scatter analysis may optionally be performed without plotting points in the scatter plot. Interval spread analysis may include quantifying certain characteristics of the distribution of variation in heartbeat intervals. For example as visualized in an exemplary scatter plot. The features (or metrics) may include occupancy associated with points in the scatter plot, as further described herein.
As used herein, an "occupancy metric" refers to a metric (e.g., a number, a vector, or a certain value) that quantifies the distribution of points in a defined space, that is, a metric that provides the degree to which the space is "occupied" by one or more points. The space may be a scatter plot, an array, a table or a graph, etc.
In one exemplary determination of an occupancy metric, the scatter plot 1010 of FIG. 10 may be subdivided into a plurality of regions 1030. An area 1030 that does not contain any points is shaded (e.g., area 1040). In the example of fig. 10, 36 regions 1030 are shown. Due to the distribution of points in scatter plot 1010, 16 of regions 1030 contain at least one point 1020. Thus, in this example, the occupancy of the distribution of point 1020 is 16/36-0.444. By comparison, although not shown, the occupancy metric for the scatter plot 810 in fig. 8 or 9 would be 6/36 ═ 0.166. Thus, the exemplary method demonstrates that when the variation in heartbeat interval is greater (and therefore the likelihood of AF is higher), the occupancy metric can be calculated to yield a higher value. However, it should be understood that the occupancy metric may be calculated and utilized in alternative ways.
Although the example shown in FIG. 10 is discussed in terms of the area of a scatter plot, a computational scheme may be considered that performs similar analysis based on, for example, merging, partitioning, sorting, and the like. Some embodiments of the present subject matter may include defining bins (bins) into which points may fall. The occupancy metric may be determined by determining a score for a bin containing at least one point.
As used herein, "bin" refers to a section, area, volume, or data structure that may potentially include one or more points. For example, a bin implemented by computer software may be a particular region in a scatter plot (as shown in the examples below), portions of the data structure corresponding to these points, and so forth. Thus, embodiments may implement such box-packing, etc., by using arrays, matrices, objects, or other forms of computational data partitioning to represent the heartbeat intervals and regions 1030 shown in fig. 10. For example, the array of dots 1020 may be partitioned or boxed in computer memory according to their location that will fall within a defined area (or range) representing the degree of variation between adjacent intervals.
Fig. 11 is a diagram illustrating an example distance metric for determining from an example scatter plot 1010 representative of an irregular heart rhythm, in accordance with certain aspects of the present disclosure. Similar to the occupancy metric, the algorithm may determine a distance metric based at least in part on points representing changes in heartbeat interval, which may be represented in a scatter plot representation, as shown in fig. 11. As previously described, determining the heart rhythm type may further include utilizing a distance metric.
As used herein, a "distance metric" provides a measure of the degree of change in the heartbeat interval, typically calculated from the "distance" between points representing changes in the heartbeat interval. For example, the distance metric may be based on a calculated distance between points in an exemplary scatter plot (e.g., fig. 11). A large distance metric represents a large change in heartbeat interval (possibly indicating arrhythmia) and a small distance metric represents a small change in heartbeat interval (possibly indicating normal rhythm).
In the following discussion regarding distance metrics, the example of FIG. 11 uses the same scatter plot 1010 and points 1020 as shown in FIG. 10. Similar to that shown in fig. 8, the top of fig. 11 also contains an exemplary illustration of which points, intervals, and heartbeats may be included in determining the distance metric.
In some implementations, the distance metric can be determined from a median of the distances between the points (e.g., point 1020). Similarly, a distance metric may be determined from an average of the distances between the points. In the example of fig. 11, as shown, a first distance (distance 1)1120 between consecutive points 1120 may be calculated. Similarly, a second distance (distance 2)1130 between two other points 1130 may be calculated. Since the points used to compute the distance metric are consecutive in this example, distance 21130 is determined using a common point (point 2) and distance 1
1120 calculated. The distance metric may then correspond to the median of any number of such distances, such as any or all of the points 1020 shown in the scatter plot 1010 or the points included within a particular moving window.
An interval variability metric may also be determined based on a heartbeat interval derived from a plurality of heartbeats (e.g., heartbeats included in a moving window). In some embodiments of the present subject matter, determining the heart rhythm type may further include utilizing such interval variability metric.
As used herein, an "interval variability metric" refers to a measure of the variation of the beat interval for some number of beats. In one example, the interval variability metric may be a standard deviation of the examined interval.
In another example, the interval variability metric may involve examining the variation in heartbeat intervals from one heartbeat to the next. For example, the interval defined by the first and second heartbeats (e.g., interval 1 ═ 1000ms) may be compared to the heartbeat interval defined by the second and third heartbeats (e.g., interval 2 ═ 900 ms). The change from interval 1 to interval 2 would be one hundred milliseconds. Such a change in heartbeat interval from heartbeat to heartbeat may then be averaged over a period of time. Thus, in one example, the interval variability metric may be the median of the absolute change in the heartbeat interval. This exemplary method can be illustrated by the following equation:
interval variability metric, median (ABS (Δ (Interval))) (1)
In another embodiment, an interval variability metric may be calculated based on at least the current heartbeat interval 1210 and the average heartbeat interval 1230 (shown in fig. 12). The heartbeat intervals may be contained in a moving window 1220 (e.g., 192 heartbeats), or may be any other desired set of intervals. In the selection of the exemplary heartbeat interval shown in fig. 12, the average heartbeat interval 1230 of the moving window 1220 is shown by a horizontal line extending from the right side of fig. 12. In some embodiments, the euclidean distance between each pair of heartbeats may be determined, and the median of these distances may be used in this determination. In this example, the current heartbeat interval 1210 is represented by the longer interval on the far right side of the moving window 1220. Thus, since the current heartbeat interval 1210 is significantly different from the average heartbeat interval, the exemplary interval variability metric will be quite large.
In another embodiment, the interval variability metric calculated above may be normalized by the number of heartbeat intervals (e.g., the size of the array). In other embodiments, the interval variability metric may be normalized by the average interval. There may be any number of equivalent ways of calculating or normalizing the interval variability metric, and this disclosure expressly contemplates such ways.
Fig. 13 is a diagram illustrating a three-dimensional space 1310 and discrimination planes (1330, 1340, 1350) that may be used in an exemplary method for determining a heart rhythm type according to certain aspects of the present disclosure. Determining the heart rhythm type may include utilization of an occupancy metric, a distance metric, and a spacing variability metric relative to three-dimensional space.
In some embodiments, the heart rhythm type may be determined based on any combination of the above measures. For example, the heart rhythm type may be determined based on only the occupancy metric, only the distance metric, only the interval variability metric, all three of the occupancy metric, the distance metric, and the interval variability metric, or any combination thereof.
Fig. 13 illustrates an exemplary embodiment in which the determination of the heart rhythm type is based on at least all three of an occupancy metric, a distance metric, and a spacing variability metric. In the illustrated embodiment, the points 1320 may be plotted in a three-dimensional space 1310 defined by at least these three metrics.
In such a three-dimensional space, certain regions may be classified as corresponding to particular heart rhythm types depicted by one or more discrimination planes (1330, 1340, 1350). For example, referring to the NSR-AF plane 1330 depicted in fig. 13, when a point is located on one side of the NSR-AF plane 1330, such point 1320 may be classified as referring to a heartbeat classified as NSR (normal sinus rhythm). Conversely, when a point is on the other side of the NSR-AF plane 1330, the point may be classified as referring to a rhythm of the type AF rhythm.
As shown in fig. 13, in general, a regular heart rhythm will have points 1320 that converge to the beginning of three-dimensional space (i.e., with low occupancy, distance, and variability). A location further from the origin may indicate some type of rhythm irregularity. The different exemplary symbols depicted in fig. 13 indicate the type of heart rhythm determined for a given point. For example, open triangles refer to heart rhythm types that are NSR, open squares refer to heart rhythm types that are AF, and filled circles refer to heart rhythm types that are NAF (i.e., non-AF).
Discrimination planes (1330, 1340, 1350) may be automatically computed based on an algorithm on how such planes are defined. In other implementations, the discrimination planes (1330, 1340, 1350) may be determined from computational optimization of plane parameters (e.g., terms or coefficients in an equation relative to the discrimination planes (1330, 1340, 1350)) of the annotated data. For example, it may be determined that certain sets of points 1320 correspond to particular heart rhythm types. The data may be annotated (e.g., by a physician placing a tag, label, or other metadata at a point in computer memory) to specify the heart rhythm type. The discrimination planes (1330, 1340, 1350) may then be computationally determined so that they best discriminate the classification points 1320. Similarly, such a determination may be made by machine learning.
Fig. 14 is a diagram illustrating a decision tree 1410 of an exemplary method for determining a heart rhythm type according to certain aspects of the present disclosure. Because a given point 1320 may satisfy multiple criteria defined by the discrimination plane, further rules may be implemented to determine the heart rhythm type. In general, an embodiment of a rule for classifying a point as exhibiting a particular heart rhythm type may include first determining which side of a first discrimination plane the point is on, and then determining which side of a second discrimination plane the point is on. For example, the point 1320 may be on the NSR side of the NAF-NSR discrimination plane 1350, and may also be on the AF side of the NSR-AF discrimination plane 1330. The example decision tree 1440 shown in FIG. 14 illustrates one embodiment for establishing a heart rhythm type based on the above considerations. The decision tree 1410 begins at the NAF-NSR decision branch 1420 by first determining on which side of the NAF-NSR plane 1350 the point is. Then, if the point is on the NSR side, a second determination is made at NSR-AF decision branch 1430 as to which side of NSR-AF discrimination plane 1330 the point 1320 is on. When the point 1320 is on the AF side, the rhythm type of the point 1320 is classified as AF. When the point 1320 is on the NSR side, the rhythm type of the point 1320 is classified as NSR.
Returning to the NAF-NSR decision branch 1420, when the point is on the NAF side of the NAF-NSR discrimination plane 1350, a second determination may then be made at the NF-AF decision branch 1440 to classify the point as NAF or AF based on which side of the NAF-AF discrimination plane 1340 the point is located.
Other combinations of decision branches for classifying points as AF, NSR, or NAF are explicitly contemplated by the present disclosure. Similarly, other rules may be added to further add the conditions required for a particular classification, one example being that heartbeats (and dots) marked as "noisy" are not used as part of a data set that is used as a basis for generating an AF alert.
In some embodiments, the presence of a particular heart rhythm type may be determined when a sufficient number of heart rhythm assessments are determined based on locally successive groups of heart beats. In other words, the establishment of a particular heart rhythm type may be based on a) a sufficient number of classification determinations and b) the heartbeat intervals required to establish the particular heart rhythm type are continuous. The term "continuous" means that no invalid heartbeats are required in the heartbeat interval. Invalid heartbeats may be determined, for example, based on the heartbeat detection algorithm described herein, or may be obtained during noisy data (detected by an accelerometer, other sensor, noise detection algorithm, etc.).
Certain embodiments of the present subject matter may include different methods of classifying a particular point as having a particular heart rhythm type. For example, instead of utilizing a discriminating plane, some embodiments may include an algorithm that implements a series of conditional statements, thresholds, decision trees, or other such equivalent logical structures and flows to generate a classification of points. For example, one implementation of such a conditional statement may be that AF ═ is (occupancy metric greater than 0.1, distance metric greater than 20, and interval variability metric greater than 0.2). The previous example of a conditional statement implies three orthogonal planes of discrimination (or thresholds). In other embodiments, the discrimination plane need not be strictly planar, but may be a surface that may contain any degree of local curvature or other shape. In general, the present disclosure contemplates substantially dividing the space (having arbitrary dimensions) into regions of a particular heart rhythm type that may at least partially determine points in a particular region. Such regions may be one-dimensional (e.g., an occupancy metric, a distance metric, or a spacing variability metric greater than a predetermined value), two-dimensional (e.g., a specified region in a two-dimensional space defined by the occupancy metric and the distance metric), three-dimensional (e.g., as shown in the example in fig. 13), or higher-dimensional (e.g., where other rules and metrics have been implemented to create any number of factors that determine the heart rhythm type).
Some implementations of the present subject matter can include generating an output (e.g., a visualization) corresponding to the aforementioned points and graphs and including, for example, any combination of an occupancy metric, a distance metric, an interval variability metric, an average heart beat in a moving window, a first count of heart beats (optionally limited to qualified heart beats) used to calculate the occupancy metric in the moving window, a second count of heart beats (optionally limited to qualified heart beats) used to calculate the distance metric in the moving window, a third count of heart beats (optionally limited to qualified heart beats) used to calculate the interval variability metric in the moving window, and the like. Such output may be generated and provided to a user or healthcare provider through an output device (e.g., a smartphone, a smartwatch, a personal computer, etc.). The output may be provided in the form of an array or matrix (of any dimension), a data file, a graphical display (e.g., as shown in fig. 8-11) or chart, a three-dimensional visualization (e.g., as shown in fig. 13), and the like.
When an alert is required (e.g., indicating the presence of a particular heart rhythm type, such as AF), the alert may be sent to and/or generated at any number or type of devices. The alert may be sent to a wearable device, a computer or server, a smartphone (e.g., used by a doctor, user, caregiver, etc.), and/or the like. The alert may be implemented as an email or text message, or may be audible, graphical, tactile (e.g., vibration), etc.
As described herein, certain embodiments of the present subject matter may include providing an alert to a user based on detection of a particular type of heart rhythm (e.g., AF). However, in some embodiments, the display of an AF detection alert may occur when AF has been determined based on a number of heartbeats greater than an AF detection alert threshold. For example, theoretically, three heartbeats may be sufficient to determine AF based on some embodiments described herein. However, it may be advantageous to rely on larger data sets to obtain a more accurate determination of a particular heart rhythm type. For example, in some embodiments, the minimum number of heartbeats (or points) required before generating an alert (e.g., AF detection alert threshold) may be set to a predetermined number, e.g., 50, 100, 200, etc. In some embodiments, the alarm detection threshold may be customizable (e.g., by the user, by a physician or other caregiver, etc., through a user interface described herein, etc.) such that a single AF heartbeat may be the cause of an alarm for one user, but 50 AF heartbeats, 100 AF heartbeats, etc., may be desired by other users. In some implementations, the AF detection threshold can relate to an amount of time that the user experiences an AF heartbeat and/or other AF-related information.
In other embodiments of the present subject matter, the system may require (electronic) authorization before providing the user with an AF detection alert. In some embodiments, such authorization may be provided electronically by an authorization agent, such as a physician, technician, manufacturer, or other authorized person. The authorization may be stored, for example, as part of a data file on any computing device in communication with the user's wearable device. The authorization may further include an association between the authorization and the particular patient identification. For example, authorization may indicate that the authorizing agent has authorized a particular user (with a patient identification such as a number, code, etc.) to receive an alert (e.g., an AF detection alert). Accordingly, such authorization may allow the wearable device to generate an alert only when such authorization exists (as verified at the wearable device or any other computing system in communication with the wearable device). Accordingly, such embodiments may include receiving a patient identification transmitted by the wearable device; and generating the AF detection alert when authorization is received indicating permission to display the AF detection alert to the user.
As described above, portions of the system 100 may receive PPG signal data transmitted by PPG sensors of a wearable device worn by a user. The PPG signal data may then be used to acquire information such as heart beat, heart rate variability, etc. The PPG signal data may also be analyzed by a computer program to determine a heartbeat interval from at least the PPG signal data. The heartbeat interval may be expressed in time (e.g., 500 milliseconds), although other expressions may be used, such as frequency, number of heartbeats per minute (BPM), and so forth.
It may be beneficial to provide a system, method and graphical user interface implemented by a computer program that allows a user to select a desired PPG signal dataset for viewing or analysis. One example of such an embodiment may include a "patient dashboard" that allows a user to select, view, download, etc. PPG signals or related data. Fig. 15 is a diagram illustrating an example patient dashboard 1510 according to certain aspects of the present disclosure. The patient dashboard 1510 may be provided as part of a web portal, as part of stand-alone software, or otherwise.
The patient dashboard 1510 may include user information such as name, height, weight, minimum heart rate, maximum heart rate, and the like. The patient dashboard 1510 can include information from electronic medical records (e.g., information received from an electronic medical record server). This information may be related to information collected during the data collection time period 1520. The patient dashboard 1510, as shown in fig. 15, may also include a graphical display of the data collection time period 1520.
The data collection time period 1520 may be and/or show a continuous time period of data collection time. Each data collection time period 1520 may be a subset of a larger data collection time period and/or other time period. In various embodiments, the data collection time period 1520 may represent a time period that is seconds in length, minutes in length, and/or hours in length. For example, the data collection time period 1520 may cover a length of about 10 seconds to a length of about 8 hours. As another example, the first data collection time period 1520 may be about ten seconds long and may be a subset of the second data collection time period that is about eight hours long.
As shown, the data collection time period 1520 may provide more details of the collected PPG signal data, such as the date and time of collection, minimum and maximum heart rates, the type of heart rhythm observed (e.g., normal, AF, etc.), and so forth. The data collection period 1520 may include a graphical indication 1530 as to whether an AF rhythm is detected. Other implementations may include providing color coding to certain portions of the graphical interface, for example, highlighting the displayed portion of PPG signal data in red or some other color to distinguish data collection periods 1520 where an AF rhythm has been detected. It should be noted that the AF rhythm is used as an example. Other heart rhythms (e.g., apnea, atrial premature beats, ventricular premature beats, supraventricular tachycardia (e.g., atrial flutter)) are contemplated for detection.
The patient dashboard 1510 may also provide a means for a user to download PPG signal data corresponding to one or more data collection time periods 1520, for example, by pressing a download button on the patient dashboard 1510. The dashboard 1510 may allow a user to similarly select a particular data collection time period 1520 for further viewing of PPG signal details and data analysis, for example, by pressing a view button or selecting a hyperlink embedded in a graphical display. In one embodiment, further details and analysis may be presented on a graphical user interface called a PPG viewer. Although the exemplary term "PPG viewer" is used herein, it should be understood that this interface isDetails relating not only to the PPG signal but also to additional signals, analysis results, etc. may be depicted or provided. For example, the additional signal may include and VO2Percentages, accelerometer information, electrodermal activity (e.g., galvanic skin response from associated sensors), Electromyography (EMG) data, electroencephalography (EEG) data, and/or other signals related to information contained in the system (e.g., in a watchband) and/or in sensors configured to interact with the system.
Fig. 16 is a diagram illustrating an example PPG viewer 1610, according to certain aspects of the present disclosure. The PPG viewer 1610 may be a graphical display (e.g., a web page, etc.) that may include a visualization (e.g., a chart, etc.) based at least in part on PPG signal data over a time interval (e.g., data collection time period 1520), as shown in fig. 15. The PPG viewer 1610 may be displayed on a display device, such as a computer monitor, smartphone screen, or the like.
In some embodiments, the PPG viewer 1610 may include graphical displays of, for example, accelerometer data (XL)1620, PPG signal data (PPG)1630, heart rate data (HR)1640, and heart beat interval data (Intv) 1650. Accelerometer data 1620 may be acquired from an accelerometer that is part of a device containing a PPG sensor, or separate from such a device. For example, the heart rate data 1640 and the heartbeat interval data 1650 may be calculated using methods such as those described above. These types of data may be displayed on a common time basis as shown in FIG. 16.
In the embodiment shown in fig. 16, the PPG viewer 1610 may include an enlarged or zoomed plot 1660 for a particular time period. The time period may be determined automatically or may be controlled by user input through an input device. For example, the user may select a start time 1670 and an end time 1680 (shown graphically in fig. 16 by two vertical lines extending vertically on XL, PPG, HR, and Intv lines). In response to such a selection, for example, the visualization of the PPG signal data 1630 may be automatically adjusted in the expander 1660.
As described herein, certain embodiments of the present disclosure may include determining when a heartbeat occurs based on PPG signal data. Additional functions of the PPG viewer 1610 may then include displaying the heartbeat markers 1690 and the PPG signal data 1630. For example, as shown in fig. 16, the heartbeat markers 1690 can be displayed as short vertical lines on the PPG signal data 1630. In other embodiments, the heartbeat markers 1690 can also include marker heartbeats that have been determined to be noise. As shown in fig. 16, such heartbeat indicia 1690 may be indicated by an "X" (or any other graphical indication). In some embodiments, the heartbeat markers 1690 can be configured to distinguish between AF heartbeats and other types of heartbeats (e.g., heartbeats indicative of normal sinus rhythm, heartbeats indicative of bradycardia, beats indicative of tachycardia, and/or other types of heartbeats). For example, the heartbeat indicia 1690 can have different colors, can include different background colors at corresponding locations on the display, can include a letter code (e.g., a two letter code) indicating the type of heartbeat, and/or be formed from any other type of visual cue that distinguishes between AF heartbeats and other types of heartbeats.
In some implementations, the viewer 1610 may be configured such that the PPG signal data 1630 may be displayed with the indicia 1690 and/or the indicia 1690 may be displayed by themselves without the data 1630. The viewer 1610 may be configured to display a stable version of the data 1630, e.g. showing the timing of the heartbeat in the (horizontal) line of the heartbeat marker 1690 (removing the increasing/decreasing nature of the typical marker corresponding to the typical PPG signal).
In some implementations, the viewer 1610 can facilitate magnification of the selected data range. For example, the viewer 1610 may facilitate zooming in a range of one second of data from a larger range of data (e.g., ten seconds, one minute, or longer). Such magnification may result in a corresponding change in the plot of the corresponding data (e.g., see fig. 8).
Fig. 17 is another example of a PPG viewer 1610, which includes different information in the area of the expanded view 1660, e.g. a waveform at least partially similar to an ECG signal.
The ECG signal may include PQRST waveform features where each letter corresponds to a particular feature present in a typical heartbeat. The "R-wave" portion is the peak most often associated with the heartbeat time. The R waves may be combined with the "Q wave" and the "S wave" to form a so-called QRS complex (or QRS wave). The QRS complex is a set of waves (or waveforms) that represent ventricular depolarization. The QRS complex may include three distinct waves generated by the passage of electrical impulses of the heart through the ventricles, and may occur at the beginning of each ventricular contraction. In some surface electrocardiograms, the R-wave is an upward deflection, the first downward deflection represents the Q-wave, and the last downward deflection is the S-wave. The Q and S waves may be weak and sometimes non-existent. Following the QRS complex, there may be a T wave, which represents the repolarization (or restoration) of the ventricles. Before the QRS complex, there may be a P-wave, which may be due to a positive deflection in the normal surface electrocardiogram due to atrial excitation. The P-wave may represent atrial depolarization, which is an intrinsic atrial event.
One embodiment of the present disclosure may include utilizing PPG signal data at the PPG viewer 1610 but creating a graphical output that looks similar to a graph of ECG data. For example, as shown in fig. 17, certain embodiments may include an Electrocardiogram (ECG) -type waveform 1720, an ECG-type waveform 1720 spanning a heartbeat interval (which may be determined from PPG signal data). For example, in some embodiments, ECG-type waveform 1720 may include a PQRST waveform that includes features indicative of electrical activity in the heart (as shown in fig. 17).
As used herein, "ECG-type waveform" refers to a waveform having at least some characteristics that are indicative or suggestive of a typical ECG waveform. Thus, an ECG-type waveform may resemble an ECG, but need not contain all of the features typically found or depicted in an ECG. For example, as described further below, an ECG-type waveform as used herein may include suppression of P-waves for use as an indication that an AF rhythm has been detected. As used herein, an ECG-type waveform may also include modifications to particular aspects of the PQRST waveform.
The ECG type waveform may be based on a true sensed ECG or may be "synthesized". As used herein, "synthesized" is understood to refer to artificially generated waveforms that have a similar appearance to an ECG, but are not necessarily actual ECG data. For example, a default ECG type waveform may be stored in computer memory and recalled for display to span a heartbeat interval.
An ECG-type waveform may include any combination of P, Q, R, S and T-waves. In one example, an ECG-type waveform may include a scaled RSTPQR waveform with a display between two consecutive heartbeats. Here, the first R-wave may be at a first heartbeat, and the second R-wave (which may be a copy of the first R-wave) may be at a second heartbeat. The S, T, P and Q wave (and a portion of the R wave) may then be scaled accordingly to span the heartbeat interval.
The repeated PQRST waveform may be similar to the repeated rstpqqr waveform, one difference being that the PQRST waveform is somewhat centered on the heartbeat (e.g., R-wave), with appropriate scaling applied on either side of the heartbeat. As shown in fig. 17, such an ECG-type waveform 1720 may be repeated any number of times, with the corresponding waveform appropriately scaled between heartbeats.
As used herein, when an ECG-type waveform is described as "spanning" a heartbeat interval, this means that the ECG-type waveform is graphically scaled in at least one dimension to span or extend beyond a graphical indication of the heartbeat interval. It is contemplated that the waveform may be configured to span between any number of points within the heartbeat signal (e.g., from R to R, P to P, P to T, peak PPG signal to peak PPG signal, peak PPG gradient to peak PPG gradient, etc.). Also, since the heartbeat intervals may vary, the ECG type waveforms may be individually scaled to span the corresponding heartbeat intervals.
In some embodiments, the ECG-type waveform 1820 may be displayed without one or more features that may be present in the ECG. For example, since ECG signals during atrial fibrillation typically show no or little P-waves, some embodiments of the present disclosure may intentionally suppress or eliminate P-waves 1730 from ECG-type waveforms 1820 when AF is detected, as shown in the example of fig. 18.
In some implementations, the ECG-type waveform 1820 may generally include P-waves, but the system may include detecting whether atrial fibrillation is represented in the PPG signal data 1630 based at least on the PPG signal data 1630. Then, when atrial fibrillation is detected, the software can suppress the P-wave 1730 displayed in the ECG-type waveform 1820. As used herein, when referring to a portion of an ECG-type waveform being "suppressed," this can include the portion (e.g., P-wave 1730) being set to the baseline value of ECG-type waveform 1820, being replaced by a line segment connecting the points at which the portion is located, reducing the amplitude of the portion, or otherwise scaling the portion to make it appear smaller when displayed.
In another embodiment, rather than modifying the P-wave 1730 based on detecting an AF rhythm, the ECG-type waveform 1820 may represent an AF rhythm by default and therefore exclude the P-wave 1730. This embodiment may include detecting whether an AF rhythm is represented in the PPG signal data 1630 based at least on the PPG signal data. Then, for example, when no AF rhythm is detected, PPG viewer 1610 may display P-waves 1730 as part of ECG-type waveform 1720.
As described herein, computational analysis of the PPG signal data 1630 may benefit the user or caregiver by allowing diagnostic indications of AF rhythms to be easily displayed in familiar ECG-type waveforms (1720, 1820), but based on the PPG signal data. These operations may produce beneficial results, such as improving medical diagnosis of AF rhythms. Thus, the various implementations of the PPG viewer 1610 described herein are not routine or conventional graphical displays of the PPG signal data 1630 or ECG data, but rather hybrid implementations that utilize some of the features of both. Moreover, the present disclosure provides specific examples of tangible machine operations (e.g., scaling ECG-type waveforms (1720, 1820) to span PPG-derived heartbeat intervals) performed with such embodiments.
Fig. 19 is a diagram illustrating an example graphical interface of a scatter plot 1910 including a point 1920 representing a change in heartbeat interval, according to some aspects of the present disclosure.
The distribution of points 1920 in scatter plot 1910 may help a user determine the presence of an AF rhythm (such as discussed above with reference to fig. 8-11). Similar to other embodiments described herein, the vertical axis may correspond to a heartbeat interval at a first time and the horizontal axis may correspond to a heartbeat interval at a second time. For example, the second time may be an interval immediately after the first interval. In other words, the horizontal axis may display the ith interval, while the vertical axis corresponds to the (i-1) th interval. Other methods of displaying the heartbeat interval are also contemplated by the present disclosure, such as the vertical axis corresponding to the (i + 1) th interval. In general, scatter plot 1910 may display a point 1920 determined by two consecutive heart beat intervals.
Implementations may include, for example, calculating a first heartbeat interval based at least on the PPG signal data 1630. Also, some embodiments may include calculating a second heartbeat interval based at least on the PPG signal data 1630, the second heartbeat interval occurring after the first heartbeat interval. At the graphical interface, a scatter plot 1910 can be generated that depicts changes in heartbeat intervals and includes graphical elements at locations determined by at least the first heartbeat interval and the second heartbeat interval. The graphical element may be, for example, a point (as shown in fig. 19), or any other symbol, character, or visual depiction of a location corresponding to point 1920.
As contemplated by the present disclosure, the graphical display may display any of the graphs described herein in any combination or arrangement on the graphical display, including a graphical interface displaying ECG-type waveforms (1720, 1820) and a scatter plot 1910. In such embodiments, as the start time 1670 and/or end time 1680 changes, in addition to re-rendering the PPG signal data 1630 in the extended PPG map 1660, the display of the point 1920 may be automatically updated in the scatter plot 1910 to reflect the interval that falls within the current adjustable time window.
Fig. 20 is a diagram illustrating an exemplary method of generating an ECG-type waveform according to certain aspects of the present disclosure. The systems, methods, and computer program products contemplated herein may include some or all of the following features in any combination. At 2010, PPG signal data 1630 transmitted by a PPG sensor of a wearable device worn by a user may be received. At 2020, a heartbeat interval may be determined from at least the PPG signal data 1630. At 2030, an Electrocardiogram (ECG) -type waveform 1720 may be generated at the graphical interface, the ECG-type waveform 1720 spanning the heartbeat interval.
Although some embodiments have been described in detail above, other modifications are possible. For example, the method steps illustrated in fig. 7 and described herein do not require the particular order or sequence order shown to achieve desirable results.
Implementations of the present subject matter can include, for example, in any combination of computing systems and programmable processors distributed throughout the computing systems, performing calculations (e.g., determination of heart beat, heart beat interval, processing of signal data, scaling of waveforms, etc.) or displaying any graphical features (e.g., PPG graphs, ECG-type waveforms, scatter plots, etc.) as described herein. Such computing systems may include smart phones, smart watches, personal health monitoring devices, personal computers, laptop or tablet computers, cloud-based servers and network environments, and the like. In this manner, the present disclosure contemplates that the solution may be implemented on a single device, e.g., may be implemented entirely by a smart watch or personal health monitor. Other embodiments of the solutions described herein may be distributed across multiple devices, for example, acquiring sensor data from sensors in contact with a user, transmitting sensor data from a sensing device to a remote computer such as a server via a smartphone, and so forth. The server may execute instructions to perform certain calculations on the data and then transmit the data and/or commands to one or more recipient devices to cause the recipient devices to display specific graphical outputs, generate alerts, and the like.
Implementations of the present subject matter may include, but are not limited to, methods consistent with the description provided herein, as well as articles of manufacture including a tangibly embodied machine-readable medium operable to cause one or more machines (e.g., computers, etc.) to cause operations implementing one or more of the features described above. Similarly, computer systems are also contemplated that may include one or more processors and one or more memories coupled to the one or more processors. The memory, which may include a computer-readable storage medium, may include, encode, store, etc., one or more programs that cause one or more processors to perform one or more of the operations described herein. A computer-implemented method consistent with one or more implementations of the present subject matter may be implemented by one or more data processors residing in a single computing system or across multiple computing systems. Such multiple computing systems may be connected and may exchange data and/or commands or other instructions or the like via one or more connections, including, but not limited to, over a network (e.g., the internet, a wireless wide area network, a local area network, a wide area network, a wired network, etc.), over a direct connection between one or more of the multiple computing systems, or the like.
While certain features of the presently disclosed subject matter have been described for illustrative purposes in connection with certain embodiments, it should be readily understood that such features are not intended to be limiting. The claims following this disclosure are intended to define the scope of the claimed subject matter.
The present disclosure contemplates that the calculations disclosed in the embodiments herein can be performed in a variety of ways applying the same concepts taught herein, and that such calculations are equivalent to the disclosed embodiments.
One or more aspects or features of the subject matter described herein may be implemented in digital electronic circuitry, integrated circuitry, a specially designed Application Specific Integrated Circuit (ASIC), Field Programmable Gate Array (FPGA) computer hardware, firmware, software, and/or combinations thereof. These various aspects or features may include embodiments in one or more computer programs that are executable and/or interpretable on a programmable system including at least one programmable processor, which may be special or general purpose, coupled to receive data and instructions from, or to transmit data and instructions to, a storage system, at least one input device, and at least one output device. A programmable or computing system may include clients and servers. A client and server are generally remote from each other and typically interact through a communication network. The relationship of client and server arises by virtue of computer programs running on the respective computers and having a client-server relationship to each other.
These computer programs (which may also be referred to as programs, software applications, components, or code) include machine instructions for a programmable processor, and may be implemented in a high-level procedural language (an object-oriented programming language), a functional programming language, a logical programming language, and/or an assembly/machine language. As used herein, the term "machine-readable medium" (or "computer-readable medium") refers to any computer program product, apparatus and/or device, such as magnetic disks, optical disks, memory and Programmable Logic Devices (PLDs), for providing machine instructions and/or data to a programmable processor, including a machine-readable medium that receives machine instructions as a machine-readable signal. The term "machine-readable signal" (or "computer-readable signal") refers to any signal used to provide machine instructions and/or data to a programmable processor. A machine-readable medium may store such machine instructions non-transitory, such as non-transitory solid state memory or a magnetic hard drive or any equivalent storage medium. A machine-readable medium may alternatively or additionally store such machine instructions in a transient manner, such as a processor cache or other random access memory associated with one or more physical processor cores.
To provide for interaction with a user, one or more aspects or features of the subject matter described herein may be implemented on a computer having a display device, e.g., a Cathode Ray Tube (CRT) or Liquid Crystal Display (LCD) or Light Emitting Diode (LED) monitor, a keyboard and a pointing device, e.g., a mouse or a trackball, by which the user can provide input to the computer. Other kinds of devices may also be used to provide for interaction with the user. For example, feedback provided to the user can be any form of sensory feedback, such as visual feedback, auditory feedback, or tactile feedback; and input from the user may be received in any form, including but not limited to acoustic, speech, or tactile input. Other possible input devices include, but are not limited to, a touch screen or other touch sensitive device, such as a single or multi-point resistive or capacitive touchpad, voice recognition hardware and software, optical scanners, optical pointers, digital image capture devices and associated interpretation software, and the like.
In the description above and in the claims, phrases such as "at least one" or "one or more" may be presented, followed by a combined list of elements or features. The term "and/or" may also be present in a list of two or more elements or features. Unless implicitly or explicitly contrary to the context of its use, the phrase is intended to mean any element or feature listed either alone or in combination with any other of the recited elements or features. For example, the phrase "at least one of a and B"; "one or more of A and B"; "A and/or B" each means "A alone, B alone or A and B together". Similar explanations apply to lists containing three or more items. For example, at least one of the phrases "A, B and C"; "one or more of A, B and C"; "A, B and/or C" are each intended to mean "A alone, B alone, C alone, A and B together, A and C together, B and C together, or A and B and C together". The use of the term "based on" above and in the claims is intended to mean "based at least in part on" thereby also allowing for features or elements not recited.
Depending on the desired configuration, the subject matter described herein may be embodied in systems, apparatus, methods, computer programs, and/or articles of manufacture. Any method or logic flow depicted in the drawings and/or described herein does not necessarily require the particular order shown, or sequential order, to achieve desirable results. The embodiments set forth in the foregoing description do not represent all embodiments consistent with the subject matter described herein. Rather, they are merely examples consistent with aspects related to the described subject matter. Although some variations have been described in detail above, other modifications or additions are possible. In particular, other features and/or variations may be provided in addition to those set forth herein. The embodiments described above may be directed to various combinations and subcombinations of the disclosed features and/or combinations and subcombinations of the other features described above. Furthermore, the above advantages are not intended to limit the application of any issued claims to methods and structures that achieve any or all of the advantages.
In addition, the section headings should not limit or characterize the invention as set forth in any claims that may issue from this disclosure. In particular, and by way of example, although the headings refer to a "technical field," such claims should not be limited by the language chosen under this heading to describe the so-called technical field. Furthermore, the description of a technology in the "background" should not be construed as an admission that the technology is prior art to any invention in this disclosure. Neither should the summary be viewed as characterizing the invention as set forth in the issued claims. Furthermore, any reference to the disclosure in general or the use of the word "invention" in the singular is not intended to imply any limitation as to the scope of the claims set forth below. Multiple inventions may be set forth according to the limitations of the multiple claims issuing from this disclosure, and such claims accordingly define the invention protected thereby and equivalents thereof.
Claims (92)
Applications Claiming Priority (7)
| Application Number | Priority Date | Filing Date | Title |
|---|---|---|---|
| US201862649530P | 2018-03-28 | 2018-03-28 | |
| US201862649533P | 2018-03-28 | 2018-03-28 | |
| US201862649527P | 2018-03-28 | 2018-03-28 | |
| US62/649,533 | 2018-03-28 | ||
| US62/649,527 | 2018-03-28 | ||
| US62/649,530 | 2018-03-28 | ||
| PCT/US2019/024668 WO2019191487A1 (en) | 2018-03-28 | 2019-03-28 | Photoplethysmogram data analysis and presentation |
Publications (1)
| Publication Number | Publication Date |
|---|---|
| CN112165897A true CN112165897A (en) | 2021-01-01 |
Family
ID=66589873
Family Applications (1)
| Application Number | Title | Priority Date | Filing Date |
|---|---|---|---|
| CN201980034920.6A Pending CN112165897A (en) | 2018-03-28 | 2019-03-28 | Photoplethysmographic data analysis and presentation |
Country Status (5)
| Country | Link |
|---|---|
| EP (1) | EP3773185A1 (en) |
| KR (1) | KR102770226B1 (en) |
| CN (1) | CN112165897A (en) |
| BR (1) | BR112020019815A2 (en) |
| WO (1) | WO2019191487A1 (en) |
Cited By (2)
| Publication number | Priority date | Publication date | Assignee | Title |
|---|---|---|---|---|
| TWI811920B (en) * | 2021-12-27 | 2023-08-11 | 博晶醫電股份有限公司 | Wearing detection method, wearable device, and computer readable storage medium |
| US11944417B2 (en) | 2021-12-27 | 2024-04-02 | bOMDIC Inc. | Wearing detection method, wearable device, and computer readable storage medium |
Families Citing this family (17)
| Publication number | Priority date | Publication date | Assignee | Title |
|---|---|---|---|---|
| CA2797980C (en) | 2010-05-12 | 2015-08-18 | Irhythm Technologies, Inc. | Device features and design elements for long-term adhesion |
| KR20150111970A (en) | 2013-01-24 | 2015-10-06 | 아이리듬 테크놀로지스, 아이엔씨 | Physiological monitoring device |
| EP4218580A1 (en) | 2014-10-31 | 2023-08-02 | Irhythm Technologies, Inc. | Wireless physiological monitoring device and systems |
| EP3893742A4 (en) | 2018-12-14 | 2022-09-07 | Heartbeam, Inc. | PORTABLE DEVICE FOR AUTOMATIC HEART RISK ASSESSMENT AND DIAGNOSIS |
| WO2020232040A1 (en) | 2019-05-13 | 2020-11-19 | Heartbeam, Inc. | Compact mobile three-lead cardiac monitoring device |
| KR102823873B1 (en) * | 2019-12-19 | 2025-06-24 | 삼성전자 주식회사 | An electronic device and method of detecting peak point of an optical sensor data in the same |
| KR102563372B1 (en) | 2020-02-12 | 2023-08-03 | 아이리듬 테크놀로지스, 아이엔씨 | Method for Inferring Patient Physiological Characteristics Using Non-Invasive Cardiac Monitors and Recorded Cardiac Data |
| EP3865059B1 (en) * | 2020-02-13 | 2022-11-30 | Qompium | Computer-implemented method for synchronizing a photoplethysmography (ppg) signal with an electrocardiogram (ecg) signal |
| US11350864B2 (en) | 2020-08-06 | 2022-06-07 | Irhythm Technologies, Inc. | Adhesive physiological monitoring device |
| CN116322498A (en) | 2020-08-06 | 2023-06-23 | 意锐瑟科技公司 | Electronic assembly of physiological monitoring device |
| CN112070067B (en) * | 2020-10-12 | 2023-11-21 | 乐普(北京)医疗器械股份有限公司 | Scatter diagram classification method and device for photoplethysmograph signals |
| KR20220053364A (en) | 2020-10-22 | 2022-04-29 | 삼성전자주식회사 | Wearable device and method for measuring biometric information |
| USD1063079S1 (en) | 2021-08-06 | 2025-02-18 | Irhythm Technologies, Inc. | Physiological monitoring device |
| WO2023071501A1 (en) | 2021-11-01 | 2023-05-04 | 北京荣耀终端有限公司 | Heart rate detection method and electronic device |
| CN116058814B (en) * | 2021-11-01 | 2024-12-13 | 北京荣耀终端有限公司 | Heart rate detection method and electronic device |
| KR102811115B1 (en) * | 2022-11-30 | 2025-05-26 | 한국전자기술연구원 | Method for extracting PPG signal based on smartphone camera video |
| KR102674567B1 (en) * | 2023-10-12 | 2024-06-12 | (주)케이스마텍 | User authentication system and method using wearable device |
Citations (8)
| Publication number | Priority date | Publication date | Assignee | Title |
|---|---|---|---|---|
| US20040092836A1 (en) * | 2002-11-11 | 2004-05-13 | Medtronic, Inc. | Algorithms for detecting atrial arrhythmias from discriminatory signatures of ventricular cycle lengths |
| US20050049663A1 (en) * | 2003-08-29 | 2005-03-03 | Harris Charmaine K. | Percutaneous flat lead introducer |
| US20110124979A1 (en) * | 2007-08-21 | 2011-05-26 | Conor Heneghan | Method and system for monitoring sleep |
| US20140221845A1 (en) * | 2012-06-25 | 2014-08-07 | Xerox Corporation | Determining cardiac arrhythmia from a video of a subject being monitored for cardiac function |
| KR20150083000A (en) * | 2014-01-07 | 2015-07-16 | 삼성전자주식회사 | Apparatus and method for measuring a heart rate using photoplethysmography in a electronic device |
| CN105147274A (en) * | 2015-08-04 | 2015-12-16 | 河北工业大学 | Method for extracting heart rate from visible spectrum section face video signal |
| CN106691423A (en) * | 2015-11-13 | 2017-05-24 | 庆旺科技股份有限公司 | Wearable device for evaluating heart health through heartbeat signal and signal processing method |
| US20170340218A1 (en) * | 2014-12-10 | 2017-11-30 | Gert Küchler | Method and device for determining at least one physiological parameter |
Family Cites Families (3)
| Publication number | Priority date | Publication date | Assignee | Title |
|---|---|---|---|---|
| KR100995318B1 (en) | 2009-03-27 | 2010-11-19 | 서울과학기술대학교 산학협력단 | Signal detection device and method |
| KR101912090B1 (en) | 2012-02-08 | 2018-10-26 | 삼성전자 주식회사 | Apparatus and method for generating an atrial fibrillation prediction, apparatus and method for predicting an atrial fibrillation |
| KR102409381B1 (en) | 2014-07-14 | 2022-06-15 | 삼성전자주식회사 | Method and apparatus for processing biosignal using recursive estimation |
-
2019
- 2019-03-28 CN CN201980034920.6A patent/CN112165897A/en active Pending
- 2019-03-28 KR KR1020207031103A patent/KR102770226B1/en active Active
- 2019-03-28 EP EP19724961.8A patent/EP3773185A1/en active Pending
- 2019-03-28 BR BR112020019815-3A patent/BR112020019815A2/en not_active Application Discontinuation
- 2019-03-28 WO PCT/US2019/024668 patent/WO2019191487A1/en not_active Ceased
Patent Citations (8)
| Publication number | Priority date | Publication date | Assignee | Title |
|---|---|---|---|---|
| US20040092836A1 (en) * | 2002-11-11 | 2004-05-13 | Medtronic, Inc. | Algorithms for detecting atrial arrhythmias from discriminatory signatures of ventricular cycle lengths |
| US20050049663A1 (en) * | 2003-08-29 | 2005-03-03 | Harris Charmaine K. | Percutaneous flat lead introducer |
| US20110124979A1 (en) * | 2007-08-21 | 2011-05-26 | Conor Heneghan | Method and system for monitoring sleep |
| US20140221845A1 (en) * | 2012-06-25 | 2014-08-07 | Xerox Corporation | Determining cardiac arrhythmia from a video of a subject being monitored for cardiac function |
| KR20150083000A (en) * | 2014-01-07 | 2015-07-16 | 삼성전자주식회사 | Apparatus and method for measuring a heart rate using photoplethysmography in a electronic device |
| US20170340218A1 (en) * | 2014-12-10 | 2017-11-30 | Gert Küchler | Method and device for determining at least one physiological parameter |
| CN105147274A (en) * | 2015-08-04 | 2015-12-16 | 河北工业大学 | Method for extracting heart rate from visible spectrum section face video signal |
| CN106691423A (en) * | 2015-11-13 | 2017-05-24 | 庆旺科技股份有限公司 | Wearable device for evaluating heart health through heartbeat signal and signal processing method |
Non-Patent Citations (1)
| Title |
|---|
| 杨昭;杨学志;霍亮;刘雪南;李江山;: "抗运动干扰的人脸视频心率估计", 电子与信息学报, no. 06 * |
Cited By (2)
| Publication number | Priority date | Publication date | Assignee | Title |
|---|---|---|---|---|
| TWI811920B (en) * | 2021-12-27 | 2023-08-11 | 博晶醫電股份有限公司 | Wearing detection method, wearable device, and computer readable storage medium |
| US11944417B2 (en) | 2021-12-27 | 2024-04-02 | bOMDIC Inc. | Wearing detection method, wearable device, and computer readable storage medium |
Also Published As
| Publication number | Publication date |
|---|---|
| KR102770226B1 (en) | 2025-02-18 |
| BR112020019815A2 (en) | 2021-01-05 |
| KR20210018202A (en) | 2021-02-17 |
| WO2019191487A1 (en) | 2019-10-03 |
| EP3773185A1 (en) | 2021-02-17 |
Similar Documents
| Publication | Publication Date | Title |
|---|---|---|
| US11234658B2 (en) | Photoplethysmogram data analysis and presentation | |
| KR102770226B1 (en) | Photoplethysmography data analysis and presentation | |
| US12290368B2 (en) | Detection of atrial fibrillation | |
| JP6745762B2 (en) | System and method for providing real-time signal partitioning and fiducial alignment framework | |
| US20190298209A1 (en) | Heartbeat detection | |
| van Gent et al. | Heart rate analysis for human factors: Development and validation of an open source toolkit for noisy naturalistic heart rate data | |
| EP3292813B1 (en) | Method and device for processing bio-signals | |
| Lee et al. | ECG measurement system for vehicle implementation and heart disease classification using machine learning | |
| JP6842306B2 (en) | Biological signal processing method, its device, and computer-readable recording medium | |
| Ghosh et al. | Detection of essential hypertension with physiological signals from wearable devices | |
| CN117271977B (en) | HRV data preprocessing method and device and electronic equipment | |
| CN114631790A (en) | Sleep staging method, device, equipment and storage medium based on wearable equipment | |
| Jegan et al. | High-performance ECG signal acquisition for heart rate measurement | |
| Chou et al. | Comparison between heart rate variability and pulse rate variability for bradycardia and tachycardia subjects | |
| JP7332723B2 (en) | System for detecting QRS complexes in an electrocardiogram (ECG) signal | |
| Phuphanin et al. | Electrocardiogram signal processing algorithm on microcontroller using wavelet transform method. | |
| Yao et al. | Machine learning-based CAD detection using integrated ECG and PCG parameter features | |
| Singh et al. | Signal Quality Evaluation and Processing for QRS Detection in ECG based Smart Healthcare Systems | |
| Karnewar et al. | Preprocessing ECG signal by eliminating various noises using denoising methods | |
| Raach et al. | Garma modeling of ecg and classification of arrhythmia | |
| Katsoupis et al. | Pulsense: An AI-Driven Cardiovascular Monitoring and Arrhythmia Detection System | |
| Karim et al. | Effect of Number of Modes of EMD in Respiratory Rate Estimation from PPG Signal | |
| Thompson et al. | An open affective platform | |
| CN121059178A (en) | Respiratory electrocardio information integrated record display method and system based on integral space-time characteristics | |
| Chen et al. | Hybrid neural network for real-time arrhythmia detection and blood pressure trend prediction in wearable monitoring systems. |
Legal Events
| Date | Code | Title | Description |
|---|---|---|---|
| PB01 | Publication | ||
| PB01 | Publication | ||
| SE01 | Entry into force of request for substantive examination | ||
| SE01 | Entry into force of request for substantive examination | ||
| WD01 | Invention patent application deemed withdrawn after publication | ||
| WD01 | Invention patent application deemed withdrawn after publication |
Application publication date: 20210101 |