Estimations of Nitrogen Concentration in Sugarcane Using Hyperspectral Imagery

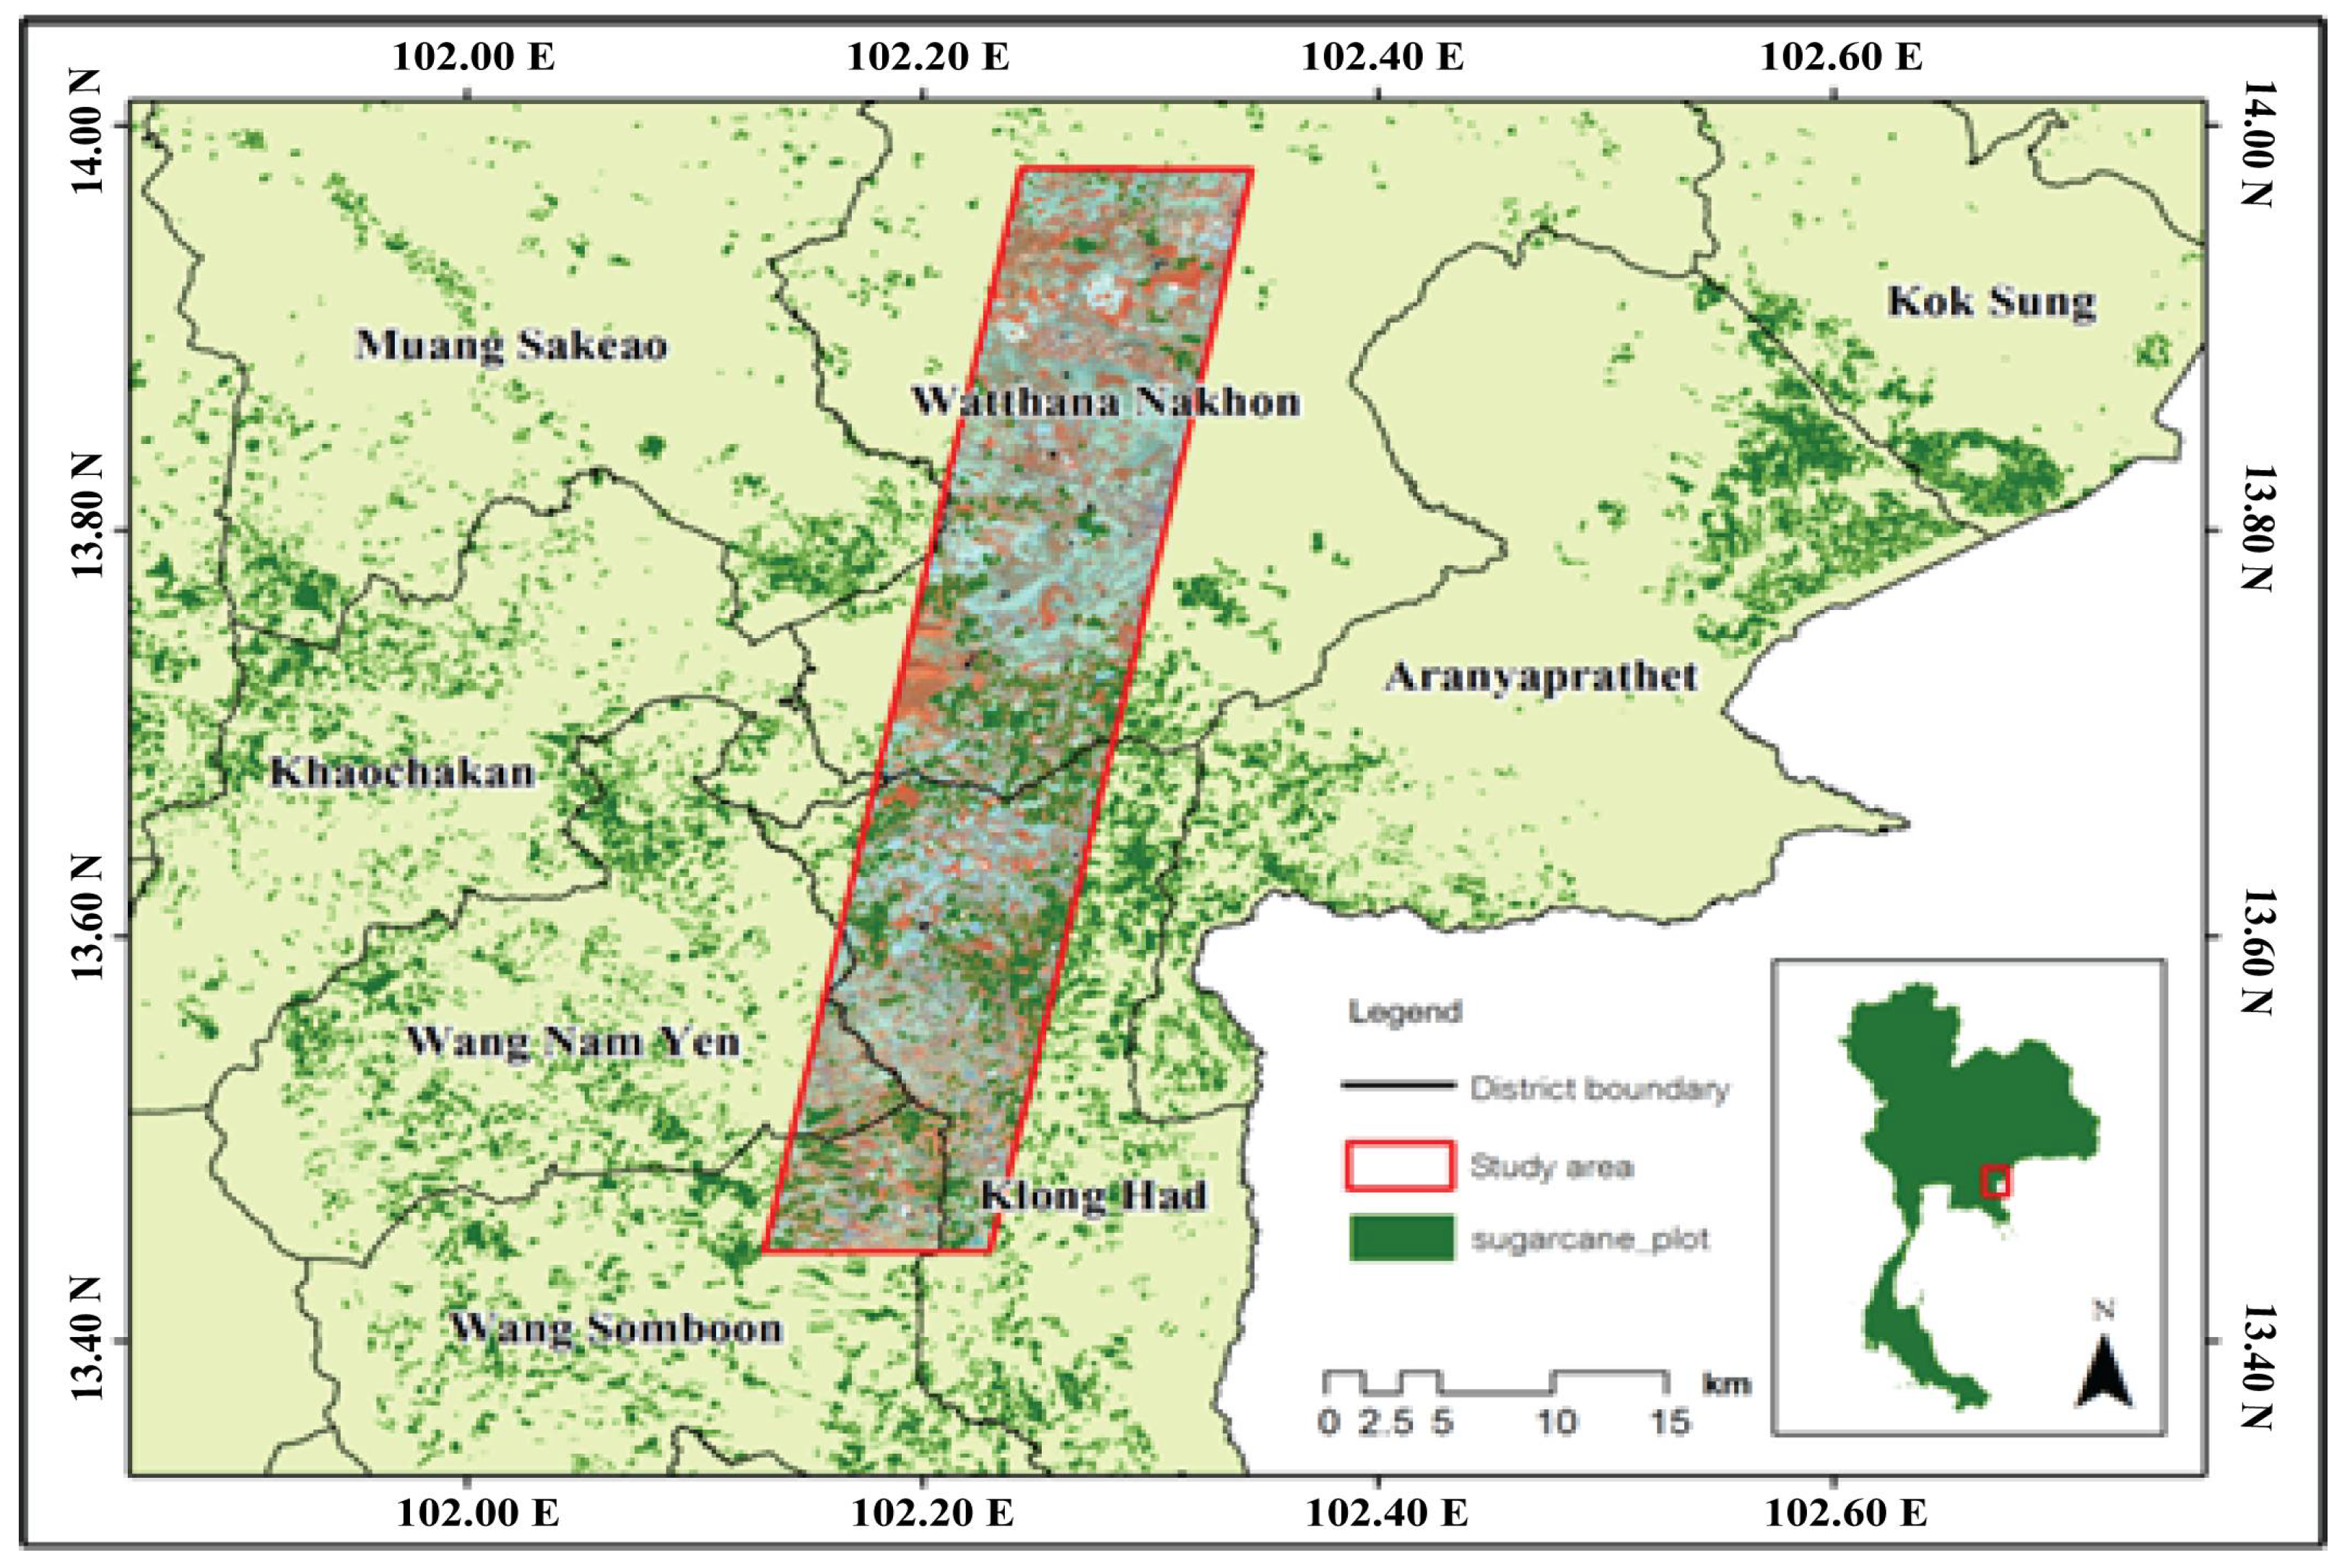
<p>The study experimental plots in Sakaeo Province, the eastern region of Thailand.</p> "> Figure 2
<p>Sampling design for field data collection.</p> "> Figure 3
<p>Measured versus estimated CNC in each sugarcane cultivar; the model was developed by a Stepwise Multiple Linear Regression (SMLR) approach with three different datasets: (<b>a</b>) First derivative spectrum (FDS); (<b>b</b>) Continuum-Removed Derivative Reflectance (CRDR); and (<b>c</b>) Band depth (BD).</p> "> Figure 4
<p>Spatial distribution of canopy nitrogen concentration (% nitrogen) in sugarcane using a Stepwise Multiple Linear Regression approach (SMLR) calculated from CRDR data sets.</p> "> Figure 5
<p>Measured versus estimated CNC in each sugarcane cultivar; the model was developed with the SVR/KPCA approach with three different datasets; (<b>a</b>) FDS; (<b>b</b>) CRDR and (<b>c</b>) BD.</p> "> Figure 5 Cont.
<p>Measured versus estimated CNC in each sugarcane cultivar; the model was developed with the SVR/KPCA approach with three different datasets; (<b>a</b>) FDS; (<b>b</b>) CRDR and (<b>c</b>) BD.</p> "> Figure 6
<p>Spatial distribution of canopy nitrogen concentration (% nitrogen) in sugarcane using Support Vector Regression (SVR) based RBF Kernel calculated from 11 KPCA components of BD data set, SVR free optimal parameters are <span class="html-italic">C</span> = 1.3, <span class="html-italic">ε</span> = 0.01, <span class="html-italic">γ</span> = 0.04.</p> ">
Abstract
:1. Introduction
2. Materials and Methods
2.1. Study Area
2.2. Research Methodology Overview
2.3. Data Acquisition
2.3.1. Field Data Collection
2.3.2. Chemical Analysis of Foliar Samples
2.4. Image Pre-Processing
2.4.1. Geometric Correction
2.4.2. Radiance Transformation
2.4.3. Atmospheric Correction
2.4.4. Band Noise Reduction
2.5. Spectral Transformation
2.5.1. First-Derivative Spectrum: FDS
2.5.2. Absorption Features
- (i)
- Continuum-Removed Derivative Reflectance (CRDR) was derived using a first-derivative transformation to the continuum-removed reflectance spectrum R′ as described in Equation (3).
- (ii)
- Band depth (BD) was derived by omitting the continuum-removed reflectance at specific wavelength i from 1 shown as in Equation (4)
2.6. Feature Dimensionality Reduction
2.7. Mapping of Sugarcane CNC Using Multivariate Based Statistical Methods
2.8. Mapping of Sugarcane CNC Using SVR Based Machine Learning Approach
2.9. Model Validation
3. Results
3.1. Descriptive Statistics of Measured Nitrogen Concentration
3.2. Estimation of Sugarcane CNC from Hyperion Satellite Image using a Multiple Linear Regression Approach
3.3. Estimation of Sugarcane CNC from Hyperion Satellite Image Using Support Vector Regression
4. Discussion
5. Conclusions
Acknowledgments
Author Contributions
Conflicts of Interest
Abbreviations
| CNC | Canopy Nitrogen Concentration |
| SVR | Support Vector Regression |
| RBF | Radial Basis Function |
| SMLR | Stepwise Multiple Linear Regression |
| KPCA | Kernel Principal Component Analysis |
| FDS | First Derivative Spectrum |
| CRDR | Continuum-Removed Derivative Reflectance |
| BD | Band Depth |
| LOO | Leave One Out cross validation |
References
- Grof, C.P.L.; Campbell, J.A. Sugarcane sucrose metabolism: Scope for molecular manipulation. Aust. J. Plant Physiol. 2001, 28, 1–12. [Google Scholar] [CrossRef]
- Zarco-Tejada, P.J.; Ustin, S.L.; Whiting, M.L. Temporal and spatial relationship between within field yield variability in cotton and high spatial hyperspectral remote sensing imagery. Agron. J. 2005, 97, 641–652. [Google Scholar] [CrossRef]
- Field, C.; Mooney, H.A. The photosynthesis-nitrogen relationship in wild plants. In On the Economy of Plant Form and Function; Givnish, T.J., Ed.; Cambridge University Press: Cambridge, UK, 1986; pp. 25–55. [Google Scholar]
- Abdel-Rahman, E.M.; Ahmed, F.B.; van den Berg, M. Estimation of sugarcane leaf nitrogen concentration using in situ spectroscopy. Int. J. Appl. Earth Obs. Geoinf. 2010, 12S, S552–S557. [Google Scholar] [CrossRef]
- Mohan, B.K.; Porwal, A. Hyperspectral image processing and analysis. Curr. Sci. 2015, 108, 833–841. [Google Scholar]
- Kokaly, R.F.; Despain, D.G.; Clark, R.N.; Livo, K.E. Mapping vegetation in Yellow stone National Park using spectral feature analysis of AVIRIS data. Remote Sens. Environ. 2003, 84, 437–456. [Google Scholar] [CrossRef]
- Schmidt, K.S.; Skidmore, A.K. Spectral discrimination of vegetation types in a coastal wetland. Remote Sens. Environ. 2003, 85, 92–108. [Google Scholar] [CrossRef]
- Johnson, R.M.; Richard, E.P., Jr. Prediction of sugarcane sucrose content with high resolution, hyperspectral leaf reflectance measurements. Int. Sugar J. 2011, 113, 48–55. [Google Scholar]
- Mokhele, A.; Ahmed, F.B. Estimation of leaf nitrogen and silicon using hyperspectral remote sensing. J. Appl. Remote Sens. 2010, 4, 1–18. [Google Scholar]
- Galvao, L.S.; Formaggio, A.R.; Tisot, D.A. Discrimination of Sugarcane Varieties in Southeastern Brazil with EO-1 Hyperion data. Remote Sens. Environ. 2005, 94, 523–534. [Google Scholar] [CrossRef]
- Apan, A.; Held, A.; Phinn, S.; Markley, J. Spectral Discrimination and Classification of Sugarcane Varieties using EO-1 Hyperion Hyperspectral Imagery. In Proceedings of the 25th Asian Conference on Remote Sensing, Chiang Mai, Thailand, 22–26 November 2004; Available online: www.gisdevelopment.net/aars/2004/hyper/acrs2004_a1001.asp (accessed on 15 May 2014).
- Miphokasap, P.; Honda, K.; Vaiphasa, C.; Souris, M.; Nagai, M. Estimating canopy nitrogen concentration in sugarcane using field imaging spectroscopy. Remote Sens. 2012, 4, 1651–1670. [Google Scholar] [CrossRef]
- Lebourgeois, V.; Bégué, A.; Labbé, S.; Mallavan, B.; Prévot, L.; Roux, B. Can Commercial Digital Cameras Be Used as Multispectral Sensors? A Crop Monitoring Test. Sensors 2008, 8, 7300–7322. [Google Scholar] [CrossRef] [PubMed] [Green Version]
- Bappel, E.; Begue, A.; Despinoy, M.; Buchon, Y.; Siegmund, B. Spectral indices as bio-indicators of sugarcane crop condition from hyperspectral CASI data. In Proceedings of the IEEE International Geosciences and Remote Sensing Symposium, Toulouse, France, 21–25 July 2003; pp. 516–563. [Google Scholar]
- Matson, P.; Johnson, L.; Billow, C.; Milier, J.; Pu, R. Seasonal patterns and remote spectral estimation of canopy chemistry across the Oregon transect. Ecol. Appl. 1994, 4, 280–298. [Google Scholar] [CrossRef]
- Darvishzadeh, R.; Skidmore, A.; Schlerf, M.; Atzberger, C.; Corsi, F.; Cho, M. LAI and chlorophyll estimation for a heterogeneous grassland using hyperspectral measurements. ISPRS J. Photogramm. Remote Sens. 2008, 63, 409–426. [Google Scholar] [CrossRef]
- Thenkabail, P.S.; Smith, R.B.; De Pauw, E. Hyperspectral vegetation indices and their relationships with agricultural crop characteristics. Remote Sens. Environ. 2000, 71, 158–182. [Google Scholar] [CrossRef]
- Li, F.; Miao, Y.; Chen, X.; Zhang, H.; Jia, L.; Bareth, G. Estimating Winter Wheat Biomass and Nitrogen Status using an Active Crop Sensor. Intell. Autom. Soft Comput. 2010, 16, 1219–1228. [Google Scholar]
- Wang, Z.; Wang, T.; Darvishzadeh, R.; Skidmore, A.K.; Jones, S.; Suarez, L.; Woodgate, W.; Heiden, U.; Heurich, M.; Hearne, J. Vegetation Indices for Mapping Canopy Foliar Nitrogen in a Mixed Temperate Forest. Remote Sens. 2016, 8, 491. [Google Scholar] [CrossRef]
- Gökkaya, K.; Valerie Thomas, V.; Noland, T.L.; McCaughey, H.; Morrison, I.; Treitz, P. Prediction of Macronutrients at the Canopy Level Using Spaceborne Imaging Spectroscopy and LiDAR Data in a Mixedwood Boreal Forest. Remote Sens. 2015, 7, 9045–9069. [Google Scholar] [CrossRef]
- Curran, P.J.; Dungan, J.L.; Peterson, D.L. Estimating the foliar biochemical concentration of leaves with reflectance spectrometry: Testing the Kokaly and Clark methodologies. Remote Sens. Environ. 2001, 76, 349–359. [Google Scholar] [CrossRef]
- Kokaly, R.F.; Clark, R.N. Spectroscopic determination of leaf biochemistry using band-depth analysis of absorption features and stepwise multiple linear regression. Remote Sens. Environ. 1999, 67, 267–287. [Google Scholar] [CrossRef]
- Martin, M.E.; Aber, J.D. Estimation of forest canopy lignin and nitrogen concentration and ecosystem processes by high spectral resolution remote sensing. Ecol. Appl. 1997, 7, 431–443. [Google Scholar] [CrossRef]
- Mutanga, O.; Skidmore, A.K. Continuum-removed absorption features estimate tropical savanna grass quality in situ. In Proceedings of the 3rd EARSeL Workshop on Imaging spectroscopy, EARSeL, Hersching, Germany, 13–16 May 2003; pp. 542–558. [Google Scholar]
- Motulsky, H.J.; Christopoulos, A. Fitting Models to Biological Data Using Linear and Nonlinear Regression: A Practical Guide to Curve Fitting, 2nd ed.; GraphPad Software Inc.: San Diego, CA, USA, 2003. [Google Scholar]
- Foody, G.M. Land cover classification by an artificial neural network with ancillary information. Int. J. Geogr. Inf. Syst. 1995, 9, 527–542. [Google Scholar] [CrossRef]
- Keiner, L.E.; Yan, X.H. A neural network model for estimating sea surface chlorophyll and sediments from thematic mapper imagery. Remote Sens. Environ. 1998, 66, 153–165. [Google Scholar] [CrossRef]
- Mutanga, O.; Skidmore, A.K. Integrating imaging spectrometry and neural networks to map grass quality in the Kruger National Park, South Africa. Remote Sens. Environ. 2004, 90, 104–115. [Google Scholar] [CrossRef]
- Cortes, C.; Vapnik, V. Support-Vector Networks, Machine Learning; Kluwer Academic Publishers: Dordrecht, The Netherlands, 1995; pp. 273–297. [Google Scholar]
- Vapnik, V. Structure of Statistical Learning Theory. In Computational Learning and Probabilistic Reasoning; Gammerman, A., Ed.; John Wiley and Sons: Hoboken, NJ, USA, 1996; pp. 33–41. [Google Scholar]
- Huang, C.L.; Wang, C.J. A GA-based feature selection and parameters optimization for support vector machines. Expert Syst. Appl. 2006, 31, 231–240. [Google Scholar] [CrossRef]
- Cherkassky, V.; Ma, Y. Comparison of model selection for regression. Neural Comput. 2003, 15, 1691–1714. [Google Scholar] [CrossRef] [PubMed]
- Durbha, S.S.; King, R.L.; Younan, N.H. Support vector machines regression for retrieval of leaf area index from multiangle imaging spectroradiometer. Remote Sens. Environ. 2007, 107, 348–361. [Google Scholar] [CrossRef]
- Camp-Valls, G.; Gomez-Chova, L.; Munoz-Mari, J.; Vila-Frances, J.; Calpe-Maravilla, J. Composite kernels for hyperspectral image classification. IEEE Geosci. Remote Sens. Lett. 2006, 3, 93–97. [Google Scholar] [CrossRef]
- Thenkabail, P.S.; Enclona, E.A.; Ashton, M.S.; van der Meer, V. Accuracy assessments of hyperspectral waveband performance for vegetation analysis applications. Remote Sens. Environ. 2004, 91, 354–376. [Google Scholar] [CrossRef]
- Datt, B.; McVicar, T.R.; Van Niel, T.G.; Jupp, D.L.B.; Pearlman, J.S. Preprocessing EO-1 Hyperion hyperspectral Data Support the Application of agricultural indexes. IEEE Trans. Geosci. Remote Sens. 2003, 41, 1246–1259. [Google Scholar] [CrossRef]
- Dawson, T.P.; Curran, P.J. A new technique for interpolating the reflectance red edge position. Int. J. Remote Sens. 1998, 19, 2133–2139. [Google Scholar] [CrossRef]
- De Jong, S.M. Imaging spectrometry for monitoring tree damage caused by volcanic activity in the long valley caldera, California. Int. J. Appl. Earth Obs. Geoinf. 1998, 1, 1–10. [Google Scholar]
- Van der Maaten, L.; Postma, E.; Van Den Herik, H. Dimensionality reduction: A comparative review. J. Mach. Learn. Res. 2009, 10, 1–41. [Google Scholar]
- Cao, J.J.; Lee, S.C.; Ho, K.F.; Zhang, X.Y.; Zou, S.C.; Fung, K.K.; Chow, J.C.; Watson, J.G. Characteristics of carbonaceous aerosol in Pearl River Delta region, China during 2001 winter period. Atmos. Environ. 2003, 37, 1451–1460. [Google Scholar] [CrossRef]
- Darvishzadeh, R.; Skidmore, A.; Schlerf, M.; Atzberger, C.; Corsi, F.; Cho, M. Estimation of leaf area index and chlorophyll for a Mediterranean grassland using hyperspectral data. In Proceedings of the International Archives of the Photogrammetry, Remote Sensing and Spatial Information Sciences, Beijing, China, 3–11 July 2008; pp. 409–426. [Google Scholar]
- Yi, C.H.; Sogah, D.K.; Boyce, M.; Degterev, A.; Christofferson, D.E.; Yuan, J. A genome-wide RNAi screen reveals multiple regulators of caspase activation. J. Cell Biol. 2007, 179, 619–626. [Google Scholar] [CrossRef] [PubMed]
- Mutanga, M.; Skidmore, A. Hyperspectral band depth analysis for a better estimation of grass biomass (Cenchrusciliaris) measured under controlled laboratory conditions. Int. J. Appl. Earth Obs. Geoinf. 2004, 5, 87–96. [Google Scholar] [CrossRef]
- Yao, X.; Huang, Y.; Shang, G.; Zhou, C.; Cheng, T.; Tian, Y.; Cao, W.; Zhu, Y. Evaluation of Six Algorithms to Monitor Wheat Leaf Nitrogen Concentration. Remote Sens. 2015, 7, 14939–14966. [Google Scholar] [CrossRef]
- Thenkabail, P.S. Optimal hyperspectralnarrowbands for discriminating agricultural crops. Remote Sens. Rev. 2002, 20, 257–291. [Google Scholar] [CrossRef]
- Li, F.; Miao, Y.; Feng, G.; Yuan, F.; Yue, S.; Gao, X.; Liu, Y.; Liu, B.; Ustin, S.L.; Chen, X. Improving estimation of summer maize nitrogen status with red edge-based spectral vegetation indices. Field Crops Res. 2014, 157, 111–123. [Google Scholar] [CrossRef]
- Blackburn, G.A. Quantifying chlorophylls and carateniods at leaf and canopy scales: An evaluation of some hyperspectral approaches. Remote Sens. Environ. 1998, 66, 273–285. [Google Scholar] [CrossRef]
- Mutanga, O.; Skidmore, A.K. Red edge shift and the quality of tropical grass canopies. ISPRS J. Photogramm. Remote Sens. 2007, 62, 34–42. [Google Scholar] [CrossRef]
- Elvidge, C.D.; Chen, Z. Comparison of broadband and narrow-band red and near-infrared vegetation indices. Remote Sens. Environ. 1995, 54, 38–48. [Google Scholar] [CrossRef]
- Abdel-Rahman, E.M.; Ahmed, F.B.; Ismail, R. Random forest regression and spectral band selection for estimating sugarcane leaf nitrogen concentration using EO-1 Hyperion hyperspectral data. Int. J. Remote Sens. 2013, 34, 712–728. [Google Scholar] [CrossRef]


| Sensor | Acquisition Date | Spatial Resolution (m) | Spectral Resolution (nm) | Bands 1 | Wavelength (nm) |
|---|---|---|---|---|---|
| EO-1- Hyperion | 29 January 2012 (winter) | 30 | 10 (approx.) | 8 to 57 | 426.8–925.4 |
| 79 to 120 | 932.6–1346.2 | ||||
| 128 to 166 | 1426.9–1810.3 | ||||
| 179 to 223 | 1941.5–2385.4 |
| Data Set | Min | Max | Mean | Std Deviation |
|---|---|---|---|---|
| K84-200 | 0.508 | 0.663 | 0.591 | 0.065 |
| KK-3 | 0.626 | 0.843 | 0.728 | 0.090 |
| LK92-11 | 0.597 | 0.835 | 0.720 | 0.083 |
| UT-8 | 0.513 | 0.644 | 0.586 | 0.047 |
| Pooled | 0.508 | 0.843 | 0.669 | 0.067 |
| Variable | Wavelengths λ (nm) | Pooled Data Set | |
|---|---|---|---|
| R2cv | RMSEcv | ||
| FDS | 660/721/1134/1265 | 0.73 | 0.039 |
| CRDR | 721/1205/1265/1769 | 0.74 | 0.038 |
| BD | 721/742 | 0.60 | 0.042 |
| Estimation Model | Data Set | No. of PCs | Optimal SVR Parameters | R2cv | RMSEcv |
|---|---|---|---|---|---|
| SVR/Linear | FDS | 15 | C = 0.82, ε = 0.03 | 0.63 | 0.043 |
| SVR/RBF | FDS | 17 | C = 0.47, ε = 0.03, γ = 0.03 | 0.65 | 0.041 |
| SVR/Linear | CRDR | 11 | C = 0.65, ε= 0.04 | 0.66 | 0.042 |
| SVR/RBF | CRDR | 13 | C = 0.8, ε = 0.02, γ = 0.06 | 0.74 | 0.038 |
| SVR/Linear | BD | 10 | C = 0.42, ε = 0.04 | 0.73 | 0.039 |
| SVR/RBF | BD | 11 | C = 1.3, ε = 0.01, γ = 0.04 | 0.78 | 0.035 |
© 2018 by the authors. Licensee MDPI, Basel, Switzerland. This article is an open access article distributed under the terms and conditions of the Creative Commons Attribution (CC BY) license (http://creativecommons.org/licenses/by/4.0/).
Share and Cite
Miphokasap, P.; Wannasiri, W. Estimations of Nitrogen Concentration in Sugarcane Using Hyperspectral Imagery. Sustainability 2018, 10, 1266. https://doi.org/10.3390/su10041266
Miphokasap P, Wannasiri W. Estimations of Nitrogen Concentration in Sugarcane Using Hyperspectral Imagery. Sustainability. 2018; 10(4):1266. https://doi.org/10.3390/su10041266
Chicago/Turabian StyleMiphokasap, Poonsak, and Wasinee Wannasiri. 2018. "Estimations of Nitrogen Concentration in Sugarcane Using Hyperspectral Imagery" Sustainability 10, no. 4: 1266. https://doi.org/10.3390/su10041266