[go: up one dir, main page]

Next Issue
Volume 10, May
Previous Issue
Volume 10, March
 
 
sustainability-logo

Journal Browser

Journal Browser

Sustainability, Volume 10, Issue 4 (April 2018) – 408 articles

Cover Story (view full-size image): 
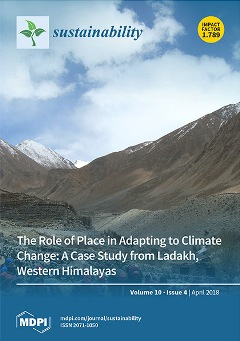
Deep within the western Himalayas, farmers are adapting to rapid changes in their environment. Receding glaciers, warming air temperatures, and other shifts brought about by climate change are affecting traditional ways of life. At the same time, broader socioeconomic and political forces, such as globalization and migration, are influencing local livelihoods. The convergence of multiple pressures onto communities in the Himalayas underscores the value of social cohesion, resilience, and sense of place. View this paper
  • Issues are regarded as officially published after their release is announced to the table of contents alert mailing list.
  • You may sign up for e-mail alerts to receive table of contents of newly released issues.
  • PDF is the official format for papers published in both, html and pdf forms. To view the papers in pdf format, click on the "PDF Full-text" link, and use the free Adobe Reader to open them.
Order results
Result details
Section
Select all
Export citation of selected articles as:
18 pages, 784 KiB  
Article
The Effects of Diversification Activities on the Technical Efficiency of Organic Farms in Switzerland, Austria, and Southern Germany
by Sebastian Lakner, Stefan Kirchweger, Daniel Hoop, Bernhard Brümmer and Jochen Kantelhardt
Sustainability 2018, 10(4), 1304; https://doi.org/10.3390/su10041304 - 23 Apr 2018
Cited by 21 | Viewed by 7360
Abstract
The diversification of farms can be a result of multifunctional farming, however, in some cases at the cost of lower farm efficiency. In our paper we investigate the influence of para-agricultural diversification on productivity and the technical efficiency of organic farms in Austria, [...] Read more.
The diversification of farms can be a result of multifunctional farming, however, in some cases at the cost of lower farm efficiency. In our paper we investigate the influence of para-agricultural diversification on productivity and the technical efficiency of organic farms in Austria, Switzerland, and Southern Germany. We show the benefits and drawbacks of diversification for organic farms, which go beyond the core agricultural production (para-agriculture). We do this by estimating a Stochastic Frontier (SF) combined with a metafrontier model. The data-set consists of bookkeeping data with 1704 observations in the years 2003 to 2005. Para-agricultural diversification activities have a significant effect on both productivity and technical efficiency of organic farms: The farm output in Austria and Switzerland is positively influenced by diversification, whereas we observe a rather small effect in Southern Germany. On the other hand, diversification can reduce farms’ technical efficiency, as it is the case in Switzerland and Germany. Furthermore, our study confirms previous results that agricultural subsidies significantly influence the technical efficiency of organic farms. We also show expected changes of input use driven by increased farm diversification. Full article
Show Figures

Graphical abstract

Graphical abstract
Full article ">Figure 1
<p>Output distance function with two outputs (see Färe and Primont, 1995 [<a href="#B37-sustainability-10-01304" class="html-bibr">37</a>]).</p>
Full article ">Figure 2
<p>Returns to scale (RTS) on organic farms in (<b>a</b>) Switzerland (<b>b</b>) Austria and (<b>c</b>) Germany. Source: own calculation, number of observations in Switzerland: 639, in Austria: 732 and in Germany: 318.</p>
Full article ">
19 pages, 518 KiB  
Article
Simplicity and Sustainability: Pointers from Ethics and Science
by Mehrdad Massoudi and Ashwin Vaidya
Sustainability 2018, 10(4), 1303; https://doi.org/10.3390/su10041303 - 23 Apr 2018
Cited by 2 | Viewed by 6697
Abstract
In this paper, we explore the notion of simplicity. We use definitions of simplicity proposed by philosophers, scientists, and economists. In an age when the rapidly growing human population faces an equally rapidly declining energy/material resources, there is an urgent need to consider [...] Read more.
In this paper, we explore the notion of simplicity. We use definitions of simplicity proposed by philosophers, scientists, and economists. In an age when the rapidly growing human population faces an equally rapidly declining energy/material resources, there is an urgent need to consider various notions of simplicity, collective and individual, which we believe to be a sensible path to restore our planet to a reasonable state of health. Following the logic of mathematicians and physicists, we suggest that simplicity can be related to sustainability. Our efforts must therefore not be spent so much in pursuit of growth but in achieving a sustainable life. Full article
Show Figures

Figure 1

Figure 1
<p>The above figures show the time evolution of population under the assumptions of (<b>a</b>) a constant and (<b>b</b>) diminishing carrying capacity. In the first panel, the population is constrained to reach an equilibrium value which is set by the constant carrying capacity, i.e., assuming that one can maintain a steady state of resources. When the population is sufficiently high, our high rate of consumption forces resources (carrying capacity) to decline with time which then drags down the population of the species with it.</p>
Full article ">
11 pages, 508 KiB  
Article
Hybrid Electric Vehicles: Some Theoretical Considerations on Consumption Behaviour
by Fabio Carlucci, Andrea Cirà and Giuseppe Lanza
Sustainability 2018, 10(4), 1302; https://doi.org/10.3390/su10041302 - 23 Apr 2018
Cited by 34 | Viewed by 9256
Abstract
Solving the problem of the lack of environmental sustainability in transport activities requires the involvement of new technologies, particularly in populated cities where mobility activities play a major role in generating externalities. The move from cars powered by conventional internal combustion engines to [...] Read more.
Solving the problem of the lack of environmental sustainability in transport activities requires the involvement of new technologies, particularly in populated cities where mobility activities play a major role in generating externalities. The move from cars powered by conventional internal combustion engines to cars powered by alternative energies can make an important contribution to reducing emissions and achieving a more sustainable transport system. Unfortunately, green car market development still remains uncertain because of the higher production costs of batteries and engines. In this context, surprisingly little attention has been devoted to analysing the economic factors affecting consumers’ behaviour in the choice of hybrid electric vehicles. To fill this gap, the diffusion process of hybrid technology as well as intrinsic and extrinsic motivations and the crowding-out effect on consumers’ purchasing decisions are taken under consideration. Finally, some policy recommendations are provided. Full article
(This article belongs to the Section Economic and Business Aspects of Sustainability)
Show Figures

Figure 1

Figure 1
<p>Distribution of cars by fuel type in European Union (EU) 28 (Years 2015 and 2016). Source: Our elaboration on Eurostat data.</p>
Full article ">
26 pages, 5181 KiB  
Article
Results from On-The-Ground Efforts to Promote Sustainable Cattle Ranching in the Brazilian Amazon
by Erasmus K.H.J. Zu Ermgassen, Melquesedek Pereira de Alcântara, Andrew Balmford, Luis Barioni, Francisco Beduschi Neto, Murilo M. F. Bettarello, Genivaldo De Brito, Gabriel C. Carrero, Eduardo De A.S. Florence, Edenise Garcia, Eduardo Trevisan Gonçalves, Casio Trajano Da Luz, Giovanni M. Mallman, Bernardo B.N. Strassburg, Judson F. Valentim and Agnieszka Latawiec
Sustainability 2018, 10(4), 1301; https://doi.org/10.3390/su10041301 - 23 Apr 2018
Cited by 53 | Viewed by 12428
Abstract
Agriculture in Brazil is booming. Brazil has the world’s second largest cattle herd and is the second largest producer of soybeans, with the production of beef, soybeans, and bioethanol forecast to increase further. Questions remain, however, about how Brazil can reconcile increases in [...] Read more.
Agriculture in Brazil is booming. Brazil has the world’s second largest cattle herd and is the second largest producer of soybeans, with the production of beef, soybeans, and bioethanol forecast to increase further. Questions remain, however, about how Brazil can reconcile increases in agricultural production with protection of its remaining natural vegetation. While high hopes have been placed on the potential for intensification of low-productivity cattle ranching to spare land for other agricultural uses, cattle productivity in the Amazon biome (29% of the Brazilian cattle herd) remains stubbornly low, and it is not clear how to realize theoretical productivity gains in practice. We provide results from six initiatives in the Brazilian Amazon, which are successfully improving cattle productivity in beef and dairy production on more than 500,000 hectares of pastureland, while supporting compliance with the Brazilian Forest Code. Spread across diverse geographies, and using a wide range of technologies, participating farms have improved productivity by 30–490%. High-productivity cattle ranching requires some initial investment (R$1300–6900/ha or US$410–2180/ha), with average pay-back times of 2.5–8.5 years. We conclude by reflecting on the challenges that must be overcome to scale up these young initiatives, avoid rebound increases in deforestation, and mainstream sustainable cattle ranching in the Amazon. Full article
(This article belongs to the Special Issue Environmentally Sustainable Livestock Production)
Show Figures

Figure 1

Figure 1
<p>(<b>a</b>) Deforestation fell 70% from the mid-2000s onwards; (<b>b</b>) even as the cattle herd in the Amazon biome continued to grow. Data from: [<a href="#B25-sustainability-10-01301" class="html-bibr">25</a>,<a href="#B26-sustainability-10-01301" class="html-bibr">26</a>].</p>
Full article ">Figure 2
<p>Dairy farming is dominated by family farms, both in terms of (<b>a</b>) the number of properties, and (<b>b</b>) number of dairy cattle. Data from: [<a href="#B33-sustainability-10-01301" class="html-bibr">33</a>]. Family farming in Brazil is legally defined by a maximum farm size (ranging from 20–440 ha, dependent on the region), the number of permanent employees, and the proportion of non-agricultural income.</p>
Full article ">Figure 3
<p>Map of Brazil, with the Amazon biome colored in green, and the municipalities where the sustainable cattle initiatives reported in this article are present shown in other colors.</p>
Full article ">Figure 4
<p>Leguminous pasture plants (above the dashed line) have higher protein content than conventional grasses (below dashed line). Source: [<a href="#B45-sustainability-10-01301" class="html-bibr">45</a>].</p>
Full article ">Figure 5
<p>Nelore cattle (Bos indicus) grazing mixed pasture: forage peanut (Arachis pintoi cv. Belomonte) (the yellow flowering plants) with <span class="html-italic">Brachiara</span> spp.</p>
Full article ">Figure 6
<p>Two estimates for the emissions per kilogram of beef of conventional ranches and Novo Campo Program farms. Piatto and Costa Junior [<a href="#B53-sustainability-10-01301" class="html-bibr">53</a>] compare emissions on pilot farms before pasture intensification (baseline), with emissions after two years of participating in the initiative. Bogaerts et al. [<a href="#B8-sustainability-10-01301" class="html-bibr">8</a>] compare farms participating in the Novo Campo Program with neighboring non-participating farms. While both studies include emissions from enteric fermentation, manure management, pasture fertilization, and fossil fuels required for pasture restoration, Bogaerts et al. also include emissions from concentrate feed production, and Piatto and Costa Junior include carbon sequestration in improved pasture and soil carbon emissions from degraded pasture. No emissions from land use change are included, because no recent deforestation occurred on sampled farms.</p>
Full article ">Figure 7
<p>(<b>a</b>) High-yielding cattle pasture (right) on a Novo Campo Program farm, one month after replanting, compared with conventional, unreformed pasture (left); (<b>b</b>) Stocking rate in intensified pasture plots for the period January 2013–September 2014. The grey dashed line represents the mean stocking rate for farms in the region. Adapted from: [<a href="#B38-sustainability-10-01301" class="html-bibr">38</a>].</p>
Full article ">Figure 8
<p>(<b>a</b>) Producer standing with a tree line of 4-month old leguminous trees in an Idesam silvopastoral system; (<b>b</b>) silvopastoral system once the bushes and trees are 2 years old.</p>
Full article ">Figure 9
<p>(<b>a</b>) Installation of underground piping to deliver water to each plot in the Silvopastoral System with Rotational Grazing for Dairy initiative; (<b>b</b>) Dairy cattle drinking from one of the water troughs, with electric fencing in the foreground.</p>
Full article ">Figure 10
<p>Around 10% of each property in the Florestas de Valor initiative is divided into small plots using fences lined with leguminous trees (yellow lines in the main image). Top right: intensified pasture area shown within the total farm boundary (black line). Lower right: The farm location is shown as a point within Sao Felix do Xingu (municipality colored in blue). State abbreviations: PA = Pará, MT = Mato Grosso, TO = Tocantins.</p>
Full article ">Figure 11
<p>Relative importance (1 = least important, 6 = most important) of six different channels for recruiting farmers into the six initiatives described in this article. All initiatives recruited farmers opportunistically, as knowledge about the initiatives was spread for the most part through word-of-mouth, field days where neighboring farmers were invited to tour participating farms, and the training of rural extension officers in GAP. Idesam’s beef and dairy initiatives took similar approaches to recruitment, and so the results are grouped for these two initiatives.</p>
Full article ">Figure 12
<p>(<b>a</b>) The most important barriers to the implementation of sustainable cattle initiatives, and (<b>b</b>) the solutions to these barriers, as identified in the survey of the organizations running the six sustainable cattle ranching initiatives described in this article.</p>
Full article ">
23 pages, 1840 KiB  
Review
What Is Going on with Stakeholder Theory in Project Management Literature? A Symbiotic Relationship for Sustainability
by Diego F. Uribe, Isabel Ortiz-Marcos and Ángel Uruburu
Sustainability 2018, 10(4), 1300; https://doi.org/10.3390/su10041300 - 23 Apr 2018
Cited by 37 | Viewed by 14256
Abstract
Nowadays the advance towards sustainability poses a global challenge for modern society as well as for companies. Professionals and academics continually redefine business processes and design management mechanisms in a more appropriate way in order to allow companies to balance economic activity with [...] Read more.
Nowadays the advance towards sustainability poses a global challenge for modern society as well as for companies. Professionals and academics continually redefine business processes and design management mechanisms in a more appropriate way in order to allow companies to balance economic activity with the environmental and social impact that they generate. Under this complex and dynamic scenario, creating a product, providing a service, or achieving a given result requires a different interpretation of the efficiency paradigm and an adequate socio-environmental intelligence. In the context of project management, sustainability-related knowledge, skills, and suitable tools are necessary to face this challenge. Moreover, its close relationship with stakeholder theory presents an alternative to approach that purpose. This article attempts a systematic review of the literature on stakeholder theory in project management during the past nine years, with the aim of providing a comprehensive view of this relationship, revealing its impact and influence on sustainability, and finding new research paths. We highlight the potential benefits derived from this relationship, either as an instrument for the promotion of corporate social responsibility and inclusive policies, as a means for the generation of shared value and technological innovation, or as a key factor in the strategy and business management of a given project. Full article
(This article belongs to the Special Issue Project Management and Sustainable Development)
Show Figures

Figure 1

Figure 1
<p>Methodology procedure.</p>
Full article ">Figure 2
<p>Preliminary thematic classification of articles included in the literature review by keyword analysis.</p>
Full article ">Figure 3
<p>Descriptive data: (<b>a</b>) Year of publication; (<b>b</b>) number of publications per database; (<b>c</b>) number of publications per journal; (<b>d</b>) number of articles published in IJPM and PMJ per year.</p>
Full article ">Figure 3 Cont.
<p>Descriptive data: (<b>a</b>) Year of publication; (<b>b</b>) number of publications per database; (<b>c</b>) number of publications per journal; (<b>d</b>) number of articles published in IJPM and PMJ per year.</p>
Full article ">Figure 4
<p>Concept map of the stakeholder theory and project management literature review showing the different research streams.</p>
Full article ">
18 pages, 2916 KiB  
Article
Simulating Spatial-Temporal Changes of Land-Use Based on Ecological Redline Restrictions and Landscape Driving Factors: A Case Study in Beijing
by Zimu Jia, Bingran Ma, Jing Zhang and Weihua Zeng
Sustainability 2018, 10(4), 1299; https://doi.org/10.3390/su10041299 - 23 Apr 2018
Cited by 31 | Viewed by 5157
Abstract
A change in the usage of land is influenced by a variety of driving factors and policies on spatial constraints. On the basis of considering the conventional natural and socio-economic indicators, the landscape pattern indicators were considered as new driving forces in the [...] Read more.
A change in the usage of land is influenced by a variety of driving factors and policies on spatial constraints. On the basis of considering the conventional natural and socio-economic indicators, the landscape pattern indicators were considered as new driving forces in the conversion of land use and its effects at small regional extent (CLUE-S) model to simulate spatial and temporal changes of land-use in Beijing. Compared with traditional spatial restrictions characterized by small and isolated areas, such as forest parks and natural reserves, the ecological redline areas increase the spatial integrity and connectivity of ecological and environmental functions at a regional scale, which were used to analyze the distribution patterns and behaviors of land use conversion in the CLUE-S model. The observed results indicate that each simulation scenario has a Kappa coefficient of more than 0.76 beyond the threshold value of 0.6 and represents high agreements between the actual and simulated land use maps. The simulation scenarios including landscape pattern indicators are more accurate than those without consideration of these new driving forces. The simulation results from using ecological redline areas as space constraints have the highest precision compared with the unrestricted and traditionally restricted scenarios. Therefore, the CLUE-S model based on the restriction of ecological redline and the consideration of landscape pattern factors has shown better effectiveness in simulating the future land use change. The conversion of land use types mainly occurred between construction land and cropland during the period from 2010 to 2020. Meanwhile, a large number of grasslands are being changed to construction lands in the mountain towns of northwest Beijing and large quantities of water bodies have disappeared and been replaced by construction lands due to rapid urbanization in the eastern and southern plains. To improve the sustainable use of land resources, it is necessary to adopt the construction and development mode of satellite towns rather than encouraging a disorderly expansion of downtown areas. Full article
(This article belongs to the Special Issue Sustainable Land Uses and Rural Governance)
Show Figures

Figure 1

Figure 1
<p>The geographical location of Beijing.</p>
Full article ">Figure 2
<p>Overview of the proposed model.</p>
Full article ">Figure 3
<p>Actual land-use maps in Beijing during 2010–2015 ((<b>a</b>) 2010; (<b>b</b>) 2015).</p>
Full article ">Figure 4
<p>Spatial restriction maps in Beijing ((<b>a</b>) Traditional restricted regions; (<b>b</b>) Ecological redline areas).</p>
Full article ">Figure 5
<p>Scenarios of land use simulation in 2015.</p>
Full article ">Figure 6
<p>Comparison of land-use maps in 2010 and 2020 ((<b>a</b>) 2010; (<b>b</b>) 2020).</p>
Full article ">
17 pages, 307 KiB  
Article
Walled Buildings, Sustainability, and Housing Prices: An Artificial Neural Network Approach
by Rita Yi Man Li, Ka Yi Cheng and Muhammad Shoaib
Sustainability 2018, 10(4), 1298; https://doi.org/10.3390/su10041298 - 23 Apr 2018
Cited by 32 | Viewed by 6265
Abstract
Various researchers have explored the adverse effects of walled buildings on human health. However, few of them have examined the relationship between walled buildings and private housing estates in Hong Kong. This study endeavors to fill the research gap by exploring the connections [...] Read more.
Various researchers have explored the adverse effects of walled buildings on human health. However, few of them have examined the relationship between walled buildings and private housing estates in Hong Kong. This study endeavors to fill the research gap by exploring the connections among walled-building effects, housing features, macroeconomic factors, and housing prices in private housing estates. Specifically, it reveals the relationship between walled buildings and housing prices. Eight privately owned housing estates are selected with a total of 11,365 observations. Results are analyzed to study the factors that affect the housing price. Firstly, unit root tests are carried out to evaluate if the time series variables follow the unit root process. Secondly, the relationship between walled buildings and housing price is examined by conducting an artificial neural network. We assumed that the housing price reduces due to walled-building effects, given that previous literature showed that heat island effect, and blockage of natural light and views, are common in walled-building districts. Moreover, we assume that housing price can also be affected by macroeconomic factors and housing features, and these effects vary among private housing estates. We also study these impacts by using the two models. Recommendations and possible solutions are suggested at the end of the research paper. Full article
(This article belongs to the Collection Sustainable Built Environment)
10 pages, 1617 KiB  
Article
Financing Target and Resale Pricing in Reward-Based Crowdfunding
by Lei Xu, Qingxia Wu, Peng Du, Xiaojiao Qiao, Sang-Bing Tsai and Dahui Li
Sustainability 2018, 10(4), 1297; https://doi.org/10.3390/su10041297 - 23 Apr 2018
Cited by 7 | Viewed by 3681
Abstract
Resale is an effective tool for reward-based crowdfunding creators to make more profit after crowdfunding successfully. On the one hand, funds raised during the crowdfunding affect the resale pricing as a capital constraint; on the other hand, backers’ strategic purchasing behavior in the [...] Read more.
Resale is an effective tool for reward-based crowdfunding creators to make more profit after crowdfunding successfully. On the one hand, funds raised during the crowdfunding affect the resale pricing as a capital constraint; on the other hand, backers’ strategic purchasing behavior in the resale stage can also disturb the creator’s financing target decision-making through affecting resale pricing. In view of this, this paper builds a two-stage crowdfunding model to examine the interaction between the financing target and resale pricing in the presence of strategic backers. The results show that a lower financing amount leads to higher prices in the resale stage due to the rationing effect, and suppresses price volatility due to strategic purchasing behavior. In contrast, a higher financing amount enables the creator to build a large capacity, which does not restrict the resale prices and profit. Besides, in the context of high unit production cost or high backer patience level, there is no need for the creator to set a high financing target at the risk of crowdfunding failure. Full article
(This article belongs to the Section Air, Climate Change and Sustainability)
Show Figures

Figure 1

Figure 1
<p>Chronology of events.</p>
Full article ">Figure 2
<p>Optimal resale pricing in the first stage. (<b>a</b>) <math display="inline"><semantics> <mrow> <mi>c</mi> <mo>=</mo> <mn>0.1</mn> </mrow> </semantics></math>; (<b>b</b>) <math display="inline"><semantics> <mrow> <mi>c</mi> <mo>=</mo> <mn>0.3</mn> </mrow> </semantics></math>; (<b>c</b>) <math display="inline"><semantics> <mrow> <mi>c</mi> <mo>=</mo> <mn>0.5</mn> </mrow> </semantics></math>.</p>
Full article ">Figure 3
<p>Optimal resale profit. (<b>a</b>) <math display="inline"><semantics> <mrow> <mi>c</mi> <mo>=</mo> <mn>0.1</mn> </mrow> </semantics></math>; (<b>b</b>) <math display="inline"><semantics> <mrow> <mi>c</mi> <mo>=</mo> <mn>0.3</mn> </mrow> </semantics></math>; (<b>c</b>) <math display="inline"><semantics> <mrow> <mi>c</mi> <mo>=</mo> <mn>0.5</mn> </mrow> </semantics></math>.</p>
Full article ">
24 pages, 4278 KiB  
Article
Constructing Differentiated Educational Materials Using Semantic Annotation for Sustainable Education in IoT Environments
by Yongsung Kim, Jihoon Moon and Eenjun Hwang
Sustainability 2018, 10(4), 1296; https://doi.org/10.3390/su10041296 - 23 Apr 2018
Cited by 7 | Viewed by 4559
Abstract
Recently, Internet of Things (IoT) technology has become a hot trend and is used in a wide variety of fields. For instance, in education, this technology contributes to improving learning efficiency in the class by enabling learners to interact with physical devices and [...] Read more.
Recently, Internet of Things (IoT) technology has become a hot trend and is used in a wide variety of fields. For instance, in education, this technology contributes to improving learning efficiency in the class by enabling learners to interact with physical devices and providing appropriate learning content based on this interaction. Such interaction data can be collected through the physical devices to define personal data. In the meanwhile, multimedia contents in this environment usually have a wide variety of formats and standards, making it difficult for computers to understand their meaning and reuse them. This could be a serious obstacle to the effective use or sustainable management of educational contents in IoT-based educational systems. In order to solve this problem, in this paper, we propose a semantic annotation scheme for sustainable computing in the IoT environment. More specifically, we first show how to collect appropriate multimedia contents and interaction data. Next, we calculate the readability of learning materials and define the user readability level to provide appropriate contents to the learners. Finally, we describe our semantic annotation scheme and show how to annotate collected data using our scheme. We implement a prototype system and show that our scheme can achieve efficient management of various learning materials in the IoT-based educational system. Full article
Show Figures

Figure 1

Figure 1
<p>Overall architecture of our proposed method.</p>
Full article ">Figure 2
<p>Feature set construction process.</p>
Full article ">Figure 3
<p>Experimental results for the iteration stabilization point.</p>
Full article ">Figure 4
<p>Changes in log likelihood with changes in topic count.</p>
Full article ">Figure 5
<p>Distribution of news documents by topic.</p>
Full article ">Figure 6
<p>Readability measurement statistics.</p>
Full article ">Figure 7
<p>Readability measurement result.</p>
Full article ">Figure 8
<p>Visualization of Our Ontology.</p>
Full article ">Figure 9
<p>Example of an RDF document.</p>
Full article ">
15 pages, 608 KiB  
Article
A Sustainable Closed-Loop Supply Chain Decision Mechanism in the Electronic Sector
by Jiafu Su, Chi Li, Sang-Bing Tsai, Hui Lu, Aijun Liu and Quan Chen
Sustainability 2018, 10(4), 1295; https://doi.org/10.3390/su10041295 - 23 Apr 2018
Cited by 26 | Viewed by 3690
Abstract
In a closed-loop supply chain for electronic products, the manufacturer’s priority is to enhance the residual value of the collected end-of-use product and decide whether to outsource this business to a retailer, a third-party service, or retain it exclusively. In this paper, we [...] Read more.
In a closed-loop supply chain for electronic products, the manufacturer’s priority is to enhance the residual value of the collected end-of-use product and decide whether to outsource this business to a retailer, a third-party service, or retain it exclusively. In this paper, we constructed three models to study the decision mechanism in a closed-loop supply chain, with different players selected to collect the used product. By comparing the three models, we characterized the conditions under which the manufacturer will benefit most, and we then aimed to determine the best choice for the manufacturer. Our findings show that, when the retailer and the third-party service provider provide equal performance in collecting the used product, the manufacturer will give priority to the third-party service provider if they choose to outsource this business. If the reverse flows managed by the retailer result in a higher payoff for the manufacturer, then the manufacturer will choose to outsource this business to the retailer who will also benefit. Full article
Show Figures

Figure 1

Figure 1
<p>The profits of a manufacturer in r-space.</p>
Full article ">
16 pages, 1249 KiB  
Article
Assessment of Government Incentives for Energy from Waste in Colombia
by Santiago Alzate-Arias, Álvaro Jaramillo-Duque, Fernando Villada and Bonie Restrepo-Cuestas
Sustainability 2018, 10(4), 1294; https://doi.org/10.3390/su10041294 - 23 Apr 2018
Cited by 43 | Viewed by 6169
Abstract
This work evaluates the prefeasibility of energy from waste projects in Colombia under the guidelines of Law 1715. That piece of legislation proposes tax incentives for non-conventional energy initiatives, such as deductions of up to 50% on the investment through income tax, VAT [...] Read more.
This work evaluates the prefeasibility of energy from waste projects in Colombia under the guidelines of Law 1715. That piece of legislation proposes tax incentives for non-conventional energy initiatives, such as deductions of up to 50% on the investment through income tax, VAT exemption, tariff exemption, and accelerated depreciation of assets. Pasto, Colombia, was selected as the case study. Subsequently, incineration, gasification, anaerobic digestion, and landfill gas technologies were evaluated. The potential of electric power generation from municipal solid waste (MSW) of each conversion technology was estimated with mathematical models. Additionally, the economic evaluation considered five cases that combine loan options, accelerated depreciation, and income deductions. Finally, the prefeasibility analysis of each case and technology was based on the internal rate of return (IRR) and levelized cost of electricity (LCOE). The results reveal that only anaerobic digestion and landfill gas technologies constitute viable projects in case of traditional investment with and without loans, because they present IRRs greater than the discount rate, of 6.8%. However, by including the incentives in Law 1715 in the economic evaluation, IRRs of 11.18%, 7.96%, 14.27%, and 13.59% were obtained for incineration, gasification, anaerobic digestion, and landfill gas, respectively. These results make all four technologies feasible in this context. Full article
Show Figures

Figure 1

Figure 1
<p>Municipality of Pasto, Department of Nariño, within a map of Colombia.</p>
Full article ">Figure 2
<p>Electric power production in Pasto (2017–2022). Authors’ own work.</p>
Full article ">Figure 3
<p>Electric power production from landfill gas. Authors’ own work.</p>
Full article ">Figure 4
<p>Internal rate of return of each technology in five cases. Authors’ own work.</p>
Full article ">
16 pages, 2865 KiB  
Article
Simulating and Predicting the Impacts of Light Rail Transit Systems on Urban Land Use by Using Cellular Automata: A Case Study of Dongguan, China
by Jinyao Lin, Tongli Chen and Qiazi Han
Sustainability 2018, 10(4), 1293; https://doi.org/10.3390/su10041293 - 23 Apr 2018
Cited by 21 | Viewed by 5365
Abstract
The emergence of Light Rail Transit systems (LRTs) could exert considerable impacts on sustainable urban development. It is crucial to predict the potential land use changes since LRTs are being increasingly built throughout the world. While various land use and land cover change [...] Read more.
The emergence of Light Rail Transit systems (LRTs) could exert considerable impacts on sustainable urban development. It is crucial to predict the potential land use changes since LRTs are being increasingly built throughout the world. While various land use and land cover change (LUCC) models have been developed during the past two decades, the basic assumption for LUCC prediction is the continuation of present trends in land use development. It is therefore unreasonable to predict potential urban land use changes associated with LRTs simply based on earlier trends because the impacts of LRT investment may vary greatly over time. To tackle this challenge, our study aims to share the experiences from previous lines with newly planned lines. Dongguan, whose government decided to build LRTs around 2008, was selected as the study area. First, we assessed the impacts of this city’s first LRT (Line R2) on three urban land use types (i.e., industrial development, commercial and residential development, and rural development) at different periods. The results indicate that Line R2 exerted a negative impact on industrial development and rural development, but a positive impact on commercial and residential development during the planning stage of this line. Second, such spatial impacts (the consequent land use changes) during this stage were simulated by using artificial neural network cellular automata. More importantly, we further predicted the potential impacts of Line R1, which is assumed to be a newly planned line, based on the above calibrated model and a traditional method respectively. The comparisons between them demonstrate the effectiveness of our method, which can easily take advantage of the experiences from other LRTs. The proposed method is expected to provide technical support for sustainable urban and transportation planning. Full article
(This article belongs to the Section Sustainable Transportation)
Show Figures

Figure 1

Figure 1
<p>Flowchart for predicting the spatial impacts of Light Rail Transits on urban land use.</p>
Full article ">Figure 2
<p>Location of the study area.</p>
Full article ">Figure 3
<p>Land use change rate within different buffers over different periods.</p>
Full article ">Figure 4
<p>Comparison of land use change rate between “0–2 km buffer” and “2–5 km buffer”.</p>
Full article ">Figure 5
<p>Comparison of urban land use change pattern between “2 km buffer of Line R2” and “Dongguan”.</p>
Full article ">Figure 5 Cont.
<p>Comparison of urban land use change pattern between “2 km buffer of Line R2” and “Dongguan”.</p>
Full article ">Figure 6
<p>Simulation of urban land use changes within a 2 km buffer of Line R2: (<b>a</b>) observed in 2008; (<b>b</b>) observed in 2011; and (<b>c</b>) simulated in 2011.</p>
Full article ">Figure 7
<p>Prediction of urban land use changes within a 2 km buffer of Line R1: (<b>a</b>) observed in 2008; (<b>b</b>) observed in 2011; (<b>c</b>) predicted by CA<sub>LRT</sub> in 2011; and (<b>d</b>) predicted by CA<sub>Traditional</sub> in 2011.</p>
Full article ">
22 pages, 1293 KiB  
Article
Measurements and Factors That Influence the Carbon Capability of Urban Residents in China
by Qianwen Li, Ruyin Long and Hong Chen
Sustainability 2018, 10(4), 1292; https://doi.org/10.3390/su10041292 - 23 Apr 2018
Cited by 7 | Viewed by 3410
Abstract
Due to the rapid growth in residential energy consumption, there is an urgent need to reduce carbon emissions from the consumer side, which requires improvements in the carbon capability of urban residents. In this study, previous investigations of carbon capability were analyzed and [...] Read more.
Due to the rapid growth in residential energy consumption, there is an urgent need to reduce carbon emissions from the consumer side, which requires improvements in the carbon capability of urban residents. In this study, previous investigations of carbon capability were analyzed and classified into four dimensions: carbon knowledge capability, carbon motivation capability, carbon behavior capability, and carbon management capability. According to grounded theory, a quantitative research model was constructed of the carbon capability of urban residents in Jiangsu, which was used to conduct a questionnaire survey. SPSS 19.0 and LatentGOLD were employed to process the questionnaire data and the carbon capability of the residents was evaluated. The results showed that the residents of Jiangsu Province could be divided into six groups based on their different carbon capabilities, where these six major groups accounted for 28.19%, 21.21%, 18.33%, 15.84%, 9.88%, and 6.55% of the total sample. Gender, age, occupation, and educational level had significant effects on the carbon capabilities of residents, whereas the annual household income and household population had no significant effects. According to the characteristics of each cluster based on the four carbon capability dimensions, the six clusters were designated as “balanced steady cluster”, “self-restraint cluster”, “fully backward cluster”, “comprehensive leading cluster”, “slightly cognitive cluster”, and “restrain others cluster”. Quantitative analysis showed that 61.93% of the residents of Jiangsu reached the qualified rate for the carbon capability but the excellent rate was only 15.84%. Relevant policy implications are suggested based on these conclusions. Full article
Show Figures

Figure 1

Figure 1
<p>Theoretical model of the carbon capability of urban residents and the key factors involved.</p>
Full article ">Figure 2
<p>Areas where the questionnaire was distributed.</p>
Full article ">Figure 3
<p>Probabilistic graphical based on (<b>a</b>) gender, (<b>b</b>) age, (<b>c</b>) educational level, and (<b>d</b>) occupation.</p>
Full article ">Figure 4
<p>Scores for the four carbon capability dimensions: (<b>a</b>) the average score of each dimension for each cluster; (<b>b</b>) the average total score of the carbon capability for each cluster.</p>
Full article ">Figure 5
<p>Modified model.</p>
Full article ">
16 pages, 311 KiB  
Article
Green Logistic Provider Selection with a Hesitant Fuzzy Linguistic Thermodynamic Method Integrating Cumulative Prospect Theory and PROMETHEE
by Huchang Liao, Di Wu, Yulong Huang, Peijia Ren, Zeshui Xu and Mohit Verma
Sustainability 2018, 10(4), 1291; https://doi.org/10.3390/su10041291 - 22 Apr 2018
Cited by 62 | Viewed by 4907
Abstract
In the process of evaluating the green levels of cold-chain logistics providers, experts may hesitate between several linguistic terms rather than give precise values over the alternatives. Due to the potential profit and risk of business decisions, decision-making information is often based on [...] Read more.
In the process of evaluating the green levels of cold-chain logistics providers, experts may hesitate between several linguistic terms rather than give precise values over the alternatives. Due to the potential profit and risk of business decisions, decision-making information is often based on experts’ expectations of programs and is expressed as hesitant fuzzy linguistic terms. The consistency of evaluation information of an alternative can reflect the clarity of the alternative in the mind of experts and its own controversy. This paper proposes a method to use the value transfer function in the cumulative prospect theory to convert the original hesitant fuzzy linguistic terms into evaluation information based on reference points. We also introduce the parameters related to the disorder of the system in the hesitant fuzzy thermodynamic method to describe the quantity and quality characteristics of the alternatives. In these kinds of multi-criteria decision-making problems, the weights of criteria are of great importance for decision-making results. Considering the conflicting cases among criteria, the weights were obtained by utilizing the PROMETHEE method. An illustrative example concerning green logistics provider selection was operated to show the practicability of the proposed method. Full article
(This article belongs to the Section Economic and Business Aspects of Sustainability)
18 pages, 11415 KiB  
Article
Efficient Protection of Android Applications through User Authentication Using Peripheral Devices
by Jinseong Kim and Im Y. Jung
Sustainability 2018, 10(4), 1290; https://doi.org/10.3390/su10041290 - 22 Apr 2018
Cited by 1 | Viewed by 4747
Abstract
Android applications store large amounts of sensitive information that may be exposed and exploited. To prevent this security risk, some applications such as Syrup and KakaoTalk use physical device values to authenticate or encrypt application data. However, by manipulating these physical device values, [...] Read more.
Android applications store large amounts of sensitive information that may be exposed and exploited. To prevent this security risk, some applications such as Syrup and KakaoTalk use physical device values to authenticate or encrypt application data. However, by manipulating these physical device values, an attacker can circumvent the authentication by executing a Same Identifier Attack and obtain the same application privileges as the user. In our work, WhatsApp, KakaoTalk, Facebook, Amazon, and Syrup were subjected to the Same Identifier Attack, and it was found that an attacker could gain the same privileges as the user, in all five applications. To solve such a problem, we propose a technical scheme—User Authentication using Peripheral Devices. We applied the proposed scheme to a Nexus 5X smartphone running Android version 7.1 and confirmed that the average execution time was 0.005 s, which does not affect the other applications’ execution significantly. We also describe the security aspects of the proposed scheme and its compatibility with the Android platform and other applications. The proposed scheme is practical and efficient in terms of resource usage; therefore, it will be useful for Android users to improve Android application security. Full article
Show Figures

Figure 1

Figure 1
<p>User Authentication using Peripheral Devices (UAPD) protecting Android applications against Same Identifier Attack (SIA).</p>
Full article ">Figure 2
<p>Android partitions.</p>
Full article ">Figure 3
<p>Same Identifier Attack [<a href="#B19-sustainability-10-01290" class="html-bibr">19</a>]. IMEI, International Mobile Equipment Identity; IMSI, International Mobile Subscriber Identity.</p>
Full article ">Figure 4
<p>Android boot sequence [<a href="#B33-sustainability-10-01290" class="html-bibr">33</a>].</p>
Full article ">Figure 5
<p>Android architecture.</p>
Full article ">Figure 6
<p>UAPD process.</p>
Full article ">Figure 7
<p>UAPD Initial Setting process.</p>
Full article ">Figure 8
<p>Original backup vs UAPD backup.</p>
Full article ">Figure 9
<p>Time required for an application to run with UAPD.</p>
Full article ">Figure 10
<p>Time-efficiency comparison between SIAD and UAPD.</p>
Full article ">Figure 11
<p>Time according to the number of application packages.</p>
Full article ">Figure 12
<p>UAPD vs. AOSP (Android Open Source Project) for CPU usage.</p>
Full article ">Figure 13
<p>UAPD vs. AOSP for VSS (Virtual Set Size) usage.</p>
Full article ">Figure 14
<p>UAPD vs. AOSP for RSS (Resident Set Size) usage.</p>
Full article ">Figure 15
<p>UAPD vs. AOSP in terms of memory usage.</p>
Full article ">
15 pages, 270 KiB  
Article
Reaching Sustainable Financial Health: Gender Differences in Risk-Taking Patterns of Financially Excluded People
by Eunmi Kim, Sejoong Lee and Joonwhan David Lee
Sustainability 2018, 10(4), 1289; https://doi.org/10.3390/su10041289 - 22 Apr 2018
Cited by 4 | Viewed by 2963
Abstract
Providing sufficient financial accessibility to low-income individuals is considered a way to decrease income inequality and could be a key factor in sustainable economic growth. To make the financial accessibility policy more effective, analyses of individuals’ understanding of financial risk within low-income groups [...] Read more.
Providing sufficient financial accessibility to low-income individuals is considered a way to decrease income inequality and could be a key factor in sustainable economic growth. To make the financial accessibility policy more effective, analyses of individuals’ understanding of financial risk within low-income groups need to be conducted. The current authors investigated individuals’ attitudes towards loan financial risk in terms of gender difference. Using South Korean survey data, we examined the relationship between gender and attitude towards loan financial risk with a regression analysis. We found that within a low-income group, males were more willing to pay higher interest rates than females. In addition, males’ willingness to pay high interest rates became stronger when their current financial costs were high. The results indicate that males are less careful with the risks that high interest rates can bring. Thus, the results imply that interventions, such as more substantial financial education, are required for males to make financial accessibility polices more effective. Full article
(This article belongs to the Section Economic and Business Aspects of Sustainability)
14 pages, 2308 KiB  
Article
One-Dimensional Analytical Modeling of Pressure- Retarded Osmosis in a Parallel Flow Configuration for the Desalination Industry in the State of Kuwait
by Bader S. Al-Anzi and Ashly Thomas
Sustainability 2018, 10(4), 1288; https://doi.org/10.3390/su10041288 - 22 Apr 2018
Cited by 4 | Viewed by 3518
Abstract
The present study deals with the application of one-dimensional (1D) analytical expressions for a parallel flow configuration in pressure-retarded osmosis (PRO) exchangers by using actual brine and feed salinity values from the Kuwait desalination industry. The 1D expressions are inspired by the effectiveness-number [...] Read more.
The present study deals with the application of one-dimensional (1D) analytical expressions for a parallel flow configuration in pressure-retarded osmosis (PRO) exchangers by using actual brine and feed salinity values from the Kuwait desalination industry. The 1D expressions are inspired by the effectiveness-number of transfer unit (ε-NTU) method used in heat exchanger analysis and has been developed to “size” an osmotically-driven membrane process (ODMP) mass exchanger given the operating conditions and desired performance. The driving potentials in these mass exchangers are the salinity differences between feed and draw solution. These 1D model equations are employed to determine mass transfer units (MTU) as a function of different dimensionless groups such as mass flowrate ratio (MR), recovery ratio (RR), concentration factors (CF) and effectiveness (ε). The introduction of new dimensionless groups such as the dilution rate ratio (DRR) and dilution rate (DR) would be used to relate the actual water permeation to the brine draw stream. The results show that a maximum power of 0.28 and 2.6 kJ can be produced by the PRO system using seawater or treated wastewater effluent (TWE) as the feed solution, respectively, which might be able to reduce the power consumption of the desalination industry in Kuwait. Full article
(This article belongs to the Special Issue Sustainable Wastewater Treatment Systems)
Show Figures

Figure 1

Figure 1
<p>Schematic diagram of a parallel flow pressureretarded osmosis (PRO) mass exchanger. [<a href="#B20-sustainability-10-01288" class="html-bibr">20</a>].</p>
Full article ">Figure 2
<p>Recovery ratio (RR) versus mass transfer units at different mass flowrate ratio (MR) values using seawater or TWE as the feed solution and brine water as the draw solution.</p>
Full article ">Figure 3
<p>Salinity versus mass transfer units using seawater as the feed and brine as the draw solution for the parallel flow configuration.</p>
Full article ">Figure 4
<p>Salinity versus mass transfer units using TWE as the feed and brine as the draw solution for the parallel flow configuration.</p>
Full article ">Figure 5
<p>Mass flowrate of the permeate versus mass transfer units at different MR values using seawater as the feed and brine as the draw solution.</p>
Full article ">Figure 6
<p>Mass flowrate of the permeate versus mass transfer units at different MR values using TWE as the feed and brine as the draw solution.</p>
Full article ">Figure 7
<p>Concentration factor versus mass transfer units at different MR values using seawater as the feed and brine as the draw solution.</p>
Full article ">Figure 8
<p>Concentration factor versus mass transfer units at different MR values using TWE as the feed and brine as the draw solution.</p>
Full article ">Figure 9
<p>DRR as a function of MTU for seawater and brine at varying dilution rate values.</p>
Full article ">Figure 10
<p>DRR as a function of MTU for TWE and brine at varying dilution rate values.</p>
Full article ">Figure 11
<p>Effectiveness versus mass transfer units for TWE and brine solutions at different MR values.</p>
Full article ">Figure 12
<p>Effectiveness versus mass transfer units for seawater and brine solutions at different MR values.</p>
Full article ">Figure 13
<p>Maximum work versus mass transfer units for seawater and brine solution at different MR values.</p>
Full article ">Figure 14
<p>Maximum work versus mass transfer units for TWE and brine solution at different MR values.</p>
Full article ">
18 pages, 575 KiB  
Article
Patent Keyword Extraction for Sustainable Technology Management
by Jongchan Kim, Jaehyun Choi, Sangsung Park and Dongsik Jang
Sustainability 2018, 10(4), 1287; https://doi.org/10.3390/su10041287 - 22 Apr 2018
Cited by 18 | Viewed by 4602
Abstract
Recently, sustainable growth and development has become an important issue for governments and corporations. However, maintaining sustainable development is very difficult. These difficulties can be attributed to sociocultural and political backgrounds that change over time [1]. Because of these changes, the [...] Read more.
Recently, sustainable growth and development has become an important issue for governments and corporations. However, maintaining sustainable development is very difficult. These difficulties can be attributed to sociocultural and political backgrounds that change over time [1]. Because of these changes, the technologies for sustainability also change, so governments and companies attempt to predict and manage technology using patent analyses, but it is very difficult to predict the rapidly changing technology markets. The best way to achieve insight into technology management in this rapidly changing market is to build a technology management direction and strategy that is flexible and adaptable to the volatile market environment through continuous monitoring and analysis. Quantitative patent analysis using text mining is an effective method for sustainable technology management. There have been many studies that have used text mining and word-based patent analyses to extract keywords and remove noise words. Because the extracted keywords are considered to have a significant effect on the further analysis, researchers need to carefully check out whether they are valid or not. However, most prior studies assume that the extracted keywords are appropriate, without evaluating their validity. Therefore, the criteria used to extract keywords needs to change. Until now, these criteria have focused on how well a patent can be classified according to its technical characteristics in the collected patent data set, typically using term frequency–inverse document frequency weights that are calculated by comparing the words in patents. However, this is not suitable when analyzing a single patent. Therefore, we need keyword selection criteria and an extraction method capable of representing the technical characteristics of a single patent without comparing them with other patents. In this study, we proposed a methodology to extract valid keywords from single patent documents using relevant papers and their authors’ keywords. We evaluated the validity of the proposed method and its practical performance using a statistical verification experiment. First, by comparing the document similarity between papers and patents containing the same search terms in their titles, we verified the validity of the proposed method of extracting patent keywords using authors’ keywords and the paper. We also confirmed that the proposed method improves the precision by about 17.4% over the existing method. It is expected that the outcome of this study will contribute to increasing the reliability and the validity of the research on patent analyses based on text mining and improving the quality of such studies. Full article
(This article belongs to the Section Economic and Business Aspects of Sustainability)
Show Figures

Figure 1

Figure 1
<p>Procedure of proposed method.</p>
Full article ">
15 pages, 284 KiB  
Article
Infrastructures as Catalysts: Precipitating Uneven Patterns of Development from Large-Scale Infrastructure Investments
by Crelis Rammelt
Sustainability 2018, 10(4), 1286; https://doi.org/10.3390/su10041286 - 22 Apr 2018
Cited by 9 | Viewed by 4088
Abstract
While infrastructure investments in developing regions may bring about aggregate benefits, the distribution of those benefits cannot be ignored. The present paper examines such distributional effects based on two illustrations: rural roads in Ethiopia and flood control systems in Bangladesh. In both cases, [...] Read more.
While infrastructure investments in developing regions may bring about aggregate benefits, the distribution of those benefits cannot be ignored. The present paper examines such distributional effects based on two illustrations: rural roads in Ethiopia and flood control systems in Bangladesh. In both cases, the infrastructures promote particular development patterns towards market-economic transformations and integration. We liken the introduction of these infrastructures to the addition of a catalyst in a chemical reaction. Rural roads, for example, catalyse existing flows of agricultural labour, while flood control catalyses agricultural productivity. Taking the analogy a step further, the effects of a catalyst are known to vary due to the presence of so-called inhibitors and promoters. Applying this to the two cases, the paper reveals that, among other factors, the ownership (or lack thereof) of modes of transportation in Ethiopia and land resources in Bangladesh represent significant promoters (or inhibitors) that can help to explain the unequal distribution of benefits. This question is by no means new; past technical assistance programmes were already fiercely criticized for exacerbating inequalities. Today, commercial and political interests are again intensifying infrastructural investments in developing regions with profound impacts on local economies and livelihoods. Revisiting the question of distribution is, therefore, as relevant as ever. Full article
18 pages, 2314 KiB  
Article
Land Cover Based Landscape Pattern Dynamics of Anhui Province Using GlobCover and MCD12Q1 Global Land Cover Products
by Jinling Zhao, Jie Wang, Yu Jin, Lingling Fan, Chao Xu, Dong Liang and Linsheng Huang
Sustainability 2018, 10(4), 1285; https://doi.org/10.3390/su10041285 - 22 Apr 2018
Cited by 8 | Viewed by 3815
Abstract
The development and free distribution of global land cover (GLC) products have greatly assisted in the evolution and analysis of relationships between land cover and landscape pattern. In this study, GlobCover and MCD12Q1 GLC datasets of 2005 and 2009 were comparatively used to [...] Read more.
The development and free distribution of global land cover (GLC) products have greatly assisted in the evolution and analysis of relationships between land cover and landscape pattern. In this study, GlobCover and MCD12Q1 GLC datasets of 2005 and 2009 were comparatively used to analyze the variation of land cover in Anhui Province, China at both the class and landscape scale. The land cover classification schemes of both datasets were firstly reclassified to six types of forestland, grassland, wetland, cropland, artificial area, and others, and then FRAGSTATS was used to calculate the landscape indices. The results showed that from 2005 to 2009, the area density of ‘cropland’ landscape decreased, and it increased for ‘wetland’ and ‘artificial area’. The landscape fragmentation of ‘forestland’ and ‘grassland’ were larger. Moreover, over the same period, the class edge (CE) of ‘cropland’ was diminished; while the CE of ‘wetland’ was enhanced and the aggregation became larger. Conversely, the aggregation and shape complexity of ‘artificial area’ remained the same. The clumpiness index (CLUMPY) of ‘cropland’ varied from 0.8995 to 0.9050, indicating a higher aggregation and more concentrated distribution. The heterogeneity index (HT) value of MCD12Q1 and GlobCover datasets varied, respectively, from 0.9642 to 0.9053 and from 0.8867 to 0.8751, demonstrating that the landscape heterogeneity of Anhui Province was reduced from 2005 to 2009. Driving force analysis (DFA) was just performed for ‘artificial area’, ‘cropland’, and ‘wetland’ according to the 2005–2009 statistical yearbook data, because they were apt to be affected by human activities over a relatively short period of time. Full article
Show Figures

Figure 1

Figure 1
<p>Geographic location (<b>a</b>) and land cover types and subdivisions (<b>b</b>) of Anhui Province, China.</p>
Full article ">Figure 2
<p>General workflow chart in this study.</p>
Full article ">Figure 3
<p>Land cover reclassification of MCD12Q1 and GlobCover in 2005 and 2009.</p>
Full article ">Figure 4
<p>Comparison of the edge density and shape metrics based on (<b>a</b>) MCD12Q1 and (<b>b</b>) GlobCover, in Anhui Province (2005–2009).</p>
Full article ">Figure 5
<p>Analysis of contagion and interspersion metrics of Anhui Province (2005–2009).</p>
Full article ">
26 pages, 1548 KiB  
Article
Manufacturer’s Decision as Consumers’ Low-Carbon Preference Grows
by Lei Yang, Meng Chen, Yiji Cai and Sang-Bing Tsai
Sustainability 2018, 10(4), 1284; https://doi.org/10.3390/su10041284 - 21 Apr 2018
Cited by 4 | Viewed by 3892
Abstract
This paper investigates five channel structures for manufacturers including three single channels and two dual channels. Consumers’ low-carbon preference is considered to explore how market demands and channel selections will change as it remains stable and grows. To compare performances of the five [...] Read more.
This paper investigates five channel structures for manufacturers including three single channels and two dual channels. Consumers’ low-carbon preference is considered to explore how market demands and channel selections will change as it remains stable and grows. To compare performances of the five channel structures, we further get the critical points consisting of construction cost of a platform, revenue proportion through a third-party platform, and offline proportion of total demands. The findings show that, when the construction cost is low, a self-owned platform performs better than a retail channel and a third-party platform. If the offline proportion is high, manufacturers would adopt or add a retail channel. When the manufacturers’ revenue proportion is high, a third-party platform is more profitable. If the consumers’ low-carbon preference grows, dual channels can be chosen to satisfy the increasing online and offline demands. The critical revenue proportion and offline proportion become smaller while the construction cost becomes larger. In addition, numerical analysis is provided to show profit changes and robustness of channel structure. Our findings can provide useful insights for decision-makers to implement low-carbon sustainability. Full article
(This article belongs to the Special Issue Sustainable Development and Management of Mega Projects)
Show Figures

Figure 1

Figure 1
<p>The models of Scenario PR, TPR, P, TP, and R. The dotted and the solid lines represent the self-owned and the third-party platform respectively.</p>
Full article ">Figure 2
<p>Methods of comparing different channels.</p>
Full article ">Figure 3
<p>Comparison with critical points <math display="inline"><semantics> <mrow> <mo>Δ</mo> <mi>m</mi> <mo>∈</mo> <mo stretchy="false">[</mo> <mn>0</mn> <mo>,</mo> <mn>1</mn> <mo stretchy="false">]</mo> </mrow> </semantics></math></p>
Full article ">Figure 4
<p>Comparison with critical points <math display="inline"><semantics> <mrow> <mo>Δ</mo> <mi>m</mi> <mo>∈</mo> <mo stretchy="false">[</mo> <mn>0</mn> <mo>,</mo> <mn>1</mn> <mo stretchy="false">]</mo> </mrow> </semantics></math></p>
Full article ">Figure 5
<p>Comparison with critical points <math display="inline"><semantics> <mrow> <mo>Δ</mo> <mi>m</mi> <mo>∈</mo> <mo stretchy="false">[</mo> <mn>0</mn> <mo>,</mo> <mn>1</mn> <mo stretchy="false">]</mo> </mrow> </semantics></math></p>
Full article ">Figure 6
<p>Comparison with critical points <math display="inline"><semantics> <mrow> <mo>Δ</mo> <mi>m</mi> <mo>∈</mo> <mo stretchy="false">[</mo> <mn>0</mn> <mo>,</mo> <mn>1</mn> <mo stretchy="false">]</mo> </mrow> </semantics></math></p>
Full article ">Figure 7
<p>Comparison with critical points <math display="inline"><semantics> <mrow> <mo>Δ</mo> <mi>m</mi> <mo>∈</mo> <mo stretchy="false">[</mo> <mn>0</mn> <mo>,</mo> <mn>1</mn> <mo stretchy="false">]</mo> </mrow> </semantics></math></p>
Full article ">Figure 8
<p>Comparison with critical points <math display="inline"><semantics> <mrow> <mo>Δ</mo> <mi>m</mi> <mo>∈</mo> <mo stretchy="false">[</mo> <mn>0</mn> <mo>,</mo> <mn>1</mn> <mo stretchy="false">]</mo> </mrow> </semantics></math></p>
Full article ">Figure 9
<p>Profit changes without enhancement.</p>
Full article ">Figure 10
<p>Profit changes with enhancement.</p>
Full article ">Figure 11
<p>Profit changes without enhancement.</p>
Full article ">Figure 12
<p>Profit changes with enhancement.</p>
Full article ">Figure 13
<p>Profit changes without enhancement.</p>
Full article ">Figure 14
<p>Profit changes with enhancement.</p>
Full article ">Figure 15
<p>Profit changes with enhancement.</p>
Full article ">
18 pages, 1284 KiB  
Article
Tourist Satisfaction, Image, and Loyalty from an Interregional Perspective: An Analysis of Neighboring Areas with Distinct Characteristics
by Tae-Hyoung Tommy Gim
Sustainability 2018, 10(4), 1283; https://doi.org/10.3390/su10041283 - 21 Apr 2018
Cited by 13 | Viewed by 4733
Abstract
A comparison is made among the three areas of the Korean Capital Region to investigate the effects of their different tourism resources on attribute satisfaction and the relationships that attribute satisfaction has with overall satisfaction, country image, and tourist loyalty. Three partial least [...] Read more.
A comparison is made among the three areas of the Korean Capital Region to investigate the effects of their different tourism resources on attribute satisfaction and the relationships that attribute satisfaction has with overall satisfaction, country image, and tourist loyalty. Three partial least squares structural equation models find that costs, lodging, and communication are consistently unimportant, but the most important variable differs by area. In Seoul (an international shopping center), shopping is paramount; food is most important in Incheon (where its local cuisines have been well publicized); and satisfaction with tourism administration services is highly valued in Gyeonggi (which lacks facilities for foreign tourists). At the construct level, overall happiness exerts a stronger direct effect on image than on loyalty, but if its indirect effect is considered, the total effect on loyalty surpasses that on image. This is particularly true in Gyeonggi, where tourism resources are less exploited. Full article
Show Figures

Figure 1

Figure 1
<p>Study area: Seoul, Incheon, and Gyeonggi.</p>
Full article ">Figure 2
<p>Partial least squares structural equation modeling. Note: A software program called SmartPLS automatically composed these charts. The outer weights/loadings and structural path coefficients are shown with arrows and R² in round factors (detailed results are shown in <a href="#sustainability-10-01283-t004" class="html-table">Table 4</a>).</p>
Full article ">
14 pages, 293 KiB  
Article
Efficiency and Risk in Sustaining China’s Food Production and Security: Evidence from Micro-Level Panel Data Analysis of Japonica Rice Production
by Chengjun Wang, Zhaoyong Zhang and Ximin Fei
Sustainability 2018, 10(4), 1282; https://doi.org/10.3390/su10041282 - 21 Apr 2018
Cited by 9 | Viewed by 3537
Abstract
Sustainable food production and food security are always challenging issues in China. This paper constructs a multi-element two-level constant-elasticity-of-substitution (CES) model to assess technological progress in, and its contribution to, japonica rice production in China. The results show that the speed of technological [...] Read more.
Sustainable food production and food security are always challenging issues in China. This paper constructs a multi-element two-level constant-elasticity-of-substitution (CES) model to assess technological progress in, and its contribution to, japonica rice production in China. The results show that the speed of technological progress in the production of japonica rice on average was 0.44% per annum in 1985–2013, and technological progress has contributed significantly to the growth of japonica rice production in China. Robustness checks show that the results appear to be sensitive to which sub-sample is used. Labour and some other inputs are found to be significant but negative, especially during the middle sampling period of 1994–2006 and in eastern and western regions. This has important policy implications on the impact of rural-to-urban migration and farmers’ human development. Full article
(This article belongs to the Special Issue Risk Measures with Applications in Finance and Economics)
16 pages, 320 KiB  
Article
Acceptance of Food Technologies, Perceived Values and Consumers’ Expectations towards Bread. A Survey among Polish Sample
by Marta Sajdakowska, Maria Królak, Witold Zychowicz and Marzena Jeżewska-Zychowicz
Sustainability 2018, 10(4), 1281; https://doi.org/10.3390/su10041281 - 21 Apr 2018
Cited by 17 | Viewed by 4388
Abstract
The aims of the study were to identify the perceptions about the technologies that are used to increase the nutritional value of cereal products, and to evaluate relations between consumers’ perceptions of them, expected changes to bread, and the perceived values. Quantitative data [...] Read more.
The aims of the study were to identify the perceptions about the technologies that are used to increase the nutritional value of cereal products, and to evaluate relations between consumers’ perceptions of them, expected changes to bread, and the perceived values. Quantitative data was collected through computer-assisted personal interviews (CAPI) within a sample of 1000 Polish adults. Clustering method was used to identify homogeneous groups based on opinions on the technologies used in the production of cereals and cereal products. Neutral attitudes towards technologies were presented in the sample with relatively greater acceptance of traditional crossbreeding of varieties and enrichment processes. Nevertheless, three homogeneous clusters were identified: technological sceptics (33.6%), technological traditionalists (15.0%) and technological enthusiasts (51.4%). Technological traditionalists appreciated the naturalness of food, tradition, natural environment, quality of life and health more than the other clusters. Perceiving themselves as a person valuing tradition and quality of life was associated with belonging to the technological sceptics. Both sceptics and traditionalists declared greater fears resulting from the application of new technologies in food production, including threats to the environment, health, naturalness of food and quality of life. Technological enthusiasts were anticipating more changes in bread. The differences among the clusters, including perceived values, require communication that is adapted to the profile of the consumers. The results can be useful for bread manufacturers to predict the demand and deliver against it and for marketers who are responsible for the process of effective product labelling and communication in order to meet the consumer needs. Full article
(This article belongs to the Special Issue Sustainable Food Innovation)
17 pages, 9017 KiB  
Article
An Electricity Price Forecasting Model by Hybrid Structured Deep Neural Networks
by Ping-Huan Kuo and Chiou-Jye Huang
Sustainability 2018, 10(4), 1280; https://doi.org/10.3390/su10041280 - 21 Apr 2018
Cited by 135 | Viewed by 10017
Abstract
Electricity price is a key influencer in the electricity market. Electricity market trades by each participant are based on electricity price. The electricity price adjusted with the change in supply and demand relationship can reflect the real value of electricity in the transaction [...] Read more.
Electricity price is a key influencer in the electricity market. Electricity market trades by each participant are based on electricity price. The electricity price adjusted with the change in supply and demand relationship can reflect the real value of electricity in the transaction process. However, for the power generating party, bidding strategy determines the level of profit, and the accurate prediction of electricity price could make it possible to determine a more accurate bidding price. This cannot only reduce transaction risk, but also seize opportunities in the electricity market. In order to effectively estimate electricity price, this paper proposes an electricity price forecasting system based on the combination of 2 deep neural networks, the Convolutional Neural Network (CNN) and the Long Short Term Memory (LSTM). In order to compare the overall performance of each algorithm, the Mean Absolute Error (MAE) and Root-Mean-Square error (RMSE) evaluating measures were applied in the experiments of this paper. Experiment results show that compared with other traditional machine learning methods, the prediction performance of the estimating model proposed in this paper is proven to be the best. By combining the CNN and LSTM models, the feasibility and practicality of electricity price prediction is also confirmed in this paper. Full article
(This article belongs to the Collection Power System and Sustainability)
Show Figures

Figure 1

Figure 1
<p>The influence factors of electricity price [<a href="#B15-sustainability-10-01280" class="html-bibr">15</a>].</p>
Full article ">Figure 2
<p>The comparison of (<b>a</b>) MLP and (<b>b</b>) CNN.</p>
Full article ">Figure 3
<p>The comparison of (<b>a</b>) standard RNN and (<b>b</b>) LSTM.</p>
Full article ">Figure 4
<p>The architecture of the proposed EPNet.</p>
Full article ">Figure 5
<p>The system flowchart of the proposed EPNet.</p>
Full article ">Figure 6
<p>PJM Regulation Zone Preliminary Billing Data.</p>
Full article ">Figure 7
<p>The forecasting results of SVM.</p>
Full article ">Figure 8
<p>The forecasting results of random forest.</p>
Full article ">Figure 9
<p>The forecasting results of decision tree.</p>
Full article ">Figure 10
<p>The forecasting results of MLP.</p>
Full article ">Figure 11
<p>The forecasting results of CNN.</p>
Full article ">Figure 12
<p>The forecasting results of LSTM.</p>
Full article ">Figure 13
<p>The forecasting results of the proposed EPNet.</p>
Full article ">Figure 14
<p>The comparisons of all the forecasting results.</p>
Full article ">Figure 15
<p>The comparisons details of forecasting results.</p>
Full article ">
16 pages, 278 KiB  
Article
Is Innovation Destroying Jobs? Firm-Level Evidence from the EU
by Mariacristina Piva and Marco Vivarelli
Sustainability 2018, 10(4), 1279; https://doi.org/10.3390/su10041279 - 21 Apr 2018
Cited by 31 | Viewed by 6203
Abstract
Using a unique firm-level database comprising the top European R&D investors over the period 2002–2013 and running LSDVC estimates, this study finds a significant labor-friendly impact of R&D expenditures. However, this positive employment effect appears limited in magnitude and entirely due to the [...] Read more.
Using a unique firm-level database comprising the top European R&D investors over the period 2002–2013 and running LSDVC estimates, this study finds a significant labor-friendly impact of R&D expenditures. However, this positive employment effect appears limited in magnitude and entirely due to the medium- and high-tech sectors, while no effect can be detected in the low-tech industries. From a policy point of view, this outcome supports the EU2020 strategy but—taking into account that most European economies are specialized in low-tech activities—is also worrying in terms of future perspectives of the European labor market. Full article
(This article belongs to the Special Issue The Impact of Technological Change on Employment, Skills and Earnings)
16 pages, 598 KiB  
Article
Digitalization and Environmental Aims in Municipalities
by Tina Ringenson, Mattias Höjer, Anna Kramers and Anna Viggedal
Sustainability 2018, 10(4), 1278; https://doi.org/10.3390/su10041278 - 21 Apr 2018
Cited by 35 | Viewed by 6717
Abstract
Many municipalities express a wish to use digital technologies to achieve environmental aims. However, there is still a need for a better understanding of how this should practically be done, both among municipalities and among ICT developers. We have used workshops and literature [...] Read more.
Many municipalities express a wish to use digital technologies to achieve environmental aims. However, there is still a need for a better understanding of how this should practically be done, both among municipalities and among ICT developers. We have used workshops and literature studies to formulate technological abilities of digitalization. We use two EU directives that are relevant for municipal environmental goals and combine the activities that these directives indicate with technological abilities of digitalization, in order to formulate practical implementations of digital technology to help these activities and reach the directives’ goals. We suggest that this method can be used for any municipal goal, as follows: (1) Identify the objective (in our case set by the EU-directives); (2) Identify what activities these points will require or generate; (3a) From a municipal viewpoint: Based on the results of 1 and 2, formulate and structure ideas of how digitalization can support the objectives and how those ideas can be implemented; (3b) From a provider’s viewpoint: Investigate what digital solutions supporting 1 and 2 exist, or how existing services can be tweaked to support the objectives and explore how new digital solutions supporting 1 and 2 can be developed. Full article
(This article belongs to the Special Issue Sustainable Smart Cities and Smart Villages Research)
Show Figures

Figure 1

Figure 1
<p>The Waste Hierarchy [<a href="#B13-sustainability-10-01278" class="html-bibr">13</a>].</p>
Full article ">
15 pages, 2750 KiB  
Article
Impact of Future Climate Change on Wheat Production: A Simulated Case for China’s Wheat System
by Dengpan Xiao, Huizi Bai and De Li Liu
Sustainability 2018, 10(4), 1277; https://doi.org/10.3390/su10041277 - 21 Apr 2018
Cited by 57 | Viewed by 7259
Abstract
With regard to global climate change due to increasing concentration in greenhouse gases, particularly carbon dioxide (CO2), it is important to examine its potential impact on crop development and production. We used statistically-downscaled climate data from 28 Global Climate Models (GCMs) [...] Read more.
With regard to global climate change due to increasing concentration in greenhouse gases, particularly carbon dioxide (CO2), it is important to examine its potential impact on crop development and production. We used statistically-downscaled climate data from 28 Global Climate Models (GCMs) and the Agricultural Production Systems sIMulator (APSIM)–Wheat model to simulate the impact of future climate change on wheat production. Two future scenarios (RCP4.5 and RCP8.5) were used for atmospheric greenhouse gas concentrations during two different future periods (2031–2060 referred to as 40S and 2071–2100 referred to as 80S). Relative to the baseline period (1981–2010), the trends in mean daily temperature and radiation significantly increased across all stations under the future scenarios. Furthermore, the trends in precipitation increased under future climate scenarios. Due to climate change, the trend in wheat phenology significantly advanced. The early flowering and maturity dates shortened both the vegetative growth stage (VGP) and the whole growth period (WGP). As the advance in the days of maturity was more than that in flowering, the length of the reproductive growth stage (RGP) of spring wheat was shortened. However, as the advance in the date of maturity was less than that of flowering, the RGP of winter wheat was extended. When the increase in CO2 concentration under future climate scenarios was not considered, the trend in change in wheat production for the baseline declined. In contrast, under increased CO2 concentration, the trend in wheat yield increased for most of the stations (except for Nangong station) under future climatic conditions. Winter wheat and spring wheat evapotranspiration (ET) decreased across all stations under the two future climate scenarios. As wheat yield increased with decreasing water consumption (as ET) under the future climatic conditions, water use efficiency (WUE) significantly improved in the future period. Full article
(This article belongs to the Section Sustainable Agriculture)
Show Figures

Figure 1

Figure 1
<p>Locations of the investigated agro-meteorological experimental stations in China.</p>
Full article ">Figure 2
<p>Validation plots of the APSIM–wheat model simulation with observed flowering date, maturity date, and yield for spring (<b>A,B,C</b>) and winter wheat (<b>D,E,F</b>).</p>
Full article ">Figure 3
<p>Changes in solar radiation (Rad), maximum temperature (Tmax), minimum temperature (Tmin), and precipitation (Prec) for the 40S (2031–2060) and 80S (2071–2100) with the baseline (1981–2010) periods under RCP4.5 and RCP8.5 conditions.</p>
Full article ">Figure 4
<p>Change in flowering and maturity dates for spring (<b>A,C</b>) and winter wheat (<b>B,D</b>) under the four different future climate scenarios.</p>
Full article ">Figure 5
<p>Change in yield for spring wheat (A,C) and winter wheat (<b>B,D</b>) under four different future scenarios with constant (<b>A,B</b>) and changing CO<sub>2</sub> concentrations (<b>C,D</b>).</p>
Full article ">Figure 6
<p>Change in ET and WUE for spring (<b>A,C</b>) and winter wheat (<b>B,D</b>) under the four different future climate scenarios.</p>
Full article ">
11 pages, 833 KiB  
Article
Entrepreneurial Factors Affecting the Sustainable Growth and Success of a South African Construction Company
by Abimbola Windapo
Sustainability 2018, 10(4), 1276; https://doi.org/10.3390/su10041276 - 21 Apr 2018
Cited by 9 | Viewed by 5354
Abstract
The study examines a case of how the South African construction industry nurtured an entrepreneur and a large successful entrepreneurial construction company, even though the founder had no formal education and the company was founded during the Apartheid era. The question of whether [...] Read more.
The study examines a case of how the South African construction industry nurtured an entrepreneur and a large successful entrepreneurial construction company, even though the founder had no formal education and the company was founded during the Apartheid era. The question of whether entrepreneurs are born or are made is based on the age-old question of nurture or nature. The paper presents the narratives of the successful entrepreneur Mr. Sam Lubbe and the business strategy he used in growing a sustainable business. The information presented is collected through a case study research approach. The data collected suggests that although Sam does not have any formal education, he succeeded based on the nurturing given to him when he had the opportunity to work for a large South African construction company, his innate characteristics of self-confidence, task–result orientation, and originality, as well as his planning for the future and the use of a unique business model which helped him access international construction work opportunities. The study of this particular individual and his unique company is significant because it further validates previous research undertaken in other contexts and sectors on the traits of entrepreneurs and the success of companies. Full article
(This article belongs to the Special Issue Entrepreneurial Sustainability: New Innovative Knowledge)
Show Figures

Figure 1

Figure 1
<p>The internal traits and environmental factors that shape the entrepreneur (Seelig [<a href="#B3-sustainability-10-01276" class="html-bibr">3</a>]).</p>
Full article ">Figure A1
<p>Sam transporting building materials on his bicycle (his first mode of transport).</p>
Full article ">
13 pages, 2589 KiB  
Article
Scenario Aggregation-Based Grid-Connected Photovoltaic Plant Design
by Ahmad Abuelrub, Osama Saadeh and Hussein M. K. Al-Masri
Sustainability 2018, 10(4), 1275; https://doi.org/10.3390/su10041275 - 20 Apr 2018
Cited by 13 | Viewed by 4021
Abstract
As the global population continues to increase and living standards in developing countries continue to improve, the demand for energy is surging. This is also coupled with technological advances, which are leading to the increased electrification of transportation, manufacturing, and home appliance. Classical [...] Read more.
As the global population continues to increase and living standards in developing countries continue to improve, the demand for energy is surging. This is also coupled with technological advances, which are leading to the increased electrification of transportation, manufacturing, and home appliance. Classical fossil fuel-based energy generation is unsustainable and a significant cause of air pollution. Therefore, clean, local, and sustainable sources of energy, such as solar energy, have recently been receiving more attention. In this paper, a complete design approach for grid-connected photovoltaic (PV) plants is developed. Jordan University of Science and Technology (JUST) is presented as a case study. The design is formulated as an optimization problem to find the optimal PV plant size needed to minimize the system cost and meet the design constraints. The uncertainties of solar radiation and temperature are considered using appropriate stochastic models. The optimization problem is solved using the Scenario Aggregation technique. The results show the financial and environmental feasibility of the proposed system. The optimal PV plant size which meets the annual demand of JUST is found and the financial and environmental benefits derived from executing the proposed system are emphasized. Full article
(This article belongs to the Section Energy Sustainability)
Show Figures

Figure 1

Figure 1
<p>Grid-connected PV plant using the net-metering system.</p>
Full article ">Figure 2
<p>PV plant sizing procedure flow chart.</p>
Full article ">Figure 3
<p>(<b>a</b>) Solar radiation average for one year; (<b>b</b>) average temperature for four seasons.</p>
Full article ">Figure 4
<p>The relationship between coefficient of variation (COV) and optimal PV plant size.</p>
Full article ">Figure 5
<p>PV plant connection diagram.</p>
Full article ">
Previous Issue
Next Issue
Back to TopTop