
Abstract
Confidence intervals are useful tools for statistical decision-making purposes. In case of incomplete and vague data, fuzzy confidence intervals can be used for decision making under uncertainty. In this paper, we develop interval-valued intuitionistic fuzzy (IVIF) confidence intervals for population mean, population proportion, differences in means of two populations, and differences in proportions of two populations. The developed IVIF intervals can be used in cases of both finite and infinite population sizes. The developed fuzzy confidence intervals are equivalent decision-making tools to fuzzy hypothesis tests. We apply the proposed confidence intervals to the differences in the mean lives and failure proportions of two types of radiators used in automobiles, and a sensitivity analysis is given to check the robustness of the decisions.
1 Introduction
Hypothesis tests are the main tools of statistical decision making. A confidence interval can be equivalently used instead of a left-tailed hypothesis test, a right-tailed hypothesis test, or a two-tailed hypothesis test. A confidence interval presents the minimum and maximum probable values of the considered population parameter at a certain significance level. Confidence intervals are based on the data obtained from random samples. In case of sufficient amount of past data, classical confidence intervals are used. Incomplete and vague data necessitate fuzzy sets to be used in the calculation of confidence intervals. Ordinary fuzzy sets have been already used in the development of fuzzy confidence intervals. Extensions of fuzzy sets such as hesitant fuzzy sets, intuitionistic fuzzy sets (IFSs), type 2 fuzzy sets, and neutrosophic sets have not yet been used in the development of confidence intervals in the literature.
Confidence intervals have been studied since the 1980s. McCain [12] constructed fuzzy confidence intervals for uncertain hypotheses. He later developed a focal theory under uncertainty, which is composed of fuzzy confidence intervals and particular choice theory by highlighting empirical implications [13]. Parchami et al. [14] obtained a fuzzy confidence interval for fuzzy process capability index, where specification limits are defined by two membership functions. Alex [1] studied point estimation under fuzziness for a supply chain management problem. Skrjanc [16] made new fuzzy confidence interval proposals using the lower and upper fuzzy limits. Harikrishnan et al. [8] introduced the fuzzy testing of multi-alternative hypotheses for group of samples with a single parameter through the fuzzy confidence interval of region of acceptance. Yabuuchi et al. [19] considered an interval fuzzy time series model and showed the applicability of the fuzzy autocorrelation model with fuzzy confidence intervals.
Kahraman et al. [10] developed interval-valued intuitionistic fuzzy (IVIF) confidence intervals for population mean, population proportion, and population variance. To the best of our knowledge, the intuitionistic confidence intervals for the differences between two populations have not yet been developed in the literature. In this paper, we propose IVIF confidence intervals for concluding if there is a significant difference between the means and proportions of two different populations. We also show how to make sensitivity analyses for IVIF confidence intervals. The developed IVIF confidence intervals are applied in an automobile parts manufacturer firm. Two types of radiators used in automobiles are compared based on IVIF confidence intervals.
The rest of this paper is organized as follows. Section 2 presents a literature review on fuzzy confidence intervals. Section 3 gives the preliminaries of IFSs. Section 4 includes the developed intuitionistic fuzzy confidence intervals for μ, σ2, p, μ1−μ2, and p1−p2. Section 5 presents the applications of the proposed IVIF confidence intervals. Finally, Section 6 concludes the paper including further research suggestions.
1 Fuzzy Confidence Intervals
When the data cannot be recorded or collected precisely, the fuzzy sets theory is an appropriate tool in modeling the imprecise data. Some researchers have proposed ordinary fuzzy confidence intervals for imprecise data. We briefly summarize these works in the following.
A fuzzy confidence interval for binomial proportions is given in Eq. (1) [3]:
where β is the confidence level, p is the probability of a success, and
When putting these confidence intervals together, the triangular shape fuzzy number estimator of p is obtained.
Parchami et al. [15] redefined some concepts about fuzzy confidence intervals and showed the consistency property of fuzzy confidence intervals, which holds for almost every α in [0, 1].
Wu [18] suggested ordinary fuzzy confidence intervals by considering unknown fuzzy parameters and fuzzy random variables as given by Eqs. (3) and (4):
where
Skrjanc [17] developed fuzzy confidence intervals for Takagi-Sugeno fuzzy models with changeable variance. Chachi and Taheri [4] developed one- and two-sided fuzzy confidence intervals using normal fuzzy random variables. Chachi et al. [5] developed a fuzzy confidence interval and constructed a fuzzy test function based on fuzzy acceptability degrees.
Jamkhaneh et al. [9] developed a new method for analyzing the fuzzy system reliability of a series and parallel system using fuzzy confidence intervals.
Garg [6, 7] proposed a two-sided fuzzy confidence interval-based λ-τ methodology, which is given in Eq. (5):
where Ã=(a, b, c) is a triangular fuzzy number, (A(α)) is two-sided confidence interval for the α-cut of Ã, b is the population , k−1 is the degree of freedom, T is a t distributed random variable, and σ is the standard deviation of population b.
2 Preliminaries: IFSs
IFSs are an extension of fuzzy sets proposed by Atanassov [2], which considers membership and non-membership degrees and hesitation degree simultaneously.
Definition 1: Let X≠∅ be a given set. An IFS
where
for every x∈X. The hesitancy degree is “1−
An IVIF set (IVIFS) is defined as follows.
Definition 2:D⊆[0, 1] is the set of all closed subintervals of the interval and X is a universe of discourse. Then, an IVIFS in
where
For each x∈X,
where
If
Let
Multiplication by a fixed number is given as in Eq. (12):
Li [11] generalized the arithmetic operations for IVIF numbers based on the extension principles as follows:
where the symbol “*” stands for addition, subtraction, multiplication, and division operations.
The addition operation for more than two IVIFSs is given as follows:
Definition 3: Let
3 Intuitionistic Fuzzy Confidence Intervals
The IVIF confidence intervals for population mean, population variance, and population proportion with infinite population size have been developed by Kahraman et al. [10]. In this study, confidence intervals for population means with finite population size and population proportions with finite population size, and for differences in population means and differences in population proportions with infinite and finite population sizes are developed.
4.1 IVIF Confidence Interval for Population Mean
Assume that we have an IVIF sample data set
When the population standard deviation σ is known, the IVIF confidence interval for population mean at the significance level α is given by Eq. (17).
When the population size is finite, Eq. (12) is transformed to Eq. (18):
4.2 IVIF Confidence Interval for Binomial Proportion
The IVIF confidence interval for p (binomial proportion) is defined as in Eq. (19) [10]:
where
where xi is the defectives in a sample i and k is the number of possible defectives predicted by the experts.
When the population size is finite, the above equations are transformed to Eq. (21):
or
Then,
4.3 IVIF Confidence Interval for the Difference in Population Means
We first obtain the intuitionistic fuzzy confidence interval for the difference in population means where population variances are known and the population size is infinite.
or
where
Then,
When the population size is finite, the above equations are transformed to Eq. (29):
or
Then,
4.4 IVIF Confidence Interval for the Difference in Population Proportions
We first obtain the intuitionistic fuzzy confidence interval for the difference in population proportions where the population size is infinite.
or
where q̅1 and q̅2 are equal to 1−p̅1 and 1−p̅2, respectively, and
and x stands for the defectives in a sample and k denotes the number of possible defective values predicted by the experts.
When the population size is finite, Eq. (32) is transformed to Eq. (37):
or
where q̅1 and q̅2 are equal to 1−p̅1 and 1−p̅2, respectively.
Then, we have
4 Application
One of the leader firms manufacturing automobile parts in Turkey wants to determine if there is a significant difference in their mean times between failures (MTBFs; in terms of months) between the two types of radiators, namely type X and type Y, used in one of the automobile models. X-type radiators are more expensive than Y-type radiators. Hence, the manufacturing engineers in the firm do not want to purchase X-type radiators unless the mean life of X is larger than Y by at least 6 months. The statistical analysis is based on the data obtained from 119 X-type radiators and 175 Y-type radiators. As the exact failure dates are uncertain, the project team handles the data using interval-type IFSs as in Table 1 for infinite populations and Table 2 for finite populations. The obtained past data also give the numbers of the radiators that failed within the warranty period. These data can be used in comparing the failure proportions of two types of radiators. As the failure data are not exactly correct, IVIF numbers have been used for the failure proportions of the radiators. Table 3 for infinite populations and Table 4 for finite populations present the numbers of the failed radiators within the warranty period.
IVIF Data Regarding Two Types of Radiators (Infinite Populations).
| Compressor Type | MTBF | Variance | Sample size | μ− | μ+ | ν− | ν+ |
|---|---|---|---|---|---|---|---|
| Y | 33.4 | 4.21 | 175 | 0.6 | 0.8 | 0.1 | 0.2 |
| X | 39.5 | 3.75 | 119 | 0.5 | 0.7 | 0 | 0.2 |
IVIF Data Regarding Two Types of Radiators (Finite Populations).
| Compressor type | Population size | MTBF | Variance | Sample size | μ− | μ+ | ν− | ν+ |
|---|---|---|---|---|---|---|---|---|
| Y | 2456 | 33.4 | 4.21 | 175 | 0.6 | 0.8 | 0.1 | 0.2 |
| X | 1598 | 39.5 | 3.75 | 119 | 0.5 | 0.7 | 0 | 0.2 |
IVIF Failure Data Regarding Two Types of Radiators (Infinite Populations).
| Compressor type | Sample size | Failed radiators | Sample means | μ− | μ+ | ν− | ν+ |
|---|---|---|---|---|---|---|---|
| Y | 175 | 41 | 0.2343 | 0.7 | 0.9 | 0 | 0.1 |
| X | 119 | 12 | 0.1008 | 0.65 | 0.8 | 0.1 | 0.15 |
IVIF Failure Data Regarding Two Types of Radiators (Finite Populations).
| Compressor type | Population size | Sample size | Failed radiators | Sample means | μ− | μ+ | ν− | ν+ |
|---|---|---|---|---|---|---|---|---|
| Y | 2456 | 175 | 41 | 0.2343 | 0.7 | 0.9 | 0 | 0.1 |
| X | 1598 | 119 | 12 | 0.1008 | 0.65 | 0.8 | 0.1 | 0.15 |
When the populations are infinite, the IVIF confidence interval is obtained as follows:
(5.638, [0.5, 0.7], [0.1, 0.2])
This confidence interval indicates that there is a significant difference between the mean lives of X and Y radiators. As the lower limit is <6 months, X-type radiators are not suggested to be purchased. In order to select X-type radiators, the significance level must be at least 67%. As this level of significance is not acceptable, X-type radiators should not be purchased.
When the populations are finite, the IVIF confidence interval becomes as follows:
(5.997, [0.5, 0.7], [0.1, 0.2])
This confidence interval indicates that there is a significant difference between the mean lives of X and Y radiators. As the lower limit is <6 months, X-type radiators are not suggested to be purchased. However, if the significance level becomes 6% or larger, the decision is changed.
The IVIF confidence interval for population failure proportions in case of infinite-size populations is obtained as follows:
(−0.2163, [0.65, 0.8], [0.1, 0.15])
This confidence interval indicates that there is a significant difference between the failure proportions of X and Y radiators.
The IVIF confidence interval for population failure proportions in case of finite-size populations is obtained as follows:
(−0.1367, [0.65, 0.8], [0.1, 0.15])
This confidence interval indicates that there is a significant difference between the failure proportions of X (alternative 1) and Y (alternative 2) radiators.
5.1 Sensitivity Analyses
As purchasing decisions depend on the level of confidence, we apply a sensitivity analysis in the following.
Figure 1 shows the confidence intervals of differences in infinite population means (y-axis) with respect to significance levels (x-axis) for 0≤α≤1. The most possible value of the difference is 6.1 with α=1. If the minimum difference in mean lives to prefer X (alternative 1) is required to be at least 5.8, the confidence level must be at most 80%. Similar conclusions can be obtained from this figure.
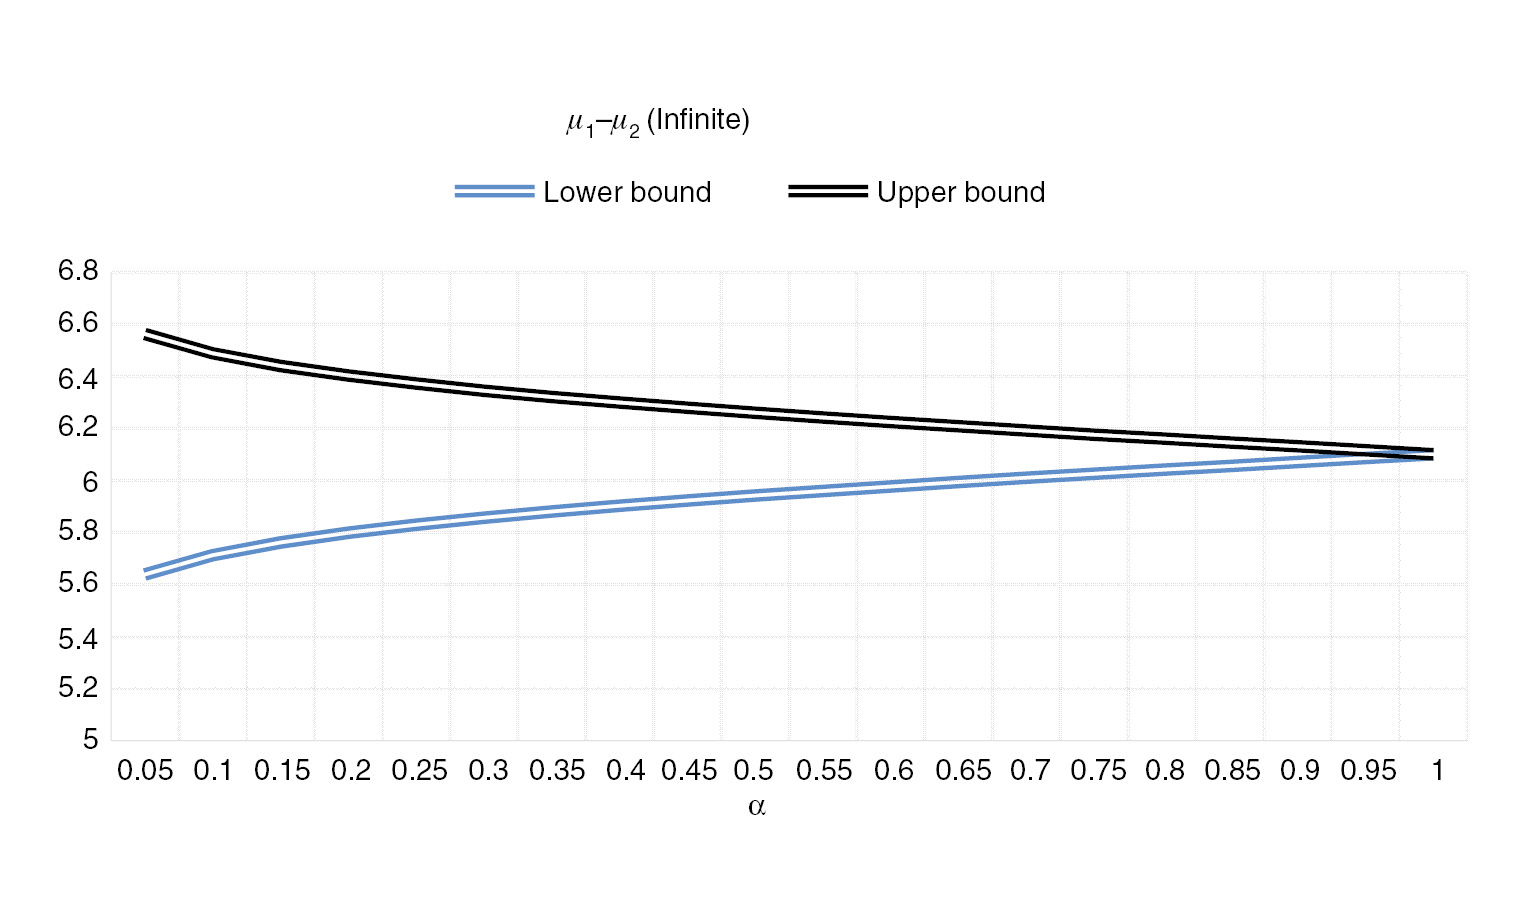
Confidence Intervals of Differences in Infinite Population Means.
Figure 2 shows the confidence intervals of differences in finite population means (y-axis) with respect to significance levels (x-axis) for 0≤α≤1. The most possible value of the difference is again 6.1 with α=1. If the minimum difference in mean lives to prefer X (alternative 1) is required to be at least 6.0, the confidence level must be at most 30%. Similar conclusions can be obtained from this figure.
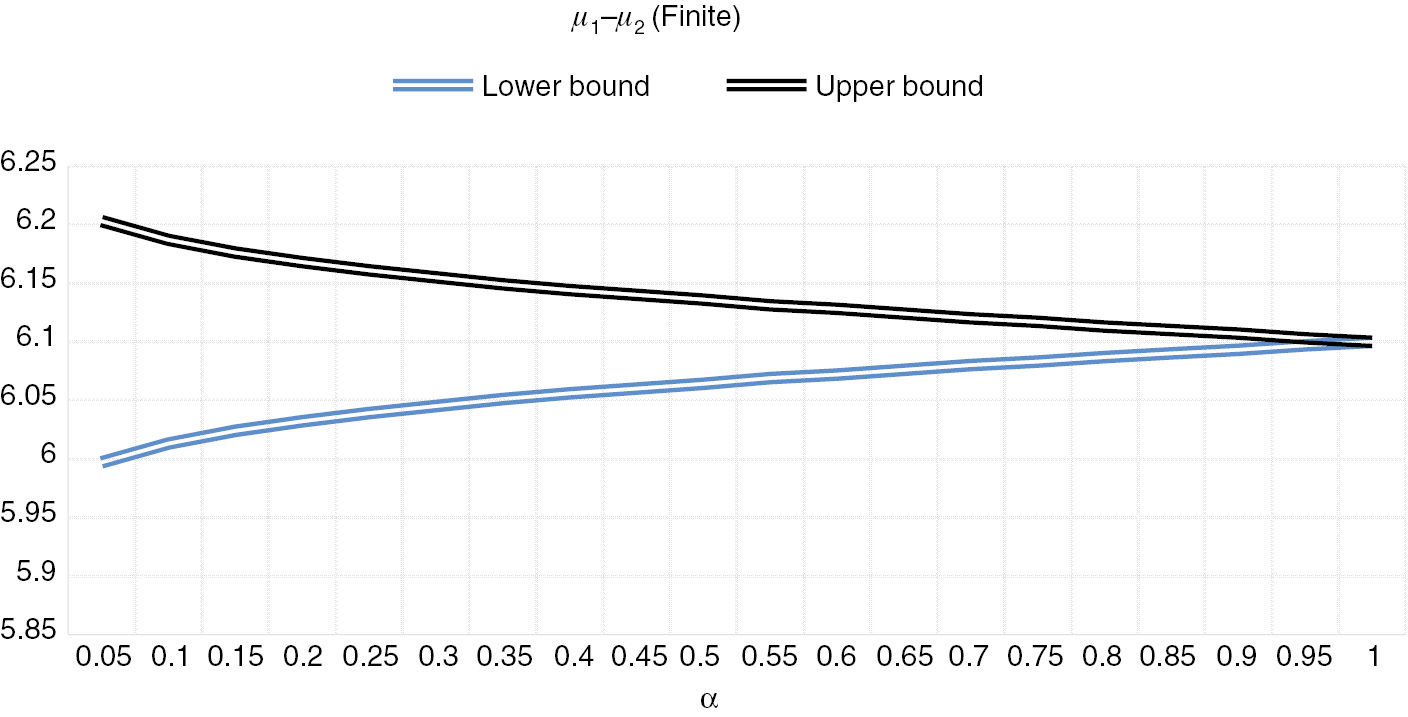
Confidence Intervals of Differences in Finite Population Means.
Figure 3 shows the confidence intervals of differences in finite population proportions (y-axis) with respect to significance levels (x-axis) for 0≤α≤1. The most possible value of the difference (p1−p2) is −0.1334 with α=1. If the minimum difference in mean proportions to prefer X (alternative 1) is required to be at least −0.135, the confidence level must be at most 65%. Similar conclusions can be obtained from this figure.
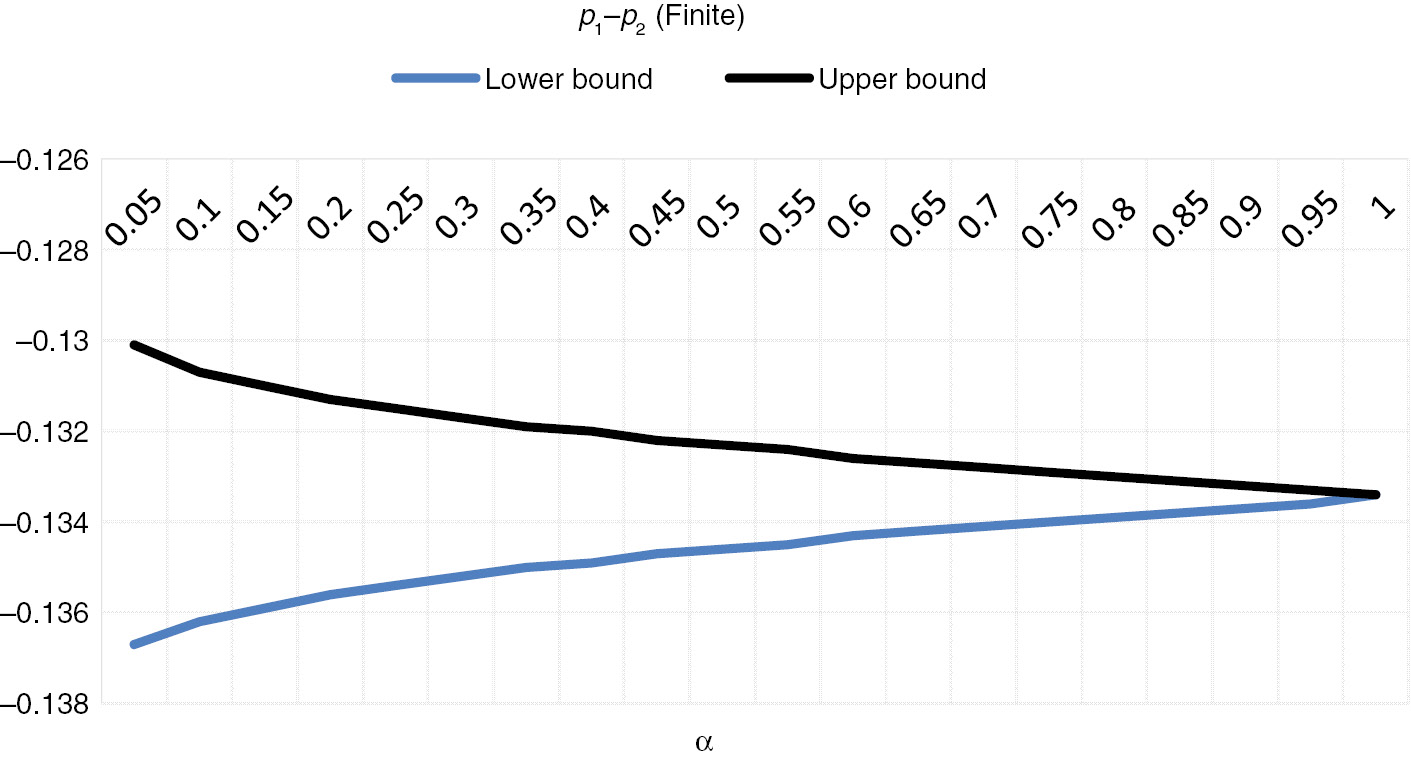
Confidence Intervals of Differences in Finite Population Proportions.
Figure 4 shows the confidence intervals of differences in infinite population proportions (y-axis) with respect to significance levels (x-axis) for 0≤α≤1. The most possible value of the difference (p1−p2) is −0.1334 with α=1. If the minimum difference in mean proportions to prefer X (alternative 1) is required to be at least −0.173, the confidence level must be at most 65%. Similar conclusions can be obtained from this figure.
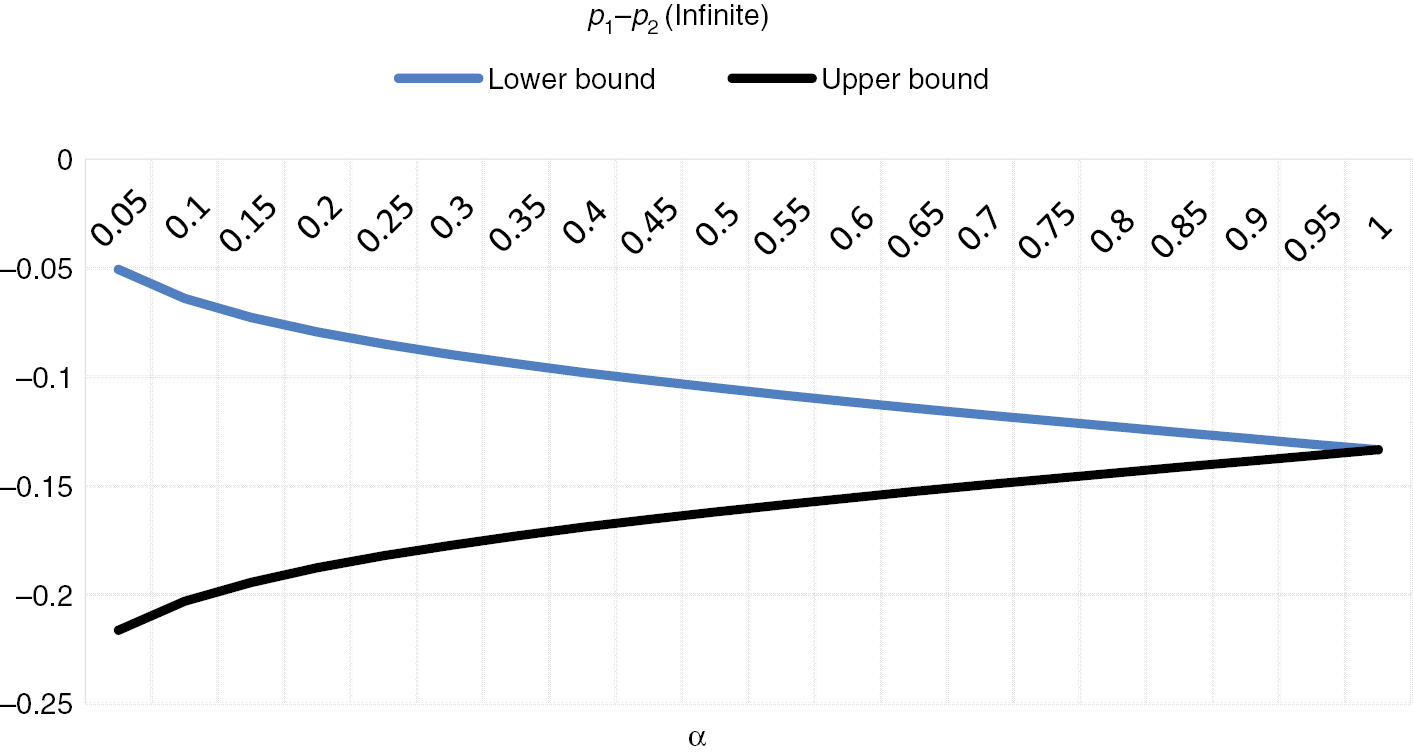
Confidence Intervals of Differences in Infinite Population Proportions.
5 Conclusion
A confidence interval is a range for estimating a population parameter at a specific significance level. Confidence intervals are decision-making tools that can be used equivalently to hypothesis tests. Two-sided confidence intervals can be used instead of double-tailed hypothesis tests and one-sided tests for left- or right-tailed hypothesis tests. In this paper, we used two-sided IVIF confidence intervals in case of uncertain data. IVIF confidence intervals successfully determined the lower and upper confidence limits of the differences between the mean lives and the mean failure proportions. Decision makers could reflect their hesitancy to the sample data when incomplete and vague data exist in hand. The proposed IVIF confidence intervals have been applied to a radiator type selection problem, and they have successfully suggested one of the radiator types. The proposed IVIF confidence intervals can be used as a part of decision support systems.
For further research, we suggest hesitant fuzzy confidence intervals and neutrosophic confidence intervals to be developed. These extensions are new research opportunities in the statistical decision-making area. The confidence intervals for paired sample t-test, ratio of variances of two normal distributions, and others are possible areas for further research.
Bibliography
[1] R. Alex, Fuzzy point estimation and its application on fuzzy supply chain analysis, Fuzzy Sets Syst.158 (2007), 1571–1587.10.1016/j.fss.2007.01.015Search in Google Scholar
[2] K. T. Atanassov, Intuitionistic fuzzy sets, Fuzzy Sets Syst.20 (1986), 87–96.10.1016/S0165-0114(86)80034-3Search in Google Scholar
[3] J. J. Buckley, Fuzzy Statistics, Springer-Verlag, Berlin, 2004.10.1007/978-3-540-39919-3Search in Google Scholar
[4] J. Chachi and S. M. Taheri, Fuzzy confidence intervals for mean of Gaussian fuzzy random variables, Expert Syst. Appl.38 (2011), 5240–5244.10.1016/j.eswa.2010.10.034Search in Google Scholar
[5] J. Chachi, S. M. Taheri and R. Viertl, Testing statistical hypotheses based on fuzzy confidence intervals, Aust. J. Stat.41 (2012), 267–286.10.17713/ajs.v41i4.168Search in Google Scholar
[6] H. Garg, Performance analysis of complex repairable industrial systems using PSO and fuzzy confidence interval based methodology, ISA Trans.52 (2013), 171–183.10.1016/j.isatra.2012.09.010Search in Google Scholar PubMed
[7] H. Garg, Analyzing the behavior of an industrial system using fuzzy confidence interval based methodology, Nat. Acad. Sci. Lett.37 (2014), 359–370.10.1007/s40009-014-0239-2Search in Google Scholar
[8] M. Harikrishnan, J. Sundarrajan and M. Rengasamy, An introduction to fuzzy testing of multialternative hypotheses for group of samples with the single parameter: through the fuzzy confidence interval of region of acceptance, J. Appl. Math.2015 (2015), article number 365304.10.1155/2015/365304Search in Google Scholar
[9] E. B. Jamkhaneh, A. Azam Nozari and A. N. Ghara, Analyzing fuzzy system reliability using confidence interval, World Appl. Sci. J.13 (2011), 2191–2197.Search in Google Scholar
[10] C. Kahraman, I. Otay and B. Oztaysi, Fuzzy extensions of confidence intervals: estimation for μ, σ2, and p, in: Fuzzy Statistical Decision-Making Theory and Applications, C. Kahraman and O. Kabak, eds., vol. 343, Springer, Switzerland, 2016.10.1007/978-3-319-39014-7_9Search in Google Scholar
[11] D-F. Li, Extension principles for interval-valued intuitionistic fuzzy sets and algebraic operations, Fuzzy Optimisation and Decision Making10 (2011), 45–58.10.1007/s10700-010-9095-9Search in Google Scholar
[12] R. A. McCain, Fuzzy confidence intervals, Fuzzy Sets Syst.10 (1983), 281–290.10.1016/S0165-0114(83)80121-3Search in Google Scholar
[13] R. A. McCain, Fuzzy confidence intervals in a theory of economic rationality, Fuzzy Sets Syst.23 (1987), 205–218.10.1016/0165-0114(87)90059-5Search in Google Scholar
[14] A. Parchami, M. Mashinchi and H. R. Maleki, Fuzzy confidence interval for fuzzy process capability index, J. Intell. Fuzzy Syst.17 (2006), 287–295.Search in Google Scholar
[15] A. Parchami, M. Mashinchi and P. Partovi Nia, A consistent confidence interval for fuzzy capability index, Appl. Comput. Math.7 (2008), 143–161.Search in Google Scholar
[16] I. Skrjanc, Confidence interval of fuzzy models: an example using a waste-water treatment plant, Chemomet. Intell. Lab. Syst.96 (2009), 15, 182–187.10.1016/j.chemolab.2009.01.009Search in Google Scholar
[17] I. Skrjanc, Fuzzy confidence interval for pH titration curve, Appl. Math. Modell.35 (2011), 4083–4090.10.1016/j.apm.2011.02.033Search in Google Scholar
[18] H. C. Wu, Statistical confidence intervals for fuzzy data, Expert Syst. Appl.36 (2009), 2670–2676.10.1016/j.eswa.2008.01.022Search in Google Scholar
[19] Y. Yabuuchi, T. Kawaura and J. Watada, Fuzzy autocorrelation model with fuzzy confidence intervals and its evaluation, J. Adv. Comput. Intell. Intell. Inform.20 (2016), 512–520.10.20965/jaciii.2016.p0512Search in Google Scholar
©2019 Walter de Gruyter GmbH, Berlin/Boston
This article is distributed under the terms of the Creative Commons Attribution Non-Commercial License, which permits unrestricted non-commercial use, distribution, and reproduction in any medium, provided the original work is properly cited.