
Abstract
To reduce the adverse effects of geological disasters on Nyingchi, this article selected nine highly correlated risk assessment factors for the types of geological disasters such as landslides and debris flows and used two methods of analytic hierarchy process and fuzzy analytic hierarchy process for analysis and comparison. The spatial overlay analysis of each factor with weight is carried out in ArcGIS to make a classification map of geological hazards in Nyingchi. Risk assessment of geological disasters such as collapses, landslides, and mudslides indicates that the slope, distance from the faults, and relative elevation difference of topography have severe impact on natural disasters; at least more than 60% of the areas belong to medium-, high-, and extremely high-risk areas, and it is urgent to strengthen protection and governance; the evaluation results of the fuzzy analytic hierarchy process are more in line with the actual survey situation and are more suitable for Tibet. This research is able to provide a basis for ecological protection, ecological restoration, and geological disaster prevention and management in southeastern Tibet. It also has important reference value for the coordinated development of urban and the environmental projects.
1 Introduction
Because of the complex landform and geology, the area has frequent earthquakes and heavy rainfall. It has become one of the most frequent areas of geological disasters such as landslides, mudslides, and collapses. It not only threatens the safety of local residents’ lives and property but also hinders the development of agriculture and animal husbandry, and the deployment of transportation networks in this new developing city. The unique geographical environment and special hydro-climatic of the Qinghai-Tibet Plateau have not only created various geological disasters but also brought difficulties that cannot be ignored to many professional scientific research teams, directly leading to the acquisition of basic information. After a long period of observation, the accuracy and precision are still not up to scientific research standards, and it is difficult to continue the follow-up assessment of geological disasters. Scholars have conducted research on geological disasters in Tibet, most of which are confined to specific important traffic sections and small areas where major disasters have occurred. They do not meet the characteristics of the chain and widespread nature of disasters in the region. Therefore, a unified risk assessment of geological disasters in the entire Nyingchi is urgently needed.
With the increasing improvement of geological information of system (GIS) technology and the emergence of high-precision digital elevation models, the two combined with artificial intelligence models, deterministic models, statistical models, heuristic models, and other mathematical analysis models are applied to the risk assessment of geological disasters. The hazard level division and verification of the studied area are obtained through comprehensive consideration of natural and man-made factors. Lyu et al. used analytic hierarchy process (AHP) and trapezoidal fuzzy analytic hierarchy process (FAHP) methods to assess the geological disaster risk caused by the earthquake around Wenchuan County, and the trapezoidal FAHP assessment method uses a trapezoidal fuzzy number instead of a crisp number, which overcomes the one-sided deficit of the original AHP method [1]. Xiao et al. used neural network methods to establish a debris flow susceptibility identification and early warning model, using AHP as the main analysis method, supplemented by fuzzy clustering method to evaluate debris flows in the Shigatse section of the China-Nepal Highway, which greatly improved the probability of landslide early warning in this area [2]. Wu et al. evaluated the spatial susceptibility of landslides in the Hubei section of the three gorges reservoir area based on random forests. The performance evaluation and susceptibility statistics show that random forest is an excellent algorithm and has good applicability in the field of landslide spatial prediction [3]. Li used the determination coefficient method to calculate the sensitivity value of the impact factor in Lushui County. They used the results as the classification basis for the support vector machine. Together with receiver operating characteristic curve and precision recall curve, they verified the high predictability of the curve fitting-support vector machine (CF-SVM) model [4]. Wang constructed the probability model of geological disaster casualty events in China based on binary Logistic regression and quantitatively analyzed the influence degree of natural and human factors. They calculated the probability of geological disaster casualty events in each country based on their model [5]. Stanley adopted a multivariate machine-learning approach. After combining a Pacific Northwest Landslide Inventory with a 36-year gridded hydrologic dataset from the National Climate Assessment – Land Data Assimilation System, they produced a landslide hazard indicator on a daily 0.125° grid [6]. Yang used Hilbert-Huang transform (HHT) to identify the landform features of the landslide, and the important factors for the analysis of the total land to divide the landslide body were obtained [7].
The traditional analytic hierarchy process tends to be affected by the cognitive skills and knowledge of evaluators, which may significantly reduce the accuracy of evaluation results. On the contrary, quantitative methods such as information model, machine learning, and logistic regression model are suitable for specific geological disasters, which are completely based on the judgment of the data, and a large amount of data of different time series in the same place are required. Although they are suitable for specific geological hazards, it is difficult to extend the conclusions to their situations. Combination of the fuzzy mathematical model and the analytic hierarchy process in ArcGIS not only allows their shortcomings to be avoided but also makes full use of the limited data and expert questionnaires in Tibet to evaluate the geological disasters in Nyingchi. In addition, accuracy verification has been carried out through satellite images and field surveys in different years, so that the geological disaster evaluation results can provide scientific and reliable theoretical basis for the construction and development of cities in southeastern Tibet. The research results provide important reference values, especially to the ongoing Sichuan-Tibet railway construction and the large-scale trans-regional power transmission and transformation project.
2 Geological disaster in Nyingchi
2.1 Overview of the studied area
Nyingchi is located in the southeast of Tibet Autonomous Region, with geographic coordinates of 92.165°–98.753°N and 27.559°–30.669°E (see Figure 1). This area is located at the junction of the Eurasian and Indian Ocean plates, with fractured strata and active crust. Several fault zones are densely distributed here, including (1) Jiali-Chayu fault zone, (2) fault zones of the main boundary and the main front thrust of the southern Himalayas, (3) Yarlung Zangbo fault zone, and (4) their secondary fault zones [8] (see Figure 2). The average altitude is around 4,000 m. However, the highest altitude can reach 7229.72 m, whereas the lowest altitude is only 151.55 m. The world’s deepest canyon, the Yarlung Zangbo River Grand Canyon, is also located here, making Nyingchi a region with relatively large vertical drop of landform on land [9]. Large surface undulations and remarkable topographical change create coexistence of multiple climates in the region. The special tropical humid and semi-humid climates make the vegetation coverage rate as high as 46%. The water system formed by the Yarlung Zangbo River and its tributaries causes abundant precipitation but with uneven distribution. These special geographical environments have become an important reason for the frequent occurrence of geological disasters in this area.
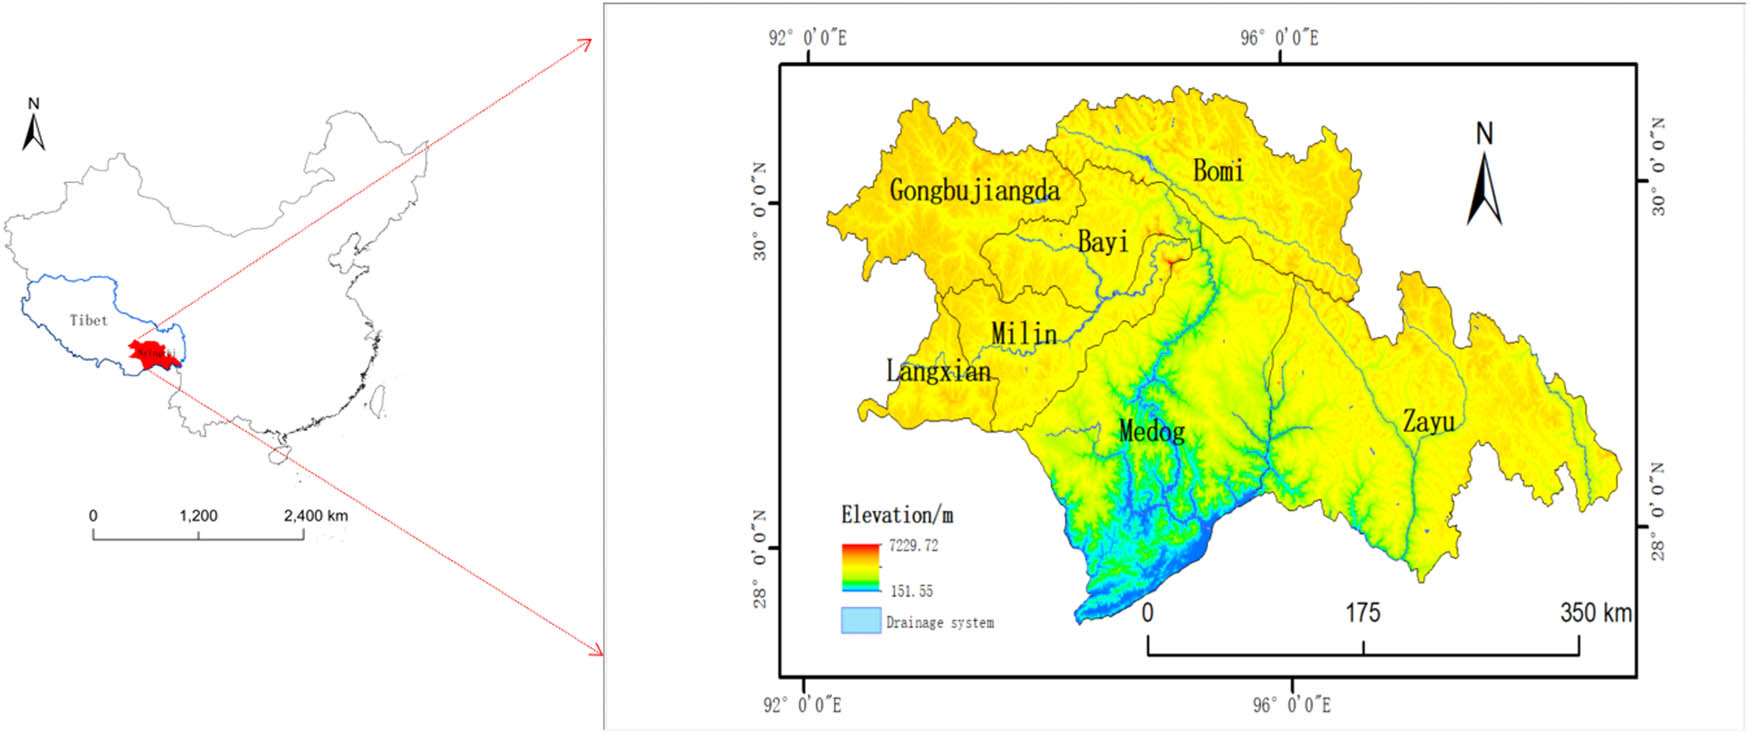
Map of studied areas in Nyingchi.
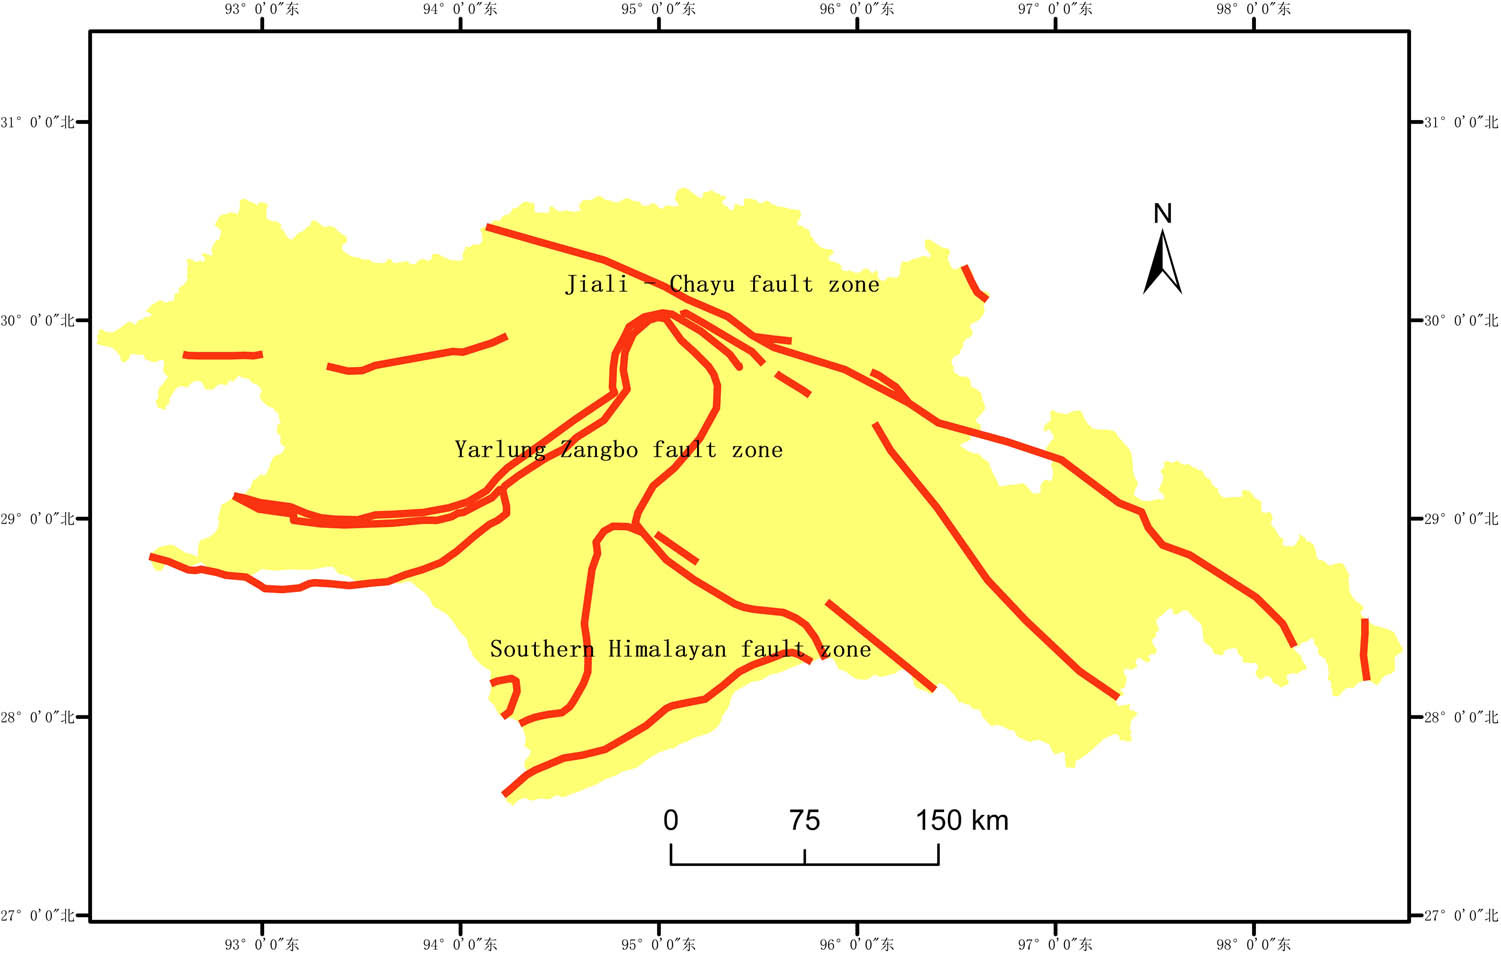
Map of Nyingchi fault zone.
2.2 Types and distribution characteristics of geological disasters in Nyingchi
Frequent geological disasters in Nyingchi area are mainly landslides, collapses, mudslides, frozen soil slopes, and glacier melting. There are about 500 recurrences in recent decades. They are mainly distributed in the upper and middle reaches of the Yarlung Zangbo River and the Himalayan fault zone. The impact of earthquakes and heavy rains causes the occurrence of one type of geological disasters to trigger others and secondary disasters. The ranges of occurrence are wide, and their frequencies are high with complex internal and external coupling mechanisms. The resultant harm is significant. Together with various human engineering activities, these factors create massive difficulty to restoration and seriously limit the construction of infrastructures such as highways, power grids, and telecommunications in the area. Figure 3 shows a landslide disaster in a section of Highway 318.
Typical site landslide map.
Landslides and mudslides are mainly affected by the melting of glaciers and mountain snow or heavy rainfall within a short period of time. Earthquakes, fault zone activities, and blasting in engineering construction may cause collapse, which usually forms barrier lakes and induces mountain torrents. Casualty and property loss are significant. According to statistics, there were more than 110 earthquakes with magnitudes beyond 4 from 1980 to 2018. The quake in Milin in 2017 had magnitude 6.9, causing a large-scale collapse and a barrier lake [10]. The 8.6 magnitude earthquake of Chayu in 1950 caused a composite geological disaster consisting of collapse, landslide, and debris flow, blocking the road for 1 year [11]. In 1959, the giant mountain in Basu collapsed and interrupted the river, forming Lake Ranwucuo. The enormous landslide in Layue in 1967 was mainly affected by the activity of the fault zone. Two years before the landslide, there were seven earthquakes in this area with magnitude 4 or higher. Some of the severe landslides caused by melting of glaciers are as follows: (1) Guxiang landslide in 1953, (2) Palongzangbo 102 landslide in 1982, (3) group landslides in Dongjiu in 1991, and (4) Yigong landslide in 2000. There are more than 2,000 landslides with various scales in recent 60 years, bringing continuous damage to roads [12]. The geological structure of Pailonggou mountain is loose. At least 50 geological disasters, which are mostly mudslides, occur every year during the rainy season from July to September. They directly destroy the only road, block the traffic, and cause long-term power outage. The Chayu County severely suffers from mountain floods with 62 occurrences in 15 years. In both 2007 and 2018, giant debris flows occurred in Tianmogou resulting in burst of the dammed lake, which flooded downstream villages and caused significant casualties [13].
3 Analysis model of geological disaster risk
3.1 Data sources
For the basic data sources for the geological disaster risk assessment factors used in this study, see Table 1.
Basic data sources
| Data type | Resolution | Source of data | Derivative data |
|---|---|---|---|
| Digital elevation model | 16.69 m | BIGEMAP downloader | Slope, direction, phase height difference |
| Landsat 8 OLI in 2018 | 30.00 m | Geospatial data cloud (www.gscloud.cn) | Classification of land use |
| Tibetan landform in 2014 | 1:5,00,000 | GeoCloud (http://geocloud.cgs.gov.cn/) | The landform of Nyingchi |
| MOD13Q1 in 2018 | 250 m | U.S. Geological survey (https://www.usgs.gov/) | NDVI |
| Annual average precipitation in monitored areas | National meteorological science data centre (http://data.cma.cn/data/cdcindex/) & hydrographic station data | Annual precipitation in Nyingchi | |
| Regional map of Nyingchi in 2019 | 1:50,000 | Regional map of Tibet | Distribution of water systems |
| Map of active tectonics and seismic epicenter in Tibet in 2015 | 1:35,00,000 | China earthquake networks center (http://www.ceic.ac.cn/dataout) | Distribution of fault zones |
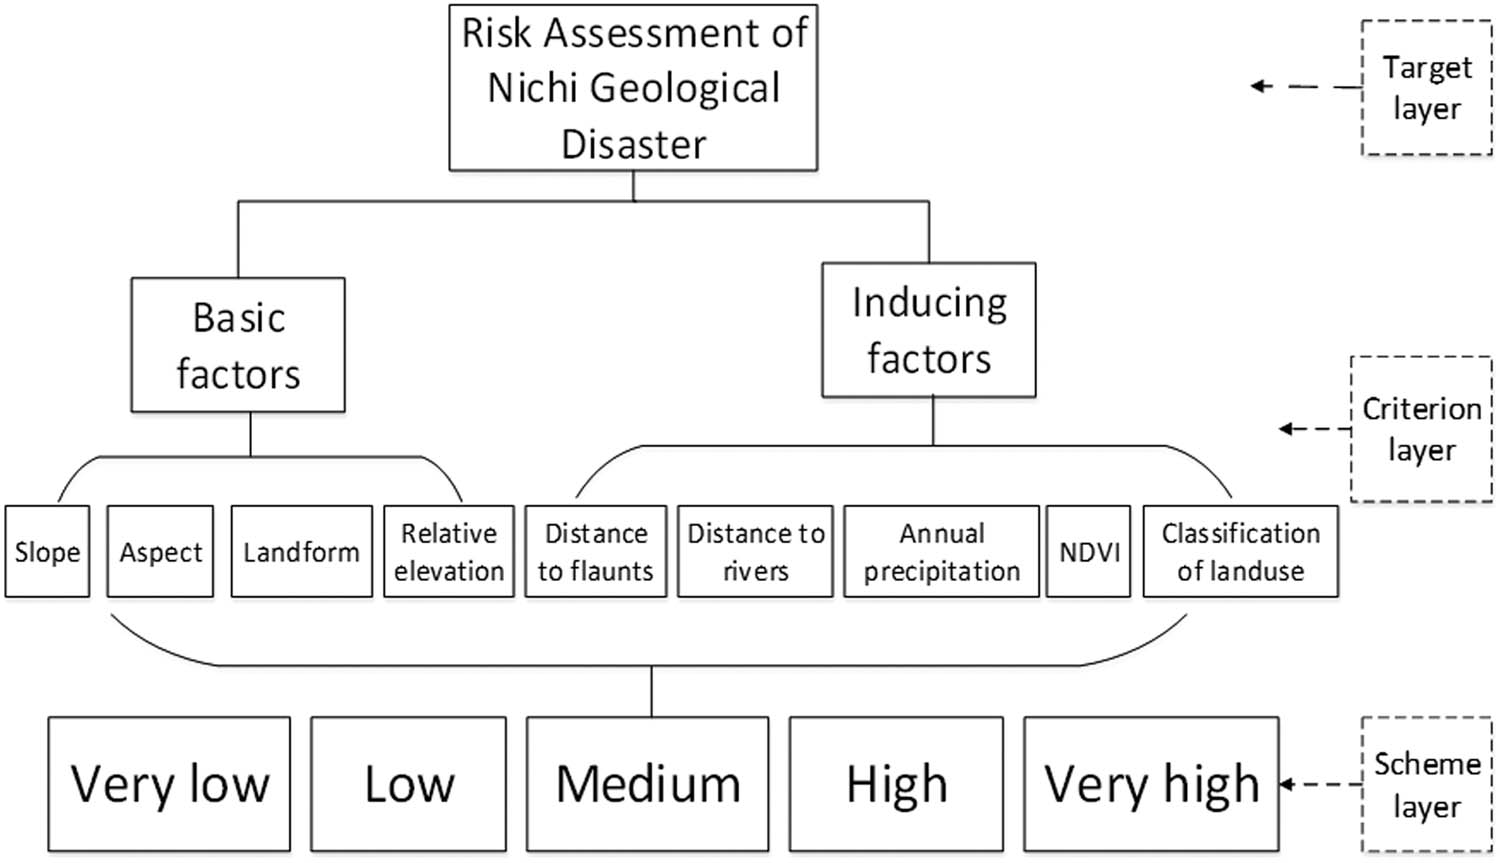
AHP model.
3.2 Methodology
3.2.1 Analytic hierarchy process (AHP)
Problems to be solved are divided into three layers: target, criterion, and plan (see Figure 4). After every two factors in the criterion layer are qualitatively and quantitatively analyzed and compared, the sum-product method or the square root method [14] is used to determine the weight of each factor, thereby simplifying a complex issue.
After establishing the hierarchical structure, it is necessary to create a judgment matrix. Then the random consistency index (CI) and random consistency ratio (CR) are used to test the deviation consistency and comprehensive randomness of the judgment matrix. Finally, the accuracy of the entire analysis and evaluation model has been verified with the success rate curve and receiver operating characteristics [15].
where λ max represents the maximum eigenvalue, A i is the i-th factor of Vector A, W i represents the weight of the i-th factor, n is the order of the judgment matrix, and RI is the average random consistency index of the judgment matrix, which can be obtained from the corresponding table. RI = 1.49 is adopted in this study. CR < 0.1 is usually used in calculation. Otherwise, the judgment matrix needs to be adjusted according to the actual situation until it meets the standard before the result verification can be continued.
Geological disaster hazard index (GDHI) [16] is the probability of occurrence for each plan layer after weighting the contribution of each evaluation factor to different plan layers.
where W i represents the weight of the i-th factor and D ij represents the weight of the i-th factor to the j-th scheme layer.
3.2.2 Fuzzy mathematics
3.2.2.1 Establishment of evaluation indicators
According to the different risks of natural disasters in the study area, the selected nine sub-criteria-level impact factors use the expert system to classify the indicators at two levels: basic factors (μ 1) and inducting factors(μ 2); and build a risk evaluation index system [17].
3.2.2.2 Establishment of evaluation sets
The risk level of the study area is divided into five levels, that is, V = (V 1, V 2, V 3, V 4, V 5) = (I, II, III, IV, V) = (very low, low, medium, high, very high) (see Table 2).
Evaluation set
| Evaluation factors | Danger classes | ||||
|---|---|---|---|---|---|
| Very low | Low | Medium | High | Very high | |
| Slope | 0–16.48 | 16.48–28.04 | 28.04–38.56 | 38.56–51.53 | 51.53–89.37 |
| Classification of land use | Mid-high plain | High plain | Low, mid, mid-high mountain | High, extreme high mountain | Glacier |
| NDVI | 0.83–0.99 | 0.65–0.83 | 0.44–0.65 | 0.21–0.44 | <0.21 |
| Distance to flaunts | >4,000 | 3,000–4,000 | 2,000–3,000 | 1,000–2,000 | 0–1,000 |
| Distance to rivers | >2,000 | 1,500–2,000 | 1,000–1,500 | 500–1,000 | 0–500 |
| Annual precipitation | 428–558.8 | 558.8–689.6 | 689.6–820.4 | 820.4–951.2 | 951.2–1,082 |
| Landform | Build-up land | Arable land | Woodland, Grassland | Water | Badlands |
| Relative elevation | 0–56 | 56–180 | 180–527 | 527–1,239 | 1,239–5,830 |
| Aspect | Flat | South | Southeast, southwest | East, west, northeast, northwest | North |
3.2.2.3 Establishment of membership function
The correct construction of the membership function is a very critical step in single-factor evaluation in fuzzy comprehensive evaluation, that is, appropriate parameters are usually selected for fitting according to the actual value of the required conclusion. In practice, the parameter forms often used include triangle, normal, and trapezoid. In this paper, the quantitative index chooses the trapezoidal fuzzy number that has been used in extensive research and the expression is as follows:
where μ A(x) is the membership function of each evaluation index, x is the measured value of the evaluation index, a 1 = V 1, a 2 = (V 1 + V 2)/2, a 3 = (V 2 + V 3)/2, a 4 = V 3, V 1, V 2, V 3 are the grading thresholds of the evaluation index corresponding to the risk level of collapse from low to high. The schematic diagram of the membership function is shown in Figure 5.
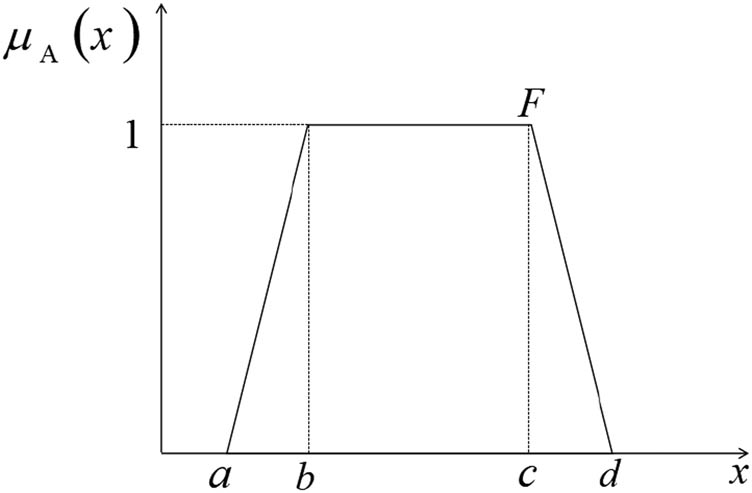
Schematic diagram of membership function.
4 Selection of evaluation factors
4.1 Selection process
Occurrence of geological disasters is usually caused by the coupling of basic and inducing factors. Combining Nyingchi’s natural conditions and human factors, while considering the size of the studied area, availability of evaluation factors, and requirements of the research accuracy, nine evaluation factors are selected including landform, hillside slope, hillside aspect, relative elevation, distance to rivers, annual precipitation, distance to fault zones, land use type, and normalized difference vegetation index (NDVI). Using 30 × 30 m grid units, the model of AHP-Geological hazard risk assessment is established. Three software programs, such as ArcGIS10.2, Envi5.1, and MRT, are used for in-depth processing of the basic data. The operation process is illustrated as follows (see Figure 6).
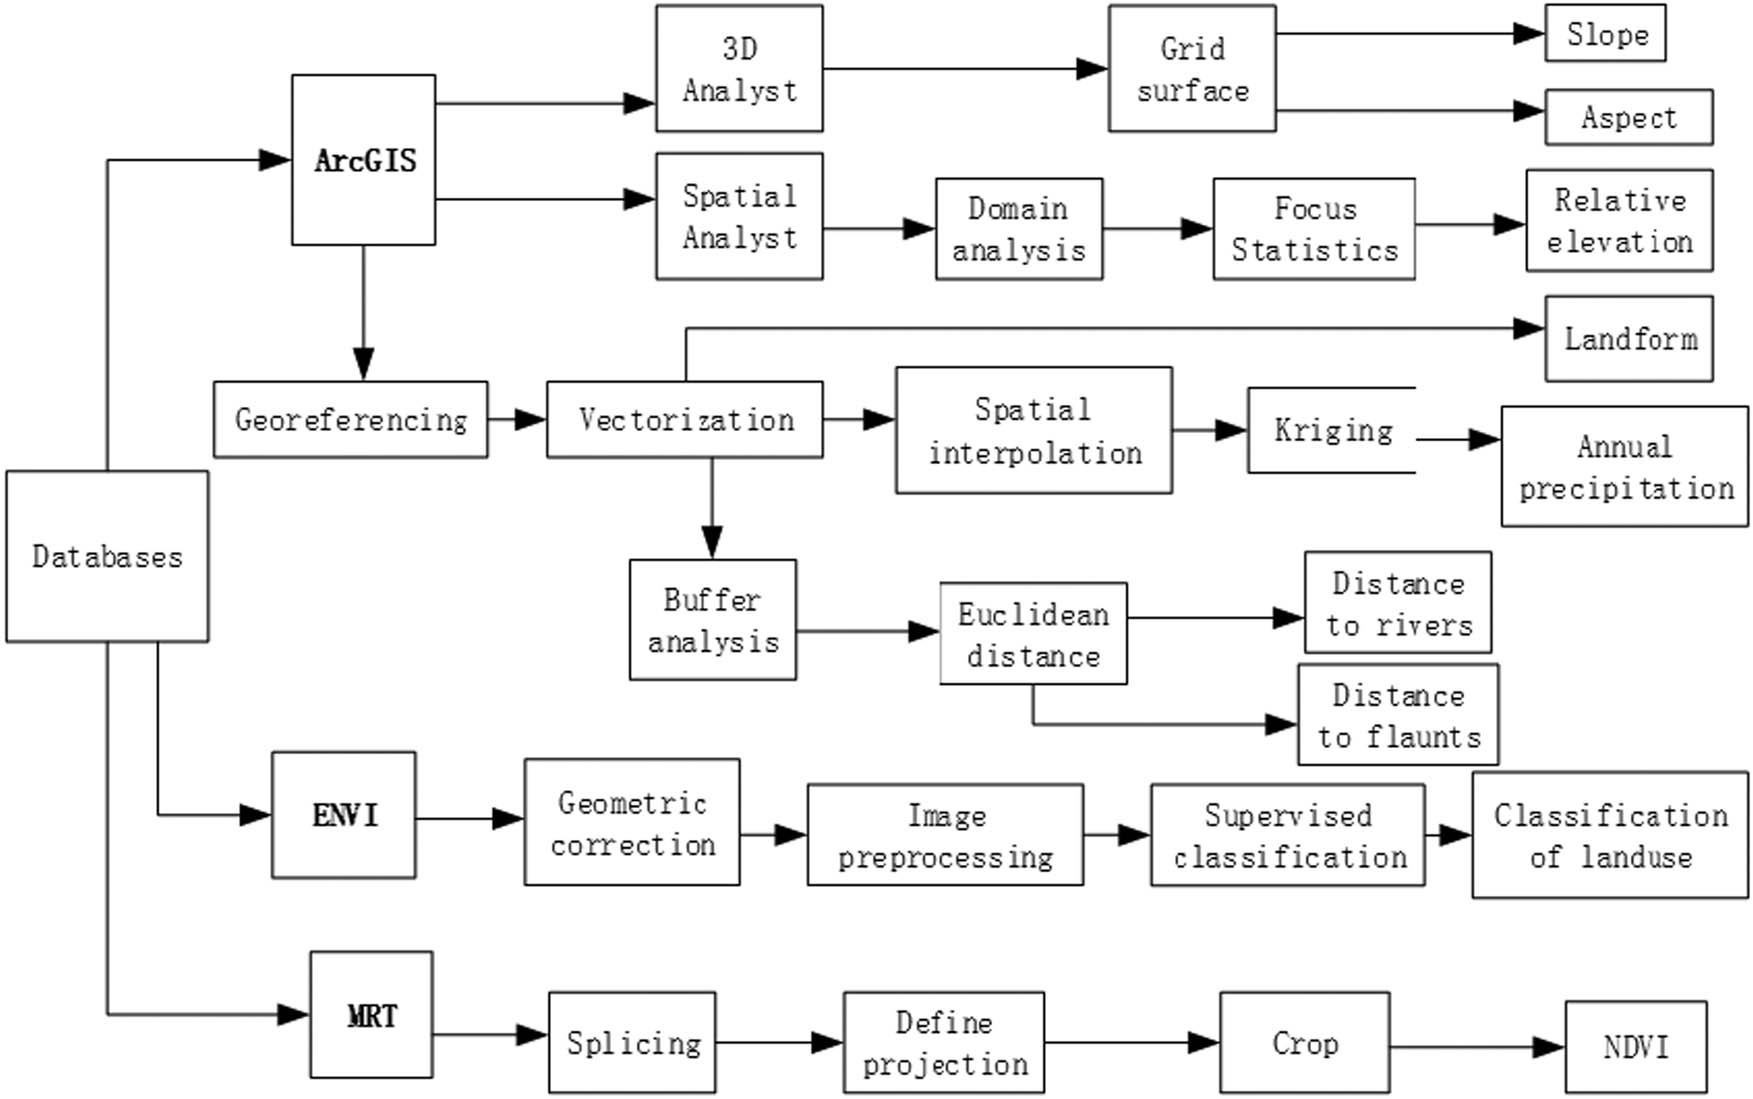
Flowchart of factor extraction.
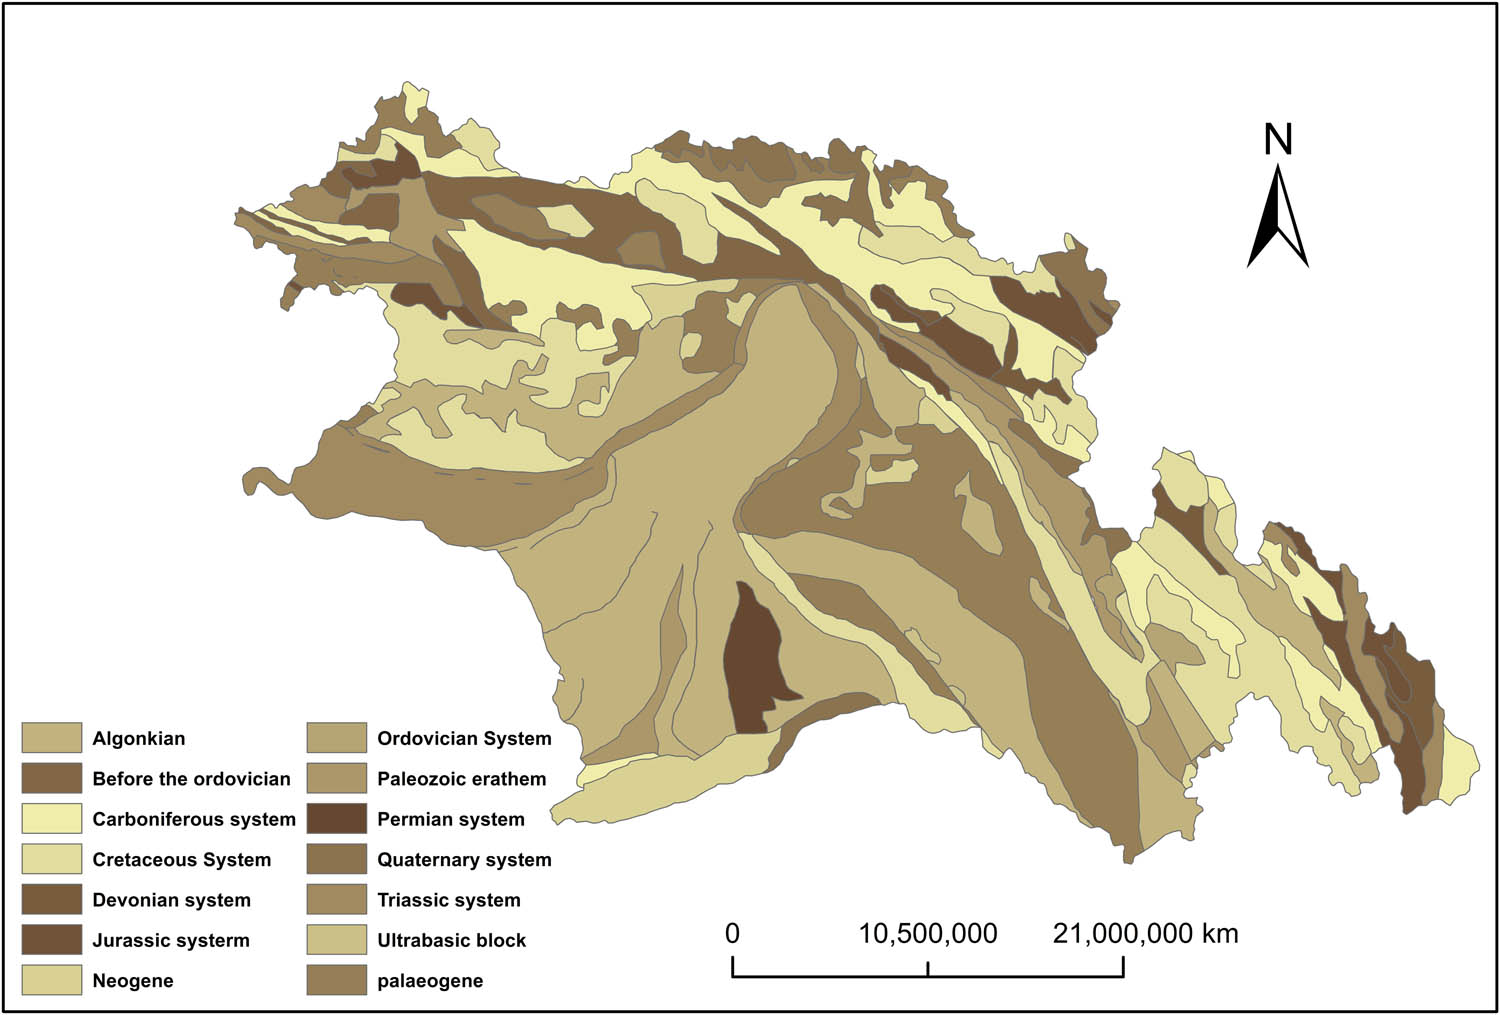
Geological map.
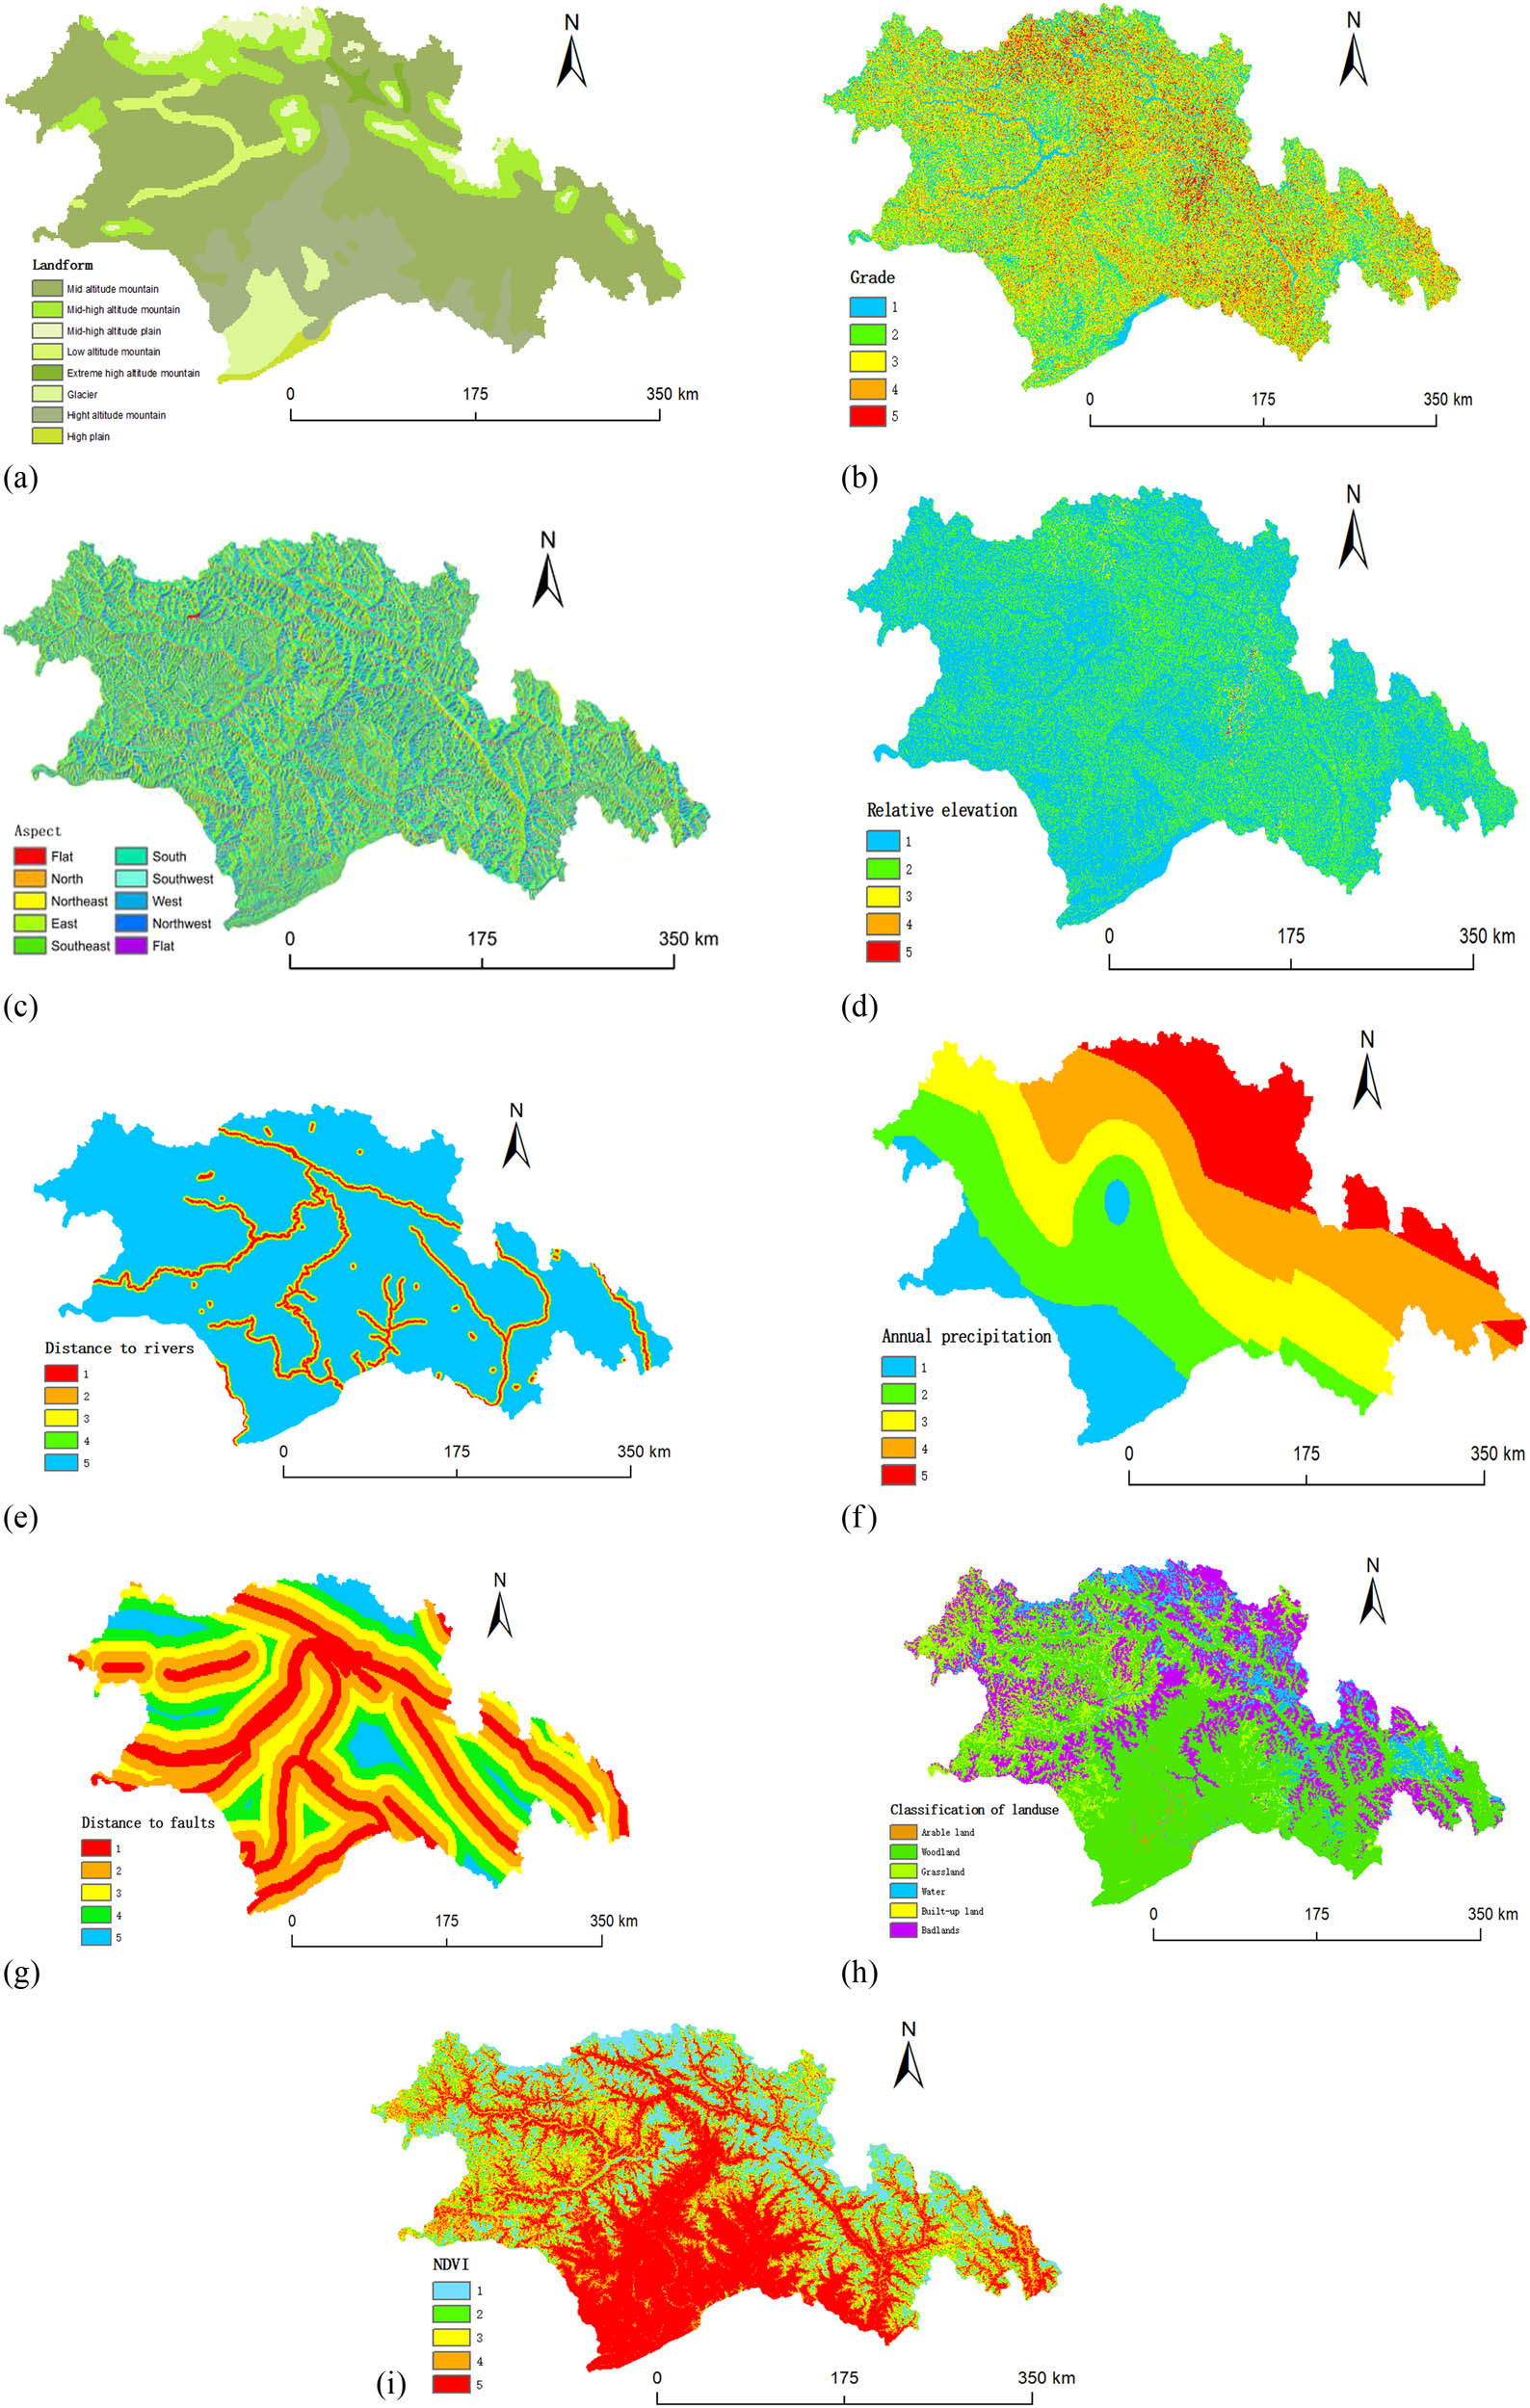
(a) Landform. (b) Grade. (c) Aspect. (d) Relative elevation. (e) Distance to rivers. (f) Annual precipitation. (g) Distance to faults. (h) Classification of land use. (i) NDVI.
4.2 Selection results
4.2.1 Landform
The degree of ground surface undulation is expressed by the type of landform. Different types of landform contain different types of rocks, which becomes the basis for the formation of geological disasters. The geological types are complex and diverse and mainly dominated by ultrabasic block and granite (see Figure 7). The crustal movement patterns can be derived from studying these geological structures. This further provides necessary materials for analyzing the causes of geological disasters. The landform types of Nyingchi are complex, including mountains, plains, glaciers, etc. They are divided into eight types based on the difference of elevation (see Figure 8a).
4.2.2 Slope
The steeper the slope is, the less stable its rock mass becomes because of gravity. This increases the chance of geological disaster occurrence. Because of the small range of slope values in the studied area, digital elevation model (DEM) is divided into five grades using the natural discontinuity classification method, such as 0–16.48°, 16.48–28.04°, 28.04–38.56°, 38.56–51.53°, and 51.53–89.37° (see Figure 8b).
4.2.3 Aspect
Aspect has a direct impact on mountain ecology and precipitation, thus contributing to the occurrence of natural disasters. The DEM data are reclassified into nine categories: flat (0°), north (337.5–360°, 0–22.5°), northeast (22.5–67.5°), east (67.5–112.5°), southeast (112.5–157.5°), south (157.5–202.5°), southwest (202.5–247.5°), west (247.5–292.5°), and northwest (292.5–337.5°) (see Figure 8c).
4.2.4 Relative elevation difference of terrain
The greater the elevation difference between the two locations is, the larger the tensile and shear stresses in the slope body will be, which will especially promote the occurrence of collapse and landslide. Focus statistics on DEM data is performed. Then using the natural breakpoint classification method, the data are divided into five grades: 0–56, 56–180, 180–527, 527–1,239, and 1,239–5,830 (see Figure 8d). The relative height difference in the north or southeast of Nyingchi is larger than other areas. The south has the smallest difference.
4.2.5 Distance to water system
The distance to the water system is determined by the discharge of rivers and the density of tributaries in the area. The development level of the water system is related to precipitation and vegetation coverage. By hydrological analysis of DEM, and extracting the water system in this area, the distance to the water system is divided into five grades using Euclidean distance method, which are 0–500 m, 500–1,000 m, 1,000–1,500 m, 1,500–2,000 m, and >2,000 m (see Figure 8e).
4.2.6 Average annual precipitation
Large-scale precipitation in a short period of time will weaken the stability of the soil and easily lead to landslides, collapses, and debris flows. As there are few meteorological stations in Nyingchi area, data from hydrological stations are also used. Information of a total of eight locations including Bomi, Nyingchi, Milin, Chayu, Baheqiao, Gengzhang, Nuxia, and Gongbujiangda are collected. Five precipitation intervals are derived using kriging interpolation (see Figure 8f). The average annual precipitation in this area ranges from 428 mm to as high as 1,082 mm. Especially in Bomi and Milin counties, rainfall is continuous for more than 40 days, mostly from July to October. The maximum daily amount reaches 111.7 mm.
4.2.7 Distance to fault zone
Vicinities of the fault zone have high earthquake occurrence. Natural hazards caused by earthquakes are often more destructive. According to statistics, there were 78 earthquakes in Nyingchi from June 2012 to June 2020. Magnitudes were 3–5 in the areas near the Yarlung Zangbo fault zone, including Bayi, Chayu, Medog, and Bomi counties. In this study, the fault zone is extracted from the geological structure map of Tibet and vectorized for the distance analysis. Five grades are derived as a result, namely 0–1,000 m, 1,000–2,000 m, 2,000–3,000 m, 3,000–4,000 m, and >4,000 m (see Figure 8g).
4.2.8 Land use types
Different land use types can reflect social data in the area such as population density, road conditions, and engineering construction. They also roughly demonstrate the interaction of geological disasters and human social activities. The remote sensing image is processed by the supervised classification method, which divides the land use types into six categories: grassland, woodland, arable land, built-up land, badland, and water area (see Figure 8h)
4.2.9 Vegetation coverage
The NDVI reflects the vegetation growth status and density in the studied area, with a range between −1 and +1. Using pixel statistics and the maximum value composite, the NDVI is divided into five levels, i.e., −0.03–0.21, 0.21–0.44, 0.44–0.65, 0.65–0.83, and 0.83–0.99 (see Figure 8i). Generally speaking, the larger the vegetation coverage, the higher the protection degree of vegetation to the soil, and the less likely geological disasters to occur.
5 Result analysis
5.1 Evaluation results
Nine evaluation factors are assessed using the analytic hierarchy process. The judgment matrix of the factors is calculated, and its consistency test is performed. The weight distribution W i , the maximum eigenvalue λ max, and the consistency ratio CR are derived (see Table 3). The CR being less than 0.1 demonstrates that the judgment matrix has good consistency and meets the consistency test standard. According to equation (4) combined with the contribution value of evaluation factors to each scheme, the GDHI is calculated (see Table 4).
The sensitivity and evaluation results of the two methods to the risk area are obviously different. After AHP only uses the expert scoring method, it obviously widens the gap between the five evaluation grades, while FAHP combines quantitative and qualitative methods to make the evaluation results more in line with the actual situation. The extremely low- and extremely high-risk areas are only a few.
The slope accounted for 32.62%, which is equivalent to the distance from the fault zone and the relative height difference of the topography but much higher than the other six items. This is because the slope in this area is steeper than other areas in Tibet. Mainly concentrated at 28–51°, which is the geographical basis for natural disasters that cannot be ignored; the distance from the fault zone is slightly higher than the weight of land use type, NDVI, distance from water system, and landform-induced geological disasters. The average annual precipitation and slope influence are far less than that of the fault zone, accounting for 3.5% and 2.36% respectively.
Large-scale rainfall in a short period of time has played an important role in landslides and mudslides. However, as the average annual rainfall in this article is only 3.5%, according to the expert scoring method and the analysis of the actual disaster situation, to avoid the accumulation of errors, the weight of this factor was actively reduced. More than 80% of the huge landslides, mudslides, and collapse disasters that have occurred in Nyingchi have occurred after continuous rainfall in summer or after the melting of glaciers caused by temperature rise, and very few of them are caused by human engineering activities.
The four types of land use, NDVI, distance from water system, and landform have a strong correlation and great mutual influence, and their impact on geological disasters is basically the same. The proportions are 6.42, 7.17, 6.42, and 7.35%, respectively, showing a uniform distribution.
For different levels of risk areas, the contribution values of various evaluation factors are also different. Among the extremely low-risk areas, only the distance from the fault zone contributed the most prominently, reaching 47.06%; in the low-risk area, the contribution of vegetation coverage, distance from the water system, topography, and relative height difference are similar, exceeding 35%; in the medium-risk zone, slope and annual average precipitation accounted for the highest proportions of all types, 47.72 and 47.95%, respectively, but the vegetation coverage and distance from the water system only accounted for 4.94 and 4.76%; land use types, NDVI, and distance from water systems in high-risk areas contribute about 30%; the aspect ratio of the extremely high-risk area is 42.75%, ranking first, and the remaining factors contribute relatively evenly.
Evaluation factor judgment matrix
| Criterion layer | Slope | Classification of land use | NDVI | Distance to flaunts | Distance to rivers | Annual precipitation | Landform | Relative elevation | Aspect | W i | Aspect | λ max | CR |
|---|---|---|---|---|---|---|---|---|---|---|---|---|---|
| Slope | 1 | 6 | 5 | 2 | 6 | 9 | 4 | 2 | 9 | 0.3262 | 9 | 9.0746 | 0.0064 |
| Classification of land use | 0.1667 | 1 | 1 | 0.3333 | 1 | 2 | 1 | 0.3333 | 3 | 0.0642 | 3 | ||
| NDVI | 0.2 | 1 | 1 | 0.5 | 1 | 2 | 1 | 0.5 | 3 | 0.0717 | 3 | ||
| Distance to flaunts | 0.5 | 3 | 2 | 1 | 3 | 6 | 2 | 1 | 8 | 0.1740 | 8 | ||
| Distance to rivers | 0.1667 | 1 | 1 | 0.3333 | 1 | 2 | 1 | 0.3333 | 3 | 0.0642 | 3 | ||
| Annual precipitation | 0.1111 | 0.5 | 0.5 | 0.1667 | 0.5 | 1 | 0.5 | 0.2 | 2 | 0.0350 | 2 | ||
| Landform | 0.25 | 1 | 1 | 0.5 | 1 | 2 | 1 | 0.5 | 3 | 0.0735 | 3 | ||
| Relative elevation | 0.5 | 3 | 2 | 1 | 3 | 5 | 2 | 1 | 7 | 0.1676 | 7 | ||
| Aspect | 0.1111 | 0.3333 | 0.3333 | 0.125 | 0.3333 | 0.5 | 0.3333 | 0.1429 | 1 | 0.0236 | 1 |
Geological hazard risk assessment index
| Slope | Classification of land use | NDVI | Distance to flaunts | Distance to rivers | Annual precipitation | Landform | Relative elevation | Aspect | AHP | FAHP | |
|---|---|---|---|---|---|---|---|---|---|---|---|
| Very low | 0.1165 | 0.1739 | 0.0961 | 0.4706 | 0.0952 | 0.1510 | 0.0945 | 0.1250 | 0.0510 | 0.0933 | 0.153 |
| Low | 0.2329 | 0.087 | 0.3743 | 0.2353 | 0.3810 | 0.2653 | 0.3871 | 0.3750 | 0.2086 | 0.1784 | 0.283 |
| Medium | 0.4772 | 0.3478 | 0.0494 | 0.1176 | 0.0476 | 0.4795 | 0.3778 | 0.3750 | 0.2086 | 0.3174 | 0.276 |
| High | 0.0569 | 0.3478 | 0.3842 | 0.1176 | 0.3810 | 0.0521 | 0.0462 | 0.0625 | 0.1043 | 0.2793 | 0.173 |
| Very high | 0.1165 | 0.0435 | 0.0961 | 0.0588 | 0.0952 | 0.0521 | 0.0945 | 0.0625 | 0.4275 | 0.1315 | 0.116 |
5.2 Risk assessment
In the ArcGIS software, GDHI is weighted and superimposed to obtain the Nyingchi geological hazard risk assessment map (see Figure 9). The Nyingchi area is divided into five grades using the natural discontinuity method. The derived evaluation chart is further analyzed with Figures 1 and 3 being the base map (see Table 4).
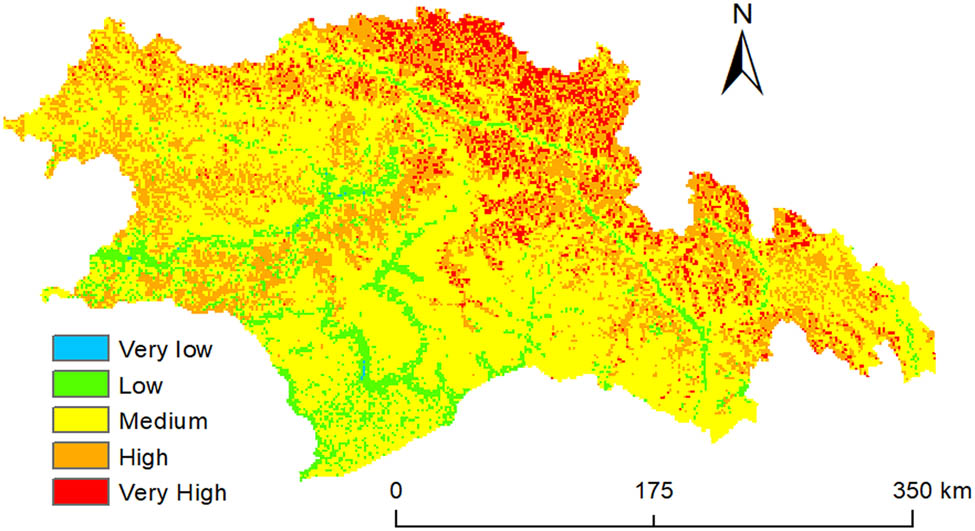
Geological hazard risk assessment map of Nyingchi.
The extremely low-risk area is 16,330 km2, accounting for 15.34% of the total area. It is mainly distributed in the central part of Sijol River, the central part of Yarlung Zangbo River, and the marginal area of Chayu County; the low-risk area is 30,130 km2, accounting for 28.31% of the total area. It is mainly distributed along the river systems of Yigong Zangbu, Palong Zangbu, Yarlung Zangbu, Danba Qu, Sangqu, Nu River, Chayu Qu, Gongri Gabu Qu, Siba Xia Qu, and Sijol River, especially in the main rivers of Metuo County, Mirin County, and Chayu County; the middle-risk area is 29,430 km2, accounting for 27.62% of the total area. Some of them are distributed along the upper and lower reaches of the Brahmaputra, the upper and lower reaches of the Yarlung Zangbo River, the Siba Xiqu, the Nu River, and Chayu Qu. The rest are mainly in the northwest of Paki District, the middle part of Mirin County, most of Motuo County, and the west and southeast of Chayu County; the high-risk area is 18,430 km2, accounting for 17.33% of the total area, showing a decreasing trend from north to south. It is evenly distributed across Gongbujiangda County and the middle-risk area. As the fault zone and the junction of counties are basically coincident, these are also in the high-risk area; the extremely high-risk area covers an area of 12,430 km2, accounting for 11.65% of the total area. It is mainly distributed in Bhumi County, in the north of Chayu County, and in the southeast of Motuo County. The three counties also present extremely high risk at the intersection.
5.3 Accuracy verification
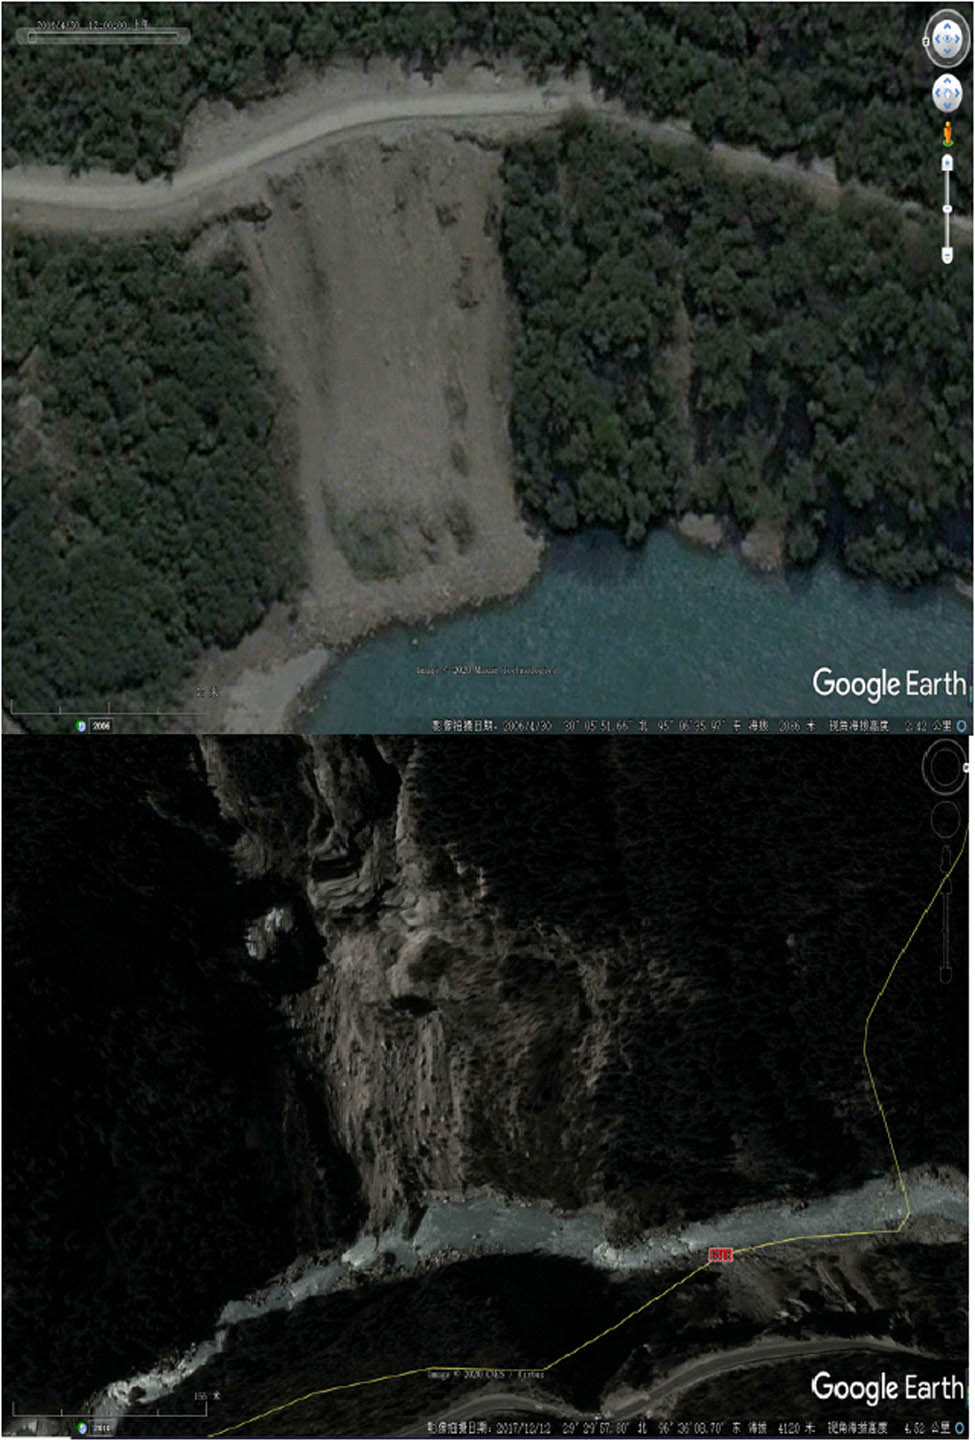
A point in the low-risk area of the obtained hazard assessment map is randomly selected. The assessment results of selection are verified through historical images of Google Earth in 1984, 2004, and 2013 and the actual field survey in July 2020 (see Figure 10). In 1984, the site suffered geological disasters all the year round. It was in the initial period of geological disasters, and the scale was above the middle level. As there was no human inhabitation, no preventive actions were implemented. In 2004, ecological restoration was carried out by planting trees, aiming for reducing disaster occurrence. However, the effect was not obvious as the mountain is steep, the vegetation is sparse, and the terrain has a relatively large elevation difference (more than 500 m). The geological disasters that occurred later were still severely destructive. In 2013, the project was improved by strengthening and constructing a drainage system for further control. Residential land was also established on the opposite bank of the river. When visiting the site in the rainy season of 2020, there was only slight landslides and mudslides with a small amount of rubble rolling down. Threats to the life of nearby residents and construction activities are insignificant.
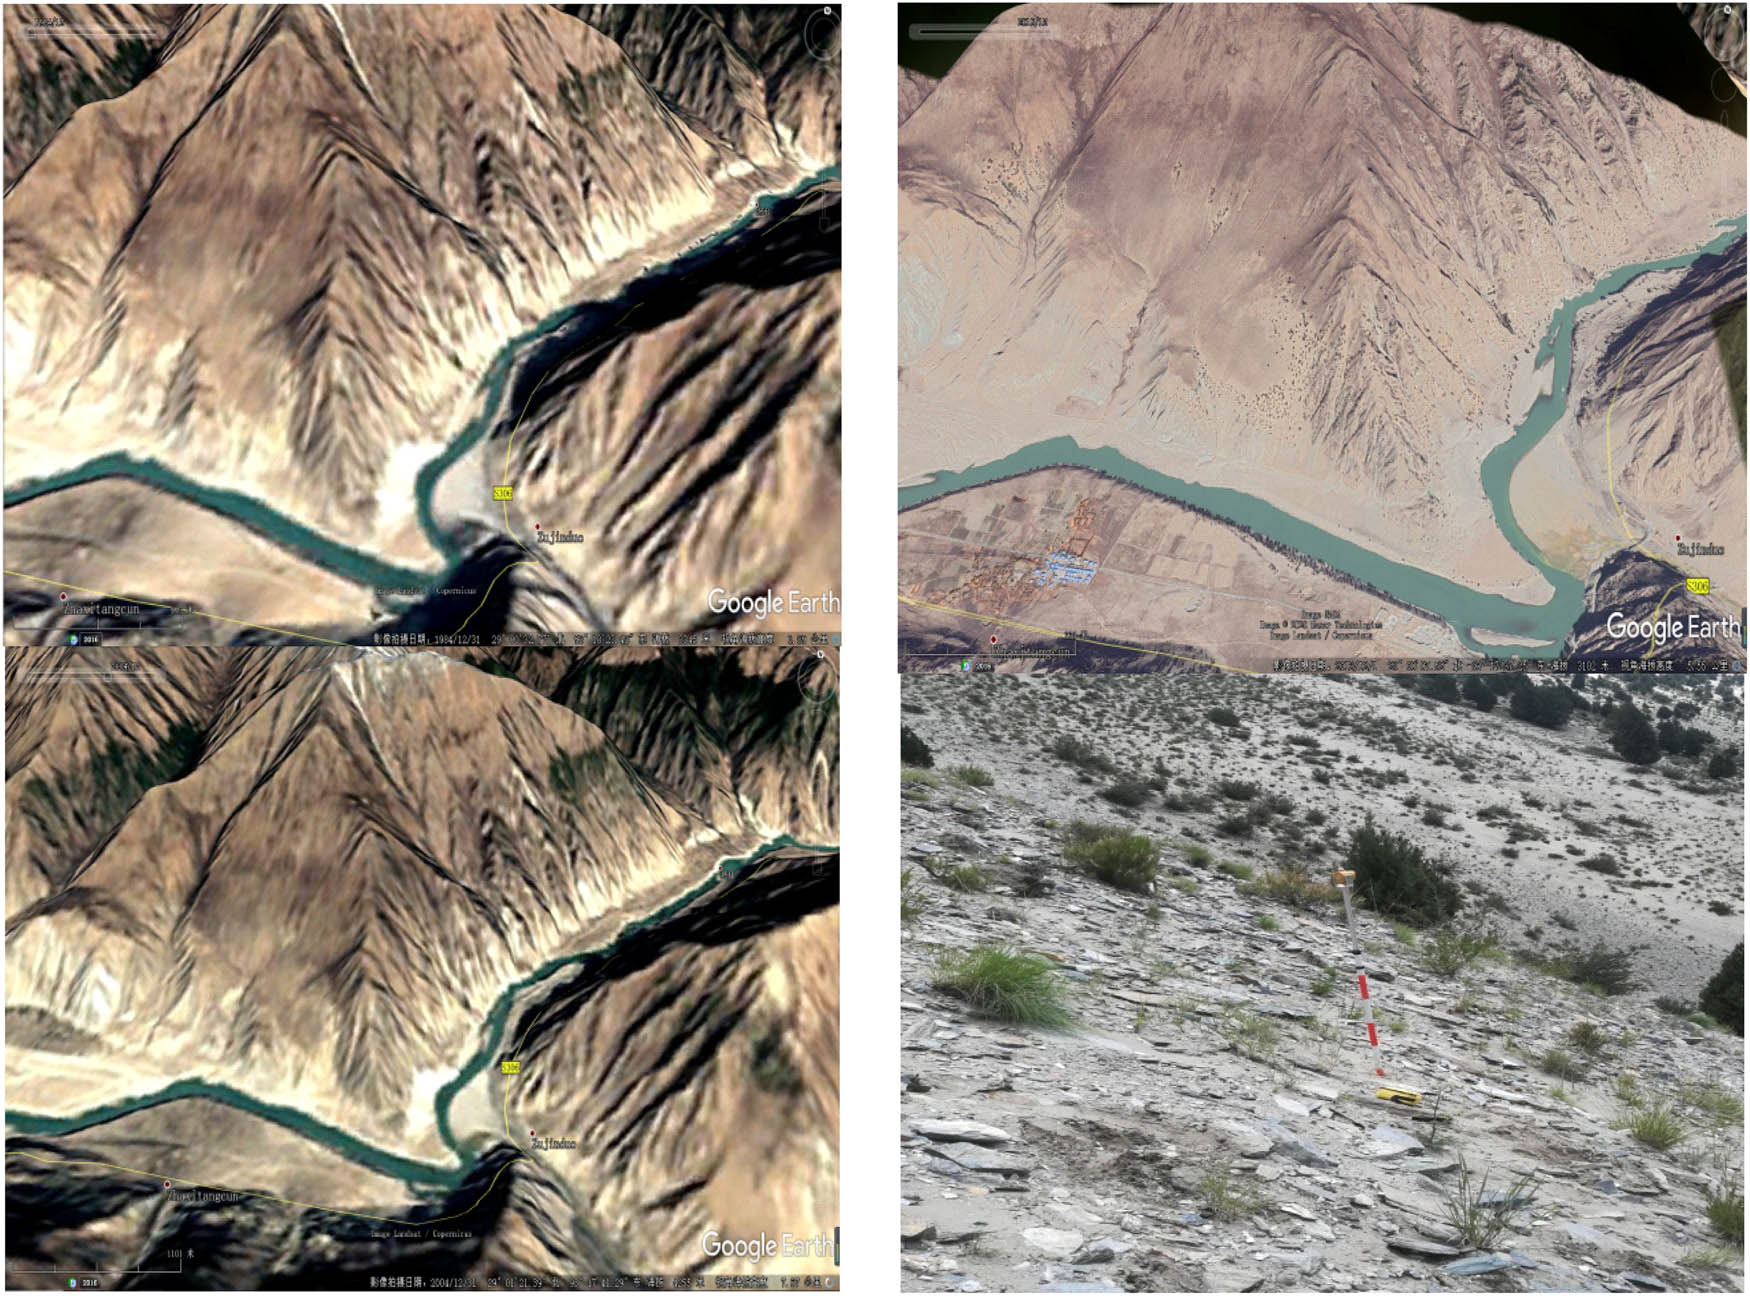
Verification point diagram.
6 Conclusions
Based on the frequent occurrence of geological disasters and the lack of basic data in Nyingchi region, nine evaluation factors including landform, slope, slope direction, relative height difference, distance from water system, average annual precipitation, distance from fault zone, land use type, and vegetation coverage were selected. AHP and FAHP methods were used for analysis and comparison. The results show the following:
High-risk and very high-risk areas accounted for about 28%, low-risk and very low-risk areas accounted for 42%, and medium-risk areas accounted for 27.62%. In general, more than 60% of the regions are not less than the medium-risk level. According to the requirements of disaster prevention rules, it is necessary to strengthen the prevention and treatment of natural disasters in these regions, which further verifies the necessity and importance of natural disaster risk assessment for Nyingchi.
Geological hazards in Nyingchi region are mainly affected by slope, distance from fault zone, and relative elevation difference of topography. Second, land use type, NDVI, distance from water system, and landform play a supporting role. Slope makes the least contribution to the occurrence of natural disasters. Considering the probability of occurrence in each risk area, Bomi County has the highest probability of natural disaster, followed by Chayu County, Motuo County, Bayi District, Gongbujiangda County, Mirin County, and Lang county having the lowest probability; from the comprehensive consideration of time and space, the probability of natural disaster in the unused land in the mountains with high rainfall in June–August is much higher than other types.
Application of the AHP to risk assessment of geological disasters is already very mature. However, selection of evaluation factors and construction of the judgment matrix tend to be subjective. This research is conducted under the premise of several serious natural disasters that have occurred in the area, avoiding complete reliance on mathematical modeling in FAHP, especially in weight distributions of slopes and annual precipitation and the selection of trapezoidal membership function. A location is randomly selected from the five-level risk map and is correlated with 3 years historical images and field visits of 2020. Accuracy of evaluation is verified because of the analysis results being consistent with the actual situation.
In this paper, different types of natural disasters are not carefully discussed and studied. However, based on the actual occurrence of disasters in Tibet, the concurrent probability of landslide, collapse, and debris flow is relatively large, so the research results can still provide a scientific and reliable basis for the analysis of geological disasters in this city.
Although Nyingchi borders on the border and its population distribution are relatively scattered, it is in the accelerated period of urban construction, and there are frequent landslides, mudslides, collapses, and earthquakes. If prediction and analysis can be done, it will have an important positive impact on regional ecological protection and ecological restoration. It will also greatly reduce the harm of geological disasters to the lives and properties of local residents and will also promote better economic and social development of the city.
Acknowledgment
This research was funded by the Graduate Innovation Project in the Tibet Agriculture and Animal Husbandry Institute (YJS2019-10).
References
[1] Lyu HM, Shen SL, Yang J, Zhou AN. Risk assessment of earthquake-triggered geohazards surrounding Wenchuan, China. Nat Hazards Rev. 2020;21(3):05020007. 10.1061/(ASCE)NH.1527-6996.0000375.Search in Google Scholar
[2] Xiao LM, Zhang YH, Ge TT, Wang C, Wei M. Analysis, assessment and early warning of mudflow disasters along the Shigatse section of the China–Nepal highway. Open Geosci. 2020;12:44–58. 10.1515/geo-2020-0004.Search in Google Scholar
[3] Wu RZ, Hu XD, Mei HB, He JY, Yang JY. Spatial susceptibility assessment of landslides based on random forest: a case study from Hubei section in the three gorges reservoir area. Earth Sci. 2021;46(1):321–30. 10.3799/dqkx.2020.032.Search in Google Scholar
[4] Li YY, Mei HB, Ren XJ, Hu XD, Li MD. Geological disaster susceptibility evaluation based on certainty factor and support vector machine. J Geo-Inf Sci. 2018;20(12):1699–709. 10.12082/dqxxkx.2018.180349.Search in Google Scholar
[5] Wang Y, Lin QG, Shi PJ. Spatial pattern and influencing factors of casualty events caused by landslides. Acta Geogr Sin. 2017;72(5):906–17. 10.11821/dlxb201705011.Search in Google Scholar
[6] Stanley TA, Kirschbaum DB, Sobieszczyk S, Jasinski MF, Borak JS, Slaughter SL. Building a landslide hazard indicator with machine learning and land surface models. Environ Model Softw. 2020;129:1–15. 10.1016/j.envsoft.2020.104692.Search in Google Scholar
[7] Yang SH, Liao JJ, Pan YW, Shih TY. Landslide site delineation from geometric signatures derived with the Hilbert–Huang transform for cases in Southern Taiwan. Open Geosci. 2020;12:928–45. 10.1515/geo-2020-0187.Search in Google Scholar
[8] Xie GD, Lu CX, Leng YF, Zheng D, Li SC. Ecological assets valuation Tibetan Plateau. J Nat Resour. 2003;02:189–96.Search in Google Scholar
[9] Wang Y, Jin JL, Yuan RM. Analysis on spatial distribution and influencing factors of geological disasters in southeast Tibet. J Seismol Res. 2019;42(03):428–37 + 456.Search in Google Scholar
[10] Bai L, Li GH, Song BW. The source parameters of the M6.9 Mainling, Tibet earthquake and its tectonic implications. Chin J Geophys. 2017;60(12):4956–63. 10.6038/cjg20171234.Search in Google Scholar
[11] Su LB, Guo YG, Wu Y, Yang YT. Distribution characteristics of active structure and seismic hazard analysis in Tibet based on GIS. Sci Technol Eng. 2020;20(3):1256–62.Search in Google Scholar
[12] China Earthquake Networks Center. The epicenter location and basic parameter of the main shock; 2017 Nov 18 [2017 Dec 1]. http://www.Csi.ac.cn/manage/eqDown/05LargeEQ/201711180634M6.9/zonghe.HtmlSearch in Google Scholar
[13] Deng MF, Chen N, Liu M. Meteorological factors driving glacial till variation and the associated periglacial debris flows in Tianmo valley, south-eastern Tibetan Plateau. Nat Hazards Earth Syst Sci. 2017;17(3):345–56.10.5194/nhess-17-345-2017Search in Google Scholar
[14] Saaty TL. A scaling method for priorities in hierarchical structures. J Math Psychol. 1997;15(3):234–81. 10.1016/0022-2496(77)90033-5.Search in Google Scholar
[15] Lee S, Pradhan B. Landslide hazards mapping at Selangor, Malaysia using frequency ratio and logistic regression models. Landslides. 2007;4(1):33–41. 10.1007/s10346-006-0047-y.Search in Google Scholar
[16] Kumar R, Anbalagan R. Landslide susceptibility mapping using analytical hierarchy process (AHP) in Tehri reservoir rim region, Uttarakhand. J Geol Soc India. 2016;87(3):271–86. 10.1007/s12594-016-0395-8.Search in Google Scholar
[17] Lyu HM, Sun W, Shen SL, Zhou AN. Risk assessment using a new consulting process in fuzzy AHP. J Constr Eng Manage. 2020;146(3):04019112. 10.1061/(ASCE)CO.1943-7862.0001757.Search in Google Scholar
© 2021 Chenshuang Wu et al., published by De Gruyter
This work is licensed under the Creative Commons Attribution 4.0 International License.