


LLM Evaluation Metrics: Benchmarks, Protocols & Best Practices

What are LLM Evaluation Metrics?
Large Language Models (LLMs) have revolutionized the field of Natural Language Processing (NLP) due to their ability to understand and generate human language with remarkable proficiency. These models like GPT-4, BERT, T5, etc. are being utilized in a variety of applications ranging from automated text generation and translation to conversational agents, and content recommendation systems. Evaluating these LLMs has become critical to ensure their effectiveness and reliability.
Evaluation with the help of various evaluation metrics helps developers understand how a model is performing in different contexts and tasks. Moreover, effective evaluation plays a pivotal role in comparing different LLM models, helping us to make informed decisions on best model selection, model deployment, and identifying potential biases and ethical concerns. Ideally, you should not deploy an LLM-based solution without evaluating it as the performance of the LLM can be suboptimal and have unintended consequences and reduced trust in AI systems. Moreover, the evaluation of LLMs is particularly challenging due to the complexity of natural language. For any evaluation task, you need to prepare the ground truth, which in the case of LLM is human-crafted, this is another challenge for evaluation. Finally, using automated metrics does not guarantee factual accuracy, robustness, and generalization adding further complexity to the evaluation process.
In this article, you will learn about various metrics and benchmarks for LLM evaluation. You will also be introduced to the best practices that you should follow while evaluating the LLMs for any of your use cases.
Importance of Evaluating Language Models
Before delving into various LLM evaluation metrics, you need to understand the importance of evaluating the language models. There are three main pillars of LLM evaluation: quantifying performance, fairness, and continuity of the evaluation process. Let’s understand each one of them in detail.
Understanding Performance
Evaluating a language model helps understand its performance on various tasks and in various domains. Performance metrics like precision, recall, perplexity, etc. provide a more quantitative summary of how well a model is performing on language-related tasks. These metrics help in determining if the selected model meets the specified performance or falls short in handling the intricacies of human language reliably.
Fairness and Bias Detection
Large language models are trained on vast datasets that reflect human biases. As a result, they keep on generating biased and unfair answers sometimes. Evaluation of LLMs for fairness and bias helps in developing the ethical system. This aspect of evaluation is essential for building inclusive technologies that respect diversity and avoid harm.
Continuous Improvement
The field of NLP is growing at a rapid pace and so is the need for new LLMs that can perform even better than their predecessors. Evaluation metrics provide a feedback loop that guides the iterative process of model development and refinement. By regularly assessing and comparing model performance, developers can identify areas for enhancement, implement updates, and benchmark progress against state-of-the-art models.
Key LLM Evaluation Metrics
Several metrics aim to evaluate different types of LLMs based on the tasks they are being utilized for. Just like traditional evaluation metrics, there is not a single metric that can evaluate all kinds of LLMs. These metrics are divided into multiple sub-categories depending on their nature. Some of these metrics are older than LLMs of today and have prolong been used for evaluating the performance of the NLP models. Let’s have a look at each.
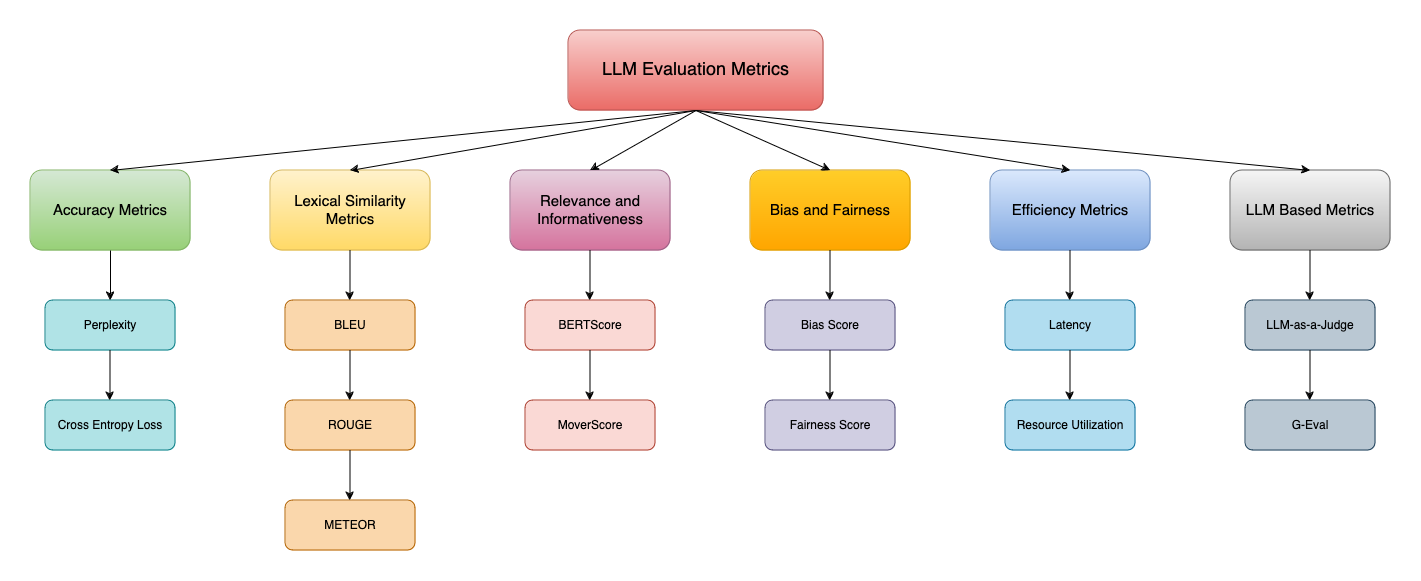
Accuracy Metrics
Cross-entropy loss
Cross entropy metrics measure the difference between the true probability distribution of the target words and the predicted probability distribution produced by the model. The idea behind cross-entropy is to quantify the likelihood of the model’s predictions matching the actual target. The lower the cross entropy, the closer the match between actual and predicted sequence of words. The best part of cross entropy is that it provides a numerical way to gauge the similarity or divergence in ground truth and model-generated text.
Usually, cross-entropy is used as a loss function for classification tasks, but there is some scope to use it as an evaluation metric since perplexity (another metric discussed below) depends on cross-entropy for LLM evaluation.
Mathematically, for a given sequence of words w₁,w2,…,wN, where P(wi∣w<i)) represents the model's predicted probability for the word wi given the previous words w<i, the cross-entropy loss H is given by:

Consider a simple example with a sequence of words: "The cat sat on the mat". Assume our language model assigns the following predicted probabilities for each word given the previous words:
- P("The") = 0.2
- P("cat"∣"The") = 0.1
- P("sat"∣"The cat") = 0.15
- P("on"∣"The cat sat") = 0.3
- P("the"∣"The cat sat on") = 0.25
- P("mat"∣"The cat sat on the") = 0.05
Using these probabilities, we can calculate the cross-entropy as follows:
Step-1: Compute the log probabilities:
- logP("The") = log(0.2) = −1.6094
- logP("cat"∣"The") = log(0.1) = −2.3026
- logP("sat"∣"The cat") = log(0.15) = −1.8971
- logP("on"∣"The cat sat") = log(0.3) = −1.2039
- logP("the"∣"The cat sat on") = log(0.25) = −1.3863
- logP("mat"∣"The cat sat on the") = log(0.05) = −2.9957
Step-2: Sum the log probabilities:
∑logP(wi) = −1.6094 + −2.3026 + −1.8971 + −1.2039 + −1.3863 + −2.9957 = −11.3950Step-3: Compute the average negative log probability:
-∑logP(wi) / 6 = −11.3950 / 6 = 1.8992This lower cross-entropy loss indicates that the predicted probability distribution is closer to the true distribution of the target words, signifying better model performance.
Perplexity
Perplexity quantifies how well a probabilistic model predicts a sample (a piece of text in this case). It is the measure of how uncertain a model is in predicting the next word in the sequence. More straightforwardly, it is the measure of the amount of randomness in the model. For example, if perplexity for a model is 4 then the model had a 1-in-4 chance of guessing (on average) the next word in the text. A lower perplexity score reflects better model performance as the model will have to choose from a small set of words to predict the next word.
Perplexity depends on the cross-entropy loss and represents the average branching factor of a predictive model, indicating how many possible next words it considers. Although the model assigns a probability score to all the available words in the corpus, perplexity only pays attention to the top N words that are being considered as the potential next word.
One important detail about perplexity is that it depends on the same data that was originally used to train the model as it measures the extent to which the model learned the data distribution. Thus, it can only be used to compare models trained on the same data.
Mathematically, if a language model assigns a probability P(w1,w2,…,wN)to a sequence of words w1,w2,…,wN, the perplexity PP is given by:

Alternatively, it can be expressed using the average negative log-likelihood (cross-entropy) of the words in the sequence:

Let’s take the same example as cross-entropy, the first three steps are going to remain the same (until the calculation of average negative log probability). You just need to calculate the perplexity with the obtained cross-entropy score as follows:
Step-4: Exponentiate to get the perplexity:
PP(W) = exp(1.8992) ≈ 6.68So, the perplexity of the language model for this sequence is approximately 6.68. A higher perplexity value is ideal for the use cases that require higher creativity for example generating poetry, fiction, or marketing copy. This will result in producing more engaging and diverse content. On the other hand, for task-specific applications like machine translation, summarization, etc. a lower perplexity value is desirable as it will ensure the generated text aligns with the expected outcome.
Lexical Similarity
BLEU (Bilingual Evaluation Understudy)
BLEU is a precision-based metric that is primarily used for evaluating the quality of the text generated by the LLMs. It was originally designed for language translation tasks but it can be extended to other tasks like text summarization, text generation, etc. BLEU compares the n-grams of the generated text to one or more reference (ground-truth) texts.
Note: N-grams are continuous sequences of words or tokens in a document. 1-gram means a single token, 2-grams is a combination of two words, and the n-gram is the collection of n number of tokens.
It starts with calculating the precision for each matching n-gram in the reference (human-crafted) text and the model-generated text. Then it applies a brevity penalty to adjust the score to penalize shorter translations/texts that might achieve high precision by being too short.
BLEU score is typically calculated for different n-gram lengths (normally 4) and then combined into a single score by calculating the geometric mean.
Let’s take an example to calculate the BLEU score step by step.
- Candidate (generated) translation: "The quick brown fox jumps over the lazy dog"
- Reference translation: "A fast brown fox leaps over the lazy dog"
Step-1: Calculate precision (Pn) for each n-gram length
Pn = Number of n-grams in the candidate that match any of the reference translations / Total number of n-grams in the candidate
1-gram precision: Count the matching unigrams.
- Matching unigrams: "brown", "fox", "over", "the", "lazy", "dog" (6 matches)
- Total unigrams in candidate: 9
p1 = 6 / 9 = 0.6667
2-gram precision: Count the matching bigrams.
- Matching bigrams: "brown fox", "over the", "the lazy", "lazy dog" (4 matches)
- Total bigrams in candidate: 8
p2 = 4 / 8 = 0.5
3-gram precision: Count the matching trigrams.
- Matching trigrams: "over the lazy", "the lazy dog" (2 matches)
- Total trigrams in candidate: 7
p3 = 2 / 7 ≈ 0.2857
4-gram precision: Count the matching 4-grams.
- Matching 4-grams: "the lazy dog" (1 match)
- Total 4-grams in candidate: 6
p4 = 1 / 6 ≈ 0.1667
Step-2: Combine the precision scores using the geometric mean
P4 = ( p1 × p2 × p3 × p4) ¼ = (0.6667 × 0.5 × 0.2857 × 0.1667)¼ ≈ 0.349
Step-3: Apply a brevity penalty (BP)

In this case, both the candidate and reference translations have 9 words, so BP=1.
Step-4: Calculate the BLEU score:
BLEU = BP × P4 = 1 × 0.349 ≈ 0.349The BLEU score ranges from 0 to 1, where higher scores indicate better quality and closer alignment with the reference texts. So as per the results, the generated text is of below-average quality.
Drawbacks of BLEU Score
- BLEU relies on exact n-gram matching and does not take into account the context and meaning of the text leading to potential inaccuracy in the evaluation.
- Synonyms and other similar words are not recognized by BLEU which leads to generating lower scores even if the sentences are similar.
- BLEU often fails to capture the longer dependencies and structure as it evaluates the n-grams up to a certain length (typically 4).
ROUGE (Recall-Oriented Understudy for Gisting Evaluation)
Among all, ROUGE is the most popular evaluation method that is majorly used for text summarization tasks and evaluates the quality of LLM-generated summaries by comparing them to reference summaries. Unlike precision-focused metrics like BLEU, ROUGE emphasizes recall, measuring how much of the reference summary is captured by the generated summary. It calculates the percentage (0–1) of the reference's n-grams that are included in the LLM output.
ROUGE has multiple variants including:
- ROUGE-N: It measures the match between different n-grams in the reference and candidate summaries. ROUGE-1 compares a single token at a time, ROUGE-2 compares a combination of two tokens in the reference and candidate summaries, and so forth.
- ROUGE-L: It measures the longest common subsequence (LCS) between the generated and reference texts, capturing the sequence similarity.
- ROUGE-W: A weighted version of ROUGE-L, giving more weight to consecutive matches.
- ROUGE-S: It calculates the skip-bigram co-occurrence statistics. Word pairings that maintain their sentence structure but allow arbitrary breaks are known as skip-bigrams.
Let’s calculate the ROUGE-N metrics for one example summary.
- Candidate summary: "The quick brown fox jumps over the lazy dog"
- Reference summary: "The fast brown fox leaps over the lazy dog"
The formula to calculate the ROUGE-N score is as follows:
ROUGE-N = Number of matching n-grams / total number of n-grams in the reference summary
Calculate ROUGE-1 (unigram overlap):
- Unigrams in the candidate: {"The", "quick", "brown", "fox", "jumps", "over", "the", "lazy", "dog"}
- Unigrams in reference: {"The", "fast", "brown", "fox", "leaps", "over", "the", "lazy", "dog"}
- Matching unigrams: {"The", "brown", "fox", "over", "the", "lazy", "dog"} (7 matches)
- Total unigrams in reference: 9
ROUGE-1 = 7 / 9 ≈ 0.7778
Calculate ROUGE-2 (bigram overlap):
- Bigrams in the candidate: {"The quick", "quick brown", "brown fox", "fox jumps", "jumps over", "over the", "the lazy", "lazy dog"}
- Bigrams in reference: {"The fast", "fast brown", "brown fox", "fox leaps", "leaps over", "over the", "the lazy", "lazy dog"}
- Matching bigrams: {"brown fox", "over the", "the lazy", "lazy dog"} (4 matches)
- Total bigrams in reference: 8
ROUGE-2 = 4 / 8 = 0.5ROUGE-1 indicates that 77% of the unigrams in the reference summary are captured by the candidate summary while ROUGE-2 indicates only 50% of the bigrams are captured. The ROUGE score always has a value between 0 to 1, 1 being the exact match of candidate and reference summaries.
Drawbacks of ROUGE
- Since ROUGE is recall-oriented, it can lead to higher scores for the longer summaries that include more of the reference text even if they contain irrelevant information.
- Similar to BLEU, ROUGE also focuses on surface-level matching of the texts and can miss the deeper semantic similarities.
- ROUGE also does not take into account the synonyms and similar words leading to a poor score for the texts that have the same meaning but different words.
METEOR (Metric for Evaluation of Translation with Explicit ORdering)
While BLEU and ROUGE are quite good for the word-to-word match, they do not take into account the synonyms in account. If two sentences have different words but the same meaning, they will be provided a really low score by these metrics. METOR is designed to improve upon the limitations of BLEU and ROUGE by considering synonyms, stemming, and paraphrases in addition to exact word matches. METEOR scores are based on the harmonic mean (F-mean) of unigram precision and recall, with recall weighted higher than precision. The metric also incorporates a penalty for incorrect word order.
The METEOR score is calculated using the following steps:
Step-1: Match unigrams:
Consider exact matches, stemming matches, synonym matches, and paraphrase matches.
Step-2: Calculate precision and recall:
Precision = Number of matches / Total number of unigrams in candidate
Recall = Number of matches / Total number of unigrams in reference
Step-3: Calculate F-mean score:
Fmean = (10 × Precision × Recall) / (9 × Precision + Recall)Step-4: Calculate the penalty for word order:
Penalty = 0.5 × (num_chunks / num_matches)Step-5: Combine F-mean score and penalty:
METEOR = Fmean × ( 1 − Penalty )The METEOR metric provides a more nuanced evaluation compared to metrics like BLEU, capturing a broader range of linguistic phenomena.
Relevance and Informativeness
BERTScore
BERTScore is a popular metric for evaluating the quality of text generated by language models, leveraging contextual embeddings from pre-trained BERT (Bidirectional Encoder Representations from Transformers) language model. While traditional metrics rely on the token match, BERTScore uses cosine similarity between the embeddings of the generated text and the reference text. This allows BERTScore to capture semantic similarity and nuances that n-gram-based metrics might miss.
The BERTScore is calculated using the following steps:
- Generate embeddings: Use a pre-trained BERT model to generate embeddings for each token in the candidate and reference texts.
- Calculate cosine similarity: Compute the cosine similarity between each token in the candidate and the most similar token in the reference.
- Aggregate scores: Aggregate the similarity scores to get precision, recall, and F1 score.
BERTScore is particularly useful for evaluating language models as it goes beyond surface-level text matching, leveraging deep contextual embeddings to assess the quality of the generated text.
MoverScore
MoverScore is another metric that measures the quality of text generation by calculating the distance required to transform one text (candidate) into another (reference). It combines the strength of both embedding-based and distance-based approaches. Similar to BERTScore, MoverScore leverages word embeddings to capture semantic meaning, making it more robust to variations in wording.
MoverScore is based on the concept of Earth Mover’s Distance (EMD), which calculates the minimum cost to transform one distribution into another. In this context, it measures how much "work" is needed to move the words in the candidate translation to match the reference translation.
The steps to calculate the MoverScore are as follows:
- Generate embeddings: Use a pre-trained model (like BERT) to generate word embeddings for both the candidate and reference texts.
- Compute pairwise distances: Calculate the cosine distances between all pairs of word embeddings from the candidate and reference texts.
- Solve the optimal transport problem: Use the EMD to find the minimal cost of transforming the candidate word distribution to the reference word distribution.
MoverScore provides a robust evaluation by leveraging contextual embeddings and optimal transport theory.
Model-Based Evaluation
LLM-as-a-Judge
While automatic evaluation metrics like ROUGE, BLUE, etc. are pretty good in evaluating the model performance, they still require a human involved in the loop. The ground truth must always be created by human experts and the final result of the metrics also needs to be verified. This is where model-based metrics come to ease your efforts. LLM-as-a-Judge provides an end-to-end solution to evaluating the LLM models, especially the RAG pipelines. It involves the following stages to evaluate the model:
- Generate a synthetic dataset for evaluation using a text corpus with the help of an LLM model.
- Use another LLM (called a critic agent) to filter out the most relevant data points in the data.
- Ask LLM to compare the model-generated results and ground truths and provide a score between 1 to 5 based on the relevancy and groundness. Also, ask LLM to provide a rationale about why it has given the chosen score.
This method involves employing an LLM to provide an impartial, consistent, and comprehensive evaluation of another LLM's outputs across various tasks and metrics.
G-Eval
It is another model-based evaluation metric that is widely used for text summarization tasks. This approach leverages the capabilities of LLMs to provide detailed and context-aware evaluations, making it a powerful tool for comprehensive model assessment. The process of evaluation using G-Eval involves the following steps:
- Task Generation: Develop a set of prompts or tasks that cover a wide range of use cases, scenarios, and difficulty levels. These tasks should be representative of real-world applications of the LLM.
- Output Generation: Use the LLM to generate responses to the tasks. Ensure the prompts are varied to test the model’s versatility and adaptability.
- Automated Scoring: Apply automated metrics such as BLEU, ROUGE, METEOR, and BERTScore to the generated outputs. These metrics provide quantitative measures of the output quality.
- Human-like Evaluation: Use a judging LLM or human evaluators to provide qualitative assessments. This step involves more subjective criteria such as coherence, fluency, and relevance to the context.
- Feedback Generation: Compile the results from both automated and human-like evaluations into a comprehensive report. This report should highlight the model’s strengths and weaknesses and provide actionable feedback for improvement.
G-Eval represents a sophisticated and comprehensive approach to LLM evaluation. By leveraging the strengths of both automated metrics and human-like judgment
Bias and Fairness
Bias Scores
While the metrics discussed above focus on the model's performance, this metric focuses on another problem associated with LLMs: bias. Bias score is a metric used to evaluate and quantify biases present in language models. These biases can manifest as preferential treatment of certain groups or perspectives, reinforcing stereotypes, or other forms of unfair representation. Evaluating bias is crucial for ensuring fairness and ethical use of language models in various applications.
Some of the highly observed biases in the training data on LLMs are:
- Gender Bias: Stereotypical associations with gender.
- Racial Bias: Preferential treatment based on race.
- Age Bias: Favoring or disfavoring individuals based on age.
- Socioeconomic Bias: Preferences related to socioeconomic status.
Bias scores are often calculated by comparing the probabilities or embeddings of biased terms against neutral or unbiased terms. The calculation can involve several methods, including word embedding association tests (WEAT), which measure the association between target words and attribute words.
A simple formula to calculate the bias score is as follows:

Consider an example of evaluating gender bias in language models using word embeddings. We can use the WEAT (Word Embedding Association Test) method, which compares gender-specific and attribute terms associations.
Step-1: Select the target and attribute words
- Target words (gendered terms): ["man", "woman"]
- Attribute words (career and family):
- Career: ["executive", "management", "professional", "corporation", "salary"]
- Family: ["home", "parents", "children", "family", "relatives"]
Step-2: Compute embeddings
Use a pre-trained model to generate embeddings for the target and attribute words.
Step-3: Calculate associations
Compute the cosine similarity between target and attribute words. For simplicity, let's assume the following cosine similarities (not actual values):
- Man-Career: [0.85, 0.80, 0.82, 0.78, 0.79]
- Man-Family: [0.40, 0.42, 0.38, 0.35, 0.37]
- Woman-Career: [0.60, 0.62, 0.65, 0.58, 0.59]
- Woman-Family: [0.75, 0.77, 0.72, 0.78, 0.76]
Step-4: Compute bias measure
Calculate the average cosine similarity for each pair and compare the differences. Bias measure can be defined as the difference in association strengths.
Bias = (⅕ ∑Cosine(Man-Career) − Cosine(Man-Family))−(⅕ ∑Cosine(Woman-Career)−Cosine(Woman-Family))

Bias = (⅕ (0.85+0.80+0.82+0.78+0.79) − ⅕ (0.40+0.42+0.38+0.35+0.37)) − (⅕ (0.60+0.62+0.65+0.58+0.59) − ⅕ (0.75+0.77+0.72+0.78+0.76))

Bias = (0.81 − 0.38) − (0.61 − 0.76) = 0.43 − ( −0.15) = 0.43 + 0.15 = 0.58
As you can see, the bias score is 0.58, indicating significant gender bias in the model's associations between career and family terms.
Bias score helps in quantifying and addressing bias in language models, promoting fairness and ethical AI development.
Fairness Metrics
Fairness metrics are used to evaluate how equitably a language model treats different groups or individuals. While the bias score quantifies bias that the model may have learned during the training, the fairness score ensures that model decisions are fair across different groups. These metrics are essential for identifying and mitigating biases in language models, ensuring that they do not reinforce stereotypes or unfairly discriminate against certain groups. There are different types of fairness metrics:
- Demographic Parity: Measures whether different demographic groups receive the same outcomes.
- Equal Opportunity: Evaluates if a model provides equal true positive rates for different groups.
- Equalized Odds: Ensures that both true positive rates and false positive rates are equal across groups.
- Calibration: Checks if predicted probabilities are accurate across different groups.
- Fairness through Unawareness: Ensures that the model's decisions do not explicitly use protected attributes (like race or gender).
- Individual Fairness: Ensures that similar individuals receive similar outcomes.
Imagine you have an LLM that generates responses to customer inquiries. You want to ensure that the model provides equally helpful responses to inquiries from users of different demographics, for example, gender.
In order to calculate the fairness score, you need the following details:
Total Users: Count the total number of inquiries from each demographic group.
Helpful Responses: Count how many of these inquiries received a "helpful" response.
For example:
The demographic parity difference can be calculated as follows:
Fairness Score = 1 - (Max Helpful Response Rate - Min Helpful Response Rate) / Max Helpful Response Rate
Fairness Score = 1 − ( 80 − 60 ) / 80 = 1 − ( 20 / 80 ) = 1 − 0.25 = 0.75This score of 75% indicates some disparity, suggesting that the model's helpfulness is less equitable across different demographics.
These metrics provide a comprehensive view of fairness, from demographic parity to individual fairness, helping to build more ethical and unbiased AI systems.
Efficiency Metrics
Focusing on model performance, bias, and fairness is not the only important thing. What if you can come up with a highly accurate LLM model but it takes 10 minutes to process a single user request? There is a higher chance that users might prefer not to use it. Also, the deployment of these LLMs entirely depends on the infrastructure i.e. CPU, GPU, Memory, etc. For example. you can not run a model with 7 Billion parameters on 8GB GPU memory. To get a gist of this kind of detail, efficiency metrics are used.
Latency
Latency is the time delay from the moment an input is provided to a language model to the moment it generates the output. It is a crucial metric for evaluating the performance of LLMs, especially in real-time applications like chatbots, virtual assistants, and other interactive systems where quick responses are essential. Latency is typically measured in milliseconds (ms) and can be broken down into several components:
- Inference Time: The time taken by the model to process the input and generate the output.
- Network Latency: The time taken for the data to travel between the user and the server hosting the model.
- Pre-processing and Post-processing Time: The time spent on preparing the input and formatting the output.
Lower latency enhances user satisfaction by providing quick responses. It also impacts the ability to handle multiple concurrent requests efficiently. Monitoring and optimizing each component of the latency can help improve the overall performance and user experience of the LLM-based application.
Resource Utilization
Resource utilization measures the amount and efficiency of computational resources consumed by a language model (LLM) during its operation. This includes CPU and GPU usage, memory consumption, and energy consumption. Understanding resource utilization is crucial for optimizing the performance and cost-effectiveness of deploying LLMs, especially in environments with limited resources or when scaling to handle many users. It can be measured using various metrics:
- CPU/GPU Utilization: The percentage of CPU or GPU capacity used during model inference.
- Memory Usage: The amount of RAM or VRAM used by the model.
- Energy Consumption: The amount of electrical energy consumed during model operation.
- Disk I/O: The read and write operations to storage during model inference.
Evaluating resource utilization provides critical insights into the performance and efficiency of LLMs, guiding improvements and ensuring optimal deployment in various applications. It also helps in cost optimization, scalability, and performance optimization.
These are some of the highly utilized evaluation metrics used in the LLM space. As it is an active area of research, you might see some other important metrics coming frequently.
One important thing to note is that almost all of these metrics (that measure the performance of the model) require a ground truth text to validate the results that they produce. This ground truth text is majorly crafted by human experts or it is generated with the help of another LLM model and is verified by the human expert. As you can never fully trust the results of an LLM especially when you are training/tuning one. At the initial stage, it is better to verify the results manually. No matter the approach, you will always need a human expert to verify the performance of the model.
Some Famous Automated Platforms for LLM Evaluation
If you want to automate the process of LLM evaluation, you can use the evaluation capability from some of the famous platforms that include:
- Shaip.com: It provides access to all of these metrics mentioned above along with custom and open-source evaluators. It also provides options for online (evaluation conducted in real-world production scenarios) and offline evaluation (LLM evaluation against specific datasets). Finally, it assists you in verifying the metrics results with the help of subject matter experts. This way you can automate the entire evaluation process.
- DeepChecks: This is one of the most famous platforms for LLM evaluation. Which provides an automated solution to address various issues like Hallucinations, incorrect answers, bias, deviation from policy, harmful content, and more. It also provides implementation and support for various metrics and the best part is, it can easily be used with Python language.
Benchmarks for Language Model Evaluation
While metrics give you a fair idea about how your model is performing, you still need some data samples on which you will test your models. Benchmarks for language model evaluation are standardized datasets and tasks used to assess the performance, accuracy, and capabilities of language models. These benchmarks provide a consistent framework for comparing different models and tracking progress over time. Usually when an LLM model is developed, it is tested on these benchmarks to understand how it compares with the existing models tested on the same benchmark.
There are different kinds of benchmarks available that cover a wide range of linguistic abilities, from sentiment analysis and text classification to reading comprehension. By using these established benchmarks, researchers and developers can rigorously test their models, identify strengths and weaknesses, and drive advancements in the field of natural language processing.
Now, let’s have a look at different benchmarks for language model evaluation. These benchmarks are usually categorized into two categories: generic and domain-specific, let’s explore both of them.
General Benchmarks
GLUE (General Language Understanding Evaluation)
GLUE is a popular benchmark designed to evaluate the performance of language models on a wide variety of natural language understanding tasks. It provides a baseline to evaluate and compare the performance of different LLM models. GLUE is comprised of 9 different tasks that cover various aspects of language understanding:
- CoLA (Corpus of Linguistic Acceptability): Tests the model's ability to determine whether a sentence is grammatically acceptable.
- SST-2 (Stanford Sentiment Treebank): A binary sentiment analysis task where models must classify sentences as positive or negative.
- MRPC (Microsoft Research Paraphrase Corpus): Measures the ability to determine if two sentences are semantically equivalent.
- STS-B (Semantic Textual Similarity Benchmark): Evaluates how well the model can determine the similarity between two sentences on a continuous scale.
- QQP (Quora Question Pairs): Involves identifying if two questions posted on Quora are duplicates.
- MNLI (Multi-Genre Natural Language Inference): A large-scale NLI dataset with examples from multiple genres. Models must determine if one sentence entails, contradicts, or is neutral with respect to another.
- QNLI (Question Natural Language Inference): A converted version of the SQuAD dataset to an NLI task, where models must determine if a given sentence contains the answer to a question.
- RTE (Recognizing Textual Entailment): A collection of smaller NLI datasets, testing if one sentence entails another.
- WNLI (Winograd Schema Challenge): Tests common sense reasoning by determining the referent of an ambiguous pronoun in a sentence.
By providing these diverse sets of tasks, it challenges models to demonstrate broad language understanding rather than excelling in just one area.
SuperGLUE
Developed as a successor to the GLUE benchmark, SuperGLUE addresses some of the limitations of GLUE and introduces more difficult tasks to push the boundaries of what language models can achieve. By providing more difficult tasks than GLUE, it enables models to exhibit deeper comprehension, reasoning, and inference abilities. The introduction of SuperGLUE has further driven the development of more sophisticated models like T5 (Text-To-Text Transfer Transformer), GPT-3, and DeBERTa, which have shown remarkable performance on these benchmarks.
SuperGLUE comprises eight diverse tasks that cover a wide range of language understanding abilities:
- BoolQ (Boolean Questions): A question-answering task where the model must determine whether a given passage answers a yes/no question.
- CB (Commitment Bank): A natural language inference task focusing on whether a hypothesis is true, false, or undetermined given a premise.
- COPA (Choice of Plausible Alternatives): A task requiring the model to choose the more plausible alternative given a premise and two alternatives.
- MultiRC (Multi-Sentence Reading Comprehension): A reading comprehension task where the model must answer questions about a passage, with each question having multiple correct answers.
- ReCoRD (Reading Comprehension with Commonsense Reasoning Dataset): A reading comprehension task requiring commonsense reasoning, where the model must identify entities in a passage that answer a given question.
- RTE (Recognizing Textual Entailment): Similar to the GLUE version, this task involves determining if one sentence entails another.
- WiC (Word-in-Context): A task to determine if a word is used with the same meaning in two different sentences.
- WSC (Winograd Schema Challenge): A challenging commonsense reasoning task involving resolving pronoun references.
By presenting more challenging tasks, SuperGLUE helps ensure that language models continue to improve in their ability to understand and reason about human language.
Domain-specific Benchmarks
SQuAD (Stanford Question Answering Dataset)
SQuAD is a popular benchmark for evaluating the performance of LLMs for reading comprehension tasks. It is composed of queries that crowdworkers post on a series of Wikipedia pages. Each query has an answer that is either a section of text, or span, from the related reading passage, or it may not have an answer at all. Since its launch, SQuAD has become a standard dataset for training and testing models designed to understand and answer questions based on given passages of text.
There are two main versions of SQuAD, each has its own unique features:
- SQuAD v1.1: This version contains over 100,000 questions posed by crowdworkers on a set of Wikipedia articles. The answers to these questions are spans of text extracted directly from the corresponding passages.
- SQuAD v2.0: An extension of SQuAD v1.1, this version introduces over 50,000 unanswerable questions crafted to resemble answerable ones. This addition tests a model's ability not only to answer questions correctly but also to determine when a question has no answer in the given passage.
SQuAD’s introduction has led to significant progress in the development of more sophisticated and accurate language models. Models like BERT, RoBERTa, and ALBERT have demonstrated exceptional performance on SQuAD, pushing the boundaries of what is possible in reading comprehension tasks.
CoQA (Conversational Question Answering)
CoQA is a benchmark designed to evaluate the performance of language models on conversational question-answering tasks. The entire goal of CoQA is to measure the ability of LLMs to understand a piece of text and answer a series of interconnected questions that appear in a conversation. This dataset aims to simulate real-world conversational interactions, where the context and the sequence of questions play a critical role in determining accurate answers.
CoQA consists of over 127,000 questions with answers, sourced from 8,000 conversations. These conversations are based on text passages from seven diverse domains, including literature, middle and high school exams, news articles, Wikipedia, and more. The key features of CoQA include:
- Contextual Passages: Each conversation is based on a text passage that provides the necessary context for answering the questions.
- Conversational Questions and Answers: The questions and answers are organized in a conversational format, where each question depends on the previous ones.
- Free-form Answers: Unlike SQuAD, where answers are exact spans from the passage, CoQA allows free-form answers that can be more natural and varied.
- Rationale: For each answer, CoQA provides a rationale that is a span of text from the passage supporting the answer. This helps in understanding the reasoning behind the answers.
The introduction of CoQA allowed the development of more advanced conversational AI models that can better understand and participate in human-like dialogues.
XNLI (Cross-lingual Natural Language Inference)
XNLI is specially designed to evaluate the performance of language models on natural language inference (NLI) tasks across multiple languages. Originally introduced by Facebook, XNLI extends the capabilities of NLI models by providing annotated data in 15 different languages, enabling the assessment of models in multilingual and cross-lingual contexts. The primary goal of XNLI is to test how well models generalize across languages and handle the complexities of cross-lingual understanding.
XNLI is built upon the MultiNLI dataset and includes the following components:
- Premises and Hypotheses: Sentences or short texts that form the basis for the inference task. The premise is a statement, and the hypothesis is another statement that must be evaluated in relation to the premise.
- Language Coverage: XNLI includes data in 15 languages: Arabic, Bulgarian, Chinese, French, German, Greek, Hindi, Russian, Spanish, Swahili, Thai, Turkish, Urdu, Vietnamese, and English.
- Annotation: Each pair of premise and hypothesis is annotated with one of three labels: entailment (the hypothesis logically follows from the premise), contradiction (the hypothesis contradicts the premise), or neutral (the hypothesis is neither supported nor contradicted by the premise).
XNLI uses accuracy as the primary metric for evaluating model performance. Accuracy measures the percentage of correctly predicted labels (entailment, contradiction, neutral) compared to the ground truth labels.
Apart from these popular benchmarks, some other benchmarks that have gotten some attention in recent times are BIG-bench (Beyond the Imitation Game) and LAMBADA (Linguistic Analysis Based on Text Analysis).
Best Practices in Evaluating Language Models
For evaluating the LLM models, precision in methodology is the utmost priority. To gain more reliable and ethical results from your LLM models you need a set of best practices that can also tell you about the strengths and weaknesses of your LLM model. These strategies, when combined with the human experience can get the best-suited LLMs for your use case.
Comprehensive Evaluation
You must not rely on a single metric to evaluate an LLM model. It is critical to assess the fluency, relevance, and context understanding of an LLM model which is rather not possible with a monolithic evaluation metric. Use multiple metrics, such as accuracy, F1 score, BLEU, ROUGE, and perplexity, to capture different aspects of performance. For example, a combination of precision and recall gets you the information about how accurate the generated summary is and how much of the reference text is covered in the generated summary.
Try to evaluate the model on a variety of tasks, including text generation, question answering, sentiment analysis, and summarization. Finally, utilize established benchmarks like GLUE, SuperGLUE, SQuAD, and XNLI to provide standardized assessments. Finally, you must also give weightage to the bias and fairness evaluation so that your model does not give priority to any specific group.
There are often production-based scenarios where you need to compare two models (eg. A and B) to choose the best one for deployment. If one metric favors model A and another metric favors model B, then you might have some confusion selecting the best one. In this case, the decision should be made based on the metrics that align more closely with the business objectives of other critical aspects of your application.
Contextual and Scenario-based Testing
You must always test the model on datasets that reflect real-world use cases, including domain-specific data. This will help you identify how well the LLM understands and responds to the use queries in various input conditions. Always, try to create test scenarios similar to actual usage conditions. For example, an LLM designed for customer service interaction should be evaluated on its ability to address different kinds of user queries and interact naturally with the customers.
While testing, identify and test edge cases and rare events to ensure the model performs reliably under strange conditions. By performing this scenario-based testing, you can identify the weaknesses of LLMs such as misinterpretation, and make necessary adjustments to enhance the LLM performance.
Continuous Monitoring and Updating
Continuously monitor the model’s performance using up-to-date data to detect any degradation or emerging issues. By continuously tracking the key metrics like how many use queries are correctly answered etc. you can detect problems such as decreased accuracy, new types of errors, and changes in user requests associated with LLMs. This monitoring also helps in identifying biases and unintended behaviors that may arise when models deal with a diverse set of user groups.
Implement a feedback loop where user interactions and errors are analyzed to inform model updates and refinements. Also, regularly updating and retraining (if needed) LLM models with fresh data can address these mentioned issues, incorporate new knowledge, and adapt to changing contexts.
Transparency and Reproducibility
Try to maintain a comprehensive documentation detailing the evaluation procedures, datasets used, and metrics calculated. This document helps stakeholders to understand the model’s capabilities, limitations, and potential biases fostering trust and informed decision-making.
Reproducibility is another key aspect that allows other researchers and developers to produce and verify the same results with an LLM model. If the model can not produce the same results, its performance can not be trusted. This practice involves sharing code, datasets, and experimental setup used for the evaluation process. Overall, transparency and reproducibility enhance the credibility and reliability of the evaluation process.
Ethical Considerations
Implement metrics and tests to detect and mitigate biases in the model’s outputs, ensuring fair performance across different user groups. Also, ensure that the data used for evaluation and training respects user privacy and complies with relevant regulations.
Developers should also follow ethical guidelines and frameworks and they must be transparent about the model’s limitations, potential risks, and decision-making. This not only enhances the social acceptability of the LLMs but also increases the trust of stakeholders and users in the model results.
Conclusion
After reading this article, you now know about the importance of evaluation for large language models. You have been introduced to various evaluation metrics that can help evaluate LLMs on various tasks including text summarization, question answering, text generation, language translation, etc. Then you have see a list of benchmarks that are very important for evaluation. Finally, you have seen a list of best practices that can help you perform the evaluation effectively. The concept of LLM evaluation is still an active area of research, so you might see new metrics and benchmarks coming to the market frequently until the field is fully matured.


