Hot-Dry-Windy Index (HDWI)
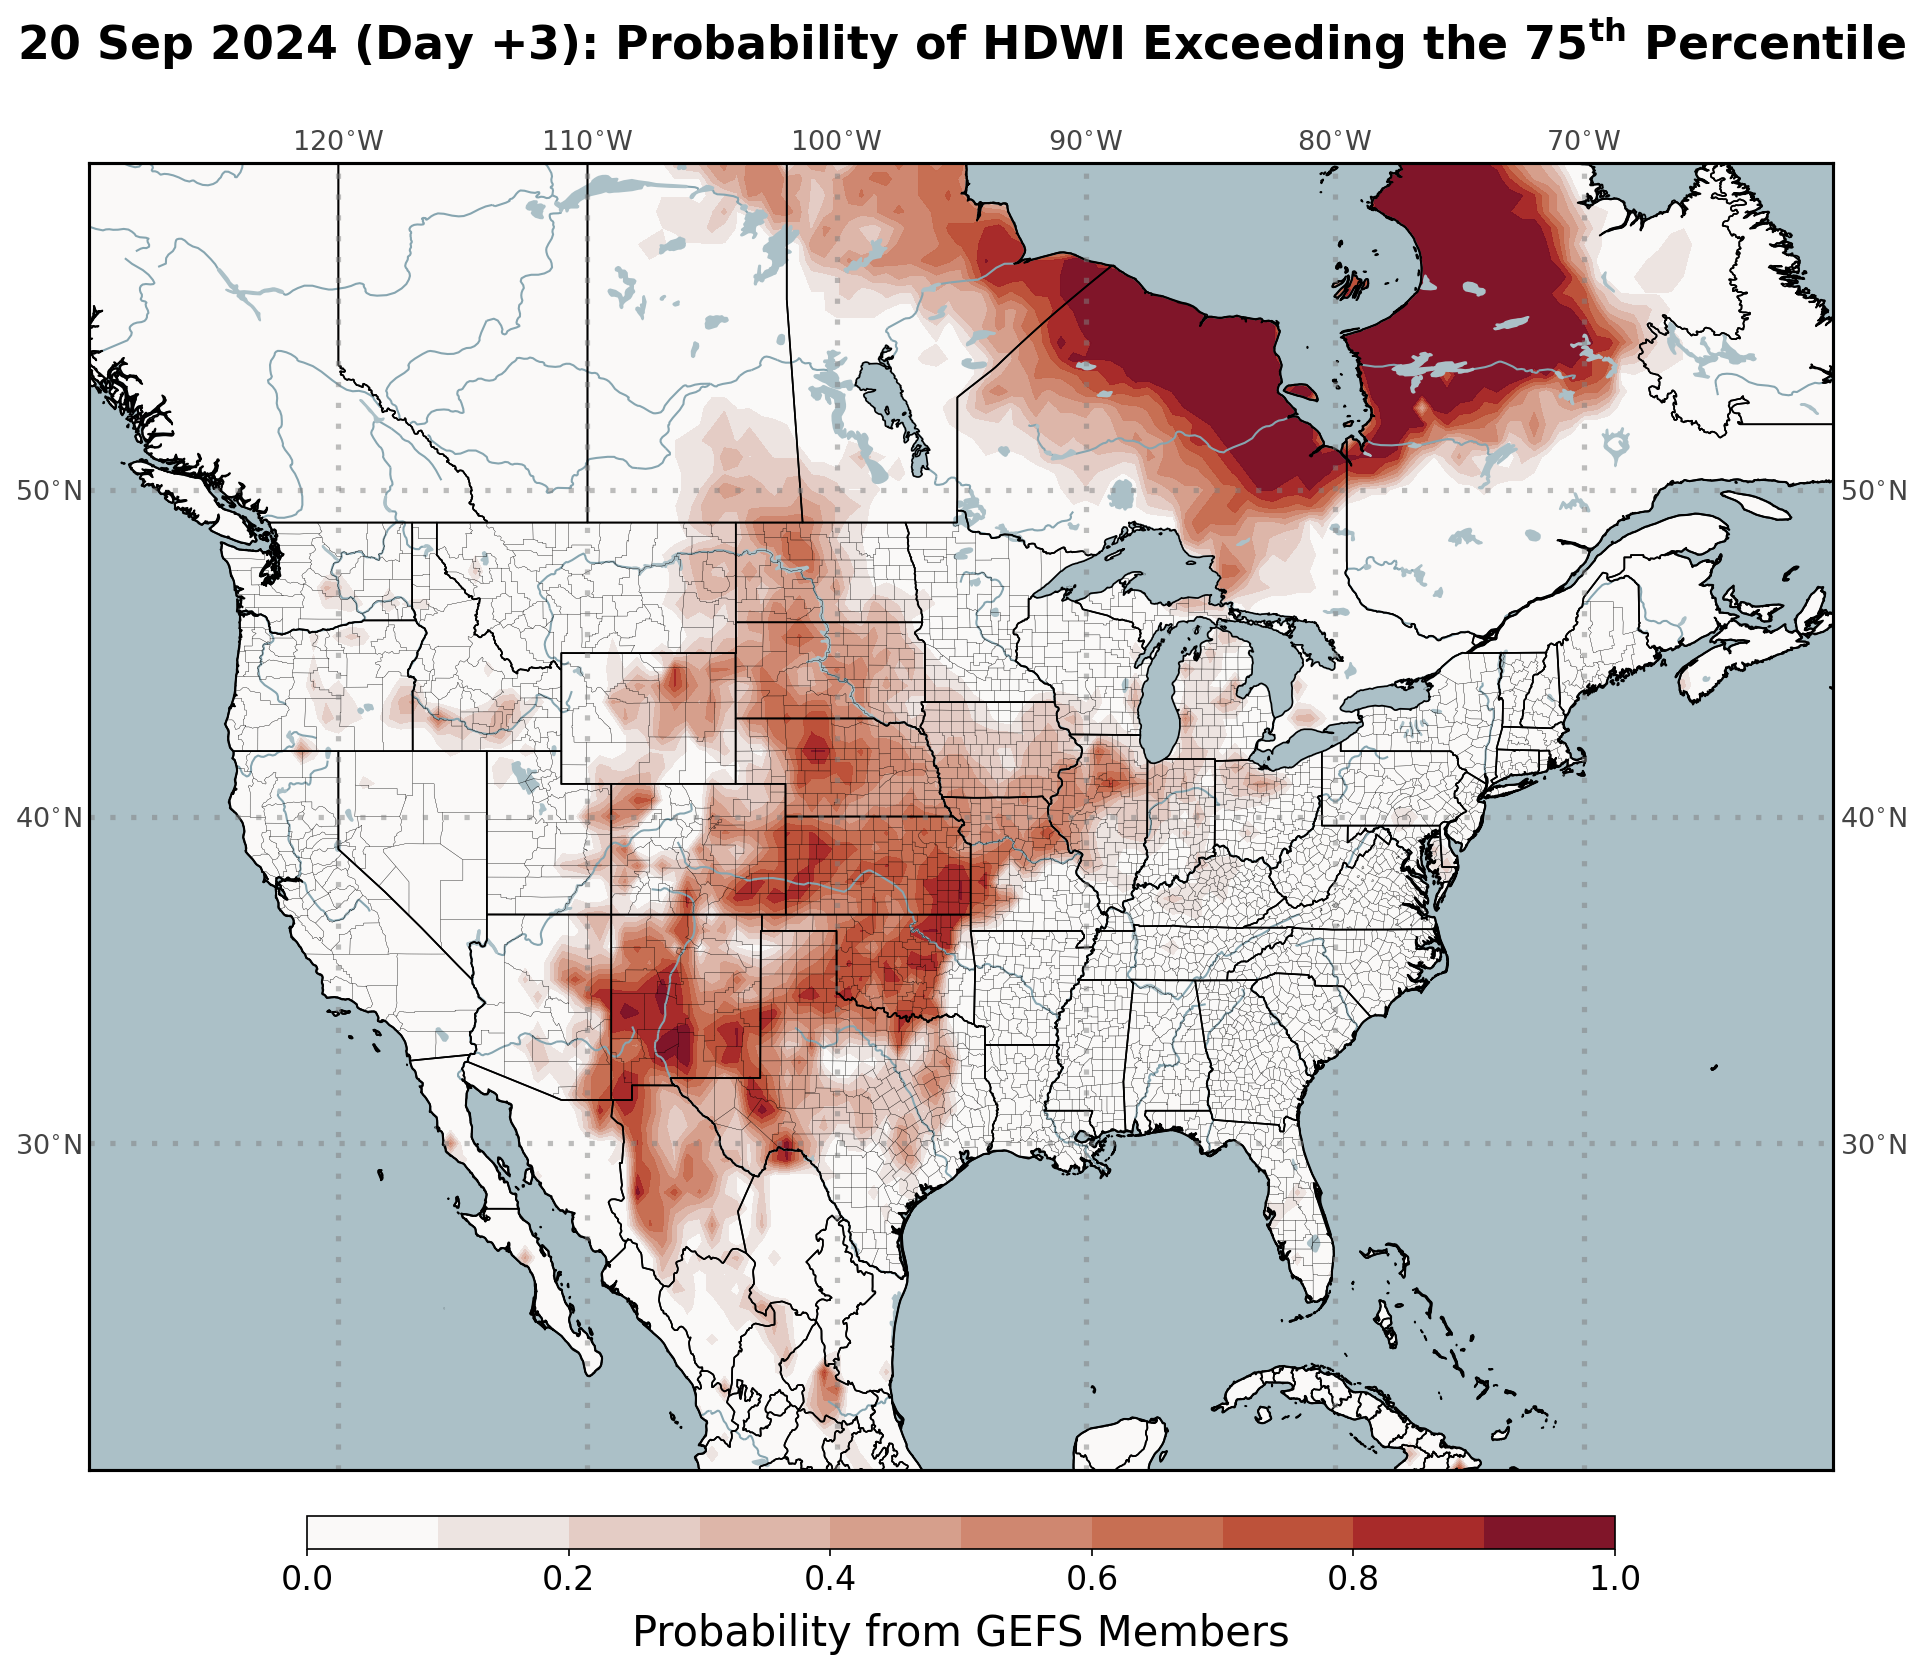
- The HDWI is computed by multiplying maximum sustained wind speed and vapor pressure deficit in the lowest ~50 mb of the atmosphere. Heat, moisture, and wind are thus incorporated (fuels are not). Model input for HDWI computation comes from the GFS Ensemble system (GEFS), which is a suite of relatively coarse resolution global ensembles. Therefore, it can provide an effective, simple view to highlight days which are more likely to have adverse atmospheric conditions surrounding wildland fires for a general geographic area. It is not ideal for assessing conditions at the most local level given the native GEFS resolution. For more plots and information on the HDWI, visit this page
| Probability of HDWI Exceeding... |
Day 0 |
Day 1 |
Day 2 |
Day 3 |
Day 4 |
Day 5 |
Day 6 |
| 75th Percentile |
 |
 |
 |
 |
 |
 |
 |
| 90th Percentile |
 |
 |
 |
 |
 |
 |
 |
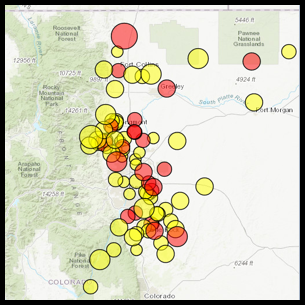
US Drought Monitor

Vapor Pressure Deficit (VPD)
-
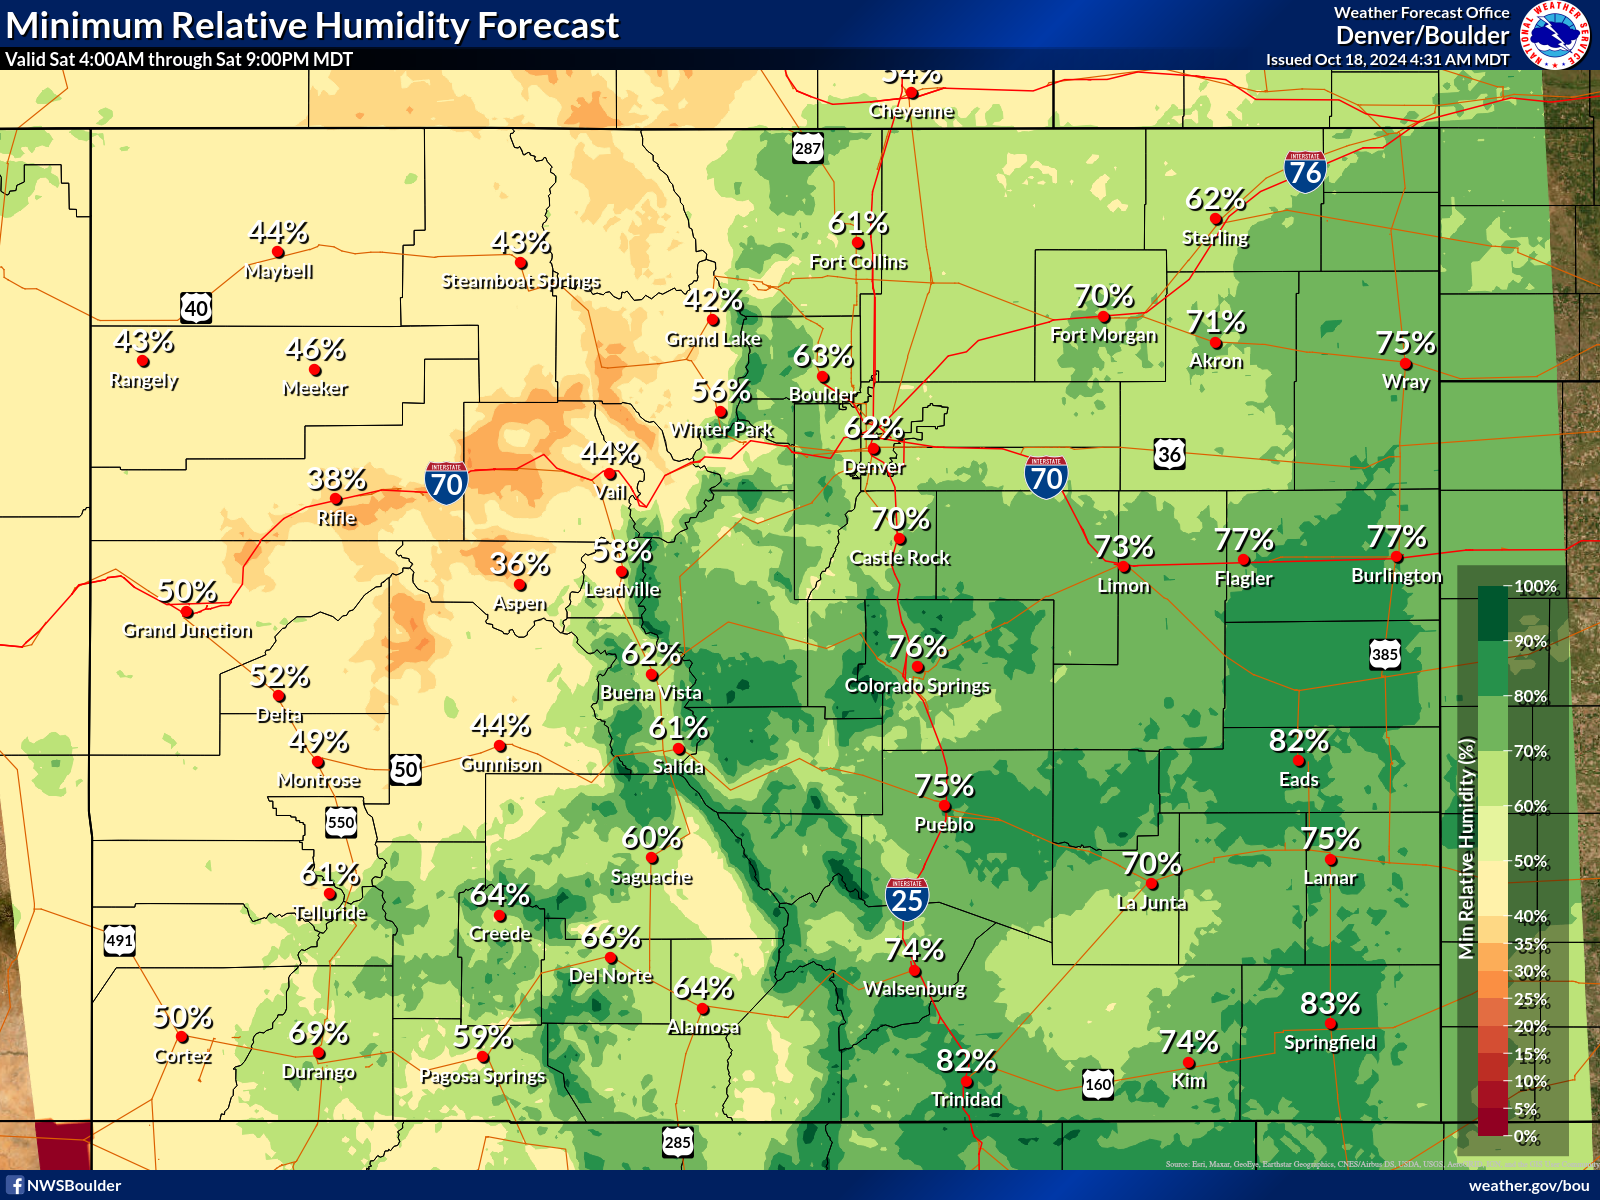
Vapor Pressure Deficit (VPD) is an effective measure to describe the ability of the atmosphere to extract moisture from vegetation. While Relative Humidity (RH) is most frequently referenced in relation to wildland fire, in part given its more intuitive nature, RH can also mask critical information, as it does not directly take the effects of temperature into consideration (a factor that can aggravate moisture loss from vegetation). For more information on VPD, see this article by Seager et al.
CLICK HERE for a map of 7-Day VPD Percentiles.
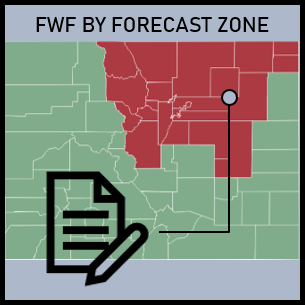
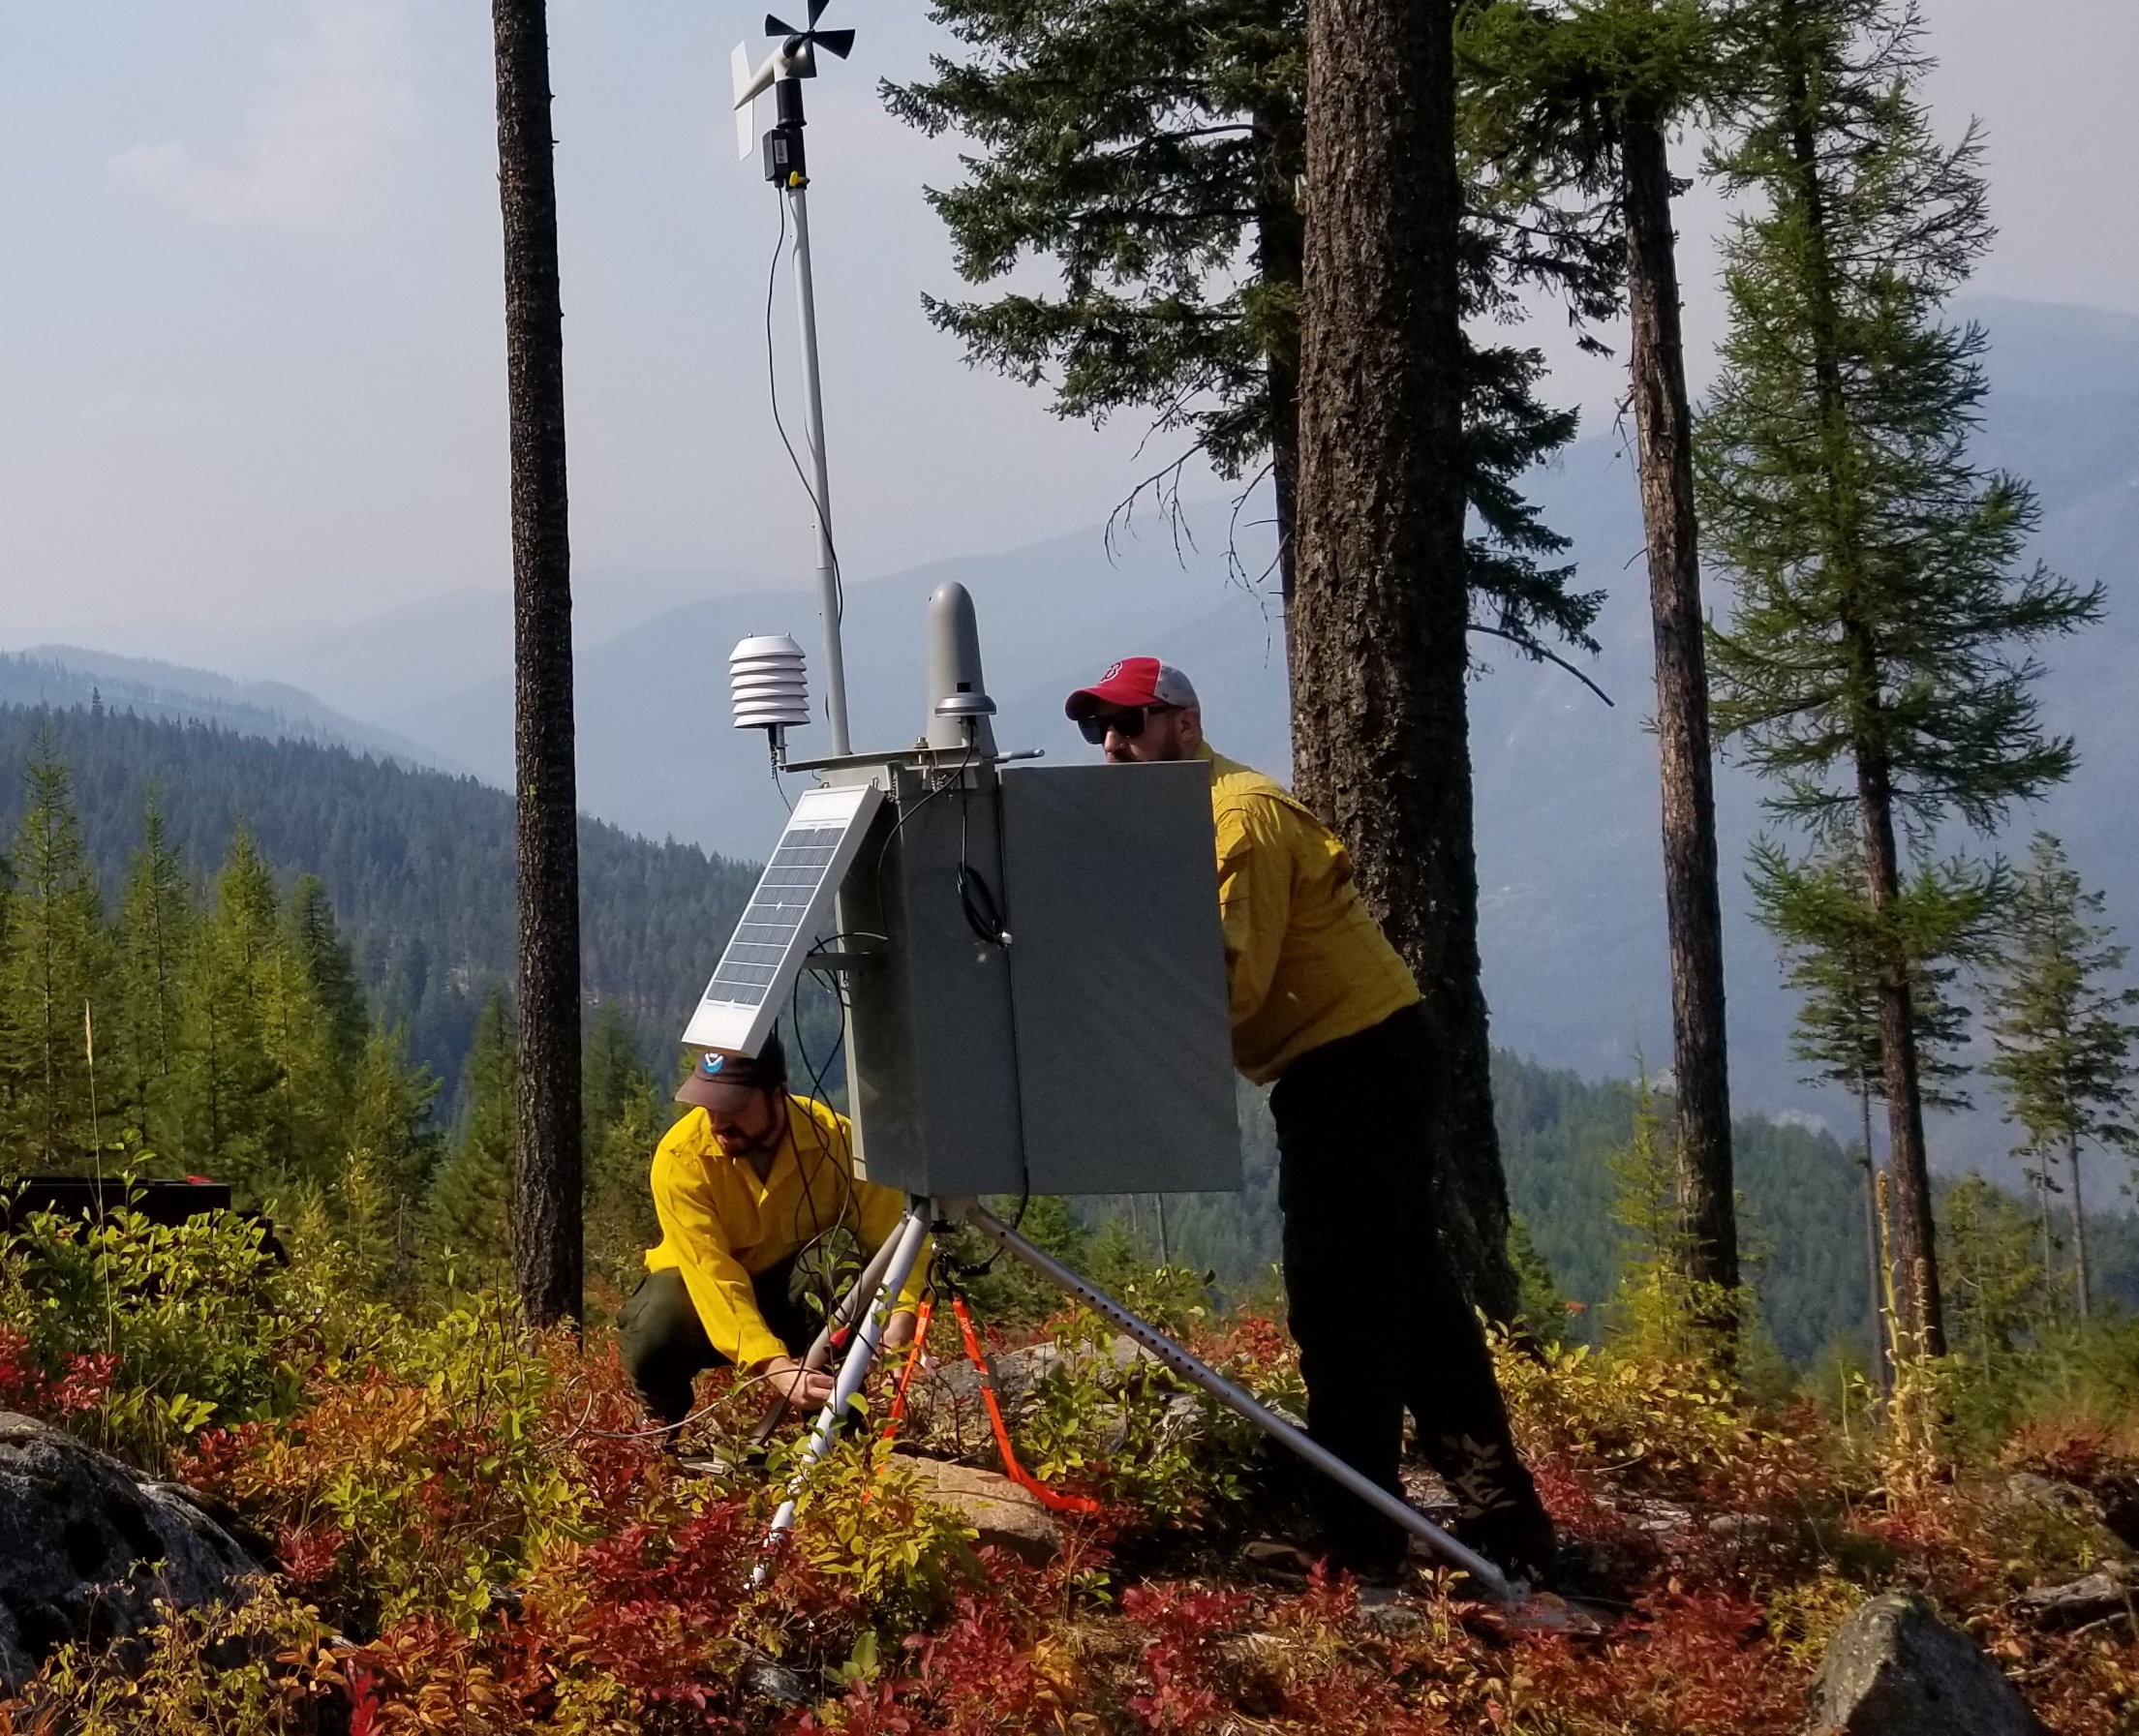
Severe Fire Danger Mapping System (WFAS)
This is a static image. Click to view current map.
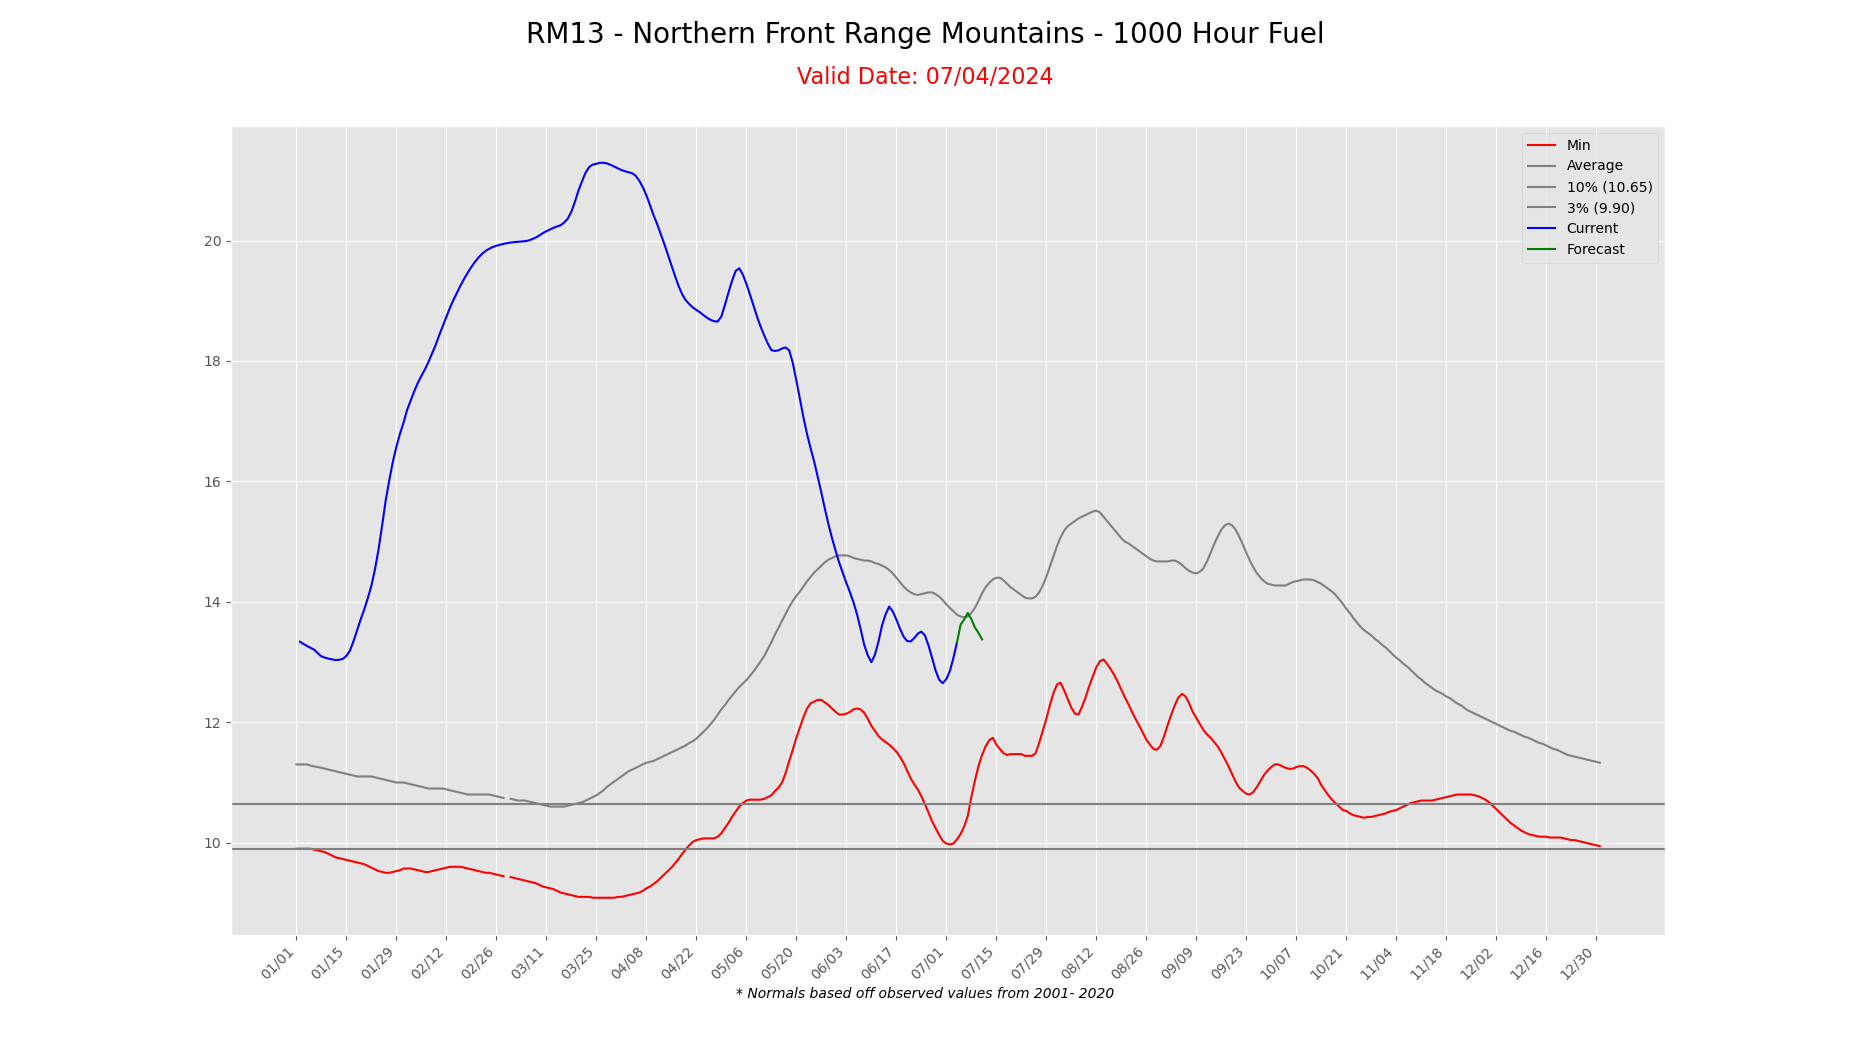
Observed Dead Fuel Moisture (10-hr/100-hr/1000-hr)
| 10 Hour |
100 Hour |
1,000 Hour |
 |
 |
 |
ERC, BI, 100-hr, & 1,000-hr Graphs by PSA
- To view a clickable map of all PSAs for the Rocky Mountain Region (not just NE Colorado), and corresponding ERC/BI/100-hr/1,000-hr graphs, click here.
Map of RMACC Predictive Service Areas (PSAs):

Palmer Drought Index
- The Palmer Drought Index depicts prolonged (months, years) abnormal dryness or wetness. It responds slowly, changing little from week to week, and reflects long-term moisture runoff, recharge, and deep percolation as well as evapotranspiration. It is applicable in measuring disruptive effects of prolonged dryness or wetness on water-sensitive economies, designing disaster areas of drought or wetness, and reflecting the general long-term status of water supplies in aquifers, reservoirs and streams. It is not generally indicative of short-term (few weeks) status of drought or wetness such as frequently impacts crops and field operations.

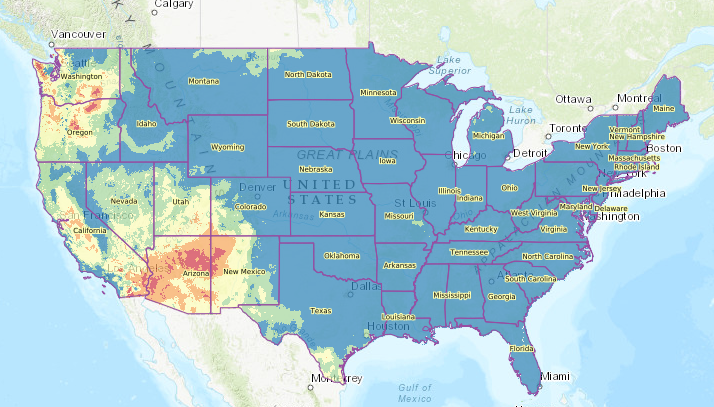
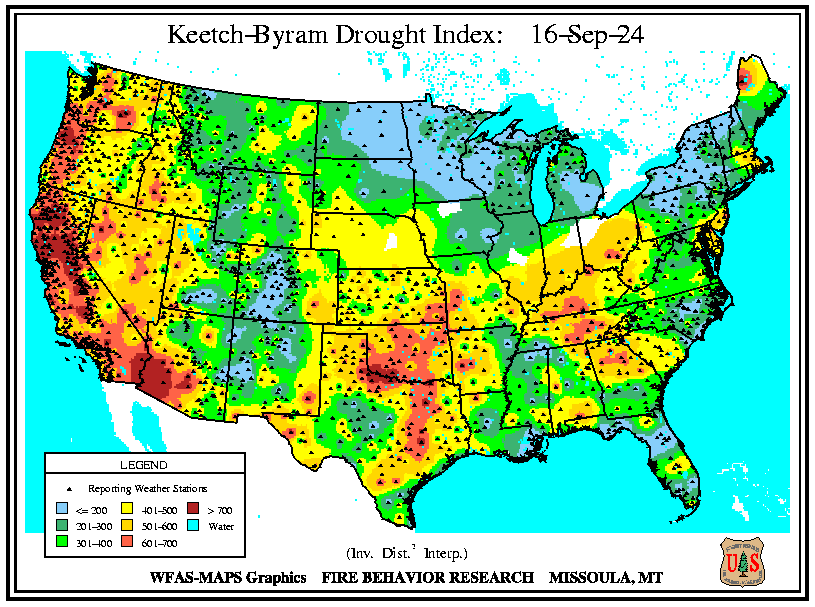
Keetch-Byram Drought Index
The KBDI attempts to measure the amount of precipitation necessary to return the soil to full field capacity. It is a closed system ranging from 0 to 800 units and represents a moisture regime from 0 to 8 inches of water through the soil layer. At 8 inches of water, the KBDI assumes saturation. Zero is the point of no moisture deficiency and 800 is the maximum drought that is possible. At any point along the scale, the index number indicates the amount of net rainfall that is required to reduce the index to zero, or saturation.
The inputs for KBDI are weather station latitude, mean annual precipitation, maximum dry bulb temperature, and the last 24 hours of rainfall. Reduction in drought occurs only when rainfall exceeds 0.20 inch (called net rainfall). The computational steps involve reducing the drought index by the net rain amount and increasing the drought index by a drought factor.
- KBDI = 0 - 200: Soil moisture and large class fuel moistures are high and do not contribute much to fire intensity. Typical of spring dormant season following winter precipitation.
- KBDI = 200 - 400: Typical of late spring, early growing season. Lower litter and duff layers are drying and beginning to contribute to fire intensity.
- KBDI = 400 - 600: Typical of late summer, early fall. Lower litter and duff layers actively contribute to fire intensity and will burn actively.
- KBDI = 600 - 800: Often associated with more severe drought with increased wildfire occurrence. Intense, deep burning fires with significant downwind spotting can be expected. Live fuels can also be expected to burn actively at these levels.
Additional Fuels and Fire Danger Information