[go: up one dir, main page]

Next Issue
Volume 6, September
Previous Issue
Volume 6, March


Big Data Cogn. Comput., Volume 6, Issue 2 (June 2022) – 36 articles

Cover Story (view full-size image): 
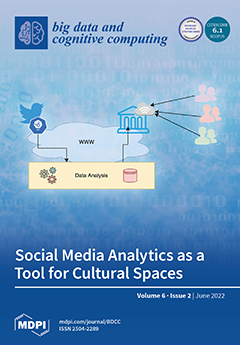
People nowadays tend to use the Internet, especially social media, more frequently and for a wider variety of purposes. Even though cultural spaces are using the Internet, participating, growing their audience, or locating an appropriate group of people to share their information with remain tedious tasks. The investment is mainly financial—usually large—and directed to advertisements. Still, there is space for research and investment in analytics, which can provide evidence that considers the spreading of information or finding groups of people interested in specific trending topics and influencers. The Internet demands participation and not just presence. In this work, we describe a procedure through which cultural institutions can benefit from the data analysis of Twitter’s trending topics. View this paper
  • Issues are regarded as officially published after their release is announced to the table of contents alert mailing list.
  • You may sign up for e-mail alerts to receive table of contents of newly released issues.
  • PDF is the official format for papers published in both, html and pdf forms. To view the papers in pdf format, click on the "PDF Full-text" link, and use the free Adobe Reader to open them.
Order results
Result details
Select all
Export citation of selected articles as:
19 pages, 626 KiB  
Article
Áika: A Distributed Edge System for AI Inference
by Joakim Aalstad Alslie, Aril Bernhard Ovesen, Tor-Arne Schmidt Nordmo, Håvard Dagenborg Johansen, Pål Halvorsen, Michael Alexander Riegler and Dag Johansen
Big Data Cogn. Comput. 2022, 6(2), 68; https://doi.org/10.3390/bdcc6020068 - 17 Jun 2022
Cited by 3 | Viewed by 3273
Abstract
Video monitoring and surveillance of commercial fisheries in world oceans has been proposed by the governing bodies of several nations as a response to crimes such as overfishing. Traditional video monitoring systems may not be suitable due to limitations in the offshore fishing [...] Read more.
Video monitoring and surveillance of commercial fisheries in world oceans has been proposed by the governing bodies of several nations as a response to crimes such as overfishing. Traditional video monitoring systems may not be suitable due to limitations in the offshore fishing environment, including low bandwidth, unstable satellite network connections and issues of preserving the privacy of crew members. In this paper, we present Áika, a robust system for executing distributed Artificial Intelligence (AI) applications on the edge. Áika provides engineers and researchers with several building blocks in the form of Agents, which enable the expression of computation pipelines and distributed applications with robustness and privacy guarantees. Agents are continuously monitored by dedicated monitoring nodes, and provide applications with a distributed checkpointing and replication scheme. Áika is designed for monitoring and surveillance in privacy-sensitive and unstable offshore environments, where flexible access policies at the storage level can provide privacy guarantees for data transfer and access. Full article
(This article belongs to the Special Issue Multimedia Systems for Multimedia Big Data)
Show Figures

Figure 1

Figure 1
<p>Áika’s architecture. Arrows represent client/server communication. Red arrows represent communication that may only occur during recovery. The figure does not include communication between agents. All nodes in the cluster are connected to a distributed file system that enables file sharing across the nodes. This is practical for recovery.</p>
Full article ">Figure 2
<p>The general process structure of Áika’s components. Each process is organized in a hierarchy of threads, where a main thread starts several child threads. Child threads are restarted by the main thread if they fail. Servers spawn multiple request handler threads to enable requests from multiple sources to be handled concurrently.</p>
Full article ">Figure 3
<p>The cluster controller is replicated and connected in a chain.</p>
Full article ">Figure 4
<p>Shows the general structure of the agents.</p>
Full article ">Figure 5
<p>Left worker agent. A worker agent that dequeues messages from a local queue before the analysis process, but enqueues the result remotely.</p>
Full article ">Figure 6
<p>Right worker agent. A worker agent that dequeues messages from a remote queue before the analysis process, but enqueues the result on a local queue.</p>
Full article ">Figure 7
<p>Double worker agent. A worker agent containing servers both before and after processing the item.</p>
Full article ">Figure 8
<p>Initial worker agents. This type of agent is used to initiate one or several pipelines. This is achieved by having the agent continuously retrieve data from a source and then forward it to either a local (see left figure), or a remote (see right figure) queue.</p>
Full article ">Figure 9
<p>Final worker agents. This type of agent is used to finalize one or several pipelines. The agent retrieves the end results from either a local or a remote queue, then handles the result in a customized manner.</p>
Full article ">Figure 10
<p>Queue agent and server-less worker agent. The agent to the left contains a single queue without any analysis. The agent to the right does not have any servers and receives items by making requests through clients on both sides.</p>
Full article ">Figure 11
<p>The obtained results from stress-testing the system with persistent queues over the course of 1200 s. The number of requests are measured and reset every 5 s. The plot shows the average number of requests processed per second over each 5 s interval. The moving average is computed with a window size <math display="inline"><semantics> <mrow> <mi>n</mi> <mo>=</mo> <mn>5</mn> </mrow> </semantics></math>.</p>
Full article ">Figure 12
<p>The results obtained by stress testing the system with in-memory queues over the course of 1200 s. Number of requests are measured and reset every 5 s. The plot shows the average number of requests processed per second over each 5 s interval. The moving average is computed with a window size <math display="inline"><semantics> <mrow> <mi>n</mi> <mo>=</mo> <mn>5</mn> </mrow> </semantics></math>.</p>
Full article ">Figure 13
<p>Results obtained when measuring the number of requests received where worker agents in the pipeline sleep for one second after processing an item. Measurements are carried out with persistent queues (top) and in-memory queues (bottom). The number of requests received is measured and reset every 5 s. The plot shows number of requests per second over each 5 s interval.</p>
Full article ">Figure 14
<p>Results obtained when measuring the number of requests received during stress-testing over the course 1200 s without (top) and with (bottom) the killer deployed. The number of requests received is measured and reset every 5 s. The plot shows the average number of requests per second over each 5 s interval.</p>
Full article ">Figure 15
<p>Results obtained from counting the words in datasets with sizes of 100 MB and 300 MB. Standard deviation is shown as an error bar, and the corresponding standard deviation value is displayed above each data point.</p>
Full article ">Figure 16
<p>Results obtained from performing feature extraction with pre-trained VGG-16, DenseNet-121, and ResNet-50 models, where the models are either distributed among three workers (Distributed Feature Extraction), or put in a sequence on a single worker (Sequential Feature Extraction). The images have been processed with a batch size of 500. The standard deviation is shown as an error bar and value at each data point.</p>
Full article ">
19 pages, 5202 KiB  
Article
Iris Liveness Detection Using Multiple Deep Convolution Networks
by Smita Khade, Shilpa Gite and Biswajeet Pradhan
Big Data Cogn. Comput. 2022, 6(2), 67; https://doi.org/10.3390/bdcc6020067 - 15 Jun 2022
Cited by 11 | Viewed by 3838
Abstract
In the recent decade, comprehensive research has been carried out in terms of promising biometrics modalities regarding humans’ physical features for person recognition. This work focuses on iris characteristics and traits for person identification and iris liveness detection. This study used five pre-trained [...] Read more.
In the recent decade, comprehensive research has been carried out in terms of promising biometrics modalities regarding humans’ physical features for person recognition. This work focuses on iris characteristics and traits for person identification and iris liveness detection. This study used five pre-trained networks, including VGG-16, Inceptionv3, Resnet50, Densenet121, and EfficientNetB7, to recognize iris liveness using transfer learning techniques. These models are compared using three state-of-the-art biometric databases: the LivDet-Iris 2015 dataset, IIITD contact dataset, and ND Iris3D 2020 dataset. Validation accuracy, loss, precision, recall, and f1-score, APCER (attack presentation classification error rate), NPCER (normal presentation classification error rate), and ACER (average classification error rate) were used to evaluate the performance of all pre-trained models. According to the observational data, these models have a considerable ability to transfer their experience to the field of iris recognition and to recognize the nanostructures within the iris region. Using the ND Iris 3D 2020 dataset, the EfficeintNetB7 model has achieved 99.97% identification accuracy. Experiments show that pre-trained models outperform other current iris biometrics variants. Full article
(This article belongs to the Special Issue Data, Structure, and Information in Artificial Intelligence)
Show Figures

Figure 1

Figure 1
<p>Graphical representation of the results of a study on the efficiency of transfer learning models for detecting iris liveness.</p>
Full article ">Figure 2
<p>The VGG-16 architecture, designed for iris liveness detection.</p>
Full article ">Figure 3
<p>The InceptionV3 architecture, designed for iris liveness detection.</p>
Full article ">Figure 4
<p>The ResNet 50 architecture, designed for iris liveness detection.</p>
Full article ">Figure 5
<p>The DenseNet121 architecture, designed for iris liveness detection.</p>
Full article ">Figure 6
<p>The EfficientNetB7 architecture, designed for iris liveness detection.</p>
Full article ">Figure 7
<p>Validation and training analyses over five epochs of the pre-trained VGG-16 model, using various datasets: (<b>a</b>) validation and training model accuracy analysis, using the Clarkson 2015 dataset; (<b>b</b>) validation and training model loss analysis, using the Clarkson 2015 dataset; (<b>c</b>) validation and training model accuracy analysis, using the IIITD dataset; (<b>d</b>) validation and training model loss analysis, using the IIITD dataset; (<b>e</b>) validation and training model accuracy analysis, using the ND_Iris3D_2020 dataset; and (<b>f</b>) validation and training model loss analysis, using the ND_Iris3D_2020 dataset.</p>
Full article ">Figure 8
<p>Validation and training analyses over five epochs of the pre-trained Inception model, using various datasets: (<b>a</b>) validation and training model accuracy analysis, using the Clarkson 2015 dataset; (<b>b</b>) validation and training model loss analysis, using the Clarkson 2015 dataset; (<b>c</b>) validation and training model accuracy analysis, using the IIITD dataset; (<b>d</b>) validation and training model loss analysis, using the IIITD dataset; (<b>e</b>) validation and training model accuracy analysis, using the ND_Iris3D_2020 dataset; and (<b>f</b>) validation and training model loss analysis, using the ND_Iris3D_2020 dataset.</p>
Full article ">Figure 9
<p>Validation and training analysis over five epochs of the pre-trained ResNet50 model using various datasets: (<b>a</b>) validation and training model accuracy analysis, using the Clarkson 2015 dataset; (<b>b</b>) validation and training model loss analysis, using the Clarkson 2015 dataset; (<b>c</b>) validation and training model accuracy analysis, using the IIITD dataset; (<b>d</b>) validation and training model loss analysis, using the IIITD dataset; (<b>e</b>) validation and training model accuracy analysis, using the ND_Iris3D_2020 dataset; and (<b>f</b>) validation and training model loss analysis, using the ND_Iris3D_2020 dataset.</p>
Full article ">Figure 10
<p>Validation and training analysis over five epochs of the pre-trained DenseNet121 model using various datasets: (<b>a</b>) validation and training model accuracy analysis, using the Clarkson 2015 dataset; (<b>b</b>) validation and training model loss analysis, using the Clarkson 2015 dataset; (<b>c</b>) validation and training model accuracy analysis, using the IIITD dataset; (<b>d</b>) validation and training model loss analysis, using the IIITD dataset; (<b>e</b>) validation and training model accuracy analysis, using the ND_Iris3D_2020 dataset; and (<b>f</b>) validation and training model loss analysis, using the ND_Iris3D_2020 dataset.</p>
Full article ">Figure 11
<p>Validation and training analysis over five epochs of the pre-trained EfficientNetB7 model using various datasets: (<b>a</b>) validation and training model accuracy analysis, using the Clarkson 2015 dataset; (<b>b</b>) validation and training model loss analysis, using the Clarkson 2015 dataset; (<b>c</b>) validation and training model accuracy analysis, using the IIITD dataset; (<b>d</b>) validation and training model loss analysis, using the IIITD dataset; (<b>e</b>) validation and training model accuracy analysis, using the ND_Iris3D_2020 dataset; and (<b>f</b>) validation and training model loss analysis, using the ND_Iris3D_2020 dataset.</p>
Full article ">
32 pages, 7749 KiB  
Article
CompositeView: A Network-Based Visualization Tool
by Stephen A. Allegri, Kevin McCoy and Cassie S. Mitchell
Big Data Cogn. Comput. 2022, 6(2), 66; https://doi.org/10.3390/bdcc6020066 - 14 Jun 2022
Cited by 4 | Viewed by 4870
Abstract
Large networks are quintessential to bioinformatics, knowledge graphs, social network analysis, and graph-based learning. CompositeView is a Python-based open-source application that improves interactive complex network visualization and extraction of actionable insight. CompositeView utilizes specifically formatted input data to calculate composite scores and display [...] Read more.
Large networks are quintessential to bioinformatics, knowledge graphs, social network analysis, and graph-based learning. CompositeView is a Python-based open-source application that improves interactive complex network visualization and extraction of actionable insight. CompositeView utilizes specifically formatted input data to calculate composite scores and display them using the Cytoscape component of Dash. Composite scores are defined representations of smaller sets of conceptually similar data that, when combined, generate a single score to reduce information overload. Visualized interactive results are user-refined via filtering elements such as node value and edge weight sliders and graph manipulation options (e.g., node color and layout spread). The primary difference between CompositeView and other network visualization tools is its ability to auto-calculate and auto-update composite scores as the user interactively filters or aggregates data. CompositeView was developed to visualize network relevance rankings, but it performs well with non-network data. Three disparate CompositeView use cases are shown: relevance rankings from SemNet 2.0, an open-source knowledge graph relationship ranking software for biomedical literature-based discovery; Human Development Index (HDI) data; and the Framingham cardiovascular study. CompositeView was stress tested to construct reference benchmarks that define breadth and size of data effectively visualized. Finally, CompositeView is compared to Excel, Tableau, Cytoscape, neo4j, NodeXL, and Gephi. Full article
(This article belongs to the Special Issue Graph-Based Data Mining and Social Network Analysis)
Show Figures

Figure 1

Figure 1
<p>A high-level overview of CompositeView’s working cycle. CompositeView has placeholder data, which initialize the graph, and user data, which initialize the user interaction and application of CompositeView. The cycle begins with a user uploading data and interacting with the application to update the graph attributes and layout. Next, the Cytoscape elements are updated to run the graph. Finally, the graph rendering and display are visually updated to the user in the CompositeView application. The working cycle continues as the user makes updates to the data or changes or applies CompositeView application features such as graph layout selection or filtering modes.</p>
Full article ">Figure 2
<p>The three input data examples explained in <a href="#sec2dot1dot3-BDCC-06-00066" class="html-sec">Section 2.1.3</a>, evolving from least to most complex.</p>
Full article ">Figure 3
<p>A sample of tested graph layouts along with their CompositeView runtimes, all based on the same SemNet results data set (approximately 2472 source nodes).</p>
Full article ">Figure 4
<p>The adjusted spring graph layout using the same SemNet test data from <a href="#BDCC-06-00066-f003" class="html-fig">Figure 3</a> (runtime: 5.78 s).</p>
Full article ">Figure 5
<p>The adjusted spring layout method, broken down into three logical steps. The data shown are placeholder data used in CompositeView. (<b>a</b>) Initial target nodes are simulated and positions are fixed. (<b>b</b>) Artificial edges are removed and source nodes are filled in around the shared target node centroids. (<b>c</b>) Source nodes are simulated with edge weights.</p>
Full article ">Figure 6
<p>Value filtering as well as node and type filtering settings as displayed by CompositeView. (<b>a</b>) Value filtering sliders. (<b>b</b>) Node and edge filtering dropdowns.</p>
Full article ">Figure 7
<p>The complete CompositeView application layout (with Graph Manipulation settings open).</p>
Full article ">Figure 8
<p>The impact of source spread (<span class="html-italic">k</span> in the NetworkX spring layout). The data shown is placeholder data used in CompositeView. (<b>a</b>) Source spread value half of base. (<b>b</b>) Base source spread value, the same as <a href="#BDCC-06-00066-f005" class="html-fig">Figure 5</a>c. (<b>c</b>) Source spread value double of base.</p>
Full article ">Figure 8 Cont.
<p>The impact of source spread (<span class="html-italic">k</span> in the NetworkX spring layout). The data shown is placeholder data used in CompositeView. (<b>a</b>) Source spread value half of base. (<b>b</b>) Base source spread value, the same as <a href="#BDCC-06-00066-f005" class="html-fig">Figure 5</a>c. (<b>c</b>) Source spread value double of base.</p>
Full article ">Figure 9
<p>Application startup, graph initialization, attribute loading, and graph update.</p>
Full article ">Figure 10
<p>Runtime analysis of graph startup and update, broken down by most important methods.</p>
Full article ">Figure 11
<p>The SemNet sample data, both unfiltered (<b>a</b>) and filtered (<b>b</b>), based on criteria described in <a href="#sec2dot3dot1-BDCC-06-00066" class="html-sec">Section 2.3.1</a>.</p>
Full article ">Figure 12
<p>The HDI sample data, both unfiltered (<b>a</b>) and filtered (<b>b</b>), based on criteria described in <a href="#sec2dot3dot2-BDCC-06-00066" class="html-sec">Section 2.3.2</a>.</p>
Full article ">Figure 13
<p>The CVD sample data, both unfiltered (<b>a</b>) and filtered (<b>b</b>), based on criteria described in <a href="#sec2dot3dot3-BDCC-06-00066" class="html-sec">Section 2.3.3</a>.</p>
Full article ">Figure 14
<p>Visual comparison between Gephi and CompositeView using the same SemNet data set seen in <a href="#BDCC-06-00066-f003" class="html-fig">Figure 3</a> and <a href="#BDCC-06-00066-f004" class="html-fig">Figure 4</a> (approximately 2472 source nodes). The red circles represent the main input features or nodes for which relationships are being visualized. In this example, visualized relationships for composite data are much easier to deduce with CompositeView compared to Gephi.</p>
Full article ">
15 pages, 712 KiB  
Article
Analysis and Prediction of User Sentiment on COVID-19 Pandemic Using Tweets
by Nilufa Yeasmin, Nosin Ibna Mahbub, Mrinal Kanti Baowaly, Bikash Chandra Singh, Zulfikar Alom, Zeyar Aung and Mohammad Abdul Azim
Big Data Cogn. Comput. 2022, 6(2), 65; https://doi.org/10.3390/bdcc6020065 - 10 Jun 2022
Cited by 18 | Viewed by 4031
Abstract
The novel coronavirus disease (COVID-19) has dramatically affected people’s daily lives worldwide. More specifically, since there is still insufficient access to vaccines and no straightforward, reliable treatment for COVID-19, every country has taken the appropriate precautions (such as physical separation, masking, and lockdown) [...] Read more.
The novel coronavirus disease (COVID-19) has dramatically affected people’s daily lives worldwide. More specifically, since there is still insufficient access to vaccines and no straightforward, reliable treatment for COVID-19, every country has taken the appropriate precautions (such as physical separation, masking, and lockdown) to combat this extremely infectious disease. As a result, people invest much time on online social networking platforms (e.g., Facebook, Reddit, LinkedIn, and Twitter) and express their feelings and thoughts regarding COVID-19. Twitter is a popular social networking platform, and it enables anyone to use tweets. This research used Twitter datasets to explore user sentiment from the COVID-19 perspective. We used a dataset of COVID-19 Twitter posts from nine states in the United States for fifteen days (from 1 April 2020, to 15 April 2020) to analyze user sentiment. We focus on exploiting machine learning (ML), and deep learning (DL) approaches to classify user sentiments regarding COVID-19. First, we labeled the dataset into three groups based on the sentiment values, namely positive, negative, and neutral, to train some popular ML algorithms and DL models to predict the user concern label on COVID-19. Additionally, we have compared traditional bag-of-words and term frequency-inverse document frequency (TF-IDF) for representing the text to numeric vectors in ML techniques. Furthermore, we have contrasted the encoding methodology and various word embedding schemes, such as the word to vector (Word2Vec) and global vectors for word representation (GloVe) versions, with three sets of dimensions (100, 200, and 300) for representing the text to numeric vectors for DL approaches. Finally, we compared COVID-19 infection cases and COVID-19-related tweets during the COVID-19 pandemic. Full article
Show Figures

Figure 1

Figure 1
<p>Proposed methodology and the workflow of our work.</p>
Full article ">Figure 2
<p>User sentiments.</p>
Full article ">Figure 3
<p>Accuracy and <math display="inline"><semantics> <msub> <mi>F</mi> <mn>1</mn> </msub> </semantics></math>-Score obtained using ML models for testing dataset.</p>
Full article ">Figure 4
<p>Accuracy and <math display="inline"><semantics> <msub> <mi>F</mi> <mn>1</mn> </msub> </semantics></math>-Score obtained using DL models for testing dataset.</p>
Full article ">Figure 5
<p>Comparison between the (<b>a</b>) number of COVID-19 related tweets in each state, and (<b>b</b>) the number of COVID-19 cases in each state.</p>
Full article ">
20 pages, 3478 KiB  
Article
Decision-Making Using Big Data Relevant to Sustainable Development Goals (SDGs)
by Saman Fattahi, Sharifu Ura and Md. Noor-E-Alam
Big Data Cogn. Comput. 2022, 6(2), 64; https://doi.org/10.3390/bdcc6020064 - 5 Jun 2022
Cited by 5 | Viewed by 3773
Abstract
Policymakers, practitioners, and researchers around the globe have been acting in a coordinated manner, yet remaining independent, to achieve the seventeen Sustainable Development Goals (SDGs) defined by the United Nations. Remarkably, SDG-centric activities have manifested a huge information silo known as big data. [...] Read more.
Policymakers, practitioners, and researchers around the globe have been acting in a coordinated manner, yet remaining independent, to achieve the seventeen Sustainable Development Goals (SDGs) defined by the United Nations. Remarkably, SDG-centric activities have manifested a huge information silo known as big data. In most cases, a relevant subset of big data is visualized using several two-dimensional plots. These plots are then used to decide a course of action for achieving the relevant SDGs, and the whole process remains rather informal. Consequently, the question of how to make a formal decision using big data-generated two-dimensional plots is a critical one. This article fills this gap by presenting a novel decision-making approach (method and tool). The approach formally makes decisions where the decision-relevant information is two-dimensional plots rather than numerical data. The efficacy of the proposed approach is demonstrated by conducting two case studies relevant to SDG 12 (responsible consumption and production). The first case study confirms whether or not the proposed decision-making approach produces reliable results. In this case study, datasets of wooden and polymeric materials regarding two eco-indicators (CO2 footprint and water usage) are represented using two two-dimensional plots. The plots show that wooden and polymeric materials are indifferent in water usage, whereas wooden materials are better than polymeric materials in terms of CO2 footprint. The proposed decision-making approach correctly captures this fact and correctly ranks the materials. For the other case study, three materials (mild steel, aluminum alloys, and magnesium alloys) are ranked using six criteria (strength, modulus of elasticity, cost, density, CO2 footprint, and water usage) and their relative weights. The datasets relevant to the six criteria are made available using three two-dimensional plots. The plots show the relative positions of mild steel, aluminum alloys, and magnesium alloys. The proposed decision-making approach correctly captures the decision-relevant information of these three plots and correctly ranks the materials. Thus, the outcomes of this article can help those who wish to develop pragmatic decision support systems leveraging the capacity of big data in fulfilling SDGs. Full article
Show Figures

Figure 1

Figure 1
<p>Visualization of relevant datasets from big data of engineering materials.</p>
Full article ">Figure 2
<p>Proposed decision-making framework.</p>
Full article ">Figure 3
<p>Compliance calculation for an interval.</p>
Full article ">Figure 4
<p>Calculating decision score.</p>
Full article ">Figure 5
<p>The user interface of the decision tool.</p>
Full article ">Figure 6
<p>An example of extracting intervals from an alternative.</p>
Full article ">Figure 7
<p>Big data regarding the sustainability of two families of materials. (<b>a</b>) Wooden materials, and (<b>b</b>) polymers [<a href="#B36-BDCC-06-00064" class="html-bibr">36</a>].</p>
Full article ">Figure 8
<p>User interface of the decision tool for extracting ranges representing the water usage of wooden materials.</p>
Full article ">Figure 9
<p>Extracted ranges representing water usage of wooden materials.</p>
Full article ">Figure 10
<p>Extracting decision-relevant information from the plot of strength versus Yang’s modulus.</p>
Full article ">Figure 11
<p>Extracting decision-relevant information from the plot of cost versus density.</p>
Full article ">Figure 12
<p>Extracting decision-relevant information from the plot of water usage versus CO<sub>2</sub> footprint.</p>
Full article ">Figure 13
<p>Comparing three alternatives using their induced fuzzy numbers.</p>
Full article ">Figure 14
<p>Relative positions of the arbitrary alternatives on the <span class="html-italic">D</span>2 versus <span class="html-italic">D</span>1 plot.</p>
Full article ">
17 pages, 1055 KiB  
Article
Social Media Analytics as a Tool for Cultural Spaces—The Case of Twitter Trending Topics
by Vassilis Poulopoulos and Manolis Wallace
Big Data Cogn. Comput. 2022, 6(2), 63; https://doi.org/10.3390/bdcc6020063 - 2 Jun 2022
Cited by 1 | Viewed by 3853
Abstract
We are entering an era in which online personalities and personas will grow faster and faster. People are tending to use the Internet, and social media especially, more frequently and for a wider variety of purposes. In parallel, a number of cultural spaces [...] Read more.
We are entering an era in which online personalities and personas will grow faster and faster. People are tending to use the Internet, and social media especially, more frequently and for a wider variety of purposes. In parallel, a number of cultural spaces have already decided to invest in marketing and message spreading through the web and the media. Growing their audience, or locating the appropriate group of people to share their information, remains a tedious task within the chaotic environment of the Internet. The investment is mainly financial—usually large—and directed to advertisements. Still, there is much space for research and investment in analytics that can provide evidence considering the spreading of the word and finding groups of people interested in specific information or trending topics and influencers. In this paper, we present a part of a national project that aims to perform an analysis of Twitter’s trending topics. The main scope of the analysis is to provide a basic ordering on the topics based on their “importance”. Based on this, we clarify how cultural institutions can benefit from such an analysis in order to empower their online presence. Full article
(This article belongs to the Special Issue Semantic Web Technology and Recommender Systems)
Show Figures

Figure 1

Figure 1
<p>System Architecture.</p>
Full article ">Figure 2
<p>Sample Visualization of trending topics.</p>
Full article ">Figure 3
<p>Single term evolution in time.</p>
Full article ">Figure 4
<p>Trend power compared to retweets and favorites over time.</p>
Full article ">Figure 5
<p>Sample results from JSON data execution.</p>
Full article ">Figure 6
<p>JSON Data to Charts.</p>
Full article ">
22 pages, 3553 KiB  
Article
Synthesizing a Talking Child Avatar to Train Interviewers Working with Maltreated Children
by Pegah Salehi, Syed Zohaib Hassan, Myrthe Lammerse, Saeed Shafiee Sabet, Ingvild Riiser, Ragnhild Klingenberg Røed, Miriam S. Johnson, Vajira Thambawita, Steven A. Hicks, Martine Powell, Michael E. Lamb, Gunn Astrid Baugerud, Pål Halvorsen and Michael A. Riegler
Big Data Cogn. Comput. 2022, 6(2), 62; https://doi.org/10.3390/bdcc6020062 - 1 Jun 2022
Cited by 15 | Viewed by 5649
Abstract
When responding to allegations of child sexual, physical, and psychological abuse, Child Protection Service (CPS) workers and police personnel need to elicit detailed and accurate accounts of the abuse to assist in decision-making and prosecution. Current research emphasizes the importance of the interviewer’s [...] Read more.
When responding to allegations of child sexual, physical, and psychological abuse, Child Protection Service (CPS) workers and police personnel need to elicit detailed and accurate accounts of the abuse to assist in decision-making and prosecution. Current research emphasizes the importance of the interviewer’s ability to follow empirically based guidelines. In doing so, it is essential to implement economical and scientific training courses for interviewers. Due to recent advances in artificial intelligence, we propose to generate a realistic and interactive child avatar, aiming to mimic a child. Our ongoing research involves the integration and interaction of different components with each other, including how to handle the language, auditory, emotional, and visual components of the avatar. This paper presents three subjective studies that investigate and compare various state-of-the-art methods for implementing multiple aspects of the child avatar. The first user study evaluates the whole system and shows that the system is well received by the expert and highlights the importance of its realism. The second user study investigates the emotional component and how it can be integrated with video and audio, and the third user study investigates realism in the auditory and visual components of the avatar created by different methods. The insights and feedback from these studies have contributed to the refined and improved architecture of the child avatar system which we present here. Full article
(This article belongs to the Special Issue Multimedia Systems for Multimedia Big Data)
Show Figures

Figure 1

Figure 1
<p>A comprehensive category of face manipulation techniques.</p>
Full article ">Figure 2
<p>System architecture. Green blocks denote the interactive parts, yellow blocks are language-related, blue audio-related, and pink the parts of the system related to visualization.</p>
Full article ">Figure 3
<p>A comparison between natural and synthetic voices in animated unity-based and GAN-based avatars.</p>
Full article ">Figure 4
<p>Excerpt from the user study with window size 5 where both models are in agreement with the human opinion.</p>
Full article ">Figure 5
<p>Excerpt from the user study with window size 3 for which both models were not in agreement with the human raters.</p>
Full article ">Figure 6
<p>Excerpt from the user study with window size 5 for which both GPT-3 and the human raters agreed that this should be classified as fear, while the BART model classified its as anger.</p>
Full article ">Figure 7
<p>Given an arbitrary source face image generated by styleGAN [<a href="#B59-BDCC-06-00062" class="html-bibr">59</a>,<a href="#B101-BDCC-06-00062" class="html-bibr">101</a>] and a driving video, ICface [<a href="#B74-BDCC-06-00062" class="html-bibr">74</a>] has generated the talking-head of a child.</p>
Full article ">Figure 8
<p>Illustration of a talking-head video generated using two methods, PCAVS [<a href="#B75-BDCC-06-00062" class="html-bibr">75</a>] and MakeItTalk [<a href="#B65-BDCC-06-00062" class="html-bibr">65</a>]. The input is an image generated using styleGAN and an audio generated using IBM Watson. The first two rows: PCAVS and the second two rows: MakeItTalk.</p>
Full article ">Figure 9
<p>Bar-plot (95% confidence interval) for comparison of MakeItTalk [<a href="#B65-BDCC-06-00062" class="html-bibr">65</a>] and PC-AVS [<a href="#B75-BDCC-06-00062" class="html-bibr">75</a>].</p>
Full article ">Figure 10
<p>Bar-plot (95% confidence interval) to show results of the user study for the evaluation of two of the best female and male characters created for both the GAN-Based and game engine-based approaches.</p>
Full article ">
21 pages, 3407 KiB  
Article
A Novel Method of Exploring the Uncanny Valley in Avatar Gender(Sex) and Realism Using Electromyography
by Jacqueline D. Bailey and Karen L. Blackmore
Big Data Cogn. Comput. 2022, 6(2), 61; https://doi.org/10.3390/bdcc6020061 - 30 May 2022
Cited by 1 | Viewed by 5112
Abstract
Despite the variety of applications that use avatars (virtual humans), how end-users perceive avatars are not fully understood, and accurately measuring these perceptions remains a challenge. To measure end-user responses more accurately to avatars, this pilot study uses a novel methodology which aims [...] Read more.
Despite the variety of applications that use avatars (virtual humans), how end-users perceive avatars are not fully understood, and accurately measuring these perceptions remains a challenge. To measure end-user responses more accurately to avatars, this pilot study uses a novel methodology which aims to examine and categorize end-user facial electromyography (f-EMG) responses. These responses (n = 92) can be categorized as pleasant, unpleasant, and neutral using control images sourced from the International Affective Picture System (IAPS). This methodology can also account for variability between participant responses to avatars. The novel methodology taken here can assist in the comparisons of avatars, such as gender(sex)-based differences. To examine these gender(sex) differences, participant responses to an avatar can be categorized as either pleasant, unpleasant, neutral or a combination. Although other factors such as age may unconsciously affect the participant responses, age was not directly considered in this work. This method may allow avatar developers to better understand how end-users objectively perceive an avatar. The recommendation of this methodology is to aim for an avatar that returns a pleasant, neutral, or pleasant-neutral response, unless an unpleasant response is the intended. This methodology demonstrates a novel and useful way forward to address some of the known variability issues found in f-EMG responses, and responses to avatar realism and uncanniness that can be used to examine gender(sex) perceptions. Full article
(This article belongs to the Special Issue Cognitive and Physiological Assessments in Human-Computer Interaction)
Show Figures

Figure 1

Figure 1
<p>Graphical representation of the valence-affect model [<a href="#B26-BDCC-06-00061" class="html-bibr">26</a>].</p>
Full article ">Figure 2
<p>Placement of electrodes on the orbicularis oculi (adapted from: Blumenthal et al. [<a href="#B17-BDCC-06-00061" class="html-bibr">17</a>]).</p>
Full article ">Figure 3
<p>Example f-EMG response.</p>
Full article ">Figure 4
<p>Different participants viewing the same normatively rated visual imagery can produce highly variable f-EMG responses. <b>Key: Slide Number:</b> 3015, <b>Description:</b> Accident, <b>Category:</b> Unpleasant, Valence <b>Mean SD:</b> (M = 1.52, SD = 0.95). Note: The blue line is a raw response from a participant; the red line is the startle noise; the green lines are the response window.</p>
Full article ">Figure 5
<p>Data collection procedure.</p>
Full article ">Figure 6
<p>A sample of the avatars used in the experiments.</p>
Full article ">Figure 7
<p>Responses to the Control imagery by participants’ self-reported bio sex.</p>
Full article ">Figure 8
<p>Mean peak f-EMG classified responses by avatars with a happy expression grouped by realism level.</p>
Full article ">Figure 9
<p>Mean peak f-EMG classified responses by avatars with a sad expression grouped by realism level.</p>
Full article ">Figure 10
<p>Mean valid responses by participant bio sex for avatars with happy expressions grouped by realism level.</p>
Full article ">Figure 11
<p>Mean valid responses by participant bio sex for avatars with sad expressions grouped by realism level.</p>
Full article ">Figure 12
<p>Mean normalized peak f-EMG responses for the realism levels by both avatar and participant gender(sex).</p>
Full article ">
21 pages, 4883 KiB  
Article
Earthquake Insurance in California, USA: What Does Community-Generated Big Data Reveal to Us?
by Fabrizio Terenzio Gizzi and Maria Rosaria Potenza
Big Data Cogn. Comput. 2022, 6(2), 60; https://doi.org/10.3390/bdcc6020060 - 20 May 2022
Cited by 5 | Viewed by 6247
Abstract
California has a high seismic hazard, as many historical and recent earthquakes remind us. To deal with potential future damaging earthquakes, a voluntary insurance system for residential properties is in force in the state. However, the insurance penetration rate is quite low. Bearing [...] Read more.
California has a high seismic hazard, as many historical and recent earthquakes remind us. To deal with potential future damaging earthquakes, a voluntary insurance system for residential properties is in force in the state. However, the insurance penetration rate is quite low. Bearing this in mind, the aim of this article is to ascertain whether Big Data can provide policymakers and stakeholders with useful information in view of future action plans on earthquake coverage. Therefore, we extracted and analyzed the online search interest in earthquake insurance over time (2004–2021) through Google Trends (GT), a website that explores the popularity of top search queries in Google Search across various regions and languages. We found that (1) the triggering of online searches stems primarily from the occurrence of earthquakes in California and neighboring areas as well as oversea regions, thus suggesting that the interest of users was guided by both direct and vicarious earthquake experiences. However, other natural hazards also come to people’s notice; (2) the length of the higher level of online attention spans from one day to one week, depending on the magnitude of the earthquakes, the place where they occur, the temporal proximity of other natural hazards, and so on; (3) users interested in earthquake insurance are also attentive to knowing the features of the policies, among which are first the price of coverage, and then their worth and practical benefits; (4) online interest in the time span analyzed fits fairly well with the real insurance policy underwritings recorded over the years. Based on the research outcomes, we can propose the establishment of an observatory to monitor the online behavior that is suitable for supporting well-timed and geographically targeted information and communication action plans. Full article
(This article belongs to the Special Issue Big Data and Internet of Things)
Show Figures

Figure 1

Figure 1
<p>Number of documents per year related to Google Trends according to Scopus (analysis performed by the authors of this article in title-abstract-keywords fields, on 16 February 2022).</p>
Full article ">Figure 2
<p>Comparison between the GT EQI GeoMap for the USA in 2004–2021 ((<b>upper panel</b>), modified from the original source), the seismic hazard map of the conterminous USA ((<b>central panel</b>), modified from the original source) [<a href="#B46-BDCC-06-00060" class="html-bibr">46</a>], and the earthquakes occurred in the conterminous USA and surrounding areas, which are outside the conterminous USA in 2004–2021 (M ≥ 5.0) [<a href="#B45-BDCC-06-00060" class="html-bibr">45</a>] (<b>lower panel</b>). In the GeoMap, darker shades indicate the states where the EQI searches were more frequent. Therefore, the states where online search was the highest were CA = 100; UT = 70; WA = 66; AK = 60; OR = 53; OK = 41; MO = 25; NV = 25; KS = 22. The seismic hazard map (<b>central panel</b>) shows the intensity (MMI scale) of potential earthquake ground shaking that has a 2% probability of occurring in 50 years.</p>
Full article ">Figure 3
<p>GeoMap of interest for earthquake insurance in California metropolitan areas over the entire time span (2004–2021, GeoMap modified from the original source).</p>
Full article ">Figure 4
<p>GT daily search interest (2004–2021) for earthquake insurance (<b>upper panel</b>) and earthquake (<b>lower panel</b>).</p>
Full article ">Figure 5
<p>Earthquakes and other natural hazards causing direct rising of GT search interest in earthquake insurance in California; (<b>upper panel</b>) worldwide overview, the circles show the earthquakes; the star identifies the Hurricane Harvey landfall in Texas. The dashed box identifies the enlarged area in the figure below; (<b>lower panel</b>) California overview. The earthquakes were plotted on the California population density map based on United States Census Bureau for 2010 (<a href="https://www.worldofmaps.net/" target="_blank">https://www.worldofmaps.net/</a> accessed on 20 February 2022).</p>
Full article ">Figure 6
<p>Yearly number of residential earthquake policies from 2002 to 2020. Elaboration of the authors of this article from the CEA data [<a href="#B49-BDCC-06-00060" class="html-bibr">49</a>,<a href="#B50-BDCC-06-00060" class="html-bibr">50</a>]. For the period before 2009, the data refer only to the CEA subscriptions. Data for 2003 and 2004 are not available in the sources consulted.</p>
Full article ">Figure 7
<p>Search results (screenshot) for GT “flood insurance” topic in California during the time span of five years (2017–2021). Due to the time window length, search volumes are plotted weekly. The highest peak (100) was recorded in the week 27 August–2 September 2017, during or in the aftermath of Hurricane Harvey landfall. However, according to what we noticed for online attention in EQI and EQ, the searches in flood insurance started reasonably at the beginning of the week, in close temporal relationship with the occurrence of flooding.</p>
Full article ">Figure 8
<p>GT-related queries (rising option) for 2016–2021 (III period). In red, the queries having the same meaning (cost of coverage).</p>
Full article ">Figure 9
<p>Possible operative flow for internet users interested in earthquake insurance.</p>
Full article ">
14 pages, 577 KiB  
Article
The Predictive Power of a Twitter User’s Profile on Cryptocurrency Popularity
by Maria Trigka, Andreas Kanavos, Elias Dritsas, Gerasimos Vonitsanos and Phivos Mylonas
Big Data Cogn. Comput. 2022, 6(2), 59; https://doi.org/10.3390/bdcc6020059 - 20 May 2022
Cited by 6 | Viewed by 3830
Abstract
Microblogging has become an extremely popular communication tool among Internet users worldwide. Millions of users daily share a huge amount of information related to various aspects of their lives, which makes the respective sites a very important source of data for analysis. Bitcoin [...] Read more.
Microblogging has become an extremely popular communication tool among Internet users worldwide. Millions of users daily share a huge amount of information related to various aspects of their lives, which makes the respective sites a very important source of data for analysis. Bitcoin (BTC) is a decentralized cryptographic currency and is equivalent to most recurrently known currencies in the way that it is influenced by socially developed conclusions, regardless of whether those conclusions are considered valid. This work aims to assess the importance of Twitter users’ profiles in predicting a cryptocurrency’s popularity. More specifically, our analysis focused on the user influence, captured by different Twitter features (such as the number of followers, retweets, lists) and tweet sentiment scores as the main components of measuring popularity. Moreover, the Spearman, Pearson, and Kendall Correlation Coefficients are applied as post-hoc procedures to support hypotheses about the correlation between a user influence and the aforementioned features. Tweets sentiment scoring (as positive or negative) was performed with the aid of Valence Aware Dictionary and Sentiment Reasoner (VADER) for a number of tweets fetched within a concrete time period. Finally, the Granger causality test was employed to evaluate the statistical significance of various features time series in popularity prediction to identify the most influential variable for predicting future values of the cryptocurrency popularity. Full article
(This article belongs to the Special Issue Semantic Web Technology and Recommender Systems)
Show Figures

Figure 1

Figure 1
<p>Sentiment scores of posts per cryptocurrency.</p>
Full article ">
20 pages, 9323 KiB  
Article
COVID-19 Tweets Classification Based on a Hybrid Word Embedding Method
by Yosra Didi, Ahlam Walha and Ali Wali
Big Data Cogn. Comput. 2022, 6(2), 58; https://doi.org/10.3390/bdcc6020058 - 18 May 2022
Cited by 20 | Viewed by 4948
Abstract
In March 2020, the World Health Organisation declared that COVID-19 was a new pandemic. This deadly virus spread and affected many countries in the world. During the outbreak, social media platforms such as Twitter contributed valuable and massive amounts of data to better [...] Read more.
In March 2020, the World Health Organisation declared that COVID-19 was a new pandemic. This deadly virus spread and affected many countries in the world. During the outbreak, social media platforms such as Twitter contributed valuable and massive amounts of data to better assess health-related decision making. Therefore, we propose that users’ sentiments could be analysed with the application of effective supervised machine learning approaches to predict disease prevalence and provide early warnings. The collected tweets were prepared for preprocessing and categorised into: negative, positive, and neutral. In the second phase, different features were extracted from the posts by applying several widely used techniques, such as TF-IDF, Word2Vec, Glove, and FastText to capture features’ datasets. The novelty of this study is based on hybrid features extraction, where we combined syntactic features (TF-IDF) with semantic features (FastText and Glove) to represent posts accurately, which helps in improving the classification process. Experimental results show that FastText combined with TF-IDF performed better with SVM than the other models. SVM outperformed the other models by 88.72%, as well as for XGBoost, with an 85.29% accuracy score. This study shows that the hybrid methods proved their capability of extracting features from the tweets and increasing the performance of classification. Full article
Show Figures

Figure 1

Figure 1
<p>Framework of the proposed model.</p>
Full article ">Figure 2
<p>Word cloud of the dataset.</p>
Full article ">Figure 3
<p>The most frequent word number.</p>
Full article ">Figure 4
<p>The distribution of positive, neutral and, negative sentiments.</p>
Full article ">Figure 5
<p>The distribution of (<b>a</b>) negative, (<b>b</b>) neutral, and (<b>c</b>) positive sentiments.</p>
Full article ">Figure 6
<p>Visualisation of the ROC curves of traditional classifiers using (<b>a</b>) TF-IDF, (<b>b</b>) Glove, and (<b>c</b>) FastText word embedding techniques.</p>
Full article ">Figure 7
<p>Visualisation of the accuracy of traditional classifiers using TF-IDF, Glove, and FastText word embedding techniques.</p>
Full article ">Figure 8
<p>Visualisation of the ROC curves of traditional classifiers using hybrid: (<b>a</b>) TF-IDF with Glove and (<b>b</b>) TF-IDF with FastText word embedding techniques.</p>
Full article ">Figure 9
<p>Visualisation of the accuracy of traditional classifiers for hybrid methods: TF-IDF with FastText and TF-IDF with Glove word embedding techniques.</p>
Full article ">
18 pages, 1494 KiB  
Article
Sentiment Analysis of Emirati Dialect
by Arwa A. Al Shamsi and Sherief Abdallah
Big Data Cogn. Comput. 2022, 6(2), 57; https://doi.org/10.3390/bdcc6020057 - 17 May 2022
Cited by 14 | Viewed by 4738
Abstract
Recently, extensive studies and research in the Arabic Natural Language Processing (ANLP) field have been conducted for text classification and sentiment analysis. Moreover, the number of studies that target Arabic dialects has also increased. In this research paper, we constructed the first manually [...] Read more.
Recently, extensive studies and research in the Arabic Natural Language Processing (ANLP) field have been conducted for text classification and sentiment analysis. Moreover, the number of studies that target Arabic dialects has also increased. In this research paper, we constructed the first manually annotated dataset of the Emirati dialect for the Instagram platform. The constructed dataset consisted of more than 70,000 comments, mostly written in the Emirati dialect. We annotated the comments in the dataset based on text polarity, dividing them into positive, negative, and neutral categories, and the number of annotated comments was 70,000. Moreover, the dataset was also annotated for the dialect type, categorized into the Emirati dialect, Arabic dialects, and MSA. Preprocessing and TF-IDF features extraction approaches were applied to the constructed Emirati dataset to prepare the dataset for the sentiment analysis experiment and improve its classification performance. The sentiment analysis experiment was carried out on both balanced and unbalanced datasets using several machine learning classifiers. The evaluation metrics of the sentiment analysis experiments were accuracy, recall, precision, and f-measure. The results reported that the best accuracy result was 80.80%, and it was achieved when the ensemble model was applied for the sentiment classification of the unbalanced dataset. Full article
Show Figures

Figure 1

Figure 1
<p>Platforms used for dataset construction.</p>
Full article ">Figure 2
<p>A comparison of the sentiment score values of Instagram comments and words in terms of the number of neutral, positive, and negative comments.</p>
Full article ">Figure 3
<p>Sentiment analysis experiment model.</p>
Full article ">Figure 4
<p>Classification results for sentiment analysis of unbalanced dataset.</p>
Full article ">Figure 5
<p>Classification results for sentiment analysis of balanced dataset (undersampling).</p>
Full article ">Figure 6
<p>Classification results for sentiment analysis of balanced dataset (oversampling).</p>
Full article ">
33 pages, 5213 KiB  
Article
A Better Mechanistic Understanding of Big Data through an Order Search Using Causal Bayesian Networks
by Changwon Yoo, Efrain Gonzalez, Zhenghua Gong and Deodutta Roy
Big Data Cogn. Comput. 2022, 6(2), 56; https://doi.org/10.3390/bdcc6020056 - 17 May 2022
Cited by 3 | Viewed by 2653
Abstract
Every year, biomedical data is increasing at an alarming rate and is being collected from many different sources, such as hospitals (clinical Big Data), laboratories (genomic and proteomic Big Data), and the internet (online Big Data). This article presents and evaluates a practical [...] Read more.
Every year, biomedical data is increasing at an alarming rate and is being collected from many different sources, such as hospitals (clinical Big Data), laboratories (genomic and proteomic Big Data), and the internet (online Big Data). This article presents and evaluates a practical causal discovery algorithm that uses modern statistical, machine learning, and informatics approaches that have been used in the learning of causal relationships from biomedical Big Data, which in turn integrates clinical, omics (genomic and proteomic), and environmental aspects. The learning of causal relationships from data using graphical models does not address the hidden (unknown or not measured) mechanisms that are inherent to most measurements and analyses. Also, many algorithms lack a practical usage since they do not incorporate current mechanistic knowledge. This paper proposes a practical causal discovery algorithm using causal Bayesian networks to gain a better understanding of the underlying mechanistic process that generated the data. The algorithm utilizes model averaging techniques such as searching through a relative order (e.g., if gene A is regulating gene B, then we can say that gene A is of a higher order than gene B) and incorporates relevant prior mechanistic knowledge to guide the Markov chain Monte Carlo search through the order. The algorithm was evaluated by testing its performance on datasets generated from the ALARM causal Bayesian network. Out of the 37 variables in the ALARM causal Bayesian network, two sets of nine were chosen and the observations for those variables were provided to the algorithm. The performance of the algorithm was evaluated by comparing its prediction with the generating causal mechanism. The 28 variables that were not in use are referred to as hidden variables and they allowed for the evaluation of the algorithm’s ability to predict hidden confounded causal relationships. The algorithm’s predicted performance was also compared with other causal discovery algorithms. The results show that incorporating order information provides a better mechanistic understanding even when hidden confounded causes are present. The prior mechanistic knowledge incorporated in the Markov chain Monte Carlo search led to the better discovery of causal relationships when hidden variables were involved in generating the simulated data. Full article
Show Figures

Figure 1

Figure 1
<p>A causal Bayesian networks example.</p>
Full article ">Figure 2
<p>Three structures included in the order &lt;<span class="html-italic">X</span><sub>1</sub>, <span class="html-italic">X</span><sub>2</sub>, <span class="html-italic">X</span><sub>3</sub>&gt;.</p>
Full article ">Figure 3
<p>Two sets of nine variables. All the grayed-out variables are hidden and not selected. (<b>a</b>) Close 9 variables (C9). (<b>b</b>) Sparse 9 variables (S9).</p>
Full article ">Figure 3 Cont.
<p>Two sets of nine variables. All the grayed-out variables are hidden and not selected. (<b>a</b>) Close 9 variables (C9). (<b>b</b>) Sparse 9 variables (S9).</p>
Full article ">Figure 4
<p>Four pairwise causal relationships. H represents a variable that is shaded, meaning that it is present in the ALARM network but not introduced in the datasets using C9 and S9. Not confounded and not causally related is denoted as Ø<sub>X Y</sub> in (<b>a</b>). Not confounded and causally related is denoted as Ø<sub>X</sub><sub>→</sub><sub>Y</sub> in (<b>b</b>). Confounded and not causally related is denoted as H<sub>X Y</sub> in (<b>c</b>). Confounded and causally related is denoted as H<sub>X</sub><sub>→</sub><sub>Y</sub> in (<b>d</b>).</p>
Full article ">Figure 5
<p>Generating Structures for Sparse 9 (<b>a</b>) and Close 9 (<b>b</b>) variables.</p>
Full article ">Figure 6
<p>The highest scored Global BDe Structure for (<b>a</b>) D50S9 (14.23%), (<b>b</b>) D50C9 (15.71%), (<b>c</b>) D1KS9 (&gt;99%) and (<b>d</b>) D1KC9 (4.03%). BDe percentage score in the parentheses.</p>
Full article ">Figure 7
<p>Consensus structure without the order weight for (<b>a</b>) D50S9, (<b>b</b>) D50C9, (<b>c</b>) D1KS9, and (<b>d</b>) D1KC9. Thicknesses of the arcs are based on the pairwise causal relationship probability that is presented as a label in percentage (the reverse causal relationship probability is presented in the parentheses). &gt;99 and ~0 represent pairwise causal relationship probability greater than 0.9999 and less than 0.0001, respectively.</p>
Full article ">Figure 8
<p>Consensus structure with the order weight for (<b>a</b>) D50S9, (<b>b</b>) D50C9, (<b>c</b>) D1KS9, and (<b>d</b>) D1KC9. Thicknesses of the arcs are based on the pairwise causal relationship probability that is presented as a label in percentage (the reverse causal relationship probability is presented in the parentheses). &gt;99 and ~0 represent pairwise causal relationship probability greater than 0.9999 and less than 0.0001 respectively.</p>
Full article ">Figure 8 Cont.
<p>Consensus structure with the order weight for (<b>a</b>) D50S9, (<b>b</b>) D50C9, (<b>c</b>) D1KS9, and (<b>d</b>) D1KC9. Thicknesses of the arcs are based on the pairwise causal relationship probability that is presented as a label in percentage (the reverse causal relationship probability is presented in the parentheses). &gt;99 and ~0 represent pairwise causal relationship probability greater than 0.9999 and less than 0.0001 respectively.</p>
Full article ">
19 pages, 2274 KiB  
Article
Virtual Reality Adaptation Using Electrodermal Activity to Support the User Experience
by Francesco Chiossi, Robin Welsch, Steeven Villa, Lewis Chuang and Sven Mayer
Big Data Cogn. Comput. 2022, 6(2), 55; https://doi.org/10.3390/bdcc6020055 - 13 May 2022
Cited by 19 | Viewed by 4895
Abstract
Virtual reality is increasingly used for tasks such as work and education. Thus, rendering scenarios that do not interfere with such goals and deplete user experience are becoming progressively more relevant. We present a physiologically adaptive system that optimizes the virtual environment based [...] Read more.
Virtual reality is increasingly used for tasks such as work and education. Thus, rendering scenarios that do not interfere with such goals and deplete user experience are becoming progressively more relevant. We present a physiologically adaptive system that optimizes the virtual environment based on physiological arousal, i.e., electrodermal activity. We investigated the usability of the adaptive system in a simulated social virtual reality scenario. Participants completed an n-back task (primary) and a visual detection (secondary) task. Here, we adapted the visual complexity of the secondary task in the form of the number of non-player characters of the secondary task to accomplish the primary task. We show that an adaptive virtual reality can improve users’ comfort by adapting to physiological arousal regarding the task complexity. Our findings suggest that physiologically adaptive virtual reality systems can improve users’ experience in a wide range of scenarios. Full article
(This article belongs to the Special Issue Cognitive and Physiological Assessments in Human-Computer Interaction)
Show Figures

Figure 1

Figure 1
<p>Game view capture of a single trial of the VR n-back (<math display="inline"><semantics> <mrow> <mi>n</mi> <mo>=</mo> <mn>1</mn> </mrow> </semantics></math>) and the visual detection tasks. Participants were required to place a sphere into the corresponding bucket. If the sphere matched the color of the previous sphere one step before, participants placed it into the right bucket. If not, the sphere had to be placed into the left bucket. The visual detection task required participants to monitor if visitors of a museum either possessed a ticket to enter the building or not. To signal a missing ticket after detection, the participant had to select the NPC (see <a href="#app1-BDCC-06-00055" class="html-app">Supplymentary Materials</a>).</p>
Full article ">Figure 2
<p>Individual predicted standardized mean EDA from the optimal <span class="html-small-caps">Stream</span> for the non-adaptive condition (crosses) with individual regression lines, as well as the actual mean EDA (points) at local maxima of adaptation.</p>
Full article ">Figure 3
<p>Adaptation across time for one participant. The pink line indicates <span class="html-small-caps">Stream</span>, the green line indicates the z-scored mean EDA signal that was used for adaptation. Grey areas indicate whether the algorithm chose to increase (light grey) or decrease (dark grey) the <span class="html-small-caps">Stream</span> in a time window of 20 s.</p>
Full article ">Figure 4
<p>The relative difference for (<b>a</b>) raw NASA-TLX score difference, (<b>b</b>) standardized mean EDA, and (<b>c</b>) averaged SCL scores.</p>
Full article ">Figure 5
<p>The relative difference for overall task accuracies in the n-Back and visual detection tasks.</p>
Full article ">Figure 6
<p>Standardized mean EDA at local maxima of adaptation as a function of raw NASA-TLX for the adaptive condition. There is a significant negative correlation between EDA and workload, <span class="html-italic">r</span>(13) = −0.62, <span class="html-italic">p</span> = 0.013.</p>
Full article ">Figure 7
<p>The relative difference for (<b>a</b>) usability questions measured on a 5-point Likert scale and (<b>b</b>) GEQ subscales (Competence, Positive Affection, and Immersion). * indicates that measurements are significantly different from the no-adaptation baseline. Outliers were defined as data points with a value greater than 2 SDs on the log-scale from its participant-mean. Outliers are represented as bold dots.</p>
Full article ">
11 pages, 1357 KiB  
Article
A New Comparative Study of Dimensionality Reduction Methods in Large-Scale Image Retrieval
by Mohammed Amin Belarbi, Saïd Mahmoudi, Ghalem Belalem, Sidi Ahmed Mahmoudi and Aurélie Cools
Big Data Cogn. Comput. 2022, 6(2), 54; https://doi.org/10.3390/bdcc6020054 - 13 May 2022
Cited by 1 | Viewed by 3176
Abstract
Indexing images by content is one of the most used computer vision methods, where various techniques are used to extract visual characteristics from images. The deluge of data surrounding us, due the high use of social and diverse media acquisition systems, has created [...] Read more.
Indexing images by content is one of the most used computer vision methods, where various techniques are used to extract visual characteristics from images. The deluge of data surrounding us, due the high use of social and diverse media acquisition systems, has created a major challenge for classical multimedia processing systems. This problem is referred to as the ‘curse of dimensionality’. In the literature, several methods have been used to decrease the high dimension of features, including principal component analysis (PCA) and locality sensitive hashing (LSH). Some methods, such as VA-File or binary tree, can be used to accelerate the search phase. In this paper, we propose an efficient approach that exploits three particular methods, those being PCA and LSH for dimensionality reduction, and the VA-File method to accelerate the search phase. This combined approach is fast and can be used for high dimensionality features. Indeed, our method consists of three phases: (1) image indexing within SIFT and SURF algorithms, (2) compressing the data using LSH and PCA, and (3) finally launching the image retrieval process, which is accelerated by using a VA-File approach. Full article
(This article belongs to the Special Issue Multimedia Systems for Multimedia Big Data)
Show Figures

Figure 1

Figure 1
<p>The general architecture of our proposed approach.</p>
Full article ">Figure 2
<p>Geometric representation of VA-File.</p>
Full article ">Figure 3
<p>The research phase with VA-File.</p>
Full article ">Figure 4
<p>Computation and the research time within Wang database.</p>
Full article ">Figure 5
<p>Computation and the search time within ImageNet database.</p>
Full article ">Figure 6
<p>Recall/precision within ImageNet database.</p>
Full article ">
3 pages, 186 KiB  
Editorial
Knowledge Modelling and Learning through Cognitive Networks
by Massimo Stella and Yoed N. Kenett
Big Data Cogn. Comput. 2022, 6(2), 53; https://doi.org/10.3390/bdcc6020053 - 13 May 2022
Cited by 1 | Viewed by 2697
Abstract
Knowledge modelling is a growing field at the fringe of computer science, psychology and network science [...] Full article
(This article belongs to the Special Issue Knowledge Modelling and Learning through Cognitive Networks)
21 pages, 4585 KiB  
Article
Cognitive Networks Extract Insights on COVID-19 Vaccines from English and Italian Popular Tweets: Anticipation, Logistics, Conspiracy and Loss of Trust
by Massimo Stella, Michael S. Vitevitch and Federico Botta
Big Data Cogn. Comput. 2022, 6(2), 52; https://doi.org/10.3390/bdcc6020052 - 12 May 2022
Cited by 12 | Viewed by 4574
Abstract
Monitoring social discourse about COVID-19 vaccines is key to understanding how large populations perceive vaccination campaigns. This work reconstructs how popular and trending posts framed semantically and emotionally COVID-19 vaccines on Twitter. We achieve this by merging natural language processing, cognitive network science [...] Read more.
Monitoring social discourse about COVID-19 vaccines is key to understanding how large populations perceive vaccination campaigns. This work reconstructs how popular and trending posts framed semantically and emotionally COVID-19 vaccines on Twitter. We achieve this by merging natural language processing, cognitive network science and AI-based image analysis. We focus on 4765 unique popular tweets in English or Italian about COVID-19 vaccines between December 2020 and March 2021. One popular English tweet contained in our data set was liked around 495,000 times, highlighting how popular tweets could cognitively affect large parts of the population. We investigate both text and multimedia content in tweets and build a cognitive network of syntactic/semantic associations in messages, including emotional cues and pictures. This network representation indicates how online users linked ideas in social discourse and framed vaccines along specific semantic/emotional content. The English semantic frame of “vaccine” was highly polarised between trust/anticipation (towards the vaccine as a scientific asset saving lives) and anger/sadness (mentioning critical issues with dose administering). Semantic associations with “vaccine,” “hoax” and conspiratorial jargon indicated the persistence of conspiracy theories and vaccines in extremely popular English posts. Interestingly, these were absent in Italian messages. Popular tweets with images of people wearing face masks used language that lacked the trust and joy found in tweets showing people with no masks. This difference indicates a negative effect attributed to face-covering in social discourse. Behavioural analysis revealed a tendency for users to share content eliciting joy, sadness and disgust and to like sad messages less. Both patterns indicate an interplay between emotions and content diffusion beyond sentiment. After its suspension in mid-March 2021, “AstraZeneca” was associated with trustful language driven by experts. After the deaths of a small number of vaccinated people in mid-March, popular Italian tweets framed “vaccine” by crucially replacing earlier levels of trust with deep sadness. Our results stress how cognitive networks and innovative multimedia processing open new ways for reconstructing online perceptions about vaccines and trust. Full article
Show Figures

Figure 1

Figure 1
<p>(<b>A</b>) Infographics about how textual forma mentis networks can give structure to the pictures and language posted by online users on social media. Semantic frames around specific ideas/concepts are reconstructed as network neighbourhoods. Word valence and emotional data make it possible to check how concepts were framed by users in posts mentioning (or not) pictures showing specific elements (e.g., people wearing a face mask). A flowchart with the different steps of network construction is outlined too. (<b>B</b>) Example tweet being processed.</p>
Full article ">Figure 2
<p>Multi-language analysis of the emotional profiles of highly/less retweeted (<b>left</b>) or liked (<b>right</b>) tweets in English (<b>top</b>) and in Italian (<b>low</b>). Petals indicate <span class="html-italic">z</span>-scores and are higher than 1.96 when falling outside of the semi-transparent circle. Asterisks highlight emotions <span class="html-italic">z</span> &gt; 1.96.</p>
Full article ">Figure 3
<p>Emotional analysis and word clouds of concepts in the semantic frame of “vaccine” (in English) and “vaccino” (in Italian). The circumplex model indicates how the neighbours of vaccine/vaccino populate a 2D arousal/valence space. The emotion flower indicates an excess of emotions detected in the semantic frame compared to random expectation. The sector chart reports the raw fraction of words eliciting a certain emotion. The word cloud reports the top 10% concepts with the highest degree of centrality which are associated with vaccine. The words are distributed according to the emotions they elicit. Asterisks highlight emotions <span class="html-italic">z</span> &gt; 1.96.</p>
Full article ">Figure 4
<p>TFMNs capturing conceptual associations in social discourse around “pandemic”, “dose”, “worker” and “hoax” (<b>top</b>) and around “health” and “distribute” (<b>bottom</b>). Positive (negative) concepts are cyan (red). Neutral concepts are in blue. Associations between positive (negative) concepts are highlighted in cyan. Purple links connect concepts of opposite valence. Green links indicate overlap in meaning. The emotional flowers indicate how rich the reported neighbourhoods are in terms of emotional jargon. Petals falling outside of the inner circle indicate a richness that differs from random expectation at <span class="html-italic">α</span> = 0.05. Each ring outside of the circle corresponds to one unit of <span class="html-italic">z</span>-score. Asterisks highlight emotions <span class="html-italic">z</span> &gt; 1.96.</p>
Full article ">Figure 5
<p>Emotional flowers and valenced semantic frames for “vaccine” in those tweets, including pictures with: (1) no people (<b>left</b>), (2) people wearing no face masks and (3) people wearing face masks. On the top part of the panel, there are example pictures that were taken from Pixabay to demonstrate how the implemented Python library works. Bottom: Semantic frames reporting only negative and neutral words associated with “vaccine”. Asterisks highlight emotions <span class="html-italic">z</span> &gt; 1.96.</p>
Full article ">Figure 6
<p>Emotional flowers for “vaccine” and “astrazeneca” in popular tweets gathered after the suspension of the AstraZeneca vaccine in several EU countries in mid-March 2021. These results should be compared with the emotional profiles reported in <a href="#BDCC-06-00052-f002" class="html-fig">Figure 2</a> and relative to the months before the suspension. Asterisks highlight emotions <span class="html-italic">z &gt;</span> 1.96.</p>
Full article ">Figure A1
<p>(<b>Left</b>): Elbow plot showing how the within cluster sum of squares varies as the number of clusters increase, when clustering the images based on their dominant hue values. As the plot indicates, two clusters seem to be the optimal choice. (<b>Right</b>): Histogram of the dominant hue values detected in the images (note: only those not containing any text were analysed in this scenario). As the visual inspection suggests, we observe two clusters centred on the red and blue tones of hue.</p>
Full article ">Figure A2
<p>(<b>Top</b>): Word cloud of the most frequent words in tweets with pictures with predominant blue or red. (<b>Bottom</b>): Emotional flowers and circumplex model for the emotions of the language used in tweets with pics of different predominant colours. Asterisks highlight emotions <span class="html-italic">z</span> &gt; 1.96.</p>
Full article ">
24 pages, 7573 KiB  
Article
Robust Multi-Mode Synchronization of Chaotic Fractional Order Systems in the Presence of Disturbance, Time Delay and Uncertainty with Application in Secure Communications
by Ali Akbar Kekha Javan, Assef Zare, Roohallah Alizadehsani and Saeed Balochian
Big Data Cogn. Comput. 2022, 6(2), 51; https://doi.org/10.3390/bdcc6020051 - 8 May 2022
Cited by 5 | Viewed by 2631
Abstract
This paper investigates the robust adaptive synchronization of multi-mode fractional-order chaotic systems (MMFOCS). To that end, synchronization was performed with unknown parameters, unknown time delays, the presence of disturbance, and uncertainty with the unknown boundary. The convergence of the synchronization error to zero [...] Read more.
This paper investigates the robust adaptive synchronization of multi-mode fractional-order chaotic systems (MMFOCS). To that end, synchronization was performed with unknown parameters, unknown time delays, the presence of disturbance, and uncertainty with the unknown boundary. The convergence of the synchronization error to zero was guaranteed using the Lyapunov function. Additionally, the control rules were extracted as explicit continuous functions. An image encryption approach was proposed based on maps with time-dependent coding for secure communication. The simulations indicated the effectiveness of the proposed design regarding the suitability of the parameters, the convergence of errors, and robustness. Subsequently, the presented method was applied to fractional-order Chen systems and was encrypted using the chaotic masking of different benchmark images. The results indicated the desirable performance of the proposed method in encrypting the benchmark images. Full article
Show Figures

Figure 1

Figure 1
<p>Transmission multi-mode synchronization.</p>
Full article ">Figure 2
<p>Circular multi-mode synchronizations.</p>
Full article ">Figure 3
<p>Block diagram of chaotic masking with multi-state synchronization.</p>
Full article ">Figure 4
<p>Phase diagrams for master and slave systems. (<b>a</b>) Master System, (<b>b</b>) slave System 1, (<b>c</b>) slave system 2.</p>
Full article ">Figure 5
<p>Estimation of parameters and time delay errors in multi-mode synchronization obtained during disturbance time delay and uncertainty. ((<b>c</b>) indicates time delay errors and (<b>a</b>,<b>b</b>,<b>d</b>) indicate estimation of errors uncertainty).</p>
Full article ">Figure 6
<p>Curves of synchronization errors obtained during disturbance and uncertainty. (subfigures (<b>a</b>,<b>b</b>) show dynamic state errors and subfigures (<b>c</b>,<b>d</b>) show control efforts).</p>
Full article ">Figure 7
<p>Error curves obtained for estimating the uncertain boundaries (<b>right</b>) and disturbances (<b>left</b>).</p>
Full article ">Figure 8
<p>Displayed Benchmark images encryption using synchronization of the fractional-order Chen systems (<span class="html-italic">q</span> = 0.97).</p>
Full article ">Figure 9
<p>Displayed histograms for various Benchmark images encrypted using synchronization of the fractional-order chaotic system (<span class="html-italic">q</span> = 0.97).</p>
Full article ">
32 pages, 5511 KiB  
Article
Gender Stereotypes in Hollywood Movies and Their Evolution over Time: Insights from Network Analysis
by Arjun M. Kumar, Jasmine Y. Q. Goh, Tiffany H. H. Tan and Cynthia S. Q. Siew
Big Data Cogn. Comput. 2022, 6(2), 50; https://doi.org/10.3390/bdcc6020050 - 6 May 2022
Cited by 5 | Viewed by 50166
Abstract
The present analysis of more than 180,000 sentences from movie plots across the period from 1940 to 2019 emphasizes how gender stereotypes are expressed through the cultural products of society. By applying a network analysis to the word co-occurrence networks of movie plots [...] Read more.
The present analysis of more than 180,000 sentences from movie plots across the period from 1940 to 2019 emphasizes how gender stereotypes are expressed through the cultural products of society. By applying a network analysis to the word co-occurrence networks of movie plots and using a novel method of identifying story tropes, we demonstrate that gender stereotypes exist in Hollywood movies. An analysis of specific paths in the network and the words reflecting various domains show the dynamic changes in some of these stereotypical associations. Our results suggest that gender stereotypes are complex and dynamic in nature. Specifically, whereas male characters appear to be associated with a diversity of themes in movies, female characters seem predominantly associated with the theme of romance. Although associations of female characters to physical beauty and marriage are declining over time, associations of female characters to sexual relationships and weddings are increasing. Our results demonstrate how the application of cognitive network science methods can enable a more nuanced investigation of gender stereotypes in textual data. Full article
(This article belongs to the Special Issue Knowledge Modelling and Learning through Cognitive Networks)
Show Figures

Figure 1

Figure 1
<p>Details of the network construction. (<b>A</b>) Network with only primary nodes. Blue nodes represent unique associations with male characters, orange nodes represent unique associations with female characters, and purple nodes represent the common associations of both male and female characters. (<b>B</b>) Network with primary and secondary nodes. Secondary nodes are depicted in grey.</p>
Full article ">Figure 2
<p>A representation of the ten most significant paths in the network for each gender among the whole network. Paths were selected after filtering out paths that crossed through the other gender vertex.</p>
Full article ">Figure 3
<p>Communities identified in the co-occurrence networks. The male network (<b>a</b>) has 5355 vertices (words) and 1,979,829 edges (pairwise combinations of words within the data sample) and the female network (<b>b</b>) has 7393 vertices and 2,403,651 edges. We detected communities in the network using the Louvain algorithm. Five communities emerged in each of the networks, and the top ten vertices in terms of degree are shown.</p>
Full article ">Figure 4
<p>Most significant story tropes associated with male and female characters described by the path ‘character–primary vertex–secondary vertex’. The thickness of the line represents the significance of the log-likelihood ratio. Blue nodes and lines represent unique associations with male characters; orange nodes represent unique associations with female characters. Purple nodes and lines represent the common associations of both male and female characters.</p>
Full article ">Figure 5
<p>Needle plot representing the edge weights of the twenty most significant paths associated with male characters (<b>top</b>) and female characters (<b>bottom</b>).</p>
Full article ">Figure 6
<p>A comparison of significant tropes in the 1940s (<b>A</b>) and 2010s (<b>B</b>). Some key differences between the tropes from these two decades include the disappearance of the marriage trope in the female characters’ network between the 1940s and the 2010s, and the new addition of a trope related to sexual relationships. For male characters, while there were no crime-related tropes in the 1940s, there was one in the 2010s.</p>
Full article ">Figure 6 Cont.
<p>A comparison of significant tropes in the 1940s (<b>A</b>) and 2010s (<b>B</b>). Some key differences between the tropes from these two decades include the disappearance of the marriage trope in the female characters’ network between the 1940s and the 2010s, and the new addition of a trope related to sexual relationships. For male characters, while there were no crime-related tropes in the 1940s, there was one in the 2010s.</p>
Full article ">Figure 7
<p>Most significant primary noun associations with males and females. Nouns found to strongly co-occur with female characters included ‘daughter’ and ‘mother’; for male characters, they included ‘friend’ and ‘father’. Nouns such as ‘boyfriend’, ‘wife’, and ‘girlfriend’ co-occurred strongly with both female and male characters.</p>
Full article ">Figure 8
<p>Needle plot representing edge weights of the twenty most significant primary noun associations of male characters (<b>top</b>) and female characters (<b>bottom</b>).</p>
Full article ">Figure 8 Cont.
<p>Needle plot representing edge weights of the twenty most significant primary noun associations of male characters (<b>top</b>) and female characters (<b>bottom</b>).</p>
Full article ">Figure 9
<p>Most significant primary verb associations with males and females. Verbs found to strongly co-occur with female characters included ‘marry’ and ‘married’; for male characters, they included ‘kill’ and ‘arrives’. Verbs such as ‘named’ and ‘meets’ co-occurred strongly with both female and male characters.</p>
Full article ">Figure 10
<p>Needle plot representing edge weights of the twenty most significant primary verb associations of male characters (<b>top</b>) and female characters (<b>bottom</b>).</p>
Full article ">Figure 11
<p>Most significant primary adjective associations with males and females. Adjectives found to strongly co-occur with female characters included ‘pregnant’ and ‘beautiful’; for male characters, they included ‘former’ and ‘best’, among others. Adjectives such as ‘young’ and ‘married’ co-occurred strongly with both female and male characters.</p>
Full article ">Figure 12
<p>Needle plot representing edge weights of the twenty most significant primary adjective associations of male characters (<b>top</b>) and female characters (<b>bottom</b>).</p>
Full article ">
19 pages, 3173 KiB  
Article
A Comparative Study of MongoDB and Document-Based MySQL for Big Data Application Data Management
by Cornelia A. Győrödi, Diana V. Dumşe-Burescu, Doina R. Zmaranda and Robert Ş. Győrödi
Big Data Cogn. Comput. 2022, 6(2), 49; https://doi.org/10.3390/bdcc6020049 - 5 May 2022
Cited by 11 | Viewed by 12546
Abstract
In the context of the heavy demands of Big Data, software developers have also begun to consider NoSQL data storage solutions. One of the important criteria when choosing a NoSQL database for an application is its performance in terms of speed of data [...] Read more.
In the context of the heavy demands of Big Data, software developers have also begun to consider NoSQL data storage solutions. One of the important criteria when choosing a NoSQL database for an application is its performance in terms of speed of data accessing and processing, including response times to the most important CRUD operations (CREATE, READ, UPDATE, DELETE). In this paper, the behavior of two of the major document-based NoSQL databases, MongoDB and document-based MySQL, was analyzed in terms of the complexity and performance of CRUD operations, especially in query operations. The main objective of the paper is to make a comparative analysis of the impact that each specific database has on application performance when realizing CRUD requests. To perform this analysis, a case-study application was developed using the two document-based MongoDB and MySQL databases, which aim to model and streamline the activity of service providers that use a lot of data. The results obtained demonstrate the performance of both databases for different volumes of data; based on these, a detailed analysis and several conclusions were presented to support a decision for choosing an appropriate solution that could be used in a big-data application. Full article
Show Figures

Figure 1

Figure 1
<p>Application flow.</p>
Full article ">Figure 2
<p>Application’s document structure: (<b>a</b>) User document; (<b>b</b>) Appointment document; (<b>c</b>) Service document; (<b>d</b>) Customer document.</p>
Full article ">Figure 3
<p>Execution times for the insert operation.</p>
Full article ">Figure 4
<p>Execution times for the update operation.</p>
Full article ">Figure 5
<p>Execution times for the simple select operation.</p>
Full article ">Figure 6
<p>Execution times for select using a single join operation.</p>
Full article ">Figure 7
<p>Execution times for the select with the two joins operation.</p>
Full article ">Figure 8
<p>Execution times for select with multiple joins.</p>
Full article ">Figure 9
<p>Execution times for soft delete operation.</p>
Full article ">Figure 10
<p>Execution times for hard delete operation.</p>
Full article ">
19 pages, 2456 KiB  
Article
A New Ontology-Based Method for Arabic Sentiment Analysis
by Safaa M. Khabour, Qasem A. Al-Radaideh and Dheya Mustafa
Big Data Cogn. Comput. 2022, 6(2), 48; https://doi.org/10.3390/bdcc6020048 - 29 Apr 2022
Cited by 10 | Viewed by 4391
Abstract
Arabic sentiment analysis is a process that aims to extract the subjective opinions of different users about different subjects since these opinions and sentiments are used to recognize their perspectives and judgments in a particular domain. Few research studies addressed semantic-oriented approaches for [...] Read more.
Arabic sentiment analysis is a process that aims to extract the subjective opinions of different users about different subjects since these opinions and sentiments are used to recognize their perspectives and judgments in a particular domain. Few research studies addressed semantic-oriented approaches for Arabic sentiment analysis based on domain ontologies and features’ importance. In this paper, we built a semantic orientation approach for calculating overall polarity from the Arabic subjective texts based on built domain ontology and the available sentiment lexicon. We used the ontology concepts to extract and weight the semantic domain features by considering their levels in the ontology tree and their frequencies in the dataset to compute the overall polarity of a given textual review based on the importance of each domain feature. For evaluation, an Arabic dataset from the hotels’ domain was selected to build the domain ontology and to test the proposed approach. The overall accuracy and f-measure reach 79.20% and 78.75%, respectively. Results showed that the approach outperformed the other semantic orientation approaches, and it is an appealing approach to be used for Arabic sentiment analysis. Full article
Show Figures

Figure 1

Figure 1
<p>Overall approach design.</p>
Full article ">Figure 2
<p>Graphical model representation of LDA.</p>
Full article ">Figure 3
<p>The tools and libraries that are used for semantic orientation evaluation.</p>
Full article ">Figure 4
<p>Performance evaluation of ontology for the four implemented schemes.</p>
Full article ">Figure 5
<p>Accuracy of different state of the art approaches for ASA.</p>
Full article ">
28 pages, 772 KiB  
Article
Incentive Mechanisms for Smart Grid: State of the Art, Challenges, Open Issues, Future Directions
by Sweta Bhattacharya, Rajeswari Chengoden, Gautam Srivastava, Mamoun Alazab, Abdul Rehman Javed, Nancy Victor, Praveen Kumar Reddy Maddikunta and Thippa Reddy Gadekallu
Big Data Cogn. Comput. 2022, 6(2), 47; https://doi.org/10.3390/bdcc6020047 - 27 Apr 2022
Cited by 37 | Viewed by 6655
Abstract
Smart grids (SG) are electricity grids that communicate with each other, provide reliable information, and enable administrators to operate energy supplies across the country, ensuring optimized reliability and efficiency. The smart grid contains sensors that measure and transmit data to adjust the flow [...] Read more.
Smart grids (SG) are electricity grids that communicate with each other, provide reliable information, and enable administrators to operate energy supplies across the country, ensuring optimized reliability and efficiency. The smart grid contains sensors that measure and transmit data to adjust the flow of electricity automatically based on supply/demand, and thus, responding to problems becomes quicker and easier. This also plays a crucial role in controlling carbon emissions, by avoiding energy losses during peak load hours and ensuring optimal energy management. The scope of big data analytics in smart grids is huge, as they collect information from raw data and derive intelligent information from the same. However, these benefits of the smart grid are dependent on the active and voluntary participation of the consumers in real-time. Consumers need to be motivated and conscious to avail themselves of the achievable benefits. Incentivizing the appropriate actor is an absolute necessity to encourage prosumers to generate renewable energy sources (RES) and motivate industries to establish plants that support sustainable and green-energy-based processes or products. The current study emphasizes similar aspects and presents a comprehensive survey of the start-of-the-art contributions pertinent to incentive mechanisms in smart grids, which can be used in smart grids to optimize the power distribution during peak times and also reduce carbon emissions. The various technologies, such as game theory, blockchain, and artificial intelligence, used in implementing incentive mechanisms in smart grids are discussed, followed by different incentive projects being implemented across the globe. The lessons learnt, challenges faced in such implementations, and open issues such as data quality, privacy, security, and pricing related to incentive mechanisms in SG are identified to guide the future scope of research in this sector. Full article
Show Figures

Figure 1

Figure 1
<p>Actors involved in SG environment.</p>
Full article ">Figure 2
<p>Blockchain model for providing incentives in SG.</p>
Full article ">Figure 3
<p>FL Model for providing incentives in SG.</p>
Full article ">
23 pages, 1539 KiB  
Article
A Non-Uniform Continuous Cellular Automata for Analyzing and Predicting the Spreading Patterns of COVID-19
by Puspa Eosina, Aniati Murni Arymurthy and Adila Alfa Krisnadhi
Big Data Cogn. Comput. 2022, 6(2), 46; https://doi.org/10.3390/bdcc6020046 - 24 Apr 2022
Cited by 3 | Viewed by 3843
Abstract
During the COVID-19 outbreak, modeling the spread of infectious diseases became a challenging research topic due to its rapid spread and high mortality rate. The main objective of a standard epidemiological model is to estimate the number of infected, suspected, and recovered from [...] Read more.
During the COVID-19 outbreak, modeling the spread of infectious diseases became a challenging research topic due to its rapid spread and high mortality rate. The main objective of a standard epidemiological model is to estimate the number of infected, suspected, and recovered from the illness by mathematical modeling. This model does not capture how the disease transmits between neighboring regions through interaction. A more general framework such as Cellular Automata (CA) is required to accommodate a more complex spatial interaction within the epidemiological model. The critical issue of modeling in the spread of diseases is how to reduce the prediction error. This research aims to formulate the influence of the interaction of a neighborhood on the spreading pattern of COVID-19 using a neighborhood frame model in a Cellular-Automata (CA) approach and obtain a predictive model for the COVID-19 spread with the error reduction to improve the model. We propose a non-uniform continuous CA (N-CCA) as our contribution to demonstrate the influence of interactions on the spread of COVID-19. The model has succeeded in demonstrating the influence of the interaction between regions on the COVID-19 spread, as represented by the coefficients obtained. These coefficients result from multiple regression models. The coefficient obtained represents the population’s behavior interacting with its neighborhood in a cell and influences the number of cases that occur the next day. The evaluation of the N-CCA model is conducted by root mean square error (RMSE) for the difference in the number of cases between prediction and real cases per cell in each region. This study demonstrates that this approach improves the prediction of accuracy for 14 days in the future using data points from the past 42 days, compared to a baseline model. Full article
Show Figures

Figure 1

Figure 1
<p>The workflow.</p>
Full article ">Figure 2
<p>Neighborhoods. (<b>a</b>) A Von Neumann-neighborhood with a radius of 1. (<b>b</b>) A Moore-neighborhood with a radius of 1.</p>
Full article ">Figure 3
<p>The state diagram for the SIRD model.</p>
Full article ">Figure 4
<p>The state transition N-CCA diagram model.</p>
Full article ">Figure 5
<p>The configuration of regions of China in cellular space.</p>
Full article ">Figure 6
<p>The coordinate cells of China in cellular space.</p>
Full article ">Figure 7
<p>The severity level definition for visualization.</p>
Full article ">Figure 8
<p>The COVID-19 spreading pattern in China for 8 weeks.</p>
Full article ">Figure 9
<p>The model fits the real data of cases per cell in China.</p>
Full article ">Figure 10
<p>The pattern prediction result for two weeks (<b>a</b>) and the real cases (<b>b</b>) for the next 14 days (9th week and 10th week).</p>
Full article ">Figure 11
<p>The average error per cell of the model fit for each region.</p>
Full article ">Figure 12
<p>The error of the model fit for Hubei.</p>
Full article ">Figure 13
<p>The average of the cases prediction per cell in China.</p>
Full article ">Figure 14
<p>The average of the cases prediction per cell for Hubei.</p>
Full article ">Figure 15
<p>The trend of prediction error below 10 cases per cell until the 14th prediction.</p>
Full article ">Figure 16
<p>The trend of prediction error below 40 cases per cell until the 14th prediction.</p>
Full article ">Figure 17
<p>The trend of prediction error to about 160 cases per cell until the 14th prediction.</p>
Full article ">
29 pages, 5206 KiB  
Article
Virtual Reality-Based Stimuli for Immersive Car Clinics: A Performance Evaluation Model
by Alexandre Costa Henriques, Thiago Barros Murari, Jennifer Callans, Alexandre Maguino Pinheiro Silva, Antonio Lopes Apolinario, Jr. and Ingrid Winkler
Big Data Cogn. Comput. 2022, 6(2), 45; https://doi.org/10.3390/bdcc6020045 - 20 Apr 2022
Cited by 2 | Viewed by 4159
Abstract
This study proposes a model to evaluate the performance of virtual reality-based stimuli for immersive car clinics. The model considered Attribute Importance, Stimuli Efficacy and Stimuli Cost factors and the method was divided into three stages: we defined the importance of fourteen attributes [...] Read more.
This study proposes a model to evaluate the performance of virtual reality-based stimuli for immersive car clinics. The model considered Attribute Importance, Stimuli Efficacy and Stimuli Cost factors and the method was divided into three stages: we defined the importance of fourteen attributes relevant to a car clinic based on the perceptions of Marketing and Design experts; then we defined the efficacy of five virtual stimuli based on the perceptions of Product Development and Virtual Reality experts; and we used a cost factor to calculate the efficiency of the five virtual stimuli in relation to the physical. The Marketing and Design experts identified a new attribute, Scope; eleven of the fifteen attributes were rated as Important or Very Important, while four were removed from the model due to being considered irrelevant. According to our performance evaluation model, virtual stimuli have the same efficacy as physical stimuli. However, when cost is considered, virtual stimuli outperform physical stimuli, particularly virtual stimuli with glasses. We conclude that virtual stimuli have the potential to reduce the cost and time required to develop new stimuli in car clinics, but with concerns related to hardware, software, and other definitions. Full article
(This article belongs to the Special Issue Virtual Reality, Augmented Reality, and Human-Computer Interaction)
Show Figures

Figure 1

Figure 1
<p>Performance Evaluation Model Schematics, where the stimulus efficiency is based on stimulus cost and efficacy.</p>
Full article ">Figure 2
<p>Professional experience of the experts in Market and Design Group regarding the (<b>a</b>) Number of Clinics they participated and (<b>b</b>) Year of Experience in the industry.</p>
Full article ">Figure 3
<p>Boxplot with median and average of all attributes for Marketing and Design Group. Six attributes have their median classified as Very Important: Visual-Spatial, Data Security, Visual Quality, Depth Perception, Interaction and Manipulation and Scope. Black circle (•) represent the median and asterisk (*) represent an outlier. Identical outliers points are represented by the quantity of asterisk symmetrically offset in the graph. The blue color rectangle is the interquartile range and the rectangle inside the blue color rectangle is the median confidence interval box with a confidence interval of 95%.</p>
Full article ">Figure 4
<p>Attribute importance based on the clusterization, median, median confidence interval, variance, coefficient of variation and boxplot interpretation. Black circle (•) represent the median and asterisk (*) represent an outlier. Identical outliers are represented by the quantity of asterisk symmetrically offset in the graph.</p>
Full article ">Figure 5
<p>Marketing and Design Group—stimuli efficacy score for all attributes.</p>
Full article ">Figure 6
<p>Product Development and VR Group Profile.</p>
Full article ">Figure 7
<p>Interaction and Manipulation Attribute. Physical and Hybrid stimuli have the same median for Interaction and Manipulation attribute, followed by Vis + Gl and Vis + V stimuli that have statistically the same median and at the end Visual and Vis + Ac stimuli with a lower and same median. Black circle (•) represent the median, plus within a circle (⊕) is the mean and asterisk (*) represent an outlier. Identical outliers are represented by the quantity of asterisk symmetrically offset in the graph.</p>
Full article ">Figure 8
<p>Visual-Spatial Attribute. All the stimuli have the same median. Black circle (•) represent the median, plus within a circle (⊕) is the mean and asterisk (*) represent an outlier. Identical outliers are represented by the quantity of asterisk symmetrically offset in the graph.</p>
Full article ">Figure 9
<p>Visual Quality Attribute. The median is statistically similar for all the virtual stimuli. It indicate that any virtual stimuli have the same performance, delivering the same level of the Visual Quality as the Physical stimulus. Black circle (•) represent the median, plus within a circle (⊕) is the mean.</p>
Full article ">Figure 10
<p>Intuitiveness Attribute. Except for the Hybrid stimulus, all the other stimuli perform equivalent. Black circle (•) represent the median, plus within a circle (⊕) is the mean.</p>
Full article ">Figure 11
<p>Security Attribute. Regarding the Data Security, the better performance of the virtual stimuli in relation to the physical may be related to the difficulty of handling the Physical stimulus during the car clinics process, since the construction up to the interviews. Black circle (•) represent the median, plus within a circle (⊕) is the mean and asterisk (*) represent an outlier. Identical outliers are represented by the quantity of asterisk symmetrically offset in the graph.</p>
Full article ">Figure 12
<p>Comfort Attribute. The Hybrid stimulus has a median at the same level as the Physical stimulus. Any virtual stimulus is worse than the hybrid stimulus. Black circle (•) represent the median, plus within a circle (⊕) is the mean and asterisk (*) represent an outlier. Identical outliers are represented by the quantity of asterisk symmetrically offset in the graph.</p>
Full article ">Figure 13
<p>Depth Perception Attribute. Vis + Gl and Vis + V stimuli performed slightly better than the other stimuli, but all virtual stimuli medians are statistically the same than physical stimulus. Black circle (•) represent the median, plus within a circle (⊕) is the mean and asterisk (*) represent an outlier. Identical outliers are represented by the quantity of asterisk symmetrically offset in the graph.</p>
Full article ">Figure 14
<p>Movement Attribute. All the virtual stimuli performed similarly except for the Hybrid stimulus, the performance of which is slightly better than that of the others and quite like the Physical stimulus. Black circle (•) represent the median, plus within a circle (⊕) is the mean and asterisk (*) represent an outlier. Identical outliers are represented by the quantity of asterisk symmetrically offset in the graph.</p>
Full article ">Figure 15
<p>Color and Texture Attribute. All virtual stimuli presented the same median of the physical prototype for Color and Texture attribute. The variation range is high for all virtual attributes. This high variation may indicate the usage of virtual models or equipment with different levels of quality by the experts interviewed. Black circle (•) represent the median, plus within a circle (⊕) is the mean.</p>
Full article ">Figure 16
<p>Flexibility Attribute. Virtual stimuli have a median higher than the physical attribute for Flexibility attribute. Black circle (•) represent the median, plus within a circle (⊕) is the mean and asterisk (*) represent an outlier. Identical outliers are represented by the quantity of asterisk symmetrically offset in the graph.</p>
Full article ">Figure 17
<p>All virtual stimuli presented the same median of the physical prototype for scope attribute. The variation range is high for all virtual attributes. Black circle (•) represent the median, plus within a circle (⊕) is the mean.</p>
Full article ">Figure 18
<p>Summary of attribute for each stimulus and a sum of the attribute’s values at the bottom for stimuli general efficacy comparison of Product Development and VR group. No data available (NDA) for Hybrid Stimulus.</p>
Full article ">Figure 19
<p>Summary of attribute for each stimulus and a sum of the attribute’s values at the bottom for stimuli general efficacy comparison of Marketing and Design Group.</p>
Full article ">Figure 20
<p>Input-Output Concept.</p>
Full article ">Figure 21
<p>Performance Evaluation Model Outcome.</p>
Full article ">Figure 22
<p>Performance Evaluation Model Outcome—Efficiency Factor.</p>
Full article ">Figure 23
<p>Performance Evaluation Model Outcome—Spider Chart.</p>
Full article ">Figure 24
<p>Evaluation Performance Model Schematic Results.</p>
Full article ">
40 pages, 14654 KiB  
Review
Deep Learning Approaches for Video Compression: A Bibliometric Analysis
by Ranjeet Vasant Bidwe, Sashikala Mishra, Shruti Patil, Kailash Shaw, Deepali Rahul Vora, Ketan Kotecha and Bhushan Zope
Big Data Cogn. Comput. 2022, 6(2), 44; https://doi.org/10.3390/bdcc6020044 - 19 Apr 2022
Cited by 39 | Viewed by 7903
Abstract
Every data and kind of data need a physical drive to store it. There has been an explosion in the volume of images, video, and other similar data types circulated over the internet. Users using the internet expect intelligible data, even under the [...] Read more.
Every data and kind of data need a physical drive to store it. There has been an explosion in the volume of images, video, and other similar data types circulated over the internet. Users using the internet expect intelligible data, even under the pressure of multiple resource constraints such as bandwidth bottleneck and noisy channels. Therefore, data compression is becoming a fundamental problem in wider engineering communities. There has been some related work on data compression using neural networks. Various machine learning approaches are currently applied in data compression techniques and tested to obtain better lossy and lossless compression results. A very efficient and variety of research is already available for image compression. However, this is not the case for video compression. Because of the explosion of big data and the excess use of cameras in various places globally, around 82% of the data generated involve videos. Proposed approaches have used Deep Neural Networks (DNNs), Recurrent Neural Networks (RNNs), and Generative Adversarial Networks (GANs), and various variants of Autoencoders (AEs) are used in their approaches. All newly proposed methods aim to increase performance (reducing bitrate up to 50% at the same data quality and complexity). This paper presents a bibliometric analysis and literature survey of all Deep Learning (DL) methods used in video compression in recent years. Scopus and Web of Science are well-known research databases. The results retrieved from them are used for this analytical study. Two types of analysis are performed on the extracted documents. They include quantitative and qualitative results. In quantitative analysis, records are analyzed based on their citations, keywords, source of publication, and country of publication. The qualitative analysis provides information on DL-based approaches for video compression, as well as the advantages, disadvantages, and challenges of using them. Full article
Show Figures

Figure 1

Figure 1
<p>Types of compression.</p>
Full article ">Figure 2
<p>Applications of video compression.</p>
Full article ">Figure 3
<p>Organization of paper.</p>
Full article ">Figure 4
<p>Search Strategy.</p>
Full article ">Figure 5
<p>Comparative analysis of publications per year.</p>
Full article ">Figure 6
<p>Alluvial diagram showing a correlation between authors, years, and source titles of top 20 cited documents.</p>
Full article ">Figure 7
<p>Top keywords used in Scopus.</p>
Full article ">Figure 8
<p>Category of publication.</p>
Full article ">Figure 9
<p>Publishing country: Scopus.</p>
Full article ">Figure 10
<p>Publication country: WoS.</p>
Full article ">Figure 11
<p>Publishers in Scopus.</p>
Full article ">Figure 12
<p>Publishers in WoS.</p>
Full article ">Figure 13
<p>Co-occurrence analysis (author keywords).</p>
Full article ">Figure 14
<p>Citation analysis of documents.</p>
Full article ">Figure 15
<p>Citation analysis of documents.</p>
Full article ">Figure 16
<p>Citation analysis by author.</p>
Full article ">Figure 17
<p>Bibliographic analysis of documents.</p>
Full article ">Figure 18
<p>Title of the publication and citations network visualization.</p>
Full article ">Figure 19
<p>Timeline of video compression algorithms.</p>
Full article ">Figure 20
<p>Traditional approach used by video codecs.</p>
Full article ">Figure 21
<p>Video compression: issues and advantages of DNN approach.</p>
Full article ">Figure 22
<p>Timeline for DNN based video compression.</p>
Full article ">Figure 23
<p>Video compression technologies.</p>
Full article ">Figure 24
<p>Performance metrics for video compression.</p>
Full article ">Figure 25
<p>Datasets used in video compression with a year of introduction.</p>
Full article ">Figure 26
<p>Challenges in video compression.</p>
Full article ">
25 pages, 664 KiB  
Article
New Efficient Approach to Solve Big Data Systems Using Parallel Gauss–Seidel Algorithms
by Shih Yu Chang, Hsiao-Chun Wu and Yifan Wang
Big Data Cogn. Comput. 2022, 6(2), 43; https://doi.org/10.3390/bdcc6020043 - 19 Apr 2022
Viewed by 2844
Abstract
In order to perform big-data analytics, regression involving large matrices is often necessary. In particular, large scale regression problems are encountered when one wishes to extract semantic patterns for knowledge discovery and data mining. When a large matrix can be processed in its [...] Read more.
In order to perform big-data analytics, regression involving large matrices is often necessary. In particular, large scale regression problems are encountered when one wishes to extract semantic patterns for knowledge discovery and data mining. When a large matrix can be processed in its factorized form, advantages arise in terms of computation, implementation, and data-compression. In this work, we propose two new parallel iterative algorithms as extensions of the Gauss–Seidel algorithm (GSA) to solve regression problems involving many variables. The convergence study in terms of error-bounds of the proposed iterative algorithms is also performed, and the required computation resources, namely time- and memory-complexities, are evaluated to benchmark the efficiency of the proposed new algorithms. Finally, the numerical results from both Monte Carlo simulations and real-world datasets are presented to demonstrate the striking effectiveness of our proposed new methods. Full article
Show Figures

Figure 1

Figure 1
<p>Illustration of the proposed new divide-and-iterate approach.</p>
Full article ">Figure 2
<p>Illustration of the cyclic and block distributions for <span class="html-italic">p</span> = 4.</p>
Full article ">Figure 3
<p>Illustration of an inner-product computation on the parallel platform using cyclic distribution (<math display="inline"><semantics> <mrow> <mi>p</mi> <mo>=</mo> <mn>4</mn> </mrow> </semantics></math> and <math display="inline"><semantics> <mrow> <mi>m</mi> <mo>=</mo> <mn>12</mn> </mrow> </semantics></math>).</p>
Full article ">Figure 4
<p>The effect of <math display="inline"><semantics> <msub> <mi>ϱ</mi> <mi mathvariant="bold">W</mi> </msub> </semantics></math> on the convergence of a random consistent system.</p>
Full article ">Figure 5
<p>The effect of <math display="inline"><semantics> <msub> <mi>ϱ</mi> <mi mathvariant="bold">H</mi> </msub> </semantics></math> on the convergence of a random inconsistent system.</p>
Full article ">Figure 6
<p>Error-convergence comparison for the wine data and the bike-rental data.</p>
Full article ">Figure 7
<p>Time-complexity versus <span class="html-italic">n</span> for an arbitrary consistent system (<math display="inline"><semantics> <mrow> <mi>k</mi> <mo>=</mo> <mn>100</mn> </mrow> </semantics></math>, <math display="inline"><semantics> <mrow> <mi>m</mi> <mo>=</mo> <mn>1.25</mn> <mspace width="1.70709pt"/> <mi>n</mi> </mrow> </semantics></math>).</p>
Full article ">Figure 8
<p>Time-complexity versus the number of processors <span class="html-italic">p</span> and the dimension <span class="html-italic">k</span> subject to <math display="inline"><semantics> <mrow> <mi>ϵ</mi> <mo>=</mo> <msup> <mn>10</mn> <mrow> <mo>−</mo> <mn>5</mn> </mrow> </msup> </mrow> </semantics></math> for an arbitrary consistent system (<math display="inline"><semantics> <mrow> <mi>m</mi> <mo>=</mo> <mn>1.25</mn> <mspace width="1.70709pt"/> <mi>n</mi> </mrow> </semantics></math>).</p>
Full article ">Figure 9
<p>Time-complexity versus <span class="html-italic">n</span> for an arbitrary inconsistent system (<math display="inline"><semantics> <mrow> <mi>k</mi> <mo>=</mo> <mn>100</mn> </mrow> </semantics></math>, <math display="inline"><semantics> <mrow> <mi>m</mi> <mo>=</mo> <mn>1.25</mn> <mspace width="1.70709pt"/> <mi>n</mi> </mrow> </semantics></math>). The curves denoted by “ZF” illustrate the theoretical time-complexity error-bounds for solving the original system involving the matrix <math display="inline"><semantics> <mi mathvariant="bold">V</mi> </semantics></math> without factorization (theoretical results from [<a href="#B46-BDCC-06-00043" class="html-bibr">46</a>]).</p>
Full article ">Figure 10
<p>Time-complexity versus the number of processors <span class="html-italic">p</span> and the dimension <span class="html-italic">k</span> subject to <math display="inline"><semantics> <mrow> <mi>ϵ</mi> <mo>=</mo> <msup> <mn>10</mn> <mrow> <mo>−</mo> <mn>5</mn> </mrow> </msup> </mrow> </semantics></math> for an inconsistent system (<math display="inline"><semantics> <mrow> <mi>m</mi> <mo>=</mo> <mn>1.25</mn> <mspace width="1.70709pt"/> <mi>n</mi> </mrow> </semantics></math>).</p>
Full article ">Figure 11
<p>Time-complexity versus <span class="html-italic">n</span> for <math display="inline"><semantics> <mi mathvariant="bold">V</mi> </semantics></math> with different spectral radii subject to <math display="inline"><semantics> <mi>ϵ</mi> </semantics></math>=<math display="inline"><semantics> <msup> <mn>10</mn> <mrow> <mo>−</mo> <mn>10</mn> </mrow> </msup> </semantics></math> for an arbitrary inconsistent system (<math display="inline"><semantics> <mrow> <mi>m</mi> <mo>=</mo> <mn>1.25</mn> <mspace width="1.70709pt"/> <mi>n</mi> </mrow> </semantics></math>) such that <math display="inline"><semantics> <mrow> <mi>η</mi> <mo>(</mo> <msup> <mi mathvariant="bold">V</mi> <mo>∗</mo> </msup> <mi mathvariant="bold">V</mi> <mo>)</mo> </mrow> </semantics></math> = <math display="inline"><semantics> <mrow> <mn>0.9</mn> </mrow> </semantics></math>, <math display="inline"><semantics> <mrow> <mn>0.5</mn> </mrow> </semantics></math>, and <math display="inline"><semantics> <mrow> <mn>0.1</mn> </mrow> </semantics></math>.</p>
Full article ">Figure 12
<p>The memory -complexity versus <span class="html-italic">n</span> for a consistent system (<math display="inline"><semantics> <mrow> <mi>m</mi> <mo>=</mo> <mn>1.25</mn> <mspace width="1.70709pt"/> <mi>n</mi> </mrow> </semantics></math>).</p>
Full article ">Figure 13
<p>The memory -complexity versus <span class="html-italic">n</span> for an inconsistent system (<math display="inline"><semantics> <mrow> <mi>m</mi> <mo>=</mo> <mn>1.25</mn> <mspace width="1.70709pt"/> <mi>n</mi> </mrow> </semantics></math>).</p>
Full article ">
18 pages, 1307 KiB  
Article
An Emergency Event Detection Ensemble Model Based on Big Data
by Khalid Alfalqi and Martine Bellaiche
Big Data Cogn. Comput. 2022, 6(2), 42; https://doi.org/10.3390/bdcc6020042 - 16 Apr 2022
Cited by 5 | Viewed by 4074
Abstract
Emergency events arise when a serious, unexpected, and often dangerous threat affects normal life. Hence, knowing what is occurring during and after emergency events is critical to mitigate the effect of the incident on humans’ life, on the environment and our infrastructures, as [...] Read more.
Emergency events arise when a serious, unexpected, and often dangerous threat affects normal life. Hence, knowing what is occurring during and after emergency events is critical to mitigate the effect of the incident on humans’ life, on the environment and our infrastructures, as well as the inherent financial consequences. Social network utilization in emergency event detection models can play an important role as information is shared and users’ status is updated once an emergency event occurs. Besides, big data proved its significance as a tool to assist and alleviate emergency events by processing an enormous amount of data over a short time interval. This paper shows that it is necessary to have an appropriate emergency event detection ensemble model (EEDEM) to respond quickly once such unfortunate events occur. Furthermore, it integrates Snapchat maps to propose a novel method to pinpoint the exact location of an emergency event. Moreover, merging social networks and big data can accelerate the emergency event detection system: social network data, such as those from Twitter and Snapchat, allow us to manage, monitor, analyze and detect emergency events. The main objective of this paper is to propose a novel and efficient big data-based EEDEM to pinpoint the exact location of emergency events by employing the collected data from social networks, such as “Twitter” and “Snapchat”, while integrating big data (BD) and machine learning (ML). Furthermore, this paper evaluates the performance of five ML base models and the proposed ensemble approach to detect emergency events. Results show that the proposed ensemble approach achieved a very high accuracy of 99.87% which outperform the other base models. Moreover, the proposed base models yields a high level of accuracy: 99.72%, 99.70% for LSTM and decision tree, respectively, with an acceptable training time. Full article
(This article belongs to the Topic Big Data and Artificial Intelligence)
Show Figures

Figure 1

Figure 1
<p>Overall of big data layers.</p>
Full article ">Figure 2
<p>Data collection model.</p>
Full article ">Figure 3
<p>The 5-Fold cross validation.</p>
Full article ">Figure 4
<p>The proposed steps of the emergency event detection ensemble model.</p>
Full article ">Figure 5
<p>Words cloud of tweets.</p>
Full article ">Figure 6
<p>Explosion location of Beirut Port.</p>
Full article ">Figure 7
<p>The performance evaluation of the Snapchat classification model.</p>
Full article ">Figure 8
<p>The performance evaluation of each model separately.</p>
Full article ">Figure 9
<p>Processing time of models classification based on window size.</p>
Full article ">Figure 10
<p>The impacts of the selected keywords.</p>
Full article ">
9 pages, 473 KiB  
Article
Revisiting Gradient Boosting-Based Approaches for Learning Imbalanced Data: A Case of Anomaly Detection on Power Grids
by Maya Hilda Lestari Louk and Bayu Adhi Tama
Big Data Cogn. Comput. 2022, 6(2), 41; https://doi.org/10.3390/bdcc6020041 - 16 Apr 2022
Cited by 8 | Viewed by 4050
Abstract
Gradient boosting ensembles have been used in the cyber-security area for many years; nonetheless, their efficacy and accuracy for intrusion detection systems (IDSs) remain questionable, particularly when dealing with problems involving imbalanced data. This article fills the void in the existing body of [...] Read more.
Gradient boosting ensembles have been used in the cyber-security area for many years; nonetheless, their efficacy and accuracy for intrusion detection systems (IDSs) remain questionable, particularly when dealing with problems involving imbalanced data. This article fills the void in the existing body of knowledge by evaluating the performance of gradient boosting-based ensembles, including gradient boosting machine (GBM), extreme gradient boosting (XGBoost), LightGBM, and CatBoost. This paper assesses the performance of various imbalanced data sets using the Matthew correlation coefficient (MCC), area under the receiver operating characteristic curve (AUC), and F1 metrics. The article discusses an example of anomaly detection in an industrial control network and, more specifically, threat detection in a cyber-physical smart power grid. The tests’ results indicate that CatBoost surpassed its competitors, regardless of the imbalance ratio of the data sets. Moreover, LightGBM showed a much lower performance value and had more variability across the data sets. Full article
(This article belongs to the Special Issue Cyber Security in Big Data Era)
Show Figures

Figure 1

Figure 1
<p>Average performance of all algorithms across various power system data sets.</p>
Full article ">Figure 2
<p>The skewness and spread of algorithms’ performance over two distinct scenarios.</p>
Full article ">Figure 3
<p>Hierarchical clusters (shown in three distinct colors) of algorithms and imbalanced data sets in terms of (<b>a</b>) MCC, (<b>b</b>) AUC, and (<b>c</b>) F1 metrics. The color in each cell represents the corresponding performance value (light yellow: low; dark red: high).</p>
Full article ">Figure 4
<p>Hierarchical clusters (shown in three distinct colors) of algorithms and balanced data sets in terms of (<b>a</b>) MCC, (<b>b</b>) AUC, and (<b>c</b>) F1 metrics. The color in each cell represents the corresponding performance value (light yellow: low; dark red: high).</p>
Full article ">
13 pages, 1797 KiB  
Article
Breast and Lung Anticancer Peptides Classification Using N-Grams and Ensemble Learning Techniques
by Ayad Rodhan Abbas, Bashar Saadoon Mahdi and Osamah Younus Fadhil
Big Data Cogn. Comput. 2022, 6(2), 40; https://doi.org/10.3390/bdcc6020040 - 12 Apr 2022
Cited by 2 | Viewed by 3586
Abstract
Anticancer peptides (ACPs) are short protein sequences; they perform functions like some hormones and enzymes inside the body. The role of any protein or peptide is related to its structure and the sequence of amino acids that make up it. There are 20 [...] Read more.
Anticancer peptides (ACPs) are short protein sequences; they perform functions like some hormones and enzymes inside the body. The role of any protein or peptide is related to its structure and the sequence of amino acids that make up it. There are 20 types of amino acids in humans, and each of them has a particular characteristic according to its chemical structure. Current machine and deep learning models have been used to classify ACPs problems. However, these models have neglected Amino Acid Repeats (AARs) that play an essential role in the function and structure of peptides. Therefore, in this paper, ACPs offer a promising route for novel anticancer peptides by extracting AARs based on N-Grams and k-mers using two peptides’ datasets. These datasets pointed to breast and lung cancer cells assembled and curated manually from the Cancer Peptide and Protein Database (CancerPPD). Every dataset consists of a sequence of peptides and their synthesis and anticancer activity on breast and lung cancer cell lines. Five different feature selection methods were used in this paper to improve classification performance and reduce the experimental costs. After that, ACPs were classified using four classifiers, namely AdaBoost, Random Forest Tree (RFT), Multi-class Support Vector Machine (SVM), and Multi-Layer Perceptron (MLP). These classifiers were evaluated by applying five well-known evaluation metrics. Experimental results showed that the breast and lung ACPs classification process provided an accurate performance that reached 89.25% and 92.56%, respectively. In terms of AUC, it reached 95.35% and 96.92% for both breast and lung ACPs, respectively. The proposed classifiers performed competently somewhat equally in AUC, accuracy, precision, F-measures, and recall, except for Multi-class SVM-based feature selection, which showed superior performance. As a result, this paper significantly improved the predictive performance that can effectively distinguish ACPs as virtual inactive, experimental inactive, moderately active, and very active. Full article
(This article belongs to the Topic Machine and Deep Learning)
Show Figures

Figure 1

Figure 1
<p>Encoded N-Grams extraction using k-mers.</p>
Full article ">Figure 2
<p>The architecture of the proposed model.</p>
Full article ">Figure 3
<p>Performance evaluation of the breast ACPs classification with different N-Grams.</p>
Full article ">Figure 4
<p>Performance evaluation of the lung ACPs classification with different N-Grams.</p>
Full article ">Figure 5
<p>Performance of five feature selection methods on the breast ACPs using only 35 features.</p>
Full article ">Figure 6
<p>Performance of five feature selection methods on the lung ACPs using only 31 features.</p>
Full article ">Figure 7
<p>Performance of four classifiers using the breast ACPs.</p>
Full article ">Figure 8
<p>Performance of four classifiers using the lung anticancer peptides.</p>
Full article ">
24 pages, 3689 KiB  
Article
PCB Component Detection Using Computer Vision for Hardware Assurance
by Wenwei Zhao, Suprith Reddy Gurudu, Shayan Taheri, Shajib Ghosh, Mukhil Azhagan Mallaiyan Sathiaseelan and Navid Asadizanjani
Big Data Cogn. Comput. 2022, 6(2), 39; https://doi.org/10.3390/bdcc6020039 - 8 Apr 2022
Cited by 17 | Viewed by 6916
Abstract
Printed circuit board (PCB) assurance in the optical domain is a crucial field of study. Though there are many existing PCB assurance methods using image processing, computer vision (CV), and machine learning (ML), the PCB field is complex and increasingly evolving, so new [...] Read more.
Printed circuit board (PCB) assurance in the optical domain is a crucial field of study. Though there are many existing PCB assurance methods using image processing, computer vision (CV), and machine learning (ML), the PCB field is complex and increasingly evolving, so new techniques are required to overcome the emerging problems. Existing ML-based methods outperform traditional CV methods; however, they often require more data, have low explainability, and can be difficult to adapt when a new technology arises. To overcome these challenges, CV methods can be used in tandem with ML methods. In particular, human-interpretable CV algorithms such as those that extract color, shape, and texture features increase PCB assurance explainability. This allows for incorporation of prior knowledge, which effectively reduces the number of trainable ML parameters and, thus, the amount of data needed to achieve high accuracy when training or retraining an ML model. Hence, this study explores the benefits and limitations of a variety of common computer vision-based features for the task of PCB component detection. The study results indicate that color features demonstrate promising performance for PCB component detection. The purpose of this paper is to facilitate collaboration between the hardware assurance, computer vision, and machine learning communities. Full article
(This article belongs to the Topic Applied Computer Vision and Pattern Recognition)
Show Figures

Figure 1

Figure 1
<p>The framework for bill of materials extraction for PCB assurance as proposed in [<a href="#B3-BDCC-06-00039" class="html-bibr">3</a>].</p>
Full article ">Figure 2
<p>The processing workflow.</p>
Full article ">Figure 3
<p>(<b>a</b>) The original PCB image; (<b>b</b>) the corresponding bbox labels; (<b>c</b>) the bbox ground truth heatmap for this PCB image; (<b>d</b>) and the heatmap overlay on the PCB image.</p>
Full article ">Figure 4
<p>(<b>a</b>) The Original PCB Image; (<b>b</b>) R Channel of the Image; (<b>c</b>) G Channel of the Image; (<b>d</b>) B Channel of The Image.</p>
Full article ">Figure 5
<p>(<b>a</b>) The original PCB image; (<b>b</b>) H channel of the image; (<b>c</b>) S channel of the image; (<b>d</b>) V channel of the image.</p>
Full article ">Figure 6
<p>(<b>a</b>) The original PCB image; (<b>b</b>) L channel of the image; (<b>c</b>) <b>A</b> channel of the image; (<b>d</b>) <b>B</b> channel of the image.</p>
Full article ">Figure 7
<p>Determinant of Hessian–Blobs feature images with different label mask k-size. (<b>a</b>) Original image patch, and (<b>b</b>–<b>f</b>) respective experimental results from 25 to 5 image mask size.These six images are different images.</p>
Full article ">Figure 8
<p>Corner Subpixel feature images with different label mask k-size. (<b>a</b>) Original image patch, and (<b>b</b>–<b>f</b>) respective experimental results from 25 to 5 image mask size. These six images are different images.</p>
Full article ">Figure 9
<p>(<b>a</b>) A part of the original PCB image; (<b>b</b>) filtered image when <math display="inline"><semantics> <mrow> <mi>θ</mi> <mo>=</mo> <msup> <mn>0</mn> <mo>∘</mo> </msup> </mrow> </semantics></math>; (<b>c</b>) filtered image when <math display="inline"><semantics> <mrow> <mi>θ</mi> <mo>=</mo> <msup> <mn>30</mn> <mo>∘</mo> </msup> </mrow> </semantics></math>; (<b>d</b>) filtered image when <math display="inline"><semantics> <mrow> <mi>θ</mi> <mo>=</mo> <msup> <mn>60</mn> <mo>∘</mo> </msup> </mrow> </semantics></math>; (<b>e</b>) filtered image when <math display="inline"><semantics> <mrow> <mi>θ</mi> <mo>=</mo> <msup> <mn>90</mn> <mo>∘</mo> </msup> </mrow> </semantics></math>; (<b>f</b>) filtered image when <math display="inline"><semantics> <mrow> <mi>θ</mi> <mo>=</mo> <msup> <mn>120</mn> <mo>∘</mo> </msup> </mrow> </semantics></math>; and (<b>g</b>) filtered image when <math display="inline"><semantics> <mrow> <mi>θ</mi> <mo>=</mo> <msup> <mn>150</mn> <mo>∘</mo> </msup> </mrow> </semantics></math>.</p>
Full article ">Figure 10
<p>(<b>a</b>) A part of the original PCB image; (<b>b</b>) ASM image when <math display="inline"><semantics> <mrow> <mi>θ</mi> <mo>=</mo> <msup> <mn>0</mn> <mo>∘</mo> </msup> </mrow> </semantics></math>, (<b>c</b>) contrast image when <math display="inline"><semantics> <mrow> <mi>θ</mi> <mo>=</mo> <msup> <mn>0</mn> <mo>∘</mo> </msup> </mrow> </semantics></math>; (<b>d</b>) dissimilarity image when <math display="inline"><semantics> <mrow> <mi>θ</mi> <mo>=</mo> <msup> <mn>0</mn> <mo>∘</mo> </msup> </mrow> </semantics></math>; (<b>e</b>) energy image when <math display="inline"><semantics> <mrow> <mi>θ</mi> <mo>=</mo> <msup> <mn>0</mn> <mo>∘</mo> </msup> </mrow> </semantics></math>, (<b>f</b>) entropy image when <math display="inline"><semantics> <mrow> <mi>θ</mi> <mo>=</mo> <msup> <mn>0</mn> <mo>∘</mo> </msup> </mrow> </semantics></math>; and (<b>g</b>) homogeneity image when <math display="inline"><semantics> <mrow> <mi>θ</mi> <mo>=</mo> <msup> <mn>0</mn> <mo>∘</mo> </msup> </mrow> </semantics></math>. These six images are different images.</p>
Full article ">Figure 11
<p>(<b>a</b>) A part of the original PCB image; (<b>b</b>) The output image after RLBP operators and ULBP operators.</p>
Full article ">Figure 12
<p>The boxplot for different ksizes. It indicate that ksize 25 has the higher median and shorter distance, so ksize 25 is the best among the 5 different ksizes.</p>
Full article ">Figure 13
<p>The boxplot for different feature types in different images. The distribution of the color feature in the box plot shows that it is the most effective feature among the three types of features.</p>
Full article ">Figure 14
<p>The boxplot for the five most important feature types in different images. The top five important features all come from color features, this also shows that the color feature is the most important among the three types of features.</p>
Full article ">
Previous Issue
Next Issue
Back to TopTop