[go: up one dir, main page]

Next Issue
Volume 9, April
Previous Issue
Volume 9, February


Gels, Volume 9, Issue 3 (March 2023) – 92 articles

Cover Story (view full-size image): 
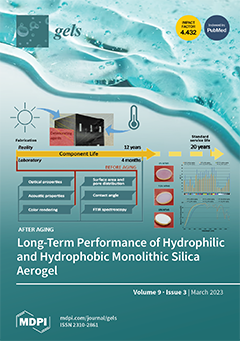
Monolithic silica aerogel is a promising material for innovative glazing systems. The long-term performance of aerogel is crucial since glazing systems are exposed to deteriorating agents during building service life. After fabrication and hydrophobicity, porosity, optical, acoustic, and color rendering tests, the samples were artificially aged by combining temperature and solar radiation effects. A natural service life of 12 years was achieved in about 4 months, and the samples’ properties were retested. Contact angle tests showed loss of hydrophobicity after aging. Visible transmittance values in the 0.67–0.37 range were obtained for hydrophilic and hydrophobic samples, reduced by 0.02–0.05 after aging, and a slight loss in acoustic performance was observed. The presence of aerogel, regardless of hydrophobicity, results in a deterioration in light green and azure tones. View this paper
  • Issues are regarded as officially published after their release is announced to the table of contents alert mailing list.
  • You may sign up for e-mail alerts to receive table of contents of newly released issues.
  • PDF is the official format for papers published in both, html and pdf forms. To view the papers in pdf format, click on the "PDF Full-text" link, and use the free Adobe Reader to open them.
Order results
Result details
Section
Select all
Export citation of selected articles as:
17 pages, 3734 KiB  
Article
Injectable Chitosan-Based Hydrogels for Trans-Cinnamaldehyde Delivery in the Treatment of Diabetic Foot Ulcer Infections
by Henry Chijcheapaza-Flores, Nicolas Tabary, Feng Chai, Mickaël Maton, Jean-Noel Staelens, Frédéric Cazaux, Christel Neut, Bernard Martel, Nicolas Blanchemain and Maria José Garcia-Fernandez
Gels 2023, 9(3), 262; https://doi.org/10.3390/gels9030262 - 22 Mar 2023
Cited by 7 | Viewed by 3126
Abstract
Diabetic foot ulcers (DFU) are among the most common complications in diabetic patients and affect 6.8% of people worldwide. Challenges in the management of this disease are decreased blood diffusion, sclerotic tissues, infection, and antibiotic resistance. Hydrogels are now being used as a [...] Read more.
Diabetic foot ulcers (DFU) are among the most common complications in diabetic patients and affect 6.8% of people worldwide. Challenges in the management of this disease are decreased blood diffusion, sclerotic tissues, infection, and antibiotic resistance. Hydrogels are now being used as a new treatment option since they can be used for drug delivery and to improve wound healing. This project aims to combine the properties of hydrogels based on chitosan (CHT) and the polymer of β cyclodextrin (PCD) for local delivery of cinnamaldehyde (CN) in diabetic foot ulcers. This work consisted of the development and characterisation of the hydrogel, the evaluation of the CN release kinetics and cell viability (on a MC3T3 pre-osteoblast cell line), and the evaluation of the antimicrobial and antibiofilm activity (S. aureus and P. aeruginosa). The results demonstrated the successful development of a cytocompatible (ISO 10993-5) injectable hydrogel with antibacterial (99.99% bacterial reduction) and antibiofilm activity. Furthermore, a partial active molecule release and an increase in hydrogel elasticity were observed in the presence of CN. This leads us to hypothesise that a reaction between CHT and CN (a Schiff base) can occur and that CN could act as a physical crosslinker, thus improving the viscoelastic properties of the hydrogel and limiting CN release. Full article
(This article belongs to the Special Issue Recent Developments in Chitosan Hydrogels)
Show Figures

Figure 1

Figure 1
<p>H<sup>1</sup> NMR spectra of PCD (<b>c</b>), PCD:CN complex (<b>b</b>), and CN (<b>a</b>). A zoom of PCD H3 and H5 proton shifts in the complex spectra compared to PCD spectra is shown in a yellow square. Additionally, a zoom of the H2 (aromatic protons), H3, and H4 shifts from the PCD:CN complex spectra is shown in an orange box.</p>
Full article ">Figure 2
<p>ROESY NMR spectra of the PCD:CN complex (1:1). A zoom focusing on the correlation signals (red circle) of CN (H2 and H3): PCD (H3 and H5) protons are visible beside it. Correlation signals indicate that the aromatic groups (H2) and H3 of CN are complexed by the cavity of CD, as proposed by the model.</p>
Full article ">Figure 3
<p>Gel stability tests of controls and CHT/PCD/CN hydrogels immediately after injection (0 h), after 1 h, and after 24 h. (<b>A</b>) vial turnover test at 37 °C. (<b>B</b>) structural stability of gel cords injected in PBS (pH 7.4) at 37 °C.</p>
Full article ">Figure 4
<p>Dynamic viscosity evaluation by increasing the shear rate. The average values obtained (n = 3) CHT/PCD/CN hydrogel formulations 3:2:0 and 3:2:1 are shown (<b>A.1</b>). ((<b>B.1</b>,<b>B.2</b>)) elastic modulus recovery evaluation at 25 °C after a low (1%) and high (500%) shear strain ((<b>C.1</b>,<b>C.2</b>)) Study of viscoelastic modulus (G′ and G″) and damping factor at 37 °C in the LVR at t = 10 min (*** = <span class="html-italic">p</span> &lt; 0.001, * = <span class="html-italic">p</span> &lt; 0.05).</p>
Full article ">Figure 5
<p>Kinetic release of CN (expressed in %) under flowing conditions in a USP apparatus four dissolution tester (PBS, pH 7.4 at 37 °C).</p>
Full article ">Figure 6
<p>Percentage of cell survival tested on a MC3T3 cell line exposed to an extraction medium from CHT/PCD/CN hydrogels.</p>
Full article ">Figure 7
<p>Antibiofilm evaluation in a hydroxyapatite-coated peg over time for (<b>A</b>) <span class="html-italic">S. aureus</span> and (<b>B</b>) <span class="html-italic">P. aeruginosa</span>. Bacterial biofilm absorbance after exposition to an extraction medium of CHT/CD/CN hydrogels was measured by OD at 590 nm.</p>
Full article ">Figure 8
<p>Antibiofilm evaluation in a hydroxyapatite-coated peg over time for (<b>A</b>) <span class="html-italic">S. aureus</span> and (<b>B</b>) <span class="html-italic">P. aeruginosa</span>. The bacterial biofilm absorbance after exposure to an extraction medium of CHT/CD/CN hydrogels was measured by OD at 590 nm.</p>
Full article ">Figure 9
<p>Graphical description of the hydrogel preparation system composed of two syringes interconnected by a female-female Luer lock.</p>
Full article ">
15 pages, 5974 KiB  
Article
Amidoamine Oxide Surfactants as Low-Molecular-Weight Hydrogelators: Effect of Methylene Chain Length on Aggregate Structure and Rheological Behavior
by Rie Kakehashi, Naoji Tokai, Makoto Nakagawa, Kazunori Kawasaki, Shin Horiuchi and Atsushi Yamamoto
Gels 2023, 9(3), 261; https://doi.org/10.3390/gels9030261 - 22 Mar 2023
Viewed by 1673
Abstract
Rheology control is an important issue in many industrial products such as cosmetics and paints. Recently, low-molecular-weight compounds have attracted considerable attention as thickeners/gelators for various solvents; however, there is still a significant need for molecular design guidelines for industrial applications. Amidoamine oxides [...] Read more.
Rheology control is an important issue in many industrial products such as cosmetics and paints. Recently, low-molecular-weight compounds have attracted considerable attention as thickeners/gelators for various solvents; however, there is still a significant need for molecular design guidelines for industrial applications. Amidoamine oxides (AAOs), which are long-chain alkylamine oxides with three amide groups, are surfactants that act as hydrogelators. Here, we show the relationship between the length of methylene chains at four different locations of AAOs, the aggregate structure, the gelation temperature Tgel, and the viscoelasticity of the formed hydrogels. As seen from the results of electron microscopic observations, the aggregate structure (ribbon-like or rod-like) can be controlled by changing the length of methylene chain in the hydrophobic part, the length of methylene chain between the amide and amine oxide groups, and the lengths of methylene chains between amide groups. Furthermore, hydrogels consisting of rod-like aggregates showed significantly higher viscoelasticity than those consisting of ribbon-like aggregates. In other words, it was shown that the gel viscoelasticity could be controlled by changing the methylene chain lengths at four different locations of the AAO. Full article
(This article belongs to the Special Issue Hydrogels, Microgels, and Nanogels: From Fundamentals to Applications)
Show Figures

Graphical abstract

Graphical abstract
Full article ">Figure 1
<p>Chemical structure of alkyl amidoamine oxide. <span class="html-italic">k</span> is the length of the methylene chain of the hydrophobic part, <span class="html-italic">l</span> is the length of the methylene chain between nitrogen atoms of the amide groups, <span class="html-italic">m</span> is the length of the methylene chain between carbonyl groups of the amide groups, and <span class="html-italic">n</span> is the length of the methylene chain between the amide and amine oxide groups. AAO is denoted as <span class="html-italic">k</span>-<span class="html-italic">l</span>-<span class="html-italic">m</span>-<span class="html-italic">n</span> using the length of the methylene chain in four places.</p>
Full article ">Figure 2
<p>Photographs of hydrogels of certain AAOs at around 25 °C. (<b>a</b>) 9-2-2-6, (<b>b</b>) 11-2-2-6, (<b>c</b>) 13-2-2-6, (<b>d</b>) 13-3-2-6, (<b>e</b>) 13-4-2-6, (<b>f</b>) 13-5-2-6, and (<b>g</b>) 13-2-3-6.</p>
Full article ">Figure 3
<p>Cryo-SEM images of the surfactant aqueous solutions. Typical images of (<b>a</b>) 9-2-2-6 solution quickly frozen from room temperature (&lt;<span class="html-italic">T</span><sub>gel</sub>), (<b>b</b>) 11-2-2-6 solution quickly frozen from room temperature (&lt;<span class="html-italic">T</span><sub>gel</sub>), (<b>c</b>) 9-2-2-6 solution quickly frozen from about 60 °C (&gt;<span class="html-italic">T</span><sub>gel</sub>), and (<b>d</b>) 11-2-2-6 solution quickly frozen from about 80 °C (&gt;<span class="html-italic">T</span><sub>gel</sub>).</p>
Full article ">Figure 4
<p>Typical images of 9-2-2-6 (<b>a</b>), and 11-2-2-6 (<b>b</b>) solutions observed by freeze-fracture TEM.</p>
Full article ">Figure 5
<p>Negative-staining TEM images of the surfactant aqueous solutions at room temperature. Yellow arrows indicate aggregates. Typical images of (<b>a</b>) 9-2-2-6 solution, (<b>b</b>) 11-2-2-6 solution, (<b>c</b>) 13-2-2-4 solution, and (<b>d</b>) 13-2-2-6 solution.</p>
Full article ">Figure 6
<p>Angular frequency dependence of <span class="html-italic">G</span>′ (solid circles) and <span class="html-italic">G</span>″ (open circles) of 13-2-2-<span class="html-italic">n</span> (<span class="html-italic">n</span> = 4, 5, and 6) aqueous solutions at 25 °C.</p>
Full article ">Figure 7
<p>The <span class="html-italic">k</span>-dependence of the <span class="html-italic">T</span><sub>gel</sub> of <span class="html-italic">k</span>-2-2-3 (solid triangles), <span class="html-italic">k</span>-2-2-6 (open triangles) [<a href="#B31-gels-09-00261" class="html-bibr">31</a>], and <span class="html-italic">k</span>-3-2-6 (solid circles).</p>
Full article ">Figure 8
<p>Angular frequency dependence of <span class="html-italic">G</span>′ (solid circles) and <span class="html-italic">G</span>″ (open circles) of the <span class="html-italic">k</span>-2-2-6 (<span class="html-italic">k</span> = 9, 11, and 13) aqueous solutions at 25 °C.</p>
Full article ">Figure 9
<p>Negative-staining TEM images of the surfactant aqueous solutions at room temperature. Red arrows indicate rod-like aggregates, and yellow arrows indicate ribbon-like aggregates. Typical images of (<b>a</b>) 13-3-2-6 solution, (<b>b</b>) 13-4-2-6 solution, and (<b>c</b>) 13-5-2-6 solution.</p>
Full article ">Figure 10
<p>Angular frequency dependence of <span class="html-italic">G</span>′ (solid symbols) and <span class="html-italic">G</span>″ (open symbols) of 13-<span class="html-italic">l</span>-<span class="html-italic">m</span>-6 (<span class="html-italic">l</span> = 2–5; <span class="html-italic">m</span> = 2 and 3) aqueous solutions at 25 °C.</p>
Full article ">Figure 11
<p>Schematic of the odd–even effect of hydrogen bonding formation. Blue circles indicate hydrogen bonds between neighboring AAO molecules. Red circles indicate amide groups without hydrogen bonds.</p>
Full article ">Scheme 1
<p>Synthesis of alkyl amidoamine oxides used in this study.</p>
Full article ">
28 pages, 5203 KiB  
Review
Hydrogels—A Promising Materials for 3D Printing Technology
by Gobi Saravanan Kaliaraj, Dilip Kumar Shanmugam, Arish Dasan and Kamalan Kirubaharan Amirtharaj Mosas
Gels 2023, 9(3), 260; https://doi.org/10.3390/gels9030260 - 22 Mar 2023
Cited by 26 | Viewed by 8755
Abstract
Hydrogels are a promising material for a variety of applications after appropriate functional and structural design, which alters the physicochemical properties and cell signaling pathways of the hydrogels. Over the past few decades, considerable scientific research has made breakthroughs in a variety of [...] Read more.
Hydrogels are a promising material for a variety of applications after appropriate functional and structural design, which alters the physicochemical properties and cell signaling pathways of the hydrogels. Over the past few decades, considerable scientific research has made breakthroughs in a variety of applications such as pharmaceuticals, biotechnology, agriculture, biosensors, bioseparation, defense, and cosmetics. In the present review, different classifications of hydrogels and their limitations have been discussed. In addition, techniques involved in improving the physical, mechanical, and biological properties of hydrogels by admixing various organic and inorganic materials are explored. Future 3D printing technology will substantially advance the ability to pattern molecules, cells, and organs. With significant potential for producing living tissue structures or organs, hydrogels can successfully print mammalian cells and retain their functionalities. Furthermore, recent advances in functional hydrogels such as photo- and pH-responsive hydrogels and drug-delivery hydrogels are discussed in detail for biomedical applications. Full article
(This article belongs to the Special Issue 3D Printing of Gel-Based Materials)
Show Figures

Figure 1

Figure 1
<p>Schematic view of double-network hydrogel preparation by chemical-chemical crosslinking. (<b>a</b>) two-step polymerization method and (<b>b</b>) molecular stent process [<a href="#B4-gels-09-00260" class="html-bibr">4</a>]. Copyright received.</p>
Full article ">Figure 2
<p>Schematic view of PEGylated gold nanoparticles in fermentation medium containing <span class="html-italic">G. xylinum</span> to fabricate GNP-BC hydrogels to promote bone regeneration applications [<a href="#B20-gels-09-00260" class="html-bibr">20</a>]. Copyright received.</p>
Full article ">Figure 3
<p>Osteogenic assessment of Au/BC hydrogel. (<b>a</b>) ALP and (<b>b</b>) alizarin red staining of hBMSCs after 14 and 21 days of treatment with the Au/BC hydrogel. (<b>c</b>) RT-PCR analysis of Runx-2, ALP, COL1, and OPN after treatment with liquor extraction of Au/BC hydrogels for 3 to 5 days in the presence of hBMSCs, (<b>d</b>) Runx-2, ALP, COL1, and OPN expression by Western blot study of Au/BC hydrogel extraction after 7 days of incubation [<a href="#B20-gels-09-00260" class="html-bibr">20</a>]. Copyright received. * The values are significant.</p>
Full article ">Figure 4
<p>Schematic representation of the synthesis of OP and AP delivered PLGA/TCP nanocomposite 3D-printed scaffolds using a cryogenic 3D printing process and hydrogel coating [<a href="#B38-gels-09-00260" class="html-bibr">38</a>]. Copyright received.</p>
Full article ">Figure 5
<p>Osteogenic differentiation ability of rBMSCs cultured with scaffolds. (<b>a</b>,<b>b</b>) Live/dead cell analysis after 3 days of rBMSC culture; (<b>c</b>,<b>d</b>) ALP staining and activity after extraction with scaffolds; (<b>e</b>,<b>f</b>) Alizarin Red S staining with quantitative evaluation of calcium nodules [<a href="#B38-gels-09-00260" class="html-bibr">38</a>]. Copyright received. * The values are significant.</p>
Full article ">Figure 6
<p>Schematic representation of multifunctional hydrogel nanocomposites [<a href="#B40-gels-09-00260" class="html-bibr">40</a>]. Copyright received.</p>
Full article ">Figure 7
<p>Schematic illustration of 3D-printed CNC-reinforced zwitterionic hydrogels for strain sensors [<a href="#B48-gels-09-00260" class="html-bibr">48</a>]. Copyright received.</p>
Full article ">Figure 8
<p>Schematic view of (<b>a</b>) 3D-printed composite hydrogel showing graphene flake; (<b>b</b>,<b>c</b>) surface morphology and cross-sectional view of graphene; (<b>d</b>) graphene flake orientation; (<b>e</b>–<b>g</b>) SEM, fluorescence, and light microscopy images of composite hydrogels [<a href="#B55-gels-09-00260" class="html-bibr">55</a>]. Copyright received.</p>
Full article ">Figure 9
<p>Photographs, microscopic and SEM images of 3D-printed HBC hydrogel scaffolds treated with H<sub>2</sub>O as well as different concentrations of NaCl solutions [<a href="#B65-gels-09-00260" class="html-bibr">65</a>]. Copyright received.</p>
Full article ">Figure 10
<p>Schematic diagram of inkjet-based bioprinting using (<b>A</b>) thermal and (<b>B</b>) piezoelectric actuators.</p>
Full article ">Figure 11
<p>Schematic diagram of extrusion-based bioprinting using (<b>A</b>) pneumatic-, (<b>B</b>) piston-, and (<b>C</b>) screw-based methods.</p>
Full article ">Figure 12
<p>Schematic diagram of digital light processing bioprinting technique.</p>
Full article ">Figure 13
<p>Schematic diagram of stereolithography bioprinting technique.</p>
Full article ">Figure 14
<p>Schematic representation of the sensing mechanism using hydrogels [<a href="#B164-gels-09-00260" class="html-bibr">164</a>]. (<b>a</b>) pH and ionic sensing, (<b>b</b>) fiber strain sensing by OTDR due to hydrogel swelling, (<b>c</b>) gas sensing: dissolved gas (acidic/basic) leads to hydrogel swelling followed by changes in the electric current [<a href="#B165-gels-09-00260" class="html-bibr">165</a>]. (<b>d</b>) Molecular sensing: selective reactions lead to changes in fluorescence intensity due to the release of fluorophores on nanostructured materials. (<b>e</b>) Humidity sensor: changes in interference in the coating due to variation in thickness, which controls the swelling [<a href="#B163-gels-09-00260" class="html-bibr">163</a>]. Copyright received.</p>
Full article ">
15 pages, 2180 KiB  
Article
Modeling the Phase Transition in Hydrophobic Weak Polyelectrolyte Gels under Compression
by Alexander D. Kazakov, Varvara M. Prokacheva, Oleg V. Rud, Lucie Nová and Filip Uhlík
Gels 2023, 9(3), 259; https://doi.org/10.3390/gels9030259 - 22 Mar 2023
Cited by 1 | Viewed by 1390
Abstract
One of the emerging water desalination techniques relies on the compression of a polyelectrolyte gel. The pressures needed reach tens of bars, which are too high for many applications, damage the gel and prevent its reuse. Here, we study the process by means [...] Read more.
One of the emerging water desalination techniques relies on the compression of a polyelectrolyte gel. The pressures needed reach tens of bars, which are too high for many applications, damage the gel and prevent its reuse. Here, we study the process by means of coarse-grained simulations of hydrophobic weak polyelectrolyte gels and show that the necessary pressures can be lowered to only a few bars. We show that the dependence of applied pressure on the gel density contains a plateau indicating a phase separation. The phase separation was also confirmed by an analytical mean-field theory. The results of our study show that changes in the pH or salinity can induce the phase transition in the gel. We also found that ionization of the gel enhances its ion capacity, whereas increasing the gel hydrophobicity lowers the pressure required for gel compression. Therefore, combining both strategies enables the optimization of polyelectrolyte gel compression for water desalination purposes. Full article
(This article belongs to the Special Issue New Era in the Volume Phase Transition of Gels II)
Show Figures

Figure 1

Figure 1
<p>Pressure-extension curves of a hydrophobic gel with <math display="inline"><semantics> <mrow> <mi>pH</mi> <mo>−</mo> <mi mathvariant="normal">p</mi> <mi>K</mi> <mo>=</mo> <mn>1</mn> </mrow> </semantics></math>, <math display="inline"><semantics> <mrow> <mi>ε</mi> <mo>=</mo> <mn>0.5</mn> </mrow> </semantics></math><math display="inline"><semantics> <mrow> <msub> <mi>k</mi> <mi mathvariant="normal">B</mi> </msub> <mi>T</mi> </mrow> </semantics></math>, reservoir salt concentration <math display="inline"><semantics> <mrow> <msub> <mi>c</mi> <mi mathvariant="normal">s</mi> </msub> <mo>=</mo> <mn>0.01</mn> </mrow> </semantics></math> mol/L with inserted simulation snapshots at the following gel densities: (I) <math display="inline"><semantics> <mrow> <mi>ρ</mi> <mo>=</mo> <mn>0.03</mn> </mrow> </semantics></math>, (II) <math display="inline"><semantics> <mrow> <mn>1.78</mn> </mrow> </semantics></math>, (III) <math display="inline"><semantics> <mrow> <mn>8.99</mn> </mrow> </semantics></math>, and (IV) <math display="inline"><semantics> <mrow> <mn>22.06</mn> </mrow> </semantics></math> mol/L. The black curve results from simulations and the red one from the Maxwell construction over the black curve. The blue dashed curve corresponds to a fit of simulation data by analytical theory equation (<span class="html-italic">vide infra</span>). White triangles represent bimodal points. The blue clouds indicate charged segments of the gel. The magenta spheres show the nodes of the gel. The red and blue spheres represent counter- and co-ions, respectively. For more snapshots, see the ESI (<a href="#app1-gels-09-00259" class="html-app">Figures S4 and S5</a>).</p>
Full article ">Figure 2
<p>The pressure <span class="html-italic">p</span> applied to the gel as a function of gel density <math display="inline"><semantics> <mi>ρ</mi> </semantics></math> at different values of (<b>a</b>) <math display="inline"><semantics> <mrow> <mi>pH</mi> <mo>−</mo> <mi mathvariant="normal">p</mi> <mi>K</mi> </mrow> </semantics></math> difference, (<b>b</b>) solvent quality <math display="inline"><semantics> <mi>ε</mi> </semantics></math> and (<b>c</b>) salt concentration <math display="inline"><semantics> <msub> <mi>c</mi> <mi mathvariant="normal">s</mi> </msub> </semantics></math>. White triangles mark the borders of the two-phase region. The shaded area highlights the two-phase area limited by binodals. The original data (with loops) and Maxwell construction details are provided in the ESI (<a href="#app1-gels-09-00259" class="html-app">Figures S1 and S2</a>).</p>
Full article ">Figure 3
<p>Phase diagrams of a hydrophobic gel in the coordinates salt concentration <math display="inline"><semantics> <msub> <mi>c</mi> <mi mathvariant="normal">s</mi> </msub> </semantics></math> versus gel density <math display="inline"><semantics> <mi>ρ</mi> </semantics></math>. (<b>a</b>) Comparison of simulation results at different values of solvent quality <math display="inline"><semantics> <mi>ε</mi> </semantics></math> and <math display="inline"><semantics> <mrow> <mi>pH</mi> <mo>−</mo> <mi mathvariant="normal">p</mi> <mi>K</mi> </mrow> </semantics></math>. The values of <math display="inline"><semantics> <msub> <mi>p</mi> <mrow> <mi>t</mi> <mi>r</mi> </mrow> </msub> </semantics></math> are the results of Maxwell construction (see <a href="#app1-gels-09-00259" class="html-app">Figure S2</a> in ESI). (<b>b</b>) Comparison of simulation results at <math display="inline"><semantics> <mrow> <mi>pH</mi> <mo>−</mo> <mi mathvariant="normal">p</mi> <mi>K</mi> <mo>=</mo> <mn>1</mn> </mrow> </semantics></math> and <math display="inline"><semantics> <mrow> <mi>ε</mi> <mo>=</mo> <mn>0.5</mn> </mrow> </semantics></math> with analytical theory (MF) results at solvent quality <math display="inline"><semantics> <mrow> <mi>χ</mi> <mo>=</mo> <mn>0.96</mn> </mrow> </semantics></math> and different <math display="inline"><semantics> <mrow> <mi>pH</mi> <mo>−</mo> <mi mathvariant="normal">p</mi> <mi>K</mi> </mrow> </semantics></math>. The gray dots are the points belonging to binodals calculated by the MF model for different <math display="inline"><semantics> <mrow> <mi>pH</mi> <mo>−</mo> <mi mathvariant="normal">p</mi> <mi>K</mi> </mrow> </semantics></math> as indicated. Three of these binodals are plotted by dotted lines (green, blue and cyan).</p>
Full article ">Figure 4
<p>Ionization degree <math display="inline"><semantics> <mi>α</mi> </semantics></math> of the gel and as a function of gel density <math display="inline"><semantics> <mi>ρ</mi> </semantics></math> for different (<b>a</b>) <math display="inline"><semantics> <mrow> <mi>pH</mi> <mo>−</mo> <mi mathvariant="normal">p</mi> <mi>K</mi> </mrow> </semantics></math>, (<b>b</b>) solvent quality <math display="inline"><semantics> <mi>ε</mi> </semantics></math> and (<b>c</b>) salt concentration <math display="inline"><semantics> <msub> <mi>c</mi> <mi mathvariant="normal">s</mi> </msub> </semantics></math>. White triangles define the borders of the two-phase area.</p>
Full article ">Figure 5
<p>Change in the number of <math display="inline"><semantics> <msup> <mi>Na</mi> <mo>+</mo> </msup> </semantics></math> (<b>a</b>) and <math display="inline"><semantics> <msup> <mi>Cl</mi> <mo>−</mo> </msup> </semantics></math> (<b>b</b>) ions in the volume <math display="inline"><semantics> <msub> <mi>V</mi> <mn>0</mn> </msub> </semantics></math> normalized by the number of gel segments <math display="inline"><semantics> <msub> <mi>N</mi> <mi>gel</mi> </msub> </semantics></math> as a function of gel density <math display="inline"><semantics> <mi>ρ</mi> </semantics></math> for different <math display="inline"><semantics> <mrow> <mi>pH</mi> <mo>−</mo> <mi mathvariant="normal">p</mi> <mi>K</mi> </mrow> </semantics></math>. White triangles define the borders of the two-phase area. Circles represent free swelling equilibrium states, where the applied pressure is zero.</p>
Full article ">
12 pages, 3848 KiB  
Article
Consolidation and Forced Elasticity in Double-Network Hydrogels
by S. Shams Es-haghi and R. A. Weiss
Gels 2023, 9(3), 258; https://doi.org/10.3390/gels9030258 - 22 Mar 2023
Cited by 1 | Viewed by 1688
Abstract
This paper discusses two observations that are unique with respect to the mechanics of double network (DN) hydrogels, forced elasticity driven by water diffusion and consolidation, which are analogous to the so-called Gough–Joule effects in rubbers. A series of DN hydrogels were synthesized [...] Read more.
This paper discusses two observations that are unique with respect to the mechanics of double network (DN) hydrogels, forced elasticity driven by water diffusion and consolidation, which are analogous to the so-called Gough–Joule effects in rubbers. A series of DN hydrogels were synthesized from 2-acrylamido-2-methylpropane sulfuric acid (AMPS), 3-sulfopropyl acrylate potassium salt (SAPS) and acrylamide (AAm). Drying of AMPS/AAm DN hydrogels was monitored by extending the gel specimens to different stretch ratios and holding them until all the water evaporated. At high extension ratios, the gels underwent plastic deformation. Water diffusion measurements performed on AMPS/AAm DN hydrogels that were dried at different stretch ratios indicated that the diffusion mechanism deviated from Fickian behavior at extension ratios greater than two. Study of the mechanical behavior of AMPS/AAm and SAPS/AAm DN hydrogels during tensile and confined compression tests showed that despite their large water content, DN hydrogels can retain water during large-strain tensile or compression deformations. Full article
Show Figures

Figure 1

Figure 1
<p>The forced elasticity driven by diffusion of water into a DN hydrogel dried in its extended state. “Start” denotes when the dry extended hydrogel is placed back into water. The arrows show the temporal progression of the shape of the hydrogel, and “End” denotes the point where a new regime of diffusion starts towards a new equilibrium state. Times associated with each image in the direction of arrows are <span class="html-italic">t</span> = 0, 7, 13, 45, 51 and 56 s.</p>
Full article ">Figure 2
<p>Engineering tensile stress versus stretch ratio for a pseudo-IPN hydrogel made of AMPS(1,2,2,9) and AAm(2,0.1,0.01,97). Arrows display the stretch ratios at which drying tests were performed on the samples.</p>
Full article ">Figure 3
<p>AMPS(1,2,2,9)/AAm(2,0.1,0.01,97) DN hydrogel. (<b>a</b>): after being extended to λ = 2; (<b>b</b>): after being dried overnight in the extended form.</p>
Full article ">Figure 4
<p>Drying experiment for AMPS(1,2,2,9)/AAm(2,0.1,0.01,97) DN hydrogel stretched to λ = 2. The arrows denote the onset of relaxation, onset of drying and end of drying.</p>
Full article ">Figure 5
<p>Results of drying experiments (tensile stress versus time) for AMPS(1,2,2,9)/AAm(2,0.1,0.01,97) DN hydrogels with various stretch ratios.</p>
Full article ">Figure 6
<p>AMPS(1,2,2,9)/AAm(2,0.1,0.01,97) DN hydrogel; top: a segment of dried gel stretched up to λ = 12; bottom: the top dried gel rehydrated to the equilibrium swelling ratio.</p>
Full article ">Figure 7
<p>The time to onset of stress release (TOSR) for the dried AMPS(1,2,2,9)/AAm(2,0.1,0.01,97) DN hydrogels with different extension ratios. TOSR was defined as the time it took for the stretched sample to begin bending when immersed in water.</p>
Full article ">Figure 8
<p>Water diffusion data for the AMPS(1,2,2,9)/AAm(2,0.1,0.01,97) DN hydrogel. The sample with λ = 2 exhibited Fickian diffusion, but for λ &gt; 2 the diffusion became increasingly non-Fickian.</p>
Full article ">Figure 9
<p>Exponents derived from diffusion measurements. A value of <span class="html-italic">n</span> = 0.5 indicates Fickian diffusion.</p>
Full article ">Figure 10
<p>Confined compression of SAPS(1,2,2,9)/AAm(2,0.1,0,97) DN hydrogel. The hydrogel retains water under confined compression, but when the compression becomes too high, some parts from the edges of the sample climb up the gap. This behavior was observed in all tough DN hydrogels studied.</p>
Full article ">Figure 11
<p>Appearance of DN hydrogels under tensile loading: (<b>a</b>): AMPS(1,1,4,9)/AAm(2,0.01,0.01,97); (<b>b</b>): SAPS(1,0.1,2,9)/AAm(2,0.1,0,97); (<b>c</b>): SAPS(1,2,2,9)/AAm(2,0.1,0,97); (<b>d</b>): SAPS(1,2,2,97)/AAm(2,0.1,0.05,97); (<b>e</b>): SAPS(1,4,2,9,PEO)/AAm(2,0.1,0.05,9). No consolidation was observed in case of conventional DN hydrogels made of second networks with very high molecular weight chains or chain strands. The sample synthesized by trapped PEO chains shows consolidation. Arrow shows a droplet of water falling down the surface of the gel during tensile loading. The consolidation is negligible, however, as compared to the water content of the gel.</p>
Full article ">
28 pages, 5139 KiB  
Review
Recent Development of Self-Powered Tactile Sensors Based on Ionic Hydrogels
by Zhen Zhao, Yong-Peng Hu, Kai-Yang Liu, Wei Yu, Guo-Xian Li, Chui-Zhou Meng and Shi-Jie Guo
Gels 2023, 9(3), 257; https://doi.org/10.3390/gels9030257 - 22 Mar 2023
Cited by 10 | Viewed by 3820
Abstract
Hydrogels are three-dimensional polymer networks with excellent flexibility. In recent years, ionic hydrogels have attracted extensive attention in the development of tactile sensors owing to their unique properties, such as ionic conductivity and mechanical properties. These features enable ionic hydrogel-based tactile sensors with [...] Read more.
Hydrogels are three-dimensional polymer networks with excellent flexibility. In recent years, ionic hydrogels have attracted extensive attention in the development of tactile sensors owing to their unique properties, such as ionic conductivity and mechanical properties. These features enable ionic hydrogel-based tactile sensors with exceptional performance in detecting human body movement and identifying external stimuli. Currently, there is a pressing demand for the development of self-powered tactile sensors that integrate ionic conductors and portable power sources into a single device for practical applications. In this paper, we introduce the basic properties of ionic hydrogels and highlight their application in self-powered sensors working in triboelectric, piezoionic, ionic diode, battery, and thermoelectric modes. We also summarize the current difficulty and prospect the future development of ionic hydrogel self-powered sensors. Full article
(This article belongs to the Special Issue Advances in Conductive Polymers and Hydrogels)
Show Figures

Figure 1

Figure 1
<p>Number of published papers on the <a href="https://app.dimensions.ai/" target="_blank">https://app.dimensions.ai/</a> database with the search of “hydrogel for self-powered tactile sensor” (the data were accessed on 1 February 2023).</p>
Full article ">Figure 2
<p>Schematic of the unique properties and modes of the ionic hydrogel self-powered tactile sensors.</p>
Full article ">Figure 3
<p>Working modes of TENGs.</p>
Full article ">Figure 4
<p>(<b>a</b>) Schematic of the hydrogel-based triboelectric generator. (<b>b</b>) Output voltage and current versus the resistance of the external loads. (<b>c</b>) Schematic diagram of the Hydrogel-TENG in a tube shape, along with the open-circuit voltage generated by (<b>d</b>) bending, (<b>e</b>) twisting, and (<b>f</b>) tensile strains. (Reprinted with permission from [<a href="#B61-gels-09-00257" class="html-bibr">61</a>].)</p>
Full article ">Figure 5
<p>(<b>a</b>) Cellulose hydrogel for flexible sensor. I. Schematic working mechanism of CNH TENG. II. A transparent hydrogel TENG tapped by fingers. III. Various peak amplitudes of voltage across the resistor (220 MΩ) with different pressures applied. (Reprinted with permission from [<a href="#B63-gels-09-00257" class="html-bibr">63</a>].) (<b>b</b>) Use of a hydrogel-based TENG for driving fatigue monitoring. I. Eye-closure movement detection. II. Yawning detection. III. Head-turning movement detection. IV. Vertical bending angle detection. (Reprinted with permission from [<a href="#B65-gels-09-00257" class="html-bibr">65</a>]). (<b>c</b>) Self-Powered Smart Arm Training Band Sensor. I. Schematic diagram of the SA−Zn hydrogel TENG and the photographs of the SH-TENG in its original and foldable state. II. Output Performance of the SH-TENG. III. The voltage outputs of the SH-TENG under bending of the finger. (Reprinted with permission from [<a href="#B66-gels-09-00257" class="html-bibr">66</a>].)</p>
Full article ">Figure 6
<p>(<b>a</b>) Schematic diagram of the DE-THS and SE-THS. (<b>b</b>) Open-circuit voltage of both the plain SE-THS and the micro-pyramid-patterned SE-THS varied with different pressure. (<b>c</b>) Output signals of DE-THS under touching, pressing, tapping, and bending (reprinted with permission from [<a href="#B68-gels-09-00257" class="html-bibr">68</a>]).</p>
Full article ">Figure 7
<p>(<b>a</b>) Schematic diagram of PAA hydrogel-based sensor. (<b>b</b>) The working principle of PAA hydrogel converting mechanical energy into electrical energy. (<b>c</b>) A schematic diagram of the self-powered position recognizer and the corresponding variations in the output voltage of the detector, in response to pressing at different locations on the sensor. (<b>d</b>) Application of the PAA hydrogel-based sensor as a sound detector. (Reprinted with permission from [<a href="#B78-gels-09-00257" class="html-bibr">78</a>].)</p>
Full article ">Figure 8
<p>(<b>a</b>) Schematic illustration of the mechanism of the voltage generated by dynamic structure-nonuniform-induced ion squeezing. (<b>b</b>) Output voltage resulting from the two-end-symmetry-stretch tests conducted on the coiled CNT@PVA/H<sub>2</sub>SO<sub>4</sub> yarn, with the middle portion secured while both ends are simultaneously stretched. (<b>c</b>) The output voltage signal of CNT@PVA/H<sub>2</sub>SO<sub>4</sub> and CNT@PVA/KOH yarns with reversed phase. (<b>d</b>) The output voltage signal of the sensors attached on each finger of a hand with different finger motions. (<b>e</b>) Signal generated by the bending of an index finger at varying degrees. (Reprinted with permission from [<a href="#B79-gels-09-00257" class="html-bibr">79</a>].)</p>
Full article ">Figure 9
<p>(<b>a</b>) The schematic illustrates a hydrogel undergoing indentation, with differential ionic displacement and field observed. The smaller red cations are transported through the green polymer chain network more rapidly than the blue anions, creating a charge imbalance and generating an electric field. (<b>b</b>) Voltage response of PAAm hydrogel upon step compression at 20 kPa. (<b>c</b>) Peak voltage produced in relation to the pressure being applied. (<b>d</b>) A wrist-mounted 16-element piezoionic mechanoreceptor array. (<b>e</b>) Photograph and related normalized voltage bar plot of the piezoionic mechanoreceptor array that detects single and multiple touches. (Reprinted with permission from [<a href="#B75-gels-09-00257" class="html-bibr">75</a>].)</p>
Full article ">Figure 10
<p>(<b>a</b>) The electrical behavior and response of the ionic diode including potential diagram. (<b>b</b>) The electrical behavior and response of the ionic diode under external mechanical stress. (<b>c</b>) Voltage and current output generated at various external pressures. (<b>d</b>) Picture of an arm-wrapped self-powered hydrogel tactile sensor array. Insets: (top panel) voltage signal mapping obtained by pushing the center pixel. (Reprinted with permission from [<a href="#B82-gels-09-00257" class="html-bibr">82</a>].)</p>
Full article ">Figure 11
<p>(<b>a</b>) Thickness-dependent self-induced potential of ionic diode. (<b>b</b>) Decreased voltage loss at the diode/electrode interfaces in response to pressure. (<b>c</b>) Output voltage and sensitivity of self-powered pressure sensors as a function of pressure. (<b>d</b>) Output voltage and sensitivity of self-powered sensors as a function of strain. (Reprinted with permission from [<a href="#B83-gels-09-00257" class="html-bibr">83</a>].)</p>
Full article ">Figure 12
<p>(<b>a</b>) Synthesis mechanism of hydrogel-based GPMs. (<b>b</b>) Schematic illustration of pressure-sensing mechanism. (<b>c</b>) The voltage produced by self-powered i-skins while experiencing gradually increasing pressure, as well as in response to walking and running motions. (Reprinted with permission from [<a href="#B84-gels-09-00257" class="html-bibr">84</a>].)</p>
Full article ">Figure 13
<p>(<b>a</b>) I. Self-powered strain-sensing mechanism of the self-powered ionic hydrogel-based sensor (SPI). II. Charge–discharge curves of SPI sensors. III. Relative resistance changes of SPI sensor in response to elbow-joint motions in no-load state and in the state of powering a watch. (Reprinted with permission from [<a href="#B85-gels-09-00257" class="html-bibr">85</a>].) (<b>b</b>) I. Schematic illustration of pressure-sensing mechanism. II. The voltage changes when pressure is applied and released. III. Voltage variation of the sensor in response to finger bending. IV. Cyclic voltage variations with finger bending angles ranging from 0° to 90°. (Reprinted with permission from [<a href="#B86-gels-09-00257" class="html-bibr">86</a>].) (<b>c</b>) I. Mechanism of the potentiometric mechanotransduction. II. Responsive characteristics of mechanotransducers with varied Gly content. III. Photograph of the single-electrode-mode e-skin with 6 × 6 sensing pixels. IV. Response behaviors of the e-skin. (Reprinted with permission from [<a href="#B88-gels-09-00257" class="html-bibr">88</a>].) (<b>d</b>) I. Schematic illustration of the self-powered pressure and strain sensor. II. Relative current variations of the sensor in response to compression. III. Relative current variations of the sensor in response to strain. (Reprinted with permission from [<a href="#B89-gels-09-00257" class="html-bibr">89</a>].)</p>
Full article ">Figure 14
<p>(<b>a</b>) I. Thermal voltage generation mechanism of thermodiffusion of ions. II. Relative resistance change during stretching and releasing. III. Schematic illustration of the thermo-powered ionic hydrogel strain sensor. IV. Thermal charge and voltage changes during compression and relaxation. (Reprinted with permission from [<a href="#B98-gels-09-00257" class="html-bibr">98</a>].) (<b>b</b>) I. Voltage changes of the hydrogel at various compressive strains with a ΔT of 7.5 K. II. The voltage changes of the hydrogel sensor in parallel with thermoelectric hydrogels at various tensile strains. III. Corresponding equivalent circuit diagram. (Reprinted with permission from [<a href="#B99-gels-09-00257" class="html-bibr">99</a>].)</p>
Full article ">Figure 15
<p>(<b>a</b>) I. Hydrogel-based TEC utilizing Sn<sup>4+</sup>/Sn<sup>2+</sup> temperature-dependent redox reactions. II. Experimental set-up and equivalent circuit for the measurement of the self-powered strain sensor. III. Variation in current and voltage for the self-powered TEC sensor. IV. Finger movement monitoring using a self-powered strain sensor. (Reprinted with permission from [<a href="#B106-gels-09-00257" class="html-bibr">106</a>]). (<b>b</b>) I. Schematic of temperature−pressure-sensing mechanism. II. Seebeck coefficient fitting relative current change versus pressure of the TGH sensor. III. Responses of a self-powered TGH sensor to finger touch in terms of relative current change and output thermal voltage. IV. TGH sensor array output voltage and relative current change response curves with relaxed and bending states on the human wrist. (Reprinted with permission from [<a href="#B100-gels-09-00257" class="html-bibr">100</a>]).</p>
Full article ">
17 pages, 5291 KiB  
Article
Ca-Alginate Hydrogel with Immobilized Callus Cells as a New Delivery System of Grape Seed Extract
by Elena Günter, Oxana Popeyko and Sergey Popov
Gels 2023, 9(3), 256; https://doi.org/10.3390/gels9030256 - 22 Mar 2023
Cited by 4 | Viewed by 1716
Abstract
The development of new delivery systems for polyphenols is necessary to maintain their antioxidant activity and targeted delivery. The purpose of this investigation was to obtain alginate hydrogels with immobilized callus cells, in order to study the interaction between the physicochemical properties of [...] Read more.
The development of new delivery systems for polyphenols is necessary to maintain their antioxidant activity and targeted delivery. The purpose of this investigation was to obtain alginate hydrogels with immobilized callus cells, in order to study the interaction between the physicochemical properties of hydrogels, texture, swelling behaviour, and grape seed extract (GSE) release in vitro. The inclusion of duckweed (LMC) and campion (SVC) callus cells in hydrogels led to a decrease in their porosity, gel strength, adhesiveness, and thermal stability, and an increase in the encapsulation efficiency compared with alginate hydrogel. The incorporation of LMC cells (0.17 g/mL), which were smaller, resulted in the formation of a stronger gel. The Fourier transform infrared analyses indicated the entrapment of GSE in the alginate hydrogel. Alginate/callus hydrogels had reduced swelling and GSE release in the simulated intestinal (SIF) and colonic (SCF) fluids due to their less porous structure and the retention of GSE in cells. Alginate/callus hydrogels gradually released GSE in SIF and SCF. The faster GSE release in SIF and SCF was associated with reduced gel strength and increased swelling of the hydrogels. LMC-1.0Alginate hydrogels with lower swelling, higher initial gel strength, and thermal stability released GSE more slowly in SIF and SCF. The GSE release was dependent on the content of SVC cells in 1.0% alginate hydrogels. The data obtained show that the addition of callus cells to the hydrogel provides them with physicochemical and textural properties that are useful for the development of drug delivery systems in the colon. Full article
Show Figures

Figure 1

Figure 1
<p>Digital images of GSE-loaded Ca-alginate particles and hydrogel particles based on alginate and cells of campion (SVC) and duckweed (LMC) callus cultures.</p>
Full article ">Figure 2
<p>Scanning electron micrographs of GSE-loaded particles: Alg1.0 (<b>a</b>,<b>f</b>), 0.17SVC-1.0Alg (<b>b</b>,<b>g</b>), 0.5SVC-1.0Alg (<b>c</b>,<b>h</b>), 0.17LMC-1.0Alg (<b>d</b>,<b>i</b>), and 0.5LMC-1.0Alg (<b>e</b>,<b>j</b>). Magnification 63×, scale bar 500 μm (<b>a</b>–<b>e</b>) and magnification 948×, scale bar 50 μm (<b>f</b>–<b>j</b>).</p>
Full article ">Figure 3
<p>FTIR spectra of GSE-loaded Ca-alginate (Alg1.0) (<b>a</b>), alginate/callus particles (0.17SVC-1.0Alg and 0.17LMC-1.0Alg) (<b>b</b>,<b>c</b>), and GSE (<b>d</b>). GSE-grape seed extract.</p>
Full article ">Figure 4
<p>DSC (<b>a</b>) and TGA (<b>b</b>) thermograms of GSE-loaded Ca-alginate (Alg0.5) and Alg0.5/callus (0.17SVC-0.5Alg, 0.5SVC-0.5Alg, 0.17LMC-0.5Alg, 0.5LMC-0.5Alg) particles.</p>
Full article ">Figure 5
<p>DSC (<b>a</b>) and TGA (<b>b</b>) thermograms of GSE-loaded Ca-alginate (Alg1.0) and Alg1.0/callus (0.17SVC-1.0Alg, 0.5SVC-1.0Alg, 0.17LMC-1.0Alg, 0.5LMC-1.0Alg) particles.</p>
Full article ">Figure 6
<p>Swelling behavior of GSE-loaded hydrogels based on 0.5% alginate and SVC cells (<b>a</b>), 0.5% alginate and LMC cells (<b>b</b>), 1.0% alginate and SVC cells (<b>c</b>), 1.0% alginate and LMC cells (<b>d</b>) in the simulated gastric, intestinal, and colonic (SGF, SIF, and SCF, respectively) fluids. The data are presented as the mean ± S.D., <span class="html-italic">n</span> = 15. * <span class="html-italic">p</span> &lt; 0.05 vs. 0.5 or 1.0% alginate.</p>
Full article ">Figure 7
<p>The release of GSE in vitro from hydrogels based on 0.5% alginate and SVC cells (<b>a</b>), 0.5% alginate and LMC cells (<b>b</b>), 1.0% alginate and SVC cells (<b>c</b>), 1.0% alginate and LMC cells (<b>d</b>) in the simulated gastric, intestinal, and colonic (SGF, SIF, and SCF, respectively) fluids. The data are presented as the mean ± S.D., <span class="html-italic">n</span> = 6. * <span class="html-italic">p</span> &lt; 0.05 vs. 0.5 or 1.0% alginate.</p>
Full article ">Figure 8
<p>The gel strength of GSE-loaded hydrogels based on SVC and LMC cells and alginate at the concentration of 0.5% (<b>a</b>) and 1.0% (<b>b</b>) after successive exposure to SIF and SCF. The data are presented as the mean ± S.D., <span class="html-italic">n</span> = 15. * <span class="html-italic">p</span> &lt; 0.05 vs. initial gel strength.</p>
Full article ">
15 pages, 4959 KiB  
Article
Microencapsulation of a Pickering Oil/Water Emulsion Loaded with Vitamin D3
by Alessandro Candiani, Giada Diana, Manuel Martoccia, Fabiano Travaglia, Lorella Giovannelli, Jean Daniel Coïsson and Lorena Segale
Gels 2023, 9(3), 255; https://doi.org/10.3390/gels9030255 - 22 Mar 2023
Cited by 2 | Viewed by 2060
Abstract
The ionotropic gelation technique was chosen to produce vitamin D3-loaded microparticles starting from oil-in-water (O/W) Pickering emulsion stabilized by flaxseed flour: the hydrophobic phase was a solution of vitamin D3 in a blend of vegetable oils (ω6:ω3, 4:1) composed of extra virgin olive [...] Read more.
The ionotropic gelation technique was chosen to produce vitamin D3-loaded microparticles starting from oil-in-water (O/W) Pickering emulsion stabilized by flaxseed flour: the hydrophobic phase was a solution of vitamin D3 in a blend of vegetable oils (ω6:ω3, 4:1) composed of extra virgin olive oil (90%) and hemp oil (10%); the hydrophilic phase was a sodium alginate aqueous solution. The most adequate emulsion was selected carrying out a preliminary study on five placebo formulations which differed in the qualitative and quantitative polymeric composition (concentration and type of alginate selected). Vitamin D3-loaded microparticles in the dried state had a particle size of about 1 mm, 6% of residual water content and excellent flowability thanks to their rounded shape and smooth surface. The polymeric structure of microparticles demonstrated to preserve the vegetable oil blend from oxidation and the integrity of vitamin D3, confirming this product as an innovative ingredient for pharmaceutical and food/nutraceutical purposes. Full article
(This article belongs to the Special Issue Functional Gels Applied in Drug Delivery)
Show Figures

Graphical abstract

Graphical abstract
Full article ">Figure 1
<p>Images of the placebo emulsions immediately after the preparation and after 24 h.</p>
Full article ">Figure 2
<p>Stereomicroscope images of wet (first line) and dried (second line) placebo microparticles.</p>
Full article ">Figure 3
<p>Stereomicroscope images of wet and dried microparticles.</p>
Full article ">Figure 4
<p>Particle size distribution of dried microparticles. Dissimilar capital letters over bars denote significant differences between samples within the same dimensional range (<span class="html-italic">p</span> &lt; 0.05); while different lowercase alphabetical characters denote significant differences among different dimensional ranges within the same sample (<span class="html-italic">p</span> &lt; 0.05).</p>
Full article ">Figure 5
<p>SEM images of the external surface ((<b>a</b>,<b>b</b>), magnification respectively 530× and 1850×) and a cross-section ((<b>c</b>,<b>d</b>), magnification respectively 530× and 1250×) of placebo microparticles; external surface ((<b>e</b>,<b>f</b>), magnification respectively 540× and 1000×) and a cross-section ((<b>g</b>,<b>h</b>), magnification respectively 540× and 1400×) of vit D3-loaded systems.</p>
Full article ">Figure 6
<p>Swelling percentages of dried microparticles in water. Different capital letters over bars show significant differences between samples at the same time intervals (<span class="html-italic">p</span> &lt; 0.05); while dissimilar lowercase letters indicate significant differences among different time intervals within the same sample (<span class="html-italic">p</span> &lt; 0.05).</p>
Full article ">
11 pages, 2878 KiB  
Article
Optimization of the Extraction of Chitosan and Fish Gelatin from Fishery Waste and Their Antimicrobial Potential as Active Biopolymers
by Javier Rocha-Pimienta, Bruno Navajas-Preciado, Carmen Barraso-Gil, Sara Martillanes and Jonathan Delgado-Adámez
Gels 2023, 9(3), 254; https://doi.org/10.3390/gels9030254 - 22 Mar 2023
Cited by 6 | Viewed by 2664
Abstract
Fishery residues are abundant raw materials that also provide numerous metabolites with high added value. Their classic valorization includes energy recovery, composting, animal feed, and direct deposits in landfills or oceans along with the environmental impacts that this entails. However, through extraction processes, [...] Read more.
Fishery residues are abundant raw materials that also provide numerous metabolites with high added value. Their classic valorization includes energy recovery, composting, animal feed, and direct deposits in landfills or oceans along with the environmental impacts that this entails. However, through extraction processes, they can be transformed into new compounds with high added value, offering a more sustainable solution. The aim of this study was to optimize the extraction process of chitosan and fish gelatin from fishery waste and their revalorization as active biopolymers. We successfully optimized the chitosan extraction process, achieving a yield of 20.45% and a deacetylation degree of 69.25%. For the fish gelatin extraction process, yields of 11.82% for the skin and 2.31% for the bone residues were achieved. In addition, it was demonstrated that simple purification steps using activated carbon improve the gelatin’s quality significantly. Finally, biopolymers based on fish gelatin and chitosan showed excellent bactericidal capabilities against Escherichia coli and Listeria innocua. For this reason, these active biopolymers can stop or decrease bacterial growth in their potential food packaging applications. In view of the low technological transfer and the lack of information about the revalorization of fishery waste, this work offers extraction conditions with good yields that can be easily implemented in the existing industrial fabric, reducing costs and supporting the economic development of the fish processing sector and the creation of value from its waste. Full article
(This article belongs to the Special Issue Recent Advance in Food Gels)
Show Figures

Figure 1

Figure 1
<p>Methods of chitosan extraction [<a href="#B10-gels-09-00254" class="html-bibr">10</a>].</p>
Full article ">Figure 2
<p>Overall process for preparation of fish gelatin from tench byproducts.</p>
Full article ">Figure 3
<p>Result of applying an activated carbon filtration step in the production of fish gelatin (2) and without filter (1).</p>
Full article ">Figure 4
<p>Antibacterial activity of polymers against <span class="html-italic">Escherichia coli</span> over 72 h of incubation. Control: growth without polymer. Polymer 1: polymer formulated with chitosan only. Polymer 2: polymer formulated with chitosan and fish gelatin. The results are expressed as log CFU·ml.</p>
Full article ">Figure 5
<p>Antibacterial activity of polymers against <span class="html-italic">Listeria innocua</span> over 72 h of incubation. Control: growth without polymer. Polymer 1: polymer formulated with chitosan only. Polymer 2: polymer formulated with chitosan and fish gelatin. The results are expressed as log CFU·ml<sup>−1</sup>.</p>
Full article ">Figure 6
<p>Chemical chitosan extraction. (<b>A</b>) Crushed exoskeletons. (<b>B</b>) Crushed exoskeletons after acid treatment. (<b>C</b>) Residue after diluted soda treatment. (<b>D</b>) Residue after concentrated soda treatment. (<b>E</b>) Chitosan flakes.</p>
Full article ">
15 pages, 2492 KiB  
Article
Impact of Apricot Pulp Concentration on Cylindrical Gel 3D Printing
by Carmen Molina-Montero, Adrián Matas, Marta Igual, Javier Martínez-Monzó and Purificación García-Segovia
Gels 2023, 9(3), 253; https://doi.org/10.3390/gels9030253 - 21 Mar 2023
Cited by 2 | Viewed by 1652
Abstract
The process of 3D food printing is a rapidly growing field that involves the use of specialized 3D printers to produce food items with complex shapes and textures. This technology allows the creation of customized, nutritionally balanced meals on demand. The objective of [...] Read more.
The process of 3D food printing is a rapidly growing field that involves the use of specialized 3D printers to produce food items with complex shapes and textures. This technology allows the creation of customized, nutritionally balanced meals on demand. The objective of this study was to evaluate the effect of apricot pulp content on printability. Additionally, the degradation of bioactive compounds of gels before and after printing was evaluated to analyze the effect of the process. For this proposal, physicochemical properties, extrudability, rheology, image analysis, Texture Profile Analysis (TPA), and bioactive compounds content were evaluated. The rheological parameters lead to higher mechanical strength and, thus, a decrease in elastic behavior before and after 3D printing as the pulp content increases. An increase in strength was observed when the pulp content increased; thus, sample gels with 70% apricot pulp were more rigid and presented better buildability (were more stable in their dimensions). On the other hand, a significant (p < 0.05) degradation of total carotenoid content after printing was observed in all samples. From the results obtained, it can be said that the gel with 70% apricot pulp food ink was the best sample in terms of printability and stability. Full article
(This article belongs to the Special Issue Research Progress in Food Gels)
Show Figures

Figure 1

Figure 1
<p>(<b>a</b>) Elastic modulus (G′) and viscous modulus (G″). (<b>b</b>) Complex viscosity (η*) of the apricot gel before 3D printing (G30: Gel 30% pulp; G50: Gel 50% pulp; G70: Gel 70% pulp).</p>
Full article ">Figure 2
<p>Example of force vs. time curves during forward extrusion measurement for apricot gel before 3D printing. (G30: Gel 30% pulp; G50: Gel 50% pulp; G70: Gel 70% pulp).</p>
Full article ">Figure 3
<p>(<b>a</b>) Deviations of the height parameter of the samples. (<b>b</b>) Deviations of the area parameter of the sample (P30: Printed sample 30% pulp; P50: Printed sample 50% pulp; 70: Printed sample 70% pulp). Letters (a–c) indicate homogeneous groups according to ANOVA (<span class="html-italic">p</span> &lt; 0.05).</p>
Full article ">Figure 4
<p>3D printed samples top and frontal view just after printing. (P30: Printed sample 30% pulp; P50: Printed sample 50% pulp; P70: Printed sample 70% pulp).</p>
Full article ">Figure 5
<p>(<b>a</b>) Elastic modulus (G′) and viscous modulus (G″). (<b>b</b>) Complex viscosity (η*) of the apricot gel after 3D printing (P30: Printed sample 30% pulp; P50: Printed sample 50% pulp; P70: Printed sample 70% pulp).</p>
Full article ">Figure 6
<p>(<b>a</b>) Cylinder base area; (<b>b</b>) Cylinder height.</p>
Full article ">
21 pages, 4208 KiB  
Article
Development and Evaluation of Essential Oil-Based Nanoemulgel Formulation for the Treatment of Oral Bacterial Infections
by Niamat Ullah, Adnan Amin, Arshad Farid, Samy Selim, Sheikh Abdur Rashid, Muhammad Imran Aziz, Sairah Hafeez Kamran, Muzammil Ahmad Khan, Nauman Rahim Khan, Saima Mashal and Muhammad Mohtasheemul Hasan
Gels 2023, 9(3), 252; https://doi.org/10.3390/gels9030252 - 21 Mar 2023
Cited by 12 | Viewed by 4888
Abstract
Prevalence of oral infections in diabetic patients is a health challenge due to persistent hyperglycemia. However, despite great concerns, limited treatment options are available. We therefore aimed to develop nanoemulsion gel (NEG) for oral bacterial infections based on essential oils. Clove and cinnamon [...] Read more.
Prevalence of oral infections in diabetic patients is a health challenge due to persistent hyperglycemia. However, despite great concerns, limited treatment options are available. We therefore aimed to develop nanoemulsion gel (NEG) for oral bacterial infections based on essential oils. Clove and cinnamon essential oils based nanoemulgel were prepared and characterized. Various physicochemical parameters of optimized formulation including viscosity (65311 mPa·S), spreadability (36 g·cm/s), and mucoadhesive strength 42.87 N/cm2) were within prescribed limits. The drug contents of the NEG were 94.38 ± 1.12% (cinnamaldehyde) and 92.96 ± 2.08% (clove oil). A significant concentration of clove (73.9%) and cinnamon essential oil (71.2 %) was released from a polymer matrix of the NEG till 24 h. The ex vivo goat buccal mucosa permeation profile revealed a significant (52.7–54.2%) permeation of major constituents which occurred after 24 h. When subjected to antimicrobial testing, significant inhibition was observed for several clinical strains, namely Staphylococcus aureus (19 mm), Staphylococcus epidermidis (19 mm), and Pseudomonas aeruginosa (4 mm), as well as against Bacillus chungangensis (2 mm), whereas no inhibition was detected for Bacillus paramycoides and Paenibacillus dendritiformis when NEG was utilized. Likewise promising antifungal (Candida albicans) and antiquorum sensing activities were observed. It was therefore concluded that cinnamon and clove oil-based NEG formulation presented significant antibacterial-, antifungal, and antiquorum sensing activities. Full article
Show Figures

Graphical abstract

Graphical abstract
Full article ">Figure 1
<p>Pseudo ternary phase diagram.</p>
Full article ">Figure 2
<p>Effect of polymer concentration on spreadability of nanoemulgel.</p>
Full article ">Figure 3
<p>Effect of polymer concentration on viscosity of nanoemulgel.</p>
Full article ">Figure 4
<p>FTIR analysis of the active ingredients, excipients, blank nanoemulgel, and essential oil-loaded nanoemulgel formulation.</p>
Full article ">Figure 5
<p>The release of cinnamaldehyde essential oil and clove essential oil from the optimized nanoemulgel formulation.</p>
Full article ">Figure 6
<p>Goat buccal mucosal permeation of the essential oil from optimized nanoemulgel formulation.</p>
Full article ">Figure 7
<p>SEM of the essential oil loaded nanoemulgel (EHT = 20.00 Kv, Signal A C2DX, WD 7.5 to 9 mm, resolution (<b>A</b>) = 2.01 kx, (<b>B</b>) = 5.03 KX, (<b>C</b>) = 249 KX, (<b>D</b>) = 25 KX).</p>
Full article ">
21 pages, 11512 KiB  
Article
Isolation and Staining Reveal the Presence of Extracellular DNA in Marine Gel Particles
by Aisha S. M. Al-Wahaibi, Robert C. Upstill-Goddard and J. Grant Burgess
Gels 2023, 9(3), 251; https://doi.org/10.3390/gels9030251 - 21 Mar 2023
Viewed by 2066
Abstract
Marine gel particles (MGP) are amorphous hydrogel exudates from bacteria and microalgae that are ubiquitous in the oceans, but their biochemical composition and function are poorly understood. While dynamic ecological interactions between marine microorganisms and MGPs may result in the secretion and mixing [...] Read more.
Marine gel particles (MGP) are amorphous hydrogel exudates from bacteria and microalgae that are ubiquitous in the oceans, but their biochemical composition and function are poorly understood. While dynamic ecological interactions between marine microorganisms and MGPs may result in the secretion and mixing of bacterial extracellular polymeric substances (EPS) such as nucleic acids, compositional studies currently are limited to the identification of acidic polysaccharides and proteins in transparent exopolymer particles (TEP) and Coomassie stainable particles (CSP). Previous studies targeted MGPs isolated by filtration. We developed a new way of isolating MGPs from seawater in liquid suspension and applied it to identify extracellular DNA (eDNA) in North Sea surface seawater. Seawater was filtered onto polycarbonate (PC) filters with gentle vacuum filtration, and then the filtered particles were gently resuspended in a smaller volume of sterile seawater. The resulting MGPs ranged in size from 0.4 to 100 µm in diameter. eDNA was detected by fluorescent microscopy using YOYO-1 (for eDNA), with Nile red (targeting cell membranes) as a counterstain. TOTO-3 was also used to stain eDNA, with ConA to localise glycoproteins and SYTO-9 for the live/dead staining of cells. Confocal laser scanning microscopy (CLSM) revealed the presence of proteins and polysaccharides. We found eDNA to be universally associated with MGPs. To further elucidate the role of eDNA, we established a model experimental MGP system using bacterial EPS from Pseudoalteromonas atlantica that also contained eDNA. Our results clearly demonstrate the occurrence of eDNA in MGPs, and should aid furthering our understanding of the micro-scale dynamics and fate of MGPs that underly the large-scale processes of carbon cycling and sedimentation in the ocean. Full article
(This article belongs to the Section Gel Analysis and Characterization)
Show Figures

Graphical abstract

Graphical abstract
Full article ">Figure 1
<p>Marine gel particles recovered from PC filters after re-suspension in 0.2 µm filter sterilised seawater. Scale bar = 20 µm, image captured at 63× objective and visualised with phase contrast (<b>A</b>). Scale bar = 50 µm (<b>B</b>–<b>D</b>), image captured at 40× objective for (<b>B</b>) and 20× for (<b>C</b>,<b>D</b>) and visualised using bright-field microscopy.</p>
Full article ">Figure 2
<p>MGP from off the Northumberland coast (North Sea), visualised using bright-field microscopy with fibre light. The MGPs were stained with Alcian blue dye ((<b>A</b>,<b>B</b>); yellow arrows) and with Coomassie blue ((<b>C</b>,<b>D</b>); yellow arrows). Scale bar = 40 µm. Images captured using upright Leica microscope and fibre light with 10× objective.</p>
Full article ">Figure 3
<p>Natural MGPs of different sizes from the North Sea. Bright-field microscopy images of MGPs (<b>A</b>) Nucleic acid SYTO 9 green stain of MGP revealing bacterial presence. Fluorescent staining with DNA dye SYTO 9 (1 nM) (<b>B</b>). Scale bar = 100 µm. Image capture using 20× objective.</p>
Full article ">Figure 4
<p>CLSM images acquired using Leica SP8 of natural MGPs stained with YOYO-1 to localise the presence of eDNA (green). Nile red (red) was used as a counter stain for bacterial cell membranes. Scale bar = 5 µm (<b>A</b>). Image captured using 63× objective. Quantification of the fluorescence intensity of each fluorophore against the control (unstained MGPs) (<b>B</b>). The graph presents the mean ± SD of 15 CLSM micrographs. Error bars represent the standard deviation of the data set (<span class="html-italic">n</span> = 3), <span class="html-italic">p</span> &lt; 0.05.</p>
Full article ">Figure 5
<p>A 3D image of a single natural MGP stained with YOYO-1 (green = extracellular DNA) and Nile red (red = cell membrane). Scale bar = 5 µm. Image captured with Leica SP8 CLSM.</p>
Full article ">Figure 6
<p>CLSM images of natural MGPs stained with TOTO-3 (red) to localise the presence of eDNA, SYTO 9 (green) for intracellular DNA and ConA (blue) for glycoproteins. Scale bar = 5 µm (<b>A</b>). Images acquired with Leica SP8 using 63× objective. Quantification of the fluorescence intensity of each fluorophore against the control (unstained MGP) revealed high mean value of TOTO-3 indicating the presence of eDNA (<b>B</b>). The control is unstained particles. The graphs present the mean ± SD of 15 CLSM micrographs. Error bars represent the standard deviation of the data set (<span class="html-italic">n</span> = 3), <span class="html-italic">p</span> &lt; 0.05.</p>
Full article ">Figure 7
<p>A 3D image of a single natural MGP stained with ConA (blue), TOTO-3 (red)-stained eDNA and SYTO 9 (green)-stained iDNA. Scale bar = 10 µm. Image captured with Leica SP8 CLSM.</p>
Full article ">Figure 8
<p><span class="html-italic">Pseudoalteromonas atlantica</span> biopolymers as MGP representative grown in artificial seawater after 96 h (<b>A</b>) and after 168 h (<b>B</b>). <span class="html-italic">P. atlantica</span> particles captured with inverted microscope using 20× objective. Scale bar = 330 µm (<b>C</b>).</p>
Full article ">Figure 9
<p><span class="html-italic">P. atlantica</span> EPS stained with Alcian blue ((<b>A</b>,<b>B</b>); yellow arrows) and Coomassie blue ((<b>C</b>,<b>D</b>); yellow arrows). Images taken using an upright Leica microscope. Scale bar = 50 µm.</p>
Full article ">Figure 10
<p>CLSM images acquired using Leica SP8 at 63× of <span class="html-italic">P. atlantica</span> EPS MGP model stained for eDNA with YOYO-1 (green); Nile red (red) as counter stain for bacterial cell walls to localise the presence of eDNA. Scale bar = 5 µm (<b>A</b>). Quantification of the fluorescence intensity of each fluorophore revealed high mean value of YOYO-1, indicating the presence of eDNA. The control is unstained particles. The graphs present the mean ± SD of 15 CLSM micrographs. Error bars represent the standard deviation of the data set (<span class="html-italic">n</span> = 3), <span class="html-italic">p</span> &lt; 0.05 (<b>B</b>).</p>
Full article ">Figure 11
<p>A 3D image of <span class="html-italic">P. atlantica</span> particles stained with YOYO-1 (green) for eDNA and Nile red (red). Scale bar = 5 µm.</p>
Full article ">Figure 12
<p>CLSM images acquired using Leica SP8 of <span class="html-italic">P. atlantica</span> EPS as MGP model stained for eDNA with TOTO-3 (red) and SYTO9 as counterstain (green), and ConA for glycoproteins (blue). Scale bar = 5 μm (<b>A</b>). Quantification of the fluorescence intensity of each fluorophore revealed a high mean value. The control is unstained particles. The graphs present the mean ± SD of 15 CLSM micrographs. Error bars represent the standard deviation of the data set (<span class="html-italic">n</span> = 3), <span class="html-italic">p</span> &lt; 0.05 (<b>B</b>).</p>
Full article ">Figure 13
<p>A 3D image of a single particle of <span class="html-italic">P. atlantica</span> particles stained with ConA (blue), TOTO-3 (red) and SYTO 9 (green). Scale bar = 10 µm.</p>
Full article ">
22 pages, 4065 KiB  
Review
Recent Progress in Self-Healable Hydrogel-Based Electroluminescent Devices: A Comprehensive Review
by Melkie Getnet Tadesse and Jörn Felix Lübben
Gels 2023, 9(3), 250; https://doi.org/10.3390/gels9030250 - 21 Mar 2023
Cited by 11 | Viewed by 2205
Abstract
Flexible electronics have gained significant research attention in recent years due to their potential applications as smart and functional materials. Typically, electroluminescence devices produced by hydrogel-based materials are among the most notable flexible electronics. With their excellent flexibility and their remarkable electrical, adaptable [...] Read more.
Flexible electronics have gained significant research attention in recent years due to their potential applications as smart and functional materials. Typically, electroluminescence devices produced by hydrogel-based materials are among the most notable flexible electronics. With their excellent flexibility and their remarkable electrical, adaptable mechanical and self-healing properties, functional hydrogels offer a wealth of insights and opportunities for the fabrication of electroluminescent devices that can be easily integrated into wearable electronics for various applications. Various strategies have been developed and adapted to obtain functional hydrogels, and at the same time, high-performance electroluminescent devices have been fabricated based on these functional hydrogels. This review provides a comprehensive overview of various functional hydrogels that have been used for the development of electroluminescent devices. It also highlights some challenges and future research prospects for hydrogel-based electroluminescent devices. Full article
Show Figures

Graphical abstract

Graphical abstract
Full article ">Figure 1
<p>Different materials for hydrogel-based electroluminescent applications.</p>
Full article ">Figure 2
<p>Basic structure of electroluminescence device.</p>
Full article ">Figure 3
<p>Electrical and luminescence properties of self-healable organic light-emitting devices. (<b>a</b>) Voltage vs. current diagram in which self-healing helps obtain better resistance against deformation. (<b>b</b>) Voltage vs. resistance curve showing the recovery of the crack after deformation. (<b>c</b>) Voltage vs. luminescence curve that shows the comparison of various types of materials with self-healing characteristics, indicating better luminescence behavior. (<b>d</b>) Luminescence ratios at various physicomechanical actions. Re-printed with permission; License Number: 5484060034281 [<a href="#B52-gels-09-00250" class="html-bibr">52</a>]. Copyright ©2023, Journal of Nano energy, 2211-2855/Elsevier Ltd.</p>
Full article ">Figure 4
<p>Self-healing mechanisms for hydrogel materials. Re-printed from an open access article under the terms of Creative Commons Attribution 4.0 International License of Ref. [<a href="#B70-gels-09-00250" class="html-bibr">70</a>].</p>
Full article ">Figure 5
<p>Self-healing and light-emitting performance of electroluminescence devices produced based on polyacrylic acid (PAA)-based hydrogels. (<b>a</b>) Ionic conductivity of PAA conductor after lots of cutting and healing times, showing almost full restoration of ionic conductivity after healing. (<b>b</b>) Dielectric capacitance after lots of healing and cutting times, which restored dielectric permittivity and capacitance and revealed that light-emitting intensity remains constant after healing. The capacitance of the dielectric layer remained constant after various healing cycles with only a 16.8% increase in capacitance at 1000 Hz. (<b>c</b>) Mechanical performance of the EL device with the same healing–cutting times shows restoration of 537 kPa in tensile strength and 2.4 MPa in Young’s modulus. (<b>d</b>) Voltage-luminescence performance of the EL device at the very beginning states showing high mechanical strength and good flexibility. (<b>e</b>) Distribution of the electrical field across the pigment layer (magnified image), showing that the electrical field variation dispersed within the space span. (<b>f</b>) Variation in the electric field. Re-printed from an open- access article under the terms of Creative Commons Attribution 4.0 International License of Ref. [<a href="#B43-gels-09-00250" class="html-bibr">43</a>].</p>
Full article ">Figure 6
<p>Optical and light-extraction stability of silk fibroin hydrogel. (<b>a</b>) Optical transmittance of silk fibroin hydrogel in visible spectrum at various fibroin protein concentrations, showing that as the fibroin concentration increases, the hydrogel becomes yellowish in color. (<b>b</b>) Absolute irradiance of cool and warm white LEDs shows a high peak around 450 nm (blue and orange peaks). (<b>c</b>) Light-extraction efficiency of the silk fibroin hydrogel without top coating and poly(dimethylsiloxane) (PDMS) lens on cool and warm white LEDs showing that a decrease in silk concentration resulted in preferable integration with the warm white LEDs. (<b>d</b>) Loss in weight of silk hydrogel, showing rapid weight loss after 24 hrs. The weight loss is due to the evaporation occurred during the change of the temperature of the environment. Re-printed from an open access article under the terms of Creative Commons Attribution 4.0 International License of Ref. [<a href="#B89-gels-09-00250" class="html-bibr">89</a>].</p>
Full article ">Figure 7
<p>Mechanical, rheological, and electrical characteristics of CMC-based hydrogels. (<b>a</b>) Stress–strain curves of CMC-based hydrogels. (<b>b</b>) Resistance of CMC-based hydrogels at 200% stretch percentage against time. (<b>c</b>) Modulus vs. time curve for CMC-based hydrogels. (<b>d</b>) Oscillation frequency sweep curve of CMC-based hydrogels. Re-printed from an open access article under the terms of Creative Commons Attribution 4.0 International License of Ref. [<a href="#B121-gels-09-00250" class="html-bibr">121</a>].</p>
Full article ">
18 pages, 2081 KiB  
Review
Research Progress of Polysaccharide-Based Natural Polymer Hydrogels in Water Purification
by Wenxu Zhang, Yan Xu, Xuyang Mu, Sijie Li, Xiaoming Liu and Ziqiang Lei
Gels 2023, 9(3), 249; https://doi.org/10.3390/gels9030249 - 20 Mar 2023
Cited by 10 | Viewed by 2734
Abstract
The pollution and scarcity of freshwater resources are global problems that have a significant influence on human life. It is very important to remove harmful substances in the water to realize the recycling of water resources. Hydrogels have recently attracted attention due to [...] Read more.
The pollution and scarcity of freshwater resources are global problems that have a significant influence on human life. It is very important to remove harmful substances in the water to realize the recycling of water resources. Hydrogels have recently attracted attention due to their special three-dimensional network structure, large surface area, and pores, which show great potential for the removal of pollutants in water. In their preparation, natural polymers are one of the preferred materials because of their wide availability, low cost, and easy thermal degradation. However, when it is directly used for adsorption, its performance is unsatisfactory, so it usually needs to be modified in the preparation process. This paper reviews the modification and adsorption properties of polysaccharide-based natural polymer hydrogels, such as cellulose, chitosan, starch, and sodium alginate, and discusses the effects of their types and structures on performance and recent technological advances. Full article
(This article belongs to the Special Issue Synthesis and Applications of Hydrogels)
Show Figures

Graphical abstract

Graphical abstract
Full article ">Figure 1
<p>(<b>a</b>) The adsorption and release mechanisms of MB on gel-like adsorbent Cellulose-SH. [<a href="#B12-gels-09-00249" class="html-bibr">12</a>]; (<b>b</b>) schematic shows the preparation of the CMC/PAM composite hydrogel, the adsorption of CuII ions, the formation of Cu NPs in the hydrogel network, and the catalytic reaction of 4-NP to 4-AP [<a href="#B13-gels-09-00249" class="html-bibr">13</a>]. Informed consent was obtained from all subjects involved in the study.</p>
Full article ">Figure 2
<p>(<b>a</b>) Formation mechanism of KC/CTS/Ca<sup>2+</sup> PCDNH [<a href="#B22-gels-09-00249" class="html-bibr">22</a>]. (<b>b</b>) Schematic illustration of the preparation process of CTS/SA/Ca<sup>2+</sup> PCDNH [<a href="#B24-gels-09-00249" class="html-bibr">24</a>]. Informed consent was obtained from all subjects involved in the study.</p>
Full article ">Figure 3
<p>(<b>a</b>) Schematic illustration of the synthesis process and proposed chemical structure of the STAH [<a href="#B28-gels-09-00249" class="html-bibr">28</a>]. (<b>b</b>) Schematic diagrams for the morphological changes during the formation of honeycomb-like starch granules [<a href="#B29-gels-09-00249" class="html-bibr">29</a>]. Informed consent was obtained from all subjects involved in the study.</p>
Full article ">Figure 4
<p>(<b>a</b>) Pathway of the preparation of hydrogel spheres [<a href="#B35-gels-09-00249" class="html-bibr">35</a>]. (<b>b</b>) Schematic synthetic route of the alginate/PVA magnetic microspheres [<a href="#B38-gels-09-00249" class="html-bibr">38</a>]. Informed consent was obtained from all subjects involved in the study.</p>
Full article ">Figure 5
<p>Schematic diagram of the adsorption process in three modes.</p>
Full article ">
17 pages, 9869 KiB  
Article
Synthesis of NVCL-NIPAM Hydrogels Using PEGDMA as a Chemical Crosslinker for Controlled Swelling Behaviours in Potential Shapeshifting Applications
by Billy Shu Hieng Tie, Elaine Halligan, Shuo Zhuo, Gavin Keane and Luke Geever
Gels 2023, 9(3), 248; https://doi.org/10.3390/gels9030248 - 20 Mar 2023
Cited by 4 | Viewed by 1947
Abstract
Stimuli-responsive hydrogels have recently gained interest within shapeshifting applications due to their capabilities to expand in water and their altering swelling properties when triggered by stimuli, such as pH and heat. While conventional hydrogels lose their mechanical strength during swelling, most shapeshifting applications [...] Read more.
Stimuli-responsive hydrogels have recently gained interest within shapeshifting applications due to their capabilities to expand in water and their altering swelling properties when triggered by stimuli, such as pH and heat. While conventional hydrogels lose their mechanical strength during swelling, most shapeshifting applications require materials to have mechanical strength within a satisfactory range to perform specified tasks. Thus, stronger hydrogels are needed for shapeshifting applications. Poly (N-isopropylacrylamide) (PNIPAm) and poly (N-vinyl caprolactam) (PNVCL) are the most popular thermosensitive hydrogels studied. Their close-to-physiological lower critical solution temperature (LCST) makes them superior candidates in biomedicine. In this study, copolymers made of NVCL and NIPAm and chemically crosslinked using poly (ethylene glycol) dimethacrylate (PEGDMA) were fabricated. Successful polymerisation was proven via Fourier transform infrared spectroscopy (FTIR). The effects of incorporating comonomer and crosslinker on the LCST were found minimal using cloud-point measurements, ultraviolet (UV) spectroscopy, and differential scanning calorimetry (DSC). Formulations that completed three cycles of thermo-reversing pulsatile swelling are demonstrated. Lastly, rheological analysis validated the mechanical strength of PNVCL, which was improved due to the incorporation of NIPAm and PEGDMA. This study showcases potential smart thermosensitive NVCL-based copolymers that can be applied in the biomedical shapeshifting area. Full article
(This article belongs to the Special Issue Advances in Responsive Hydrogels)
Show Figures

Figure 1

Figure 1
<p>Example of a silicone mould used for the fabrication of xerogels and one of the transparent, glass-like discs prepared.</p>
Full article ">Figure 2
<p>FTIR spectra showing peaks detected from monomers vanished in synthesised copolymers.</p>
Full article ">Figure 3
<p>Cloud-point measurements of the aqueous solutions: (<b>a</b>) Transparent aqueous solutions at room temperature. (<b>b</b>) Upon heating, the aqueous solutions became turbid.</p>
Full article ">Figure 4
<p>UV spectroscopy of the aqueous solutions of FP14, FP32, FP33, FP34, FP35, FP36, and FP37.</p>
Full article ">Figure 5
<p>A representative DSC heating curve of a fully swollen chemically crosslinked hydrogel for analyzing its LCST.</p>
Full article ">Figure 6
<p>One of the dried chemically crosslinked gels analyzed for Tg using the DSC method.</p>
Full article ">Figure 7
<p>Poor surface quality of FC14 after 72 h of swelling at room temperature.</p>
Full article ">Figure 8
<p>Swollen gels at equilibrium at room temperature: (<b>a</b>) FC32; (<b>b</b>) FC33; (<b>c</b>) FC34; (<b>d</b>) FC35; (<b>e</b>) FC36; and (<b>f</b>) FC37.</p>
Full article ">Figure 9
<p>Swelling ratio (%) of formulations FC32–FC37.</p>
Full article ">Figure 10
<p>Pulsatile swelling behaviours of FC34, FC36, and FC37 at 20 and 50 °C. First cycle: 20 °C in the beginning, 50 °C from 72 h; second cycle: 20 °C from 168 h, 50 °C from 240 h; and third cycle: 20 °C from 336 h and 50 °C from 408 h.</p>
Full article ">Figure 11
<p>Chemically crosslinked gels tested from pulsatile swelling studies: (<b>a</b>) Dried FC34 after three cycles; (<b>b</b>) broken FC36 at 192 h; and (<b>c</b>) dried, partially broken FC37 after three cycles.</p>
Full article ">Figure 12
<p>Microscopic view of dried FC34 disc after three cycles of pulsatile swelling (Olympus CX23, magnification 40×).</p>
Full article ">Figure 13
<p>A plot of storage modulus examined for each of the chemically crosslinked hydrogels.</p>
Full article ">
26 pages, 6095 KiB  
Article
Advanced Polymeric Membranes as Biomaterials Based on Marine Sources Envisaging the Regeneration of Human Tissues
by Duarte Nuno Carvalho, Flávia C. M. Lobo, Luísa C. Rodrigues, Emanuel M. Fernandes, David S. Williams, Andrew Mearns-Spragg, Carmen G. Sotelo, Ricardo I. Perez-Martín, Rui L. Reis, Michael Gelinsky and Tiago H. Silva
Gels 2023, 9(3), 247; https://doi.org/10.3390/gels9030247 - 20 Mar 2023
Cited by 2 | Viewed by 2372
Abstract
The self-repair capacity of human tissue is limited, motivating the arising of tissue engineering (TE) in building temporary scaffolds that envisage the regeneration of human tissues, including articular cartilage. However, despite the large number of preclinical data available, current therapies are not yet [...] Read more.
The self-repair capacity of human tissue is limited, motivating the arising of tissue engineering (TE) in building temporary scaffolds that envisage the regeneration of human tissues, including articular cartilage. However, despite the large number of preclinical data available, current therapies are not yet capable of fully restoring the entire healthy structure and function on this tissue when significantly damaged. For this reason, new biomaterial approaches are needed, and the present work proposes the development and characterization of innovative polymeric membranes formed by blending marine origin polymers, in a chemical free cross-linking approach, as biomaterials for tissue regeneration. The results confirmed the production of polyelectrolyte complexes molded as membranes, with structural stability resulting from natural intermolecular interactions between the marine biopolymers collagen, chitosan and fucoidan. Furthermore, the polymeric membranes presented adequate swelling ability without compromising cohesiveness (between 300 and 600%), appropriate surface properties, revealing mechanical properties similar to native articular cartilage. From the different formulations studied, the ones performing better were the ones produced with 3 % shark collagen, 3% chitosan and 10% fucoidan, as well as with 5% jellyfish collagen, 3% shark collagen, 3% chitosan and 10% fucoidan. Overall, the novel marine polymeric membranes demonstrated to have promising chemical, and physical properties for tissue engineering approaches, namely as thin biomaterial that can be applied over the damaged articular cartilage aiming its regeneration. Full article
(This article belongs to the Special Issue Biosoursed and Bioinspired Gels for Biomedical Applications)
Show Figures

Graphical abstract

Graphical abstract
Full article ">Figure 1
<p><sup>1</sup>H Nuclear magnetic resonance (<sup>1</sup>H-NMR) spectra of each marine polymer: (<b>a</b>) Collagen from jellyfish (jCOL); (<b>b</b>) Collagen from shark (sCOL); (<b>c</b>) Chitosan from squid pens (sCHT) and the respective degree of deacetylation (DD) and (<b>d</b>) Fucoidan from brown algae (aFUC).</p>
Full article ">Figure 2
<p>Quantification of total collagen concentration on developed membranes (M/J3 to M/J5S5). Data bars are mean ± standard error (n = 3). Comparative statistical analysis was performed, where systems M/J3, MJ3S3 and M//J5S5 include statistical significance of <span class="html-italic">p</span> &lt; 0.05 (*), and ns (no significant) for the rest of systems.</p>
Full article ">Figure 3
<p>Determination of thiol (-SH) contents (<b>a</b>) determination on marine polymers (jCOL, sCOL, sCHT and aFUC), and (<b>b</b>) determination on the developed biomaterial-membranes (M/J3 to M/J5S5). Data bars are mean ± standard error (n = 3). The membrane samples do not show statistical differences represented by ns (no significance) except those represented with the symbol **** (<span class="html-italic">p</span> &lt; 0.0001).</p>
Full article ">Figure 4
<p>XPS analysis on the marine biopolymers and the developed membranes. (<b>a</b>) Atomic concentration (%) of main elements at the surface of the material; (<b>b</b>) atomic concentration (%) of main elements from in-depth profile assay as a function of etch time; and (<b>c</b>) determination of the sulfate contents (%) in all samples.</p>
Full article ">Figure 5
<p>Scanning electron microscopy (SEM) images of the surface of all developed membranes (M/J3 to M/J5S5) according to the established formulations, (<b>a</b>–<b>h</b>), respectively. All samples were imaged at the magnifications of 30×/100 µm (<b>main</b>), 100×/100 µm (<b>bottom left</b>) and 500×/10 µm (<b>top right</b>).</p>
Full article ">Figure 6
<p>Water contact angle (WCA) measurements for the study of surface hydrophilicity on the polymeric membranes: (<b>a</b>) representative image of a water droplet deposited on the membrane surface, and (<b>b</b>) statistical analysis of the mean water contact angle obtained for the different membranes. Results are exhibited as mean ± standard error of three independent experiments. Statistical analysis of multiple comparison test (<span class="html-italic">p</span> &lt; 0.05) was performed, showing a significance of * (<span class="html-italic">p</span> &lt; 0.05), ** (<span class="html-italic">p</span> &lt; 0.01), and *** (<span class="html-italic">p</span> &lt; 0.001).</p>
Full article ">Figure 7
<p>Surface Zeta (ζ) potential measurements on the membranes M/J3 to M/J5S5: (<b>a</b>) digital image of one representative membrane sample (M/J3), being glued to one surface of the surpass container, where (<b>a<sub>1</sub></b>) illustrates the situation before the measurement and (<b>a<sub>2</sub></b>) after used; and (<b>b</b>) titration curves of surface zeta potential within the pH range of 5.5 to 8.</p>
Full article ">Figure 8
<p>Assessment of the degree of swelling (measured as water uptake) in each membrane (M/J3 to M/J5S5) upon incubation in PBS solution for up to 21 days (504 h). Data are presented as mean ± standard error (n = 3).</p>
Full article ">Figure 9
<p>Differential scanning calorimetry (DSC) thermograms of the developed polymeric membranes M/J3 to M/J5S5 experiencing controlled heating from −40 to 200 °C: (<b>a</b>) M/J3 and M/J5; (<b>b</b>) M/S3 and M/S5; (<b>c</b>) M/J3S3 and M/J5S3 and (<b>d</b>) M/J3S5 and M/J5S5.</p>
Full article ">Figure 10
<p>Thermogravimetric analysis (TGA) and derivative thermogravimetry (DTG—shown in blue) curves of the developed membranes in response to controlled heating from 40 to 800 °C: (<b>a</b>) M/J3 and M/J5; (<b>b</b>) M/S3 and M/S5; (<b>c</b>) M/J3S3 and M/J5S3; and (<b>d</b>) M/J3S5 and M/J5S5.</p>
Full article ">Figure 11
<p>The mechanical properties of the marine biopolymers membranes (M/J3 to M/J5S5) addressed using uniaxial tensile testing. (<b>a</b>) Digital image of one condition (membrane M/J3) attached to Instron claws under load (representative of all samples); (<b>b</b>) Tensile stress–strain curves; (<b>c</b>) Young´s modulus and maximum tensile strength, and (<b>d</b>) strain at break and strain at maximum load. In graphics of (<b>c,d</b>), the error bars contain standard deviation (SD) from the mean values (not less than n = 5) and the symbols represent the statistical significance of * (<span class="html-italic">p</span> &lt; 0.05), ** (<span class="html-italic">p</span> &lt; 0.01), *** (<span class="html-italic">p</span> &lt; 0.001) using one-way ANOVA with Tukey´s multiple comparisons test.</p>
Full article ">Figure 12
<p>Preparation of marine biopolymers membrane. (<b>a</b>) Schematic representation of biomaterial-membrane formation process using a 3D printed PLA mold comprising a nylon mesh, where the biopolymers blend is placed and compacted while removing the excess of solvent; (<b>b</b>) Representative images of the molding procedure, the produced membranes and the respective dimensions.</p>
Full article ">
24 pages, 5622 KiB  
Article
Study of Hydroxypropyl β-Cyclodextrin and Puerarin Inclusion Complexes Encapsulated in Sodium Alginate-Grafted 2-Acrylamido-2-Methyl-1-Propane Sulfonic Acid Hydrogels for Oral Controlled Drug Delivery
by Abid Naeem, Chengqun Yu, Weifeng Zhu, Zhenzhong Zang and Yongmei Guan
Gels 2023, 9(3), 246; https://doi.org/10.3390/gels9030246 - 20 Mar 2023
Cited by 5 | Viewed by 2451
Abstract
Puerarin has been reported to have anti-inflammatory, antioxidant, immunity enhancement, neuroprotective, cardioprotective, antitumor, and antimicrobial effects. However, due to its poor pharmacokinetic profile (low oral bioavailability, rapid systemic clearance, and short half-life) and physicochemical properties (e.g., low aqueous solubility and poor stability) its [...] Read more.
Puerarin has been reported to have anti-inflammatory, antioxidant, immunity enhancement, neuroprotective, cardioprotective, antitumor, and antimicrobial effects. However, due to its poor pharmacokinetic profile (low oral bioavailability, rapid systemic clearance, and short half-life) and physicochemical properties (e.g., low aqueous solubility and poor stability) its therapeutic efficacy is limited. The hydrophobic nature of puerarin makes it difficult to load into hydrogels. Hence, hydroxypropyl-β-cyclodextrin (HP-βCD)-puerarin inclusion complexes (PIC) were first prepared to enhance solubility and stability; then, they were incorporated into sodium alginate-grafted 2-acrylamido-2-methyl-1-propane sulfonic acid (SA-g-AMPS) hydrogels for controlled drug release in order to increase bioavailability. The puerarin inclusion complexes and hydrogels were evaluated via FTIR, TGA, SEM, XRD, and DSC. Swelling ratio and drug release were both highest at pH 1.2 (36.38% swelling ratio and 86.17% drug release) versus pH 7.4 (27.50% swelling ratio and 73.25% drug release) after 48 h. The hydrogels exhibited high porosity (85%) and biodegradability (10% in 1 week in phosphate buffer saline). In addition, the in vitro antioxidative activity (DPPH (71%), ABTS (75%), and antibacterial activity (Staphylococcus aureus, Escherichia coli, and Pseudomonas aeruginosa) indicated the puerarin inclusion complex-loaded hydrogels had antioxidative and antibacterial capabilities. This study provides a basis for the successful encapsulation of hydrophobic drugs inside hydrogels for controlled drug release and other purposes. Full article
Show Figures

Figure 1

Figure 1
<p><sup>1</sup>H NMR spectra of puerarin and HP-βCD inclusion complexes (<b>A</b>), and FTIR spectra of pure components and hydrogels (<b>B</b>).</p>
Full article ">Figure 2
<p>TGA of HP-βCD, puerarin, sodium alginate, AMPS, <span class="html-italic">PIC</span>, unloaded and <span class="html-italic">PIC</span>-loaded hydrogels.</p>
Full article ">Figure 3
<p>The DSC of puerarin, HP-βCD, SA, <span class="html-italic">PIC</span>, AMPS, unloaded, and <span class="html-italic">PIC</span>-loaded hydrogels.</p>
Full article ">Figure 4
<p>The XRD pattern of the formulation ingredients, inclusion complexes, and hydrogels synthesized.</p>
Full article ">Figure 5
<p>SEM images of HP-βCD (<b>A</b>), puerarin (<b>B</b>), <span class="html-italic">PIC</span> (<b>C</b>), unloaded hydrogels at 400× (<b>D</b>), and <span class="html-italic">PIC</span>-loaded hydrogels at 400× (<b>E</b>).</p>
Full article ">Figure 6
<p>Effect of sodium alginate (<b>A</b>), AMPS (<b>B</b>), and EGDMA (<b>C</b>) on sol–gel fraction and porosity of fabricated hydrogels.</p>
Full article ">Figure 7
<p>Effect of ingredients on the biodegradation of hydrogels: sodium alginate (SAE-7,1,9) (<b>A</b>), AMPS (SAE-4,1,6) (<b>B</b>), and EGDMA (SAE-1,2,3) (<b>C</b>) on the in vitro biodegradation of the developed hydrogels.</p>
Full article ">Figure 8
<p>The appearance of synthesized hydrogels at pH 1.2 (<b>A</b>) and pH 7.4 (<b>B</b>). Hydrogel swelling curves over time at pH 1.2 (<b>C</b>) and 7.4 (<b>D</b>).</p>
Full article ">Figure 9
<p>In vitro drug release of SA-g-AMPS hydrogels at pH 1.2 (<b>A</b>) and 7.4 (<b>B</b>).</p>
Full article ">Figure 10
<p>Antioxidation effect of SA-g-AMPS hydrogels against DPPH (<b>A</b>) and ABTS (<b>B</b>). Here, * shows the <span class="html-italic">p</span> value &lt; 0.05, ** <span class="html-italic">p</span> &lt; 0.01, and *** <span class="html-italic">p</span> &lt; 0.001.</p>
Full article ">Figure 11
<p>Antibacterial effects (zone of inhibition) of SA-g-AMPS hydrogels.</p>
Full article ">Figure 12
<p>The proposed chemical structure of the synthesized SA-<span class="html-italic">g</span>-AMPS hydrogels.</p>
Full article ">
21 pages, 1303 KiB  
Review
Research Advances on Hydrogel-Based Materials for Tissue Regeneration and Remineralization in Tooth
by Zhijun Zhang, Fei Bi and Weihua Guo
Gels 2023, 9(3), 245; https://doi.org/10.3390/gels9030245 - 20 Mar 2023
Cited by 6 | Viewed by 4253
Abstract
Tissue regeneration and remineralization in teeth is a long-term and complex biological process, including the regeneration of pulp and periodontal tissue, and re-mineralization of dentin, cementum and enamel. Suitable materials are needed to provide cell scaffolds, drug carriers or mineralization in this environment. [...] Read more.
Tissue regeneration and remineralization in teeth is a long-term and complex biological process, including the regeneration of pulp and periodontal tissue, and re-mineralization of dentin, cementum and enamel. Suitable materials are needed to provide cell scaffolds, drug carriers or mineralization in this environment. These materials need to regulate the unique odontogenesis process. Hydrogel-based materials are considered good scaffolds for pulp and periodontal tissue repair in the field of tissue engineering due to their inherent biocompatibility and biodegradability, slow release of drugs, simulation of extracellular matrix, and the ability to provide a mineralized template. The excellent properties of hydrogels make them particularly attractive in the research of tissue regeneration and remineralization in teeth. This paper introduces the latest progress of hydrogel-based materials in pulp and periodontal tissue regeneration and hard tissue mineralization and puts forward prospects for their future application. Overall, this review reveals the application of hydrogel-based materials in tissue regeneration and remineralization in teeth. Full article
Show Figures

Figure 1

Figure 1
<p>Application of hydrogel in pulp tissue regeneration.</p>
Full article ">Figure 2
<p>Application of hydrogel microspheres in pulp regeneration.</p>
Full article ">Figure 3
<p>Application of hydrogel in periodontal tissue regeneration.</p>
Full article ">Figure 4
<p>Application of hydrogel in hard tissue regeneration of teeth.</p>
Full article ">
20 pages, 12170 KiB  
Article
Preclinical Potential of Probiotic-Loaded Novel Gelatin–Oil Vaginal Suppositories: Efficacy, Stability, and Safety Studies
by Anchal Bassi, Garima Sharma, Parneet Kaur Deol, Ratna Sudha Madempudi and Indu Pal Kaur
Gels 2023, 9(3), 244; https://doi.org/10.3390/gels9030244 - 19 Mar 2023
Cited by 4 | Viewed by 2791
Abstract
The current study describes a suppository base composed of aqueous gelatin solution emulsifying oil globules with probiotic cells dispersed within. The favorable mechanical properties of gelatin to provide a solid gelled structure, and the tendency of its proteins to unravel into long strings [...] Read more.
The current study describes a suppository base composed of aqueous gelatin solution emulsifying oil globules with probiotic cells dispersed within. The favorable mechanical properties of gelatin to provide a solid gelled structure, and the tendency of its proteins to unravel into long strings that interlace when cooled, lead to a three-dimensional structure that can trap a lot of liquid, which was exploited herein to result in a promising suppository form. The latter maintained incorporated probiotic spores of Bacillus coagulans Unique IS-2 in a viable but non-germinating form, preventing spoilage during storage and imparting protection against the growth of any other contaminating organism (self-preserved formulation). The gelatin–oil–probiotic suppository showed uniformity in weight and probiotic content (23 ± 2.481 × 10⁸ cfu) with favorable swelling (double) followed by erosion and complete dissolution within 6 h of administration, leading to the release of probiotic (within 45 min) from the matrix into simulated vaginal fluid. Microscopic images indicated presence of probiotics and oil globules enmeshed in the gelatin network. High viability (24.3 ± 0.46 × 10⁸), germination upon application and a self-preserving nature were attributed to the optimum water activity (0.593 aw) of the developed composition. The retention of suppositories, germination of probiotics and their in vivo efficacy and safety in vulvovaginal candidiasis murine model are also reported. Full article
(This article belongs to the Special Issue Women’s Special Issue Series: Gels)
Show Figures

Figure 1

Figure 1
<p>Suppositories after (<b>A</b>) 0 h and (<b>B</b>) 6 h of swelling (<span class="html-italic">n</span> = 3). SVF: simulated vaginal fluid.</p>
Full article ">Figure 2
<p>Optical microscopic images of blank ((<b>A</b>): 10× and (<b>B</b>): 100×) and probiotic-loaded formulation ((<b>C</b>): 10× and (<b>D</b>): 100×).</p>
Full article ">Figure 3
<p>In vitro release profile of probiotic from gelatin–oil suppositories. All values differ significantly except those marked similarly.</p>
Full article ">Figure 4
<p>Particle size distribution of blank emulgel suppository dispersed in water (100 mL) at (<b>a</b>) zero time, (<b>b</b>) after storing at 25 °C and (<b>c</b>) 37 °C for 2 h (<b>b1</b>,<b>c1</b>), 6 h (<b>b2</b>,<b>c2</b>) and 24 h (<b>b3</b>,<b>c3</b>), respectively.</p>
Full article ">Figure 5
<p>Particle size distribution of probiotic-loaded emulgel suppository dispersed in water (100 mL) at (<b>a</b>) zero time, (<b>b</b>) after storing at 25 °C and (<b>c</b>) 37 °C for 2 h (<b>b1</b>, <b>c1</b>), 6 h (<b>b2</b>,<b>c2</b>) and 24 h (<b>b3</b>,<b>c3</b>).</p>
Full article ">Figure 6
<p>Scanning electron microscopy of <span class="html-italic">Bacillus coagulans</span>-loaded suppository (<b>A</b>) 100× (<b>B</b>) 500× magnification.</p>
Full article ">Figure 7
<p>Germination of <span class="html-italic">Bacillus coagulans</span> at 100× magnification after (<b>A</b>) 2 h, (<b>B</b>) 4 h, (<b>C</b>) 6 h, and (<b>D</b>) 24 h.</p>
Full article ">Figure 8
<p>In vivo retention of trypan-blue-labeled suppositories observed at different time points (from (<b>a</b>) at 10 min to (<b>g</b>) at 4 h) in the dissected vaginal cavity of rats. High-intensity blue color marks the presence of suppository and fading blue color (from 60 min onwards) marks the dissolution/melting of the suppository at the vaginal site.</p>
Full article ">Figure 9
<p>Histology of female reproductive tract of rat showing sections of stratified epithelial layers of (<b>A</b>) control and (<b>B</b>) treatment groups; cervix area of (<b>C</b>) control group and (<b>D</b>) treated group; (<b>E</b>) uterus of treated group; and (<b>F</b>) epithelial layer of treated group.</p>
Full article ">Figure 10
<p>Co-aggregation of <span class="html-italic">Candida albicans</span> with (<b>A</b>) free <span class="html-italic">Bacillus coagulans</span>, (<b>B</b>) blank emulgel suppositories (absence of co-aggregates), and (<b>C</b>) <span class="html-italic">Bacillus coagulans</span> incubated with probiotic-loaded gelatin–oil suppositories.</p>
Full article ">Figure 11
<p>Macroscopic observations of vaginal openings of (<b>A</b>) probiotic-loaded suppository treatment group; (<b>B</b>) Candida-infected group; the isolated reproductive tracts of (<b>C</b>) probiotic-loaded suppository treatment group at day 7, showing healthy pink tissue, and (<b>D</b>) Candida infected group with no treatment, showing inflamed tissue.</p>
Full article ">Figure 12
<p>Effect of various treatments every day for seven days on the reduction in cfu of Candida in the rat model of vulvovaginal candidiasis (<span class="html-italic">n</span> = 3). All groups differ significantly except those marked similarly (intraday comparison between different groups) at <span class="html-italic">p</span> &lt; 0.001.</p>
Full article ">
24 pages, 2576 KiB  
Article
Biomanufacturing Recombinantly Expressed Cripto-1 Protein in Anchorage-Dependent Mammalian Cells Growing in Suspension Bioreactors within a Three-Dimensional Hydrogel Microcarrier
by Rachel Lev, Orit Bar-Am, Yoni Lati, Ombretta Guardiola, Gabriella Minchiotti and Dror Seliktar
Gels 2023, 9(3), 243; https://doi.org/10.3390/gels9030243 - 18 Mar 2023
Cited by 3 | Viewed by 2246
Abstract
Biotherapeutic soluble proteins that are recombinantly expressed in mammalian cells can pose a challenge when biomanufacturing in three-dimensional (3D) suspension culture systems. Herein, we tested a 3D hydrogel microcarrier for a suspension culture of HEK293 cells overexpressing recombinant Cripto-1 protein. Cripto-1 is an [...] Read more.
Biotherapeutic soluble proteins that are recombinantly expressed in mammalian cells can pose a challenge when biomanufacturing in three-dimensional (3D) suspension culture systems. Herein, we tested a 3D hydrogel microcarrier for a suspension culture of HEK293 cells overexpressing recombinant Cripto-1 protein. Cripto-1 is an extracellular protein that is involved in developmental processes and has recently been reported to have therapeutic effects in alleviating muscle injury and diseases by regulating muscle regeneration through satellite cell progression toward the myogenic lineage. Cripto-overexpressing HEK293 cell lines were cultured in microcarriers made from poly (ethylene glycol)-fibrinogen (PF) hydrogels, which provided the 3D substrate for cell growth and protein production in stirred bioreactors. The PF microcarriers were designed with sufficient strength to resist hydrodynamic deterioration and biodegradation associated with suspension culture in stirred bioreactors for up to 21 days. The yield of purified Cripto-1 obtained using the 3D PF microcarriers was significantly higher than that obtained with a two-dimensional (2D) culture system. The bioactivity of the 3D-produced Cripto-1 was equivalent to commercially available Cripto-1 in terms of an ELISA binding assay, a muscle cell proliferation assay, and a myogenic differentiation assay. Taken together, these data indicate that 3D microcarriers made from PF can be combined with mammalian cell expression systems to improve the biomanufacturing of protein-based therapeutics for muscle injuries. Full article
(This article belongs to the Special Issue Polymer Networks and Gels 2022)
Show Figures

Figure 1

Figure 1
<p>Schematic illustration of PF microcarriers and the bioprocessing procedure for making Cripto protein. (<b>A</b>) <b>i</b>: A set of bioreactors were used for Cripto production; each bioreactor cultivates microcarriers made of PEG-fibrinogen (PF) hydrogel containing Cripto-overexpressing HEK293 cells. <b>ii</b>: Phase contrast microscopy image of a typical microcarrier shows individual cells growing in the 3D PF hydrogel. <b>iii</b>: Bioreactor cultivation timeline of a 3-week culture period of the microcarriers in the bioreactors. Cells were cultured in growth medium (depicted in red) on days 0, 7, and 14 for 3 days of maintenance, with the medium then changed for starvation medium (depicted in yellow) on days 3, 10, and 17 for the collection step that lasted 4 days each time. (<b>B</b>) <b>i</b>: The manufactured Cripto protein was concentrated and diafiltrated using PALL Centramate membrane. <b>ii</b>: The Cripto protein was purified using a Ni-NTA column followed by a dialysis step. <b>iii</b>: Finally, structural and functional characterization of the purified Cripto protein was performed by SDS-PAGE, ELISA, and bioactivity assays.</p>
Full article ">Figure 2
<p>Viability of HEK293 cells within PF microcarriers in 3D culture. (<b>A</b>–<b>C</b>) Cell viability of HEK293 cells growing in the 3D PF microcarriers (8 mg/mL, G’ = 250–2000 Pa) in bioreactors was verified using a calcein/ethidium assay. Initially, viable cells were distributed uniformly in the microcarriers on day 1 (<b>A</b>) and organized into colonies by day 7 (<b>B</b>), remaining viable beyond day 21 (<b>C</b>). High-magnification images of cells stained with f-actin FITC-phalloidin (green) and DAPI (nucleus in blue) show the cells initially distributed uniformly within the microcarriers on day 1 (<b>D</b>). After 7 and 21 days, the cell colonies were also distributed uniformly throughout the microcarrier (<b>E</b>,<b>F</b>). (<b>G</b>) The number of living cells was quantified in the microcarriers as a function of culture time (up to 7 days) and PF modulus (G’ = 250–2000 Pa). The G’ values shown in the graph correspond to the PF hydrogels made from different formulations, as determined based on data provided in <a href="#app1-gels-09-00243" class="html-app">Supplementary Figure S1</a>. As can be seen, both PF modulus and culture time affected the number of HEK293 cells in the microcarriers. (<b>H</b>) Cell viability over 21 days in PF microcarriers (G’ = 1000) with suspension culture, as measured by a trypan blue exclusion assay. Each time point represents data from an average of several bioreactors (3 &lt; <span class="html-italic">n</span> &lt; 18). (<b>I</b>) Cell proliferation in PF microcarriers (G’ = 1000) with suspension culture in bioreactors for up to 21 days, as measured by a PI staining assay; each time point is represented by an average of at least three different experiments (<span class="html-italic">n</span> &gt; 3). All results shown are as mean ± S.D. of at least three independent experiments.</p>
Full article ">Figure 3
<p>The production yield, activity, and purification of recombinant Cripto produced in the 3D microcarriers as compared to the 2D method. (<b>A</b>) SDS-PAGE analysis of the purification steps of recombinant Cripto: lane M is the protein molecular weight marker; lane 1 is the protein solution from ultrafiltration; lane 2 is the flowthrough after the first passage through the His-tag affinity Ni-NTA resin; lane 3 is the flowthrough after the second passage through the same resin; lane 4 is the first wash step; lane 5 is the second wash step; lane 6 is the first elution from the His-tag affinity Ni-NTA resin; and lane 7 is the second elution from the same resin. The band at approximately 27 kDa is the Cripto protein (indicated by the red arrow). (<b>B</b>) Quantitative amounts of Cripto protein produced in the 3D batch (Cripto<sub>(3D)</sub>) with HEK293 cells encapsulated in PF microcarriers and incubated in bioreactors after three rounds of harvesting are compared to the maximum amount of Cripto produced in the 2D batch (Cripto<sub>(2D)</sub>) with HEK293 cells adherent to cell culture plates and cultured to their density threshold limits. An initial cell seeding of 3.2 × 10<sup>6</sup> cells was used for both techniques. (<b>C</b>) The biological activity of recombinant Cripto was compared for Cripto produced in PF microcarriers versus the 2D method by measuring binding affinity to the AlK4 receptor. Four independent experiments were carried out for the 3D system and three independent experiments were performed for the 2D cultivation method. Results are shown as mean ± S.D. *** indicates <span class="html-italic">p</span> &lt; 0.001.</p>
Full article ">Figure 4
<p>The effect of Cripto produced in 3D microcarriers on C2C12 cell proliferation detected by the BrdU incorporation assay. (<b>A</b>) C2C12 myoblast proliferation was evaluated by the BrdU incorporation assay after being cultured for 48 h in serum-free medium containing Cripto produced in 3D microcarriers (Cripto<sub>(3D)</sub>) or commercially available Cripto (Cripto<sub>(R&amp;D)</sub>). Also evaluated were a bFGF medium positive control and a serum-free medium negative control. (<b>B</b>) The recombinant Cripto induces myoblast proliferation in a dose-dependent pattern; increasing concentrations of Cripto<sub>(3D)</sub> and Cripto<sub>(R&amp;D)</sub> were added to C2C12 cells, and proliferation was quantified by the BrdU incorporation assay. (<b>C</b>) Cell proliferation was further evaluated by counting the total number of live cells. The proliferative effect of Cripto<sub>(3D)</sub> was compared with that of commercial Cripto<sub>(R&amp;D)</sub>. The data are presented as mean ± S.D. from at least three independent experiments. * indicates <span class="html-italic">p</span> &lt; 0.05, ** indicates <span class="html-italic">p</span> &lt; 0.01, *** indicates <span class="html-italic">p</span> &lt; 0.001.</p>
Full article ">Figure 5
<p>Proliferation analysis using Ki67 immunostaining of C2C12 myoblasts after treatment with Cripto produced in 3D microcarriers. C2C12 myoblast proliferation was evaluated by a Ki67 immunostaining assay after being cultured for 48 h in serum-free medium containing Cripto produced in 3D microcarriers (Cripto<sub>(3D)</sub>) or commercially available Cripto (Cripto<sub>(R&amp;D)</sub>). Also evaluated were a bFGF medium positive control and a serum-free medium negative control. (<b>A</b>) Representative bright field images of myoblasts showing the morphology of the cells in the different treatments. Fluorescence staining for the cell proliferation marker Ki-67 (red) is shown for the different treatments. Scale bar 100 µm. (<b>B</b>) Ki67 levels were quantified and presented as fold change over control (serum-free medium). The proliferative effect of Cripto<sub>(3D)</sub> was compared with that of commercial Cripto<sub>(R&amp;D)</sub>. Results are shown as mean ± S.D. of at least three independent experiments. * indicates <span class="html-italic">p</span> &lt; 0.05, ** indicates <span class="html-italic">p</span> &lt; 0.01.</p>
Full article ">Figure 6
<p>Cripto protein produced in 3D microcarriers retains the ability to induce muscle satellite cell commitment toward a differentiative fate. Muscle satellite cells were cultured in 10% HS medium containing Cripto<sub>(3D)</sub> or commercial Cripto<sub>(R&amp;D)</sub> and compared to the control group (containing only 10%FBS medium). (<b>A</b>) Cells were stained with DAPI (blue), MyHC (green), and myoG (red), and representative images were obtained for 24 h, 72 h, and 7 days in culture. (<b>B</b>) Differentiation was estimated by measuring the fusion index, which is the percentage of nuclei within MyHC-positive cells. (<b>C</b>) Quantification of MyoG-positive nuclei per total myonuclei, as identified with a DAPI counterstain. Results are shown as mean ± S.D. of at least three independent experiments. * indicates <span class="html-italic">p</span> &lt; 0.05, ** indicates <span class="html-italic">p</span> &lt; 0.01.</p>
Full article ">
15 pages, 5391 KiB  
Article
Kneading-Dough-Inspired Quickly Dispersing of Hydrophobic Particles into Aqueous Solutions for Designing Functional Hydrogels
by Jun Huang, Youqi Wang, Ping Liu, Jinzhi Li, Min Song, Jiuyu Cui, Luxing Wei, Yonggan Yan and Jing Liu
Gels 2023, 9(3), 242; https://doi.org/10.3390/gels9030242 - 18 Mar 2023
Cited by 2 | Viewed by 3782
Abstract
Hydrogels containing hydrophobic materials have attracted great attention for their potential applications in drug delivery and biosensors. This work presents a kneading-dough-inspired method for dispersing hydrophobic particles (HPs) into water. The kneading process can quickly mix HPs with polyethyleneimine (PEI) polymer solution to [...] Read more.
Hydrogels containing hydrophobic materials have attracted great attention for their potential applications in drug delivery and biosensors. This work presents a kneading-dough-inspired method for dispersing hydrophobic particles (HPs) into water. The kneading process can quickly mix HPs with polyethyleneimine (PEI) polymer solution to form “dough”, which facilitates the formation of stable suspensions in aqueous solutions. Combining with photo or thermal curing processes, one type of HPs incorporated PEI-polyacrylamide (PEI/PAM) composite hydrogel exhibiting good self-healing ability, tunable mechanical property is synthesized. The incorporating of HPs into the gel network results in the decrease in the swelling ratio, as well as the enhancement of the compressive modulus by more than five times. Moreover, the stable mechanism of polyethyleneimine-modified particles has been investigated using surface force apparatus, where the pure repulsion during approaching contributes to the good stability of the suspension. The stabilization time of the suspension is dependent on the molecular weight of PEI: the higher the molecular weight is, the better the stability of the suspension will be. Overall, this work demonstrates a useful strategy to introduce HPs into functional hydrogel networks. Future research can be focused on understanding the strengthening mechanism of HPs in the gel networks. Full article
(This article belongs to the Special Issue Synthesis and Applications of Hydrogels)
Show Figures

Figure 1

Figure 1
<p>(<b>a</b>) Scheme of kneading dough with flour and water. (<b>b</b>) Photos of kneading HPs (e.g., KH570-modified SiO<sub>2</sub>) with PEI solution (Mw ~70,000, 50 wt%) until smooth and sticky dough-like gel was achieved.</p>
Full article ">Figure 2
<p>Schematic illustrations of (<b>a</b>) combining branched PEI, HPs, and PAM network and (<b>b</b>) injectable PEI@HPs-PAM hydrogel network. (<b>c</b>) Scheme of preparing PEI@HPs/PAM hydrogel via UV irradiation or heating.</p>
Full article ">Figure 3
<p>Comparison of the suspension effect for HPs and PEI-modified HPs. (<b>a</b>) Hydrophobic SiO<sub>2</sub> particles (<b>left</b>) and PEI@SiO<sub>2</sub> HPs (<b>right</b>) directly dispersed in water; (<b>b</b>) PTFE HPs (<b>left</b>) and PEI@PTFE HPs (<b>right</b>) dispersed in water. (<b>c</b>) Images of freshly prepared Fe<sub>3</sub>O<sub>4</sub> particles (<b>left</b>) and PEI@Fe<sub>3</sub>O<sub>4</sub> particles (<b>right</b>) dispersed in water. (<b>d</b>) Images of Fe<sub>3</sub>O<sub>4</sub> particles (<b>left</b>) and PEI@Fe<sub>3</sub>O<sub>4</sub> particles dispersed in water and settled for 1 h.</p>
Full article ">Figure 4
<p>The effect of PEI molecular weight on the stability of HP suspensions. (<b>a</b>–<b>c</b>) Photos of SiO<sub>2</sub> HPs modified with PEI polymer (molecule weight Mw = 600, 1800, and 70,000). (<b>d</b>) Stabilization time of SiO<sub>2</sub>@PEI suspensions prepared via PEI 600, 1800, and 70,000, respectively. (<b>e</b>,<b>f</b>) Force–distance profiles of mica–mica surfaces after injecting PEI at high (<b>e</b>) or low (<b>f</b>) molecular weights.</p>
Full article ">Figure 5
<p>The water contact angles of (<b>a</b>) silane-treated SiO<sub>2</sub> HPs, (<b>b</b>) PEI@SiO<sub>2</sub> HPs, (<b>c</b>) PTFE HPs, and (<b>d</b>) PEI@PTFE HPs.</p>
Full article ">Figure 6
<p>SEM images of freeze-dried (<b>a</b>) PEI/PAM (<b>b</b>) PEI@SiO<sub>2</sub>/PAM (<b>c</b>) PEI@PTFE/PAM hydrogels obtained through the dough-making process combined with UV curing, the scale bar is 100 μm.</p>
Full article ">Figure 7
<p>Rheology analyses of the PEI@HPs/PAM hydrogels. Storage modulus (G’) and loss modulus (G”) of (<b>a</b>) the hydrogel as a function of time at a fixed strain (<span class="html-italic">γ</span> = 1%) and a fixed frequency (f = 1 Hz). (<b>b</b>) Strain amplitude sweep (<span class="html-italic">γ</span> = 0.1~10,000%) at fixed frequency (<span class="html-italic">f</span> = 1 Hz). (<b>c</b>) G’ and G” versus temperature (<span class="html-italic">T</span> = 20~80 °C) at a fixed strain (<span class="html-italic">γ</span> = 1%) and a fixed frequency (f = 1 Hz). (<b>d</b>) G’ and G” versus time under alternated strain change cycles (1%→1000%→1%). (<b>e</b>) Photos demonstrate.</p>
Full article ">Figure 8
<p>Comparison of the temperature stability of HPs doped hydrogel under varying shear strains. Storage modulus (G’) and loss modulus (G”) of the hydrogel on strain amplitude sweep (<span class="html-italic">γ</span> = 0.1~10,000%) at (<b>a</b>) room temperature (25 °C) and (<b>b</b>) high temperature (80 °C).</p>
Full article ">Figure 9
<p>Swelling ratio of HPs-modified hydrogel samples (PEI/PAM, PEI@-0.5-SiO<sub>2</sub>/PAM, and PEI@-1-SiO<sub>2</sub>/PAM) as a function of immersing time, m<sub>SiO2</sub>:m<sub>PEI</sub> = 0:1, 0.5:1 and 1:1, respectively. The swelling tests for each composition were repeated three times.</p>
Full article ">Figure 10
<p>Compression test results of hydrogel samples with different components. (<b>a</b>) Photographs of PEI@-1-SiO<sub>2</sub>/PAM hydrogels under compression. (<b>b</b>,<b>c</b>) Compressive curves and compressive moduli of PEI/PAM, PEI@-0.5-SiO<sub>2</sub>/PAM, and PEI@-1-SiO<sub>2</sub>/PAM. (<b>d</b>) Photographs of PEI@-1-PTFE/PAM hydrogels under compression. (<b>e</b>,<b>f</b>) Compressive curves and compressive moduli of PEI/PAM, PEI@-0.5-PTFE/PAM, and PEI@-1-PTFE/PAM. (<b>g</b>–<b>i</b>) Loading–unloading curves of (<b>g</b>) PEI/PAM, (<b>h</b>) PEI@-0.5-SiO<sub>2</sub>/PAM, and (<b>i</b>) PEI@-1-SiO<sub>2</sub>/PAM. All compression tests were performed three times.</p>
Full article ">
14 pages, 6354 KiB  
Article
Thermomechanical Performance Assessment of Sustainable Buildings’ Insulating Materials under Accelerated Ageing Conditions
by Ana Dora Rodrigues Pontinha, Johanna Mäntyneva, Paulo Santos and Luísa Durães
Gels 2023, 9(3), 241; https://doi.org/10.3390/gels9030241 - 18 Mar 2023
Cited by 10 | Viewed by 2070
Abstract
The reliable characterization of insulation materials in relevant environmental conditions is crucial, since it strongly influences the performance (e.g., thermal) of building elements. In fact, their properties may vary with the moisture content, temperature, ageing degradation, etc. Therefore, in this work, the thermomechanical [...] Read more.
The reliable characterization of insulation materials in relevant environmental conditions is crucial, since it strongly influences the performance (e.g., thermal) of building elements. In fact, their properties may vary with the moisture content, temperature, ageing degradation, etc. Therefore, in this work, the thermomechanical behaviour of different materials was compared when subjected to accelerated ageing. Insulation materials that use recycled rubber in their composition were studied, along with others for comparison: heat-pressed rubber, rubber_cork composites, aerogel_rubber composite (developed by the authors), silica aerogel, and extruded polystyrene. The ageing cycles comprised dry-heat, humid-heat, and cold conditions as the stages, during cycles of 3 and 6 weeks. The materials’ properties after ageing were compared with the initial values. Aerogel-based materials showed superinsulation behaviour and good flexibility due to their very high porosity and reinforcement with fibres. Extruded polystyrene also had a low thermal conductivity but exhibited permanent deformation under compression. In general, the ageing conditions led to a very slight increase in the thermal conductivity, which vanished after drying of the samples in an oven, and to a decrease in Young’s moduli. Full article
(This article belongs to the Special Issue Recent Advances in Aerogels)
Show Figures

Figure 1

Figure 1
<p>Visual aspect of the different materials, from left to right: (<b>a</b>) recycled rubber, (<b>b</b>) rubber_cork composite, (<b>c</b>) XPS, (<b>d</b>) aerogel_UK, and (<b>e</b>) new aerogel_rubber composite.</p>
Full article ">Figure 2
<p>Measured bulk density of the different materials: recycled rubber, rubber_cork composite, XPS, aerogel_UK, and new aerogel_rubber composite.</p>
Full article ">Figure 3
<p>Measured thermal conductivity (<math display="inline"><semantics> <mi>k</mi> </semantics></math>), using the Hot Disk<sup>®</sup> TPS method, of the different materials at 22 °C: recycled rubber, rubber_cork composite, XPS, aerogel_UK, and new aerogel_rubber composite.</p>
Full article ">Figure 4
<p>Mechanical behaviour of the rubber, rubber_cork composite, XPS, aerogel_UK, and new aerogel_rubber composite. (<b>a</b>) Uniaxial compression with a load cell of 3 kN, and (<b>b</b>) reversible compressive stress-strain curves of the composites until 25% strain.</p>
Full article ">Figure 5
<p>Water droplet images on the surfaces of the different materials, from left to right: (<b>a</b>) recycled rubber, (<b>b</b>) rubber_cork composite, (<b>c</b>) XPS, (<b>d</b>) aerogel_UK, and (<b>e</b>) new aerogel_rubber composite.</p>
Full article ">Figure 6
<p>Comparison of measured bulk density for the different materials under different ageing conditions: recycled rubber, rubber_cork composite, XPS, aerogel_UK, and new aerogel_rubber composite.</p>
Full article ">Figure 7
<p>Measured thermal conductivity for the different materials under different ageing conditions: recycled rubber, rubber_cork composite, XPS, aerogel_UK, and new aerogel_rubber composite.</p>
Full article ">Figure 8
<p>Measured Young’s modulus for the different materials under different ageing conditions: recycled rubber, rubber_cork composite, XPS, aerogel_UK, and new aerogel_rubber composite.</p>
Full article ">Figure 9
<p>Height recovery of the samples after 25% of compression for the different materials, with different ageing conditions: recycled rubber, rubber_cork composite, XPS, aerogel_UK, and new aerogel_rubber composite.</p>
Full article ">Figure 10
<p>Uniaxial compression test up to densification with a load cell of 3 kN of the rubber, rubber_cork composite, XPS, aerogel_UK, and new aerogel_rubber composite: (<b>a</b>) without ageing and (<b>b)</b> 6 weeks ageing.</p>
Full article ">
14 pages, 691 KiB  
Article
Sol-Gel Films Doped with Enzymes and Banana Crude Extract as Sensing Materials for Spectrophotometric Determination
by Maria A. Morosanova and Elena I. Morosanova
Gels 2023, 9(3), 240; https://doi.org/10.3390/gels9030240 - 18 Mar 2023
Cited by 4 | Viewed by 1305
Abstract
Chromogenic enzymatic reactions are very convenient for the determination of various biochemically active compounds. Sol-gel films are a promising platform for biosensor development. The creation of sol-gel films with immobilized enzymes deserves attention as an effective way to create optical biosensors. In the [...] Read more.
Chromogenic enzymatic reactions are very convenient for the determination of various biochemically active compounds. Sol-gel films are a promising platform for biosensor development. The creation of sol-gel films with immobilized enzymes deserves attention as an effective way to create optical biosensors. In the present work, the conditions are selected to obtain sol-gel films doped with horseradish peroxidase (HRP), mushroom tyrosinase (MT) and crude banana extract (BE), inside the polystyrene spectrophotometric cuvettes. Two procedures are proposed: the use of tetraethoxysilane-phenyltriethoxysilane (TEOS-PhTEOS) mixture as precursor, as well as the use of silicon polyethylene glycol (SPG).In both types of films, the enzymatic activity of HRP, MT, and BE is preserved. Based on the kinetics study of enzymatic reactions catalyzed by sol-gel films doped with HRP, MT, and BE, we found that encapsulation in the TEOS-PhTEOS films affects the enzymatic activity to a lesser extent compared to encapsulation in SPG films. Immobilization affects BE significantly less than MT and HRP. The Michaelis constant for BE encapsulated in TEOS-PhTEOS films almost does not differ from the Michaelis constant for a non-immobilized BE. The proposed sol-gel films allow determining hydrogen peroxide in the range of 0.2–3.5 mM (HRP containing film in the presence of TMB), and caffeic acid in the ranges of 0.5–10.0 mM and 2.0–10.0 mM (MT- and BE-containing films, respectively). BE-containing films have been used to determine the total polyphenol content of coffee in caffeic acid equivalents; the results of the analysis are in good agreement with the results obtained using an independent method of determination. These films are highly stable and can be stored without the loss of activity for 2 months at +4 °C and 2 weeks at +25 °C. Full article
(This article belongs to the Special Issue Advances in Xerogels: From Design to Applications)
Show Figures

Figure 1

Figure 1
<p>HRP activity (% in relation to the initial TEOS-PhTEOS sol-gel film activity) in the washing buffer solutions (pH 6.0).</p>
Full article ">Figure 2
<p>Kinetic curves of the TMB oxidation (absorbance at 650 nm over time) in the presence of different hydrogen peroxide concentrations (indicated in the legends) and HRP-PhTEOS1 (<b>a</b>) or HRP-SPG (<b>b</b>) sol-gel films.</p>
Full article ">Figure 3
<p>The dependence of the reaction speed (min<sup>−1</sup>) in the presence of HRP-PhTEOS1 film (blue) and HRP-PGS film (red) on the concentration of hydrogen peroxide (<span class="html-italic">n</span> = 3).</p>
Full article ">
18 pages, 3804 KiB  
Review
Polymeric DNA Hydrogels and Their Applications in Drug Delivery for Cancer Therapy
by Jing Li, Wenzhe Song and Feng Li
Gels 2023, 9(3), 239; https://doi.org/10.3390/gels9030239 - 18 Mar 2023
Cited by 12 | Viewed by 2935
Abstract
The biomolecule deoxyribonucleic acid (DNA), which acts as the carrier of genetic information, is also regarded as a block copolymer for the construction of biomaterials. DNA hydrogels, composed of three-dimensional networks of DNA chains, have received considerable attention as a promising biomaterial due [...] Read more.
The biomolecule deoxyribonucleic acid (DNA), which acts as the carrier of genetic information, is also regarded as a block copolymer for the construction of biomaterials. DNA hydrogels, composed of three-dimensional networks of DNA chains, have received considerable attention as a promising biomaterial due to their good biocompatibility and biodegradability. DNA hydrogels with specific functions can be prepared via assembly of various functional sequences containing DNA modules. In recent years, DNA hydrogels have been widely used for drug delivery, particularly in cancer therapy. Benefiting from the sequence programmability and molecular recognition ability of DNA molecules, DNA hydrogels prepared using functional DNA modules can achieve efficient loading of anti-cancer drugs and integration of specific DNA sequences with cancer therapeutic effects, thus achieving targeted drug delivery and controlled drug release, which are conducive to cancer therapy. In this review, we summarized the assembly strategies for the preparation of DNA hydrogels on the basis of branched DNA modules, hybrid chain reaction (HCR)-synthesized DNA networks and rolling circle amplification (RCA)-produced DNA chains, respectively. The application of DNA hydrogels as drug delivery carriers in cancer therapy has been discussed. Finally, the future development directions of DNA hydrogels in cancer therapy are prospected. Full article
(This article belongs to the Special Issue Preparation and Application of DNA Hydrogel)
Show Figures

Graphical abstract

Graphical abstract
Full article ">Figure 1
<p>The preparation strategies of branched DNA hydrogels: (<b>A</b>) enzyme-mediated assembly. (<b>B</b>) non-enzyme-mediated assembly.</p>
Full article ">Figure 2
<p>Branched DNA formed hydrogels for cancer therapy: (<b>A</b>) The recruitment and activation of APCs by the DNA supramolecular hydrogel vaccine (DSHV) system. (<b>B</b>) Different samples stimulated APCs to produce IL-6 and IL-12. Reproduced with permission. * <span class="html-italic">p</span> &lt; 0.05, *** <span class="html-italic">p</span> &lt; 0.001. n.s. = not significant. Copyright 2018 [<a href="#B46-gels-09-00239" class="html-bibr">46</a>], the American Chemical Society. (<b>C</b>) DNA hydrogel incorporated with gold nanorod for cancer drug delivery. Reproduced with permission. Copyright 2015 [<a href="#B48-gels-09-00239" class="html-bibr">48</a>], Royal Society of Chemistry. (<b>D</b>) Schematic illustration of RNA interference (RNAi) caused by RNAi-exhibiting gel (I-gel) in living cells. Reproduced with permission. Copyright 2018 [<a href="#B47-gels-09-00239" class="html-bibr">47</a>], Springer Nature.</p>
Full article ">Figure 3
<p>(<b>A</b>) The schematic of HCR principle. (<b>B</b>) Pure DNA hydrogel formed by HCR-synthesized networks. (<b>C</b>) Hybrid DNA hydrogel formed by HCR-synthesized networks.</p>
Full article ">Figure 4
<p>Pure DNA hydrogel prepared through HCR strategy for cancer therapy. (<b>A</b>) Schematic of the design and preparation of core-shell spherical 3D DNA hydrogel via HCR for synergistic cancer therapy. Reproduced with permission. Copyright 2021 [<a href="#B49-gels-09-00239" class="html-bibr">49</a>], the American Chemical Society. (<b>B</b>) Spherical nucleic acid-templated hydrogel (SNAgel) via HCR strategy for programming controllable DOX delivery. (<b>C</b>,<b>D</b>) ATP triggered intracellular burst release of SNAgel. Reproduced with permission. ** <span class="html-italic">p</span> &lt; 0.01, *** <span class="html-italic">p</span> &lt; 0.001. Copyright 2019 [<a href="#B50-gels-09-00239" class="html-bibr">50</a>], the American Chemical Society.</p>
Full article ">Figure 5
<p>Hybrid DNA hydrogel prepared through HCR strategy for cancer therapy. (<b>A</b>) Schematic of the preparation and drug release of hybrid DNA nanogel. Reproduced with permission. Copyright 2021 [<a href="#B52-gels-09-00239" class="html-bibr">52</a>], Nature Portfolio. (<b>B</b>) The principle of hybrid DNA nanogel based on C-HCR-synthesized networks. Reproduced with permission. Copyright 2021 [<a href="#B51-gels-09-00239" class="html-bibr">51</a>], Wiley-VCH Verlag GmbH. (<b>C</b>) The schematic of pH-responsive hybrid DNA hydrogel for the DOX release. (<b>D</b>) Cytotoxicity assay of the pH-responsive hydrogel loaded with DOX into MCF-10A cells and MDA-MB-231 malignant breast cancer cells. *** <span class="html-italic">p</span> &lt; 0.001. Reproduced with permission. Copyright 2017 [<a href="#B53-gels-09-00239" class="html-bibr">53</a>], Royal Society Chemistry.</p>
Full article ">Figure 6
<p>(<b>A</b>) The schematic of RCA principle. (<b>B</b>) Pure hydrogel formed through self-assembly of RCA-produced long DNA chain. (<b>C</b>) Hybrid hydrogel formed through hybridization of DNA chain and organic/inorganic polymer.</p>
Full article ">Figure 7
<p>RCA technology-based DNA hydrogel for cancer therapy. (<b>A</b>) The principle of RCA strategy-based DNA nanogel for the co-delivery of DNAzyme and CRISPR/Cas 9 for gene therapy. Reproduced with permission. Copyright 2022 [<a href="#B55-gels-09-00239" class="html-bibr">55</a>], Wiley-VCH Verlag GmbH. (<b>B</b>) Double RCA assembly strategy formed DNA hydrogel for the isolation and release of T cells for cancer immunotherapy. Copyright 2021 [<a href="#B56-gels-09-00239" class="html-bibr">56</a>], the American Chemical Society.</p>
Full article ">Figure 8
<p>RCA technology-based hybrid DNA hydrogel for cancer therapy. (<b>A</b>) DNA hybrid nanogel for the PDT of breast cancer. Reproduced with permission. Copyright 2022, Wiley-VCH Verlag GmbH [<a href="#B57-gels-09-00239" class="html-bibr">57</a>]. (<b>B</b>) The schematic of DNA hybrid nanogel (DMON/DOX-DNA/ASO-HhaI@GDA) for the chemo and gene cooperative therapy. Reproduced with permission. Copyright 2022 [<a href="#B58-gels-09-00239" class="html-bibr">58</a>], the American Chemical Society.</p>
Full article ">
18 pages, 11671 KiB  
Article
Molten Salts Approach of Poly(vinyl alcohol)-Derived Bimetallic Nickel–Iron Sheets Supported on Porous Carbon Nanosheet as an Effective and Durable Electrocatalyst for Methanol Oxidation
by Badr M. Thamer, Meera Moydeen Abdul Hameed and Mohamed H. El-Newehy
Gels 2023, 9(3), 238; https://doi.org/10.3390/gels9030238 - 17 Mar 2023
Cited by 3 | Viewed by 1693
Abstract
The preparation of metallic nanostructures supported on porous carbon materials that are facile, green, efficient, and low-cost is desirable to reduce the cost of electrocatalysts, as well as reduce environmental pollutants. In this study, a series of bimetallic nickel–iron sheets supported on porous [...] Read more.
The preparation of metallic nanostructures supported on porous carbon materials that are facile, green, efficient, and low-cost is desirable to reduce the cost of electrocatalysts, as well as reduce environmental pollutants. In this study, a series of bimetallic nickel–iron sheets supported on porous carbon nanosheet (NiFe@PCNs) electrocatalysts were synthesized by molten salt synthesis without using any organic solvent or surfactant through controlled metal precursors. The as-prepared NiFe@PCNs were characterized by scanning and transmission electron microscopy (SEM and TEM), X-ray diffraction, and photoelectron spectroscopy (XRD and XPS). The TEM results indicated the growth of NiFe sheets on porous carbon nanosheets. The XRD analysis confirmed that the Ni1−xFex alloy had a face-centered polycrystalline (fcc) structure with particle sizes ranging from 15.5 to 30.6 nm. The electrochemical tests showed that the catalytic activity and stability were highly dependent on the iron content. The electrocatalytic activity of catalysts for methanol oxidation demonstrated a nonlinear relationship with the iron ratio. The catalyst doped with 10% iron showed a higher activity compared to the pure nickel catalyst. The maximum current density of Ni0.9Fe0.1@PCNs (Ni/Fe ratio 9:1) was 190 mA/cm2 at 1.0 M of methanol. In addition to the high electroactivity, the Ni0.9Fe0.1@PCNs showed great improvement in stability over 1000 s at 0.5 V with a retained activity of 97%. This method can be used to prepare various bimetallic sheets supported on porous carbon nanosheet electrocatalysts. Full article
(This article belongs to the Special Issue Gel Electro-Catalysts)
Show Figures

Graphical abstract

Graphical abstract
Full article ">Figure 1
<p>SEM and TEM images of the (<b>a</b>,<b>b</b>) Ni@PCFs and (<b>c</b>,<b>d</b>) Ni<sub>0.9</sub>Fe<sub>0.1</sub>@PCNs.</p>
Full article ">Figure 2
<p>XRD of the (a) Ni@PCs; (b) Ni<sub>0.9</sub>Fe<sub>0.1</sub>@PCNs; (c) Ni<sub>0.8</sub>Fe<sub>0.2</sub>@PCNs; (d) Ni<sub>0.7</sub>Fe<sub>0.3</sub>@PCNs; (e) Ni<sub>0.60</sub>Fe<sub>0.4</sub>@PCNs.</p>
Full article ">Figure 3
<p>XPS analysis (<b>a</b>) survey scan spectrum of Ni<sub>0.9</sub>Fe<sub>0.1</sub>@PCNs and (<b>b</b>–<b>e</b>) high-resolution fitting of (<b>b</b>) C 1s, (<b>c</b>) O 1s, (<b>d</b>) Fe 2p, and (<b>e</b>) Ni 2p.</p>
Full article ">Figure 4
<p>TGA/DTA of FeAc, NiAc, PVA/NiAc, and PVA/NiAc/FeAc.</p>
Full article ">Figure 5
<p>(<b>a</b>) CV of Ni@PCs, Ni<sub>0.9</sub>Fe<sub>0.1</sub>@PCNs, Ni<sub>0.8</sub>Fe<sub>0.2</sub>@PCNs, Ni<sub>0.7</sub>Fe<sub>0.3</sub>@PCNs, and Ni<sub>0.60</sub>Fe<sub>0.4</sub>@PCNs in 1.0 M methanol/1.0 M KOH at 0.5 V/s; (<b>b</b>) plot % Fe ratio vs. current density and onset potential; (<b>c</b>) Tafel plots of Ni@PC, Ni<sub>0.9</sub>Fe<sub>0.1</sub>@PCN, Ni<sub>0.8</sub>Fe<sub>0.2</sub>@PCN, Ni<sub>0.7</sub>Fe<sub>0.3</sub>@PCN, and Ni<sub>0.60</sub>Fe<sub>0.4</sub>@PCN electrodes in 2M methanol/1M KOH; (<b>d</b>) plot % Fe vs. Tafel slope value and current density.</p>
Full article ">Figure 6
<p>CV of (<b>a</b>) Ni@PCs; (<b>b</b>) Ni<sub>0.9</sub>Fe<sub>0.1</sub>@PCNs; (<b>c</b>) Ni<sub>0.8</sub>Fe<sub>0.2</sub>@PCNs; (<b>d</b>) Ni<sub>0.7</sub>Fe<sub>0.3</sub>@PCNs; (<b>e</b>) Ni<sub>0.60</sub>Fe<sub>0.4</sub>@PCNs measured in a nonFaradaic region at different scan rates in 1 M KOH; (<b>f</b>) linear fit of anodic charging current density measured at 0.1 V vs. Ag/AgCl vs. scan rate.</p>
Full article ">Figure 6 Cont.
<p>CV of (<b>a</b>) Ni@PCs; (<b>b</b>) Ni<sub>0.9</sub>Fe<sub>0.1</sub>@PCNs; (<b>c</b>) Ni<sub>0.8</sub>Fe<sub>0.2</sub>@PCNs; (<b>d</b>) Ni<sub>0.7</sub>Fe<sub>0.3</sub>@PCNs; (<b>e</b>) Ni<sub>0.60</sub>Fe<sub>0.4</sub>@PCNs measured in a nonFaradaic region at different scan rates in 1 M KOH; (<b>f</b>) linear fit of anodic charging current density measured at 0.1 V vs. Ag/AgCl vs. scan rate.</p>
Full article ">Figure 7
<p>Effect of methanol concentration on the electrocatalytic oxidation of methanol on (<b>a</b>) Ni@PC; (<b>b</b>) Ni<sub>0.9</sub>Fe<sub>0.1</sub>@PCN; (<b>c</b>) Ni<sub>0.8</sub>Fe<sub>0.2</sub>@PCN; (<b>d</b>) Ni<sub>0.7</sub>Fe<sub>0.3</sub>@PCN; (<b>e</b>) Ni<sub>0.6</sub>Fe<sub>0.4</sub>@PCN electrodes in 1.0 M KOH solution at 50 mV s<sup>−1</sup>; (<b>f</b>) plot of the methanol concentration vs. current density for all electrodes.</p>
Full article ">Figure 7 Cont.
<p>Effect of methanol concentration on the electrocatalytic oxidation of methanol on (<b>a</b>) Ni@PC; (<b>b</b>) Ni<sub>0.9</sub>Fe<sub>0.1</sub>@PCN; (<b>c</b>) Ni<sub>0.8</sub>Fe<sub>0.2</sub>@PCN; (<b>d</b>) Ni<sub>0.7</sub>Fe<sub>0.3</sub>@PCN; (<b>e</b>) Ni<sub>0.6</sub>Fe<sub>0.4</sub>@PCN electrodes in 1.0 M KOH solution at 50 mV s<sup>−1</sup>; (<b>f</b>) plot of the methanol concentration vs. current density for all electrodes.</p>
Full article ">Figure 8
<p>Effects of the scan rate on the electrocatalytic oxidation of methanol and plots of the square root of the scan rate vs. cathodic and anodic current density for (<b>a</b>,<b>b</b>) Ni@PCs; (<b>c</b>,<b>d</b>) Ni<sub>0.9</sub>Fe<sub>0.1</sub>@PCNs; (<b>e</b>,<b>f</b>) Ni<sub>0.7</sub>Fe<sub>0.3</sub>@PCNs; (<b>g</b>,<b>h</b>) Ni<sub>0.6</sub>Fe<sub>0.4</sub>@PCNs.</p>
Full article ">Figure 8 Cont.
<p>Effects of the scan rate on the electrocatalytic oxidation of methanol and plots of the square root of the scan rate vs. cathodic and anodic current density for (<b>a</b>,<b>b</b>) Ni@PCs; (<b>c</b>,<b>d</b>) Ni<sub>0.9</sub>Fe<sub>0.1</sub>@PCNs; (<b>e</b>,<b>f</b>) Ni<sub>0.7</sub>Fe<sub>0.3</sub>@PCNs; (<b>g</b>,<b>h</b>) Ni<sub>0.6</sub>Fe<sub>0.4</sub>@PCNs.</p>
Full article ">Figure 9
<p>(<b>a</b>) Nyquist plots of Ni<sub>0.9</sub>Fe<sub>0.1</sub>@PCNs at various overpotentials in 1 M KOH + 2 M MeOH; (<b>b</b>) chronoamperometry at a potential of 0.5 V in 2.0 M methanol; (<b>c</b>) activity retention of catalyst samples.</p>
Full article ">Figure 10
<p>Schematic illustration of the NiFe@PCNs’ preparation.</p>
Full article ">
17 pages, 3693 KiB  
Article
Study on the Interaction of Plasma-Polymerized Hydrogel Coatings with Aqueous Solutions of Different pH
by Monique Levien, Zahra Nasri, Klaus-Dieter Weltmann and Katja Fricke
Gels 2023, 9(3), 237; https://doi.org/10.3390/gels9030237 - 17 Mar 2023
Cited by 2 | Viewed by 1520
Abstract
Amphiphilic hydrogels from mixtures of 2-hydroxyethyl methacrylate and 2-(diethylamino)ethyl methacrylate p(HEMA-co-DEAEMA) with specific pH sensitivity and hydrophilic/hydrophobic structures were designed and polymerized via plasma polymerization. The behavior of plasma-polymerized (pp) hydrogels containing different ratios of pH-sensitive DEAEMA segments was investigated concerning possible applications [...] Read more.
Amphiphilic hydrogels from mixtures of 2-hydroxyethyl methacrylate and 2-(diethylamino)ethyl methacrylate p(HEMA-co-DEAEMA) with specific pH sensitivity and hydrophilic/hydrophobic structures were designed and polymerized via plasma polymerization. The behavior of plasma-polymerized (pp) hydrogels containing different ratios of pH-sensitive DEAEMA segments was investigated concerning possible applications in bioanalytics. In this regard, the morphological changes, permeability, and stability of the hydrogels immersed in solutions of different pHs were studied. The physico-chemical properties of the pp hydrogel coatings were analyzed using X-ray photoelectron spectroscopy, surface free energy measurements, and atomic force microscopy. Wettability measurements showed an increased hydrophilicity of the pp hydrogels when stored in acidic buffers and a slightly hydrophobic behavior after immersion in alkaline solutions, indicating a pH-dependent behavior. Furthermore, the pp (p(HEMA-co-DEAEMA) (ppHD) hydrogels were deposited on gold electrodes and studied electrochemically to investigate the pH sensitivity of the hydrogels. The hydrogel coatings with a higher ratio of DEAEMA segments showed excellent pH responsiveness at the studied pHs (pH 4, 7, and 10), demonstrating the importance of the DEAEMA ratio in the functionality of pp hydrogel films. Due to their stability and pH-responsive properties, pp (p(HEMA-co-DEAEMA) hydrogels are conceivable candidates for functional and immobilization layers for biosensors. Full article
(This article belongs to the Special Issue Advances in Responsive Hydrogels)
Show Figures

Graphical abstract

Graphical abstract
Full article ">Figure 1
<p>Synthetic route for the plasma polymerization of (p(HEMA-co-DEAEMA) films.</p>
Full article ">Figure 2
<p>Microscopic images of the hydrogel films (<b>a</b>): d-HD14, (<b>b</b>): d-HD11, and (<b>c</b>): d-HD41 at 1500× magnification.</p>
Full article ">Figure 3
<p>Optical microscope images (1500× magnification) of (<b>a</b>): the unmodiefied goldelectrode and the plasma-polymerized hydrogel coatings (<b>b</b>): HD14, (<b>c</b>): HD11, (<b>d</b>): HD41) deposited on gold, generated through the droplet method.</p>
Full article ">Figure 4
<p>XPS elemental analysis of the different hydrogel mixtures (d-HD), as-deposited and after immersion in water for 24 h (<span class="html-italic">n</span> = 3).</p>
Full article ">Figure 5
<p>Surface free energy of the hydrogel mixtures generated using the droplet method (<b>a</b>) as-deposited and (<b>b</b>) after immersion in water for 24 h, divided into dispersive and polar fraction.</p>
Full article ">Figure 6
<p>Surface free energy of the pp d-HD films stored in different pH solutions.</p>
Full article ">Figure 7
<p>Schematic representation of the plasma-polymerized (p(HEMA-co-DEAEMA) films at different pHs. Created with BioRender.com.</p>
Full article ">Figure 8
<p>(<b>A</b>–<b>I</b>): AFM images and the corresponding height profiles of the plasma-polymerized hydrogel coatings (d-HD14, d-HD11, and d-HD41) in acidic (pH 4) (<b>A</b>–<b>C</b>), neutral (pH7) (<b>D</b>–<b>F</b>), and alkaline (pH 10) (<b>G</b>–<b>I</b>) solutions. White lines indicate the location of the height profile. AFM images of the coatings in air and a bare gold electrode are shown in <a href="#app1-gels-09-00237" class="html-app">Figures S9 and S10</a>.</p>
Full article ">Figure 9
<p>Cyclic voltammograms (<b>a</b>–<b>c</b>) of the plasma-polymerized d-HD films acquired in buffer solutions of different pHs, (<b>d</b>): [Fe(CN)<sub>6</sub>]<sup>3−/4−</sup> at the bare gold electrode in solutions of different pHs. CV recordings of n-HD films in different pHs are shown in <a href="#app1-gels-09-00237" class="html-app">Figure S11</a>.</p>
Full article ">Figure 10
<p>Schemes of two setups used for the synthesis of hydrogel films of different thickness ((<b>A</b>): droplet method, (<b>B</b>): nebulizer method) and of the atmospheric-pressure plasma jet applied for the polymerization of (p(HEMA-co-DEAEMA) films, and a photograph of a pp hydrogel film.</p>
Full article ">
12 pages, 3007 KiB  
Article
Thermo-Responsive Injectable Hydrogels Formed by Self-Assembly of Alginate-Based Heterograft Copolymers
by Konstantinos Safakas, Sofia-Falia Saravanou, Zacharoula Iatridi and Constantinos Tsitsilianis
Gels 2023, 9(3), 236; https://doi.org/10.3390/gels9030236 - 17 Mar 2023
Cited by 9 | Viewed by 1897
Abstract
Polysaccharide-based graft copolymers bearing thermo-responsive grafting chains, exhibiting LCST, have been designed to afford thermo-responsive injectable hydrogels. The good performance of the hydrogel requires control of the critical gelation temperature, Tgel. In the present article, we wish to show an alternative [...] Read more.
Polysaccharide-based graft copolymers bearing thermo-responsive grafting chains, exhibiting LCST, have been designed to afford thermo-responsive injectable hydrogels. The good performance of the hydrogel requires control of the critical gelation temperature, Tgel. In the present article, we wish to show an alternative method to tune Tgel using an alginate-based thermo-responsive gelator bearing two kinds of grafting chains (heterograft copolymer topology) of P(NIPAM86-co-NtBAM14) random copolymers and pure PNIPAM, differing in their lower critical solution temperature (LCST) about 10 °C. Interestingly, the Tgel of the heterograft copolymer is controlled from the overall hydrophobic content, NtBAM, of both grafts, implying the formation of blended side chains in the crosslinked nanodomains of the formed network. Rheological investigation of the hydrogel showed excellent responsiveness to temperature and shear. Thus, a combination of shear-thinning and thermo-thickening effects provides the hydrogel with injectability and self-healing properties, making it a good candidate for biomedical applications. Full article
(This article belongs to the Special Issue Structured Gels: Mechanics, Responsivity and Applications)
Show Figures

Graphical abstract

Graphical abstract
Full article ">Figure 1
<p>Schematic representation of the heterografting reaction. First step: synthesis of the ALG-g-P(NIPAM<sub>86</sub>-<span class="html-italic">co</span>-NtBAM<sub>14</sub>) graft copolymer; second step: the ALG-g-P(NIPAM<sub>86</sub>-<span class="html-italic">co</span>-NtBAM<sub>14</sub>) graft copolymer was grafted by the NH<sub>2</sub>-PNIPAM homopolymer, yielding the final ALG/HGC heterograft copolymer.</p>
Full article ">Figure 2
<p>Temperature dependence of G’ (closed symbols), G” (open symbols) (<b>a</b>) and complex viscosity (heating) (<b>b</b>) at 1 Hz and strain amplitude of 0.1% for the ALG/HGC hydrogel with a cooling– heating ramp of 1 °C/min. The arrows indicate <span class="html-italic">T<sub>gel</sub></span> in (<b>a</b>) and <span class="html-italic">T<sub>ass</sub></span> in (<b>b</b>). The photos (inset of <b>b</b>) depict the solutions at different temperatures, showing a transparent solution at 10 °C, a turbid solution at 25 °C, and a free-standing gel at 50 °C.</p>
Full article ">Figure 3
<p>Temperature dependence of G′ (closed symbols), G″ (open symbols) (<b>a</b>), and tanδ (<b>b</b>) at 1 Hz, strain amplitude of 0.1% and heating ramp of 1 °C/min for the hydrogels formed by ALG-g-P(NIPAM<sub>86</sub>-<span class="html-italic">co</span>-NtBAM<sub>14</sub>) (circles), ALG/HGC (triangles) and ALG-g-P(NIPAM) (squares) gelators. The arrows in (<b>a</b>) indicate <span class="html-italic">T<sub>gel</sub></span> and the dashed line in (<b>b</b>) denotes the sol/gel point (tanδ = 1).</p>
Full article ">Figure 4
<p><span class="html-italic">T<sub>gel</sub></span> as a function of the overall NtBAM content. The blue data have been taken from [<a href="#B36-gels-09-00236" class="html-bibr">36</a>] and the red one concerns the ALG/HGC. The line is the linear regression of the data.</p>
Full article ">Figure 5
<p>(<b>a</b>) G’ (closed symbols), G″ (open symbols) as a function of the angular frequency of 5 wt% of ALG/HGC hydrogels at various temperatures: 28 °C (black, squares), 37 °C (blue, triangles) and 45 °C (green, rhombi), the angle of the line is 0.5. (<b>b</b>) G’ at various temperatures for the hydrogels formed by ALG-g-P(NIPAM<sub>86</sub>-<span class="html-italic">co</span>-NtBAM<sub>14</sub>) (red bars), ALG/HGC (blue bars), and ALG-g-P(NIPAM) (black bars). The data were obtained from frequency sweeps at 1 rad/s.</p>
Full article ">Figure 6
<p>G’ versus temperature of ALG-g-P(NIPAM<sub>86</sub>-<span class="html-italic">co</span>-NtBAM<sub>14</sub>) (triangles) and ALG/HGC (circles). The values of the latter have been shifted in the X axis (T-ΔΤ, ΔΤ = 5.1 °C is the difference between the two <span class="html-italic">T<sub>gels</sub></span>). The arrow indicates <span class="html-italic">T<sub>gel</sub></span>.</p>
Full article ">Figure 7
<p>Shear viscosity stepwise time sweep in time intervals of 60 s: (<b>a</b>) altering temperatures at constant shear rate of 17.25 s<sup>−1</sup> and (<b>b</b>) altering simultaneously temperature and shear rate as indicated for the ALG/HGC formulation.</p>
Full article ">Figure 8
<p>G’ (closed symbols), G″ (open symbols) as a function of strain at 1 Hz (strain sweep, <b>left</b>), followed consecutively by time sweep (<b>right</b>), applying low strain of 0.1% within the linear viscoelastic regime at 37 °C for the ALG/HGC formulation.</p>
Full article ">
15 pages, 2456 KiB  
Article
Chain-Extendable Crosslinked Hydrogels Using Branching RAFT Modification
by Stephen Rimmer, Paul Spencer, Davide Nocita, John Sweeney, Marcus Harrison and Thomas Swift
Gels 2023, 9(3), 235; https://doi.org/10.3390/gels9030235 - 17 Mar 2023
Cited by 1 | Viewed by 2133
Abstract
Functional crosslinked hydrogels were prepared from 2-hydroxyethyl methacrylate (HEMA) and acrylic acid (AA). The acid monomer was incorporated both via copolymerization and chain extension of a branching, reversible addition–fragmentation chain-transfer agent incorporated into the crosslinked polymer gel. The hydrogels were intolerant to high [...] Read more.
Functional crosslinked hydrogels were prepared from 2-hydroxyethyl methacrylate (HEMA) and acrylic acid (AA). The acid monomer was incorporated both via copolymerization and chain extension of a branching, reversible addition–fragmentation chain-transfer agent incorporated into the crosslinked polymer gel. The hydrogels were intolerant to high levels of acidic copolymerization as the acrylic acid weakened the ethylene glycol dimethacrylate (EGDMA) crosslinked network. Hydrogels made from HEMA, EGDMA and a branching RAFT agent provide the network with loose-chain end functionality that can be retained for subsequent chain extension. Traditional methods of surface functionalization have the downside of potentially creating a high volume of homopolymerization in the solution. Branching RAFT comonomers act as versatile anchor sites by which additional polymerization chain extension reactions can be carried out. Acrylic acid grafted onto HEMA–EGDMA hydrogels showed higher mechanical strength than the equivalent statistical copolymer networks and was shown to have functionality as an electrostatic binder of cationic flocculants. Full article
(This article belongs to the Special Issue Preparation, Properties and Applications of Functional Hydrogels)
Show Figures

Graphical abstract

Graphical abstract
Full article ">Figure 1
<p>(<b>A</b>) Chemical structure of crosslinked hydrogels prepared by thermal initiation of HEMA (blue), EGDMA (green) and RAFT (pink) (<b>PCG 2</b>). (<b>B</b>) Grafting of PAA chains (red) onto HEMA via RAFT chain extension (<b>PCG 2B</b>). (<b>C</b>) Chemical reaction route to prepare hydrogels copolymerized with statistical AA comonomer in initial reaction feed (<b>PCG 3</b>). (<b>D</b>) Overall structure of copolymer AA throughout HEMA gel (<b>PCG 3</b>).</p>
Full article ">Figure 2
<p>(<b>A</b>) IR analysis of HEMA + RAFT–HEMA films. (<b>B</b>) Raw titration data of RAFT–HEMA films. (<b>C</b>) <span class="html-italic">S<sub>w</sub></span> of HEMA and RAFT–HEMA films at different pH levels.</p>
Full article ">Figure 3
<p>(<b>A</b>) IR analysis of AA-grafted RAFT–HEMA films. (<b>B</b>) Raw titration data of AA-grafted RAFT–HEMA films. (<b>C</b>) <span class="html-italic">S<sub>w</sub></span> of AA-grafted RAFT–HEMA films at different pH levels.</p>
Full article ">Figure 4
<p>(<b>A</b>): Raw titration data of AA-copolymerized RAFT–HEMA films. (<b>B</b>) <span class="html-italic">S<sub>w</sub></span> of AA-copolymerized RAFT–HEMA films at different pH levels.</p>
Full article ">Figure 5
<p>Representative engineering stress/strain curves of PCN <b>1</b>, <b>2</b>, <b>2B</b> and <b>3A</b>.</p>
Full article ">Figure 6
<p>Thermogravimetric analysis of HEMA films (200–800 °C). (<b>A</b>) Raw % weight loss across temperature ramp, (<b>B</b>) derivative weight loss across temperature ramp. Heating rate of samples 10 °C. (<b>C</b>) %TGA (area of deconvoluted peak) for 25 °C temperature ranges across the peak degradation step for HEMA gels.</p>
Full article ">Figure 7
<p>(<b>A</b>) Swelling of hydrogels in ultra-pure water and dilute (1 mg mL<sup>−1</sup>) solutions of polymer flocculants. (<b>B</b>) pH dependence of electrostatic bonding of PAA with PDAEC (red diamonds) and PDADMAC (blue diamonds). *** indicates statistical significance of difference via a T test pairwise comparison.</p>
Full article ">
21 pages, 3873 KiB  
Article
Anti-Inflammatory Effect and Toxicological Profile of Pulp Residue from the Caryocar Brasiliense, a Sustainable Raw Material
by Julia Amanda Rodrigues Fracasso, Mariana Bittencourt Ibe, Luísa Taynara Silvério da Costa, Lucas Pires Guarnier, Amanda Martins Viel, Gustavo Reis de Brito, Mariana Conti Parron, Anderson Espírito do Santo Pereira, Giovana Sant’Ana Pegorin Brasil, Valdecir Farias Ximenes, Leonardo Fernandes Fraceto, Cassia Roberta Malacrida Mayer, João Tadeu Ribeiro-Paes, Fernando Yutaka de Ferreira, Natália Alves Zoppe and Lucinéia dos Santos
Gels 2023, 9(3), 234; https://doi.org/10.3390/gels9030234 - 16 Mar 2023
Cited by 6 | Viewed by 2453
Abstract
Caryocar brasiliense Cambess is a plant species typical of the Cerrado, a Brazilian biome. The fruit of this species is popularly known as pequi, and its oil is used in traditional medicine. However, an important factor hindering the use of pequi oil is [...] Read more.
Caryocar brasiliense Cambess is a plant species typical of the Cerrado, a Brazilian biome. The fruit of this species is popularly known as pequi, and its oil is used in traditional medicine. However, an important factor hindering the use of pequi oil is its low yield when extracted from the pulp of this fruit. Therefore, in this study, with aim of developing a new herbal medicine, we an-alyzed the toxicity and anti-inflammatory activity of an extract of pequi pulp residue (EPPR), fol-lowing the mechanical extraction of the oil from its pulp. For this purpose, EPPR was prepared and encapsulated in chitosan. The nanoparticles were analyzed, and the cytotoxicity of the encapsu-lated EPPR was evaluated in vitro. After confirming the cytotoxicity of the encapsulated EPPR, the following evaluations were performed with non-encapsulated EPPR: in vitro anti-inflammatory activity, quantification of cytokines, and acute toxicity in vivo. Once the anti-inflammatory activity and absence of toxicity of EPPR were verified, a gel formulation of EPPR was developed for topical use and analyzed for its in vivo anti-inflammatory potential, ocular toxicity, and previous stability assessment. EPPR and the gel containing EPPR showed effective anti-inflammatory activity and lack of toxicity. The formulation was stable. Thus, a new herbal medicine with anti-inflammatory activity can be developed from discarded pequi residue. Full article
(This article belongs to the Special Issue Gels in Medicine and Pharmacological Therapies)
Show Figures

Figure 1

Figure 1
<p>CTS/TPP-EPPR nanoparticle characterization: (<b>a</b>) size distribution by DLS (intensity), (<b>b</b>) size distribution and nanoparticles concentration by NTA, (<b>c</b>) AFM images (topography image, 3D image, and histogram graphic, from right to left, respectively) and (<b>d</b>) size distribution by frequency.</p>
Full article ">Figure 2
<p>Mean ± SD of the percentage cell viability in the groups treated with the negative control (NC; physiologic solution 0.9%), positive control (PC; 2% Tween 80%), and encapsulated EPPR (E1—31.25 μg/mL, E2—62.5 μg/mL, E3—125 μg/mL, E4—250 μg/mL, and E5—500 μg/mL), according to the MTT method. One-way ANOVA followed by Tukey’s post hoc test. The asterisk (*) indicates a significant difference (<span class="html-italic">p</span> &lt; 0.05) between groups.</p>
Full article ">Figure 3
<p>Mean ± SD of the percentage cell viability of the negative control (NC; physiologic solution 0.9%), positive control (PC; 2% Tween 80%), and acetic acid evaluated at five different concentrations (A1—0.015%, A2—0.030%, A3—0.060%, A4—0.120%, and A5—0.240%) by the MTT method. One-way ANOVA followed by Tukey’s post hoc test. The asterisk (*) indicates a significant difference (<span class="html-italic">p</span> &lt; 0.05) between groups.</p>
Full article ">Figure 4
<p>Mean ± SD of the percentage inhibition of phagocytosis for each treatment group: negative control (NC; physiologic solution 0.9%), positive control (PC; 100 μg/mL, dexamethasone), and EPPR (200 μg/mL, 400 μg/mL, and 600 μg/mL). The asterisk (*) indicates a significant difference (<span class="html-italic">p</span> &lt; 0.05) compared with the NC. One-way ANOVA followed by Tukey’s post hoc test.</p>
Full article ">Figure 5
<p>Mean ± SD of inhibition of spreading for each treatment group: negative control (NC; physiologic solution 0.9%), positive control (PC; 100 μg/mL, dexamethasone), and EPPR (200 μg/mL, 400 μg/mL, and 600 μg/mL). The asterisk (*) indicates a significant difference (<span class="html-italic">p</span> &lt; 0.05) compared with the NC. One-way ANOVA followed by Tukey’s post hoc test.</p>
Full article ">Figure 6
<p>Mean ± SD of the percentage of protection against hemolysis for each treatment group: negative control (NC; physiologic solution 0.9%), positive control (PC; 100 μg/mL, dexamethasone), and EPPR (200 μg/mL, 400 μg/mL, and 600 μg/mL). The asterisk (*) indicates a significant difference (<span class="html-italic">p</span> &lt; 0.05) compared with the NC. One-way ANOVA followed by Tukey’s post hoc test.</p>
Full article ">Figure 7
<p>Mean ± SD of the levels of the interleukins IL-6 (<b>a</b>) and IL-10 (<b>b</b>) (pg/mL) for each treatment group: negative control (NC; untreated cells), positive control (PC; LPS), and EPPR (400 µg/mL). The asterisk (*) indicates a significant difference (<span class="html-italic">p</span> &lt; 0.05) compared with the NC. One-way ANOVA followed by Tukey’s post hoc test.</p>
Full article ">Figure 8
<p>Percentage of edema inhibition in mL (n = 8/group) by the negative control (NC; base gel), positive control (PC; dexamethasone gel 1 mg/g), and EPPR (EPPR gel, 5 mg/g). One-way ANOVA followed by the Tukey–Kramer multiple comparison tests showed * <span class="html-italic">p</span> ˂ 0.005 compared with the NC group.</p>
Full article ">Figure 9
<p>Preparation of the hydroethanolic extract of pequi pulp residue (EPPR).</p>
Full article ">Figure 10
<p>Paw edema model.</p>
Full article ">
15 pages, 2410 KiB  
Article
The Effect of Sage (Salvia sclarea) Essential Oil on the Physiochemical and Antioxidant Properties of Sodium Alginate and Casein-Based Composite Edible Films
by Saurabh Bhatia, Ahmed Al-Harrasi, Yasir Abbas Shah, Muhammad Jawad, Mohammed Said Al-Azri, Sana Ullah, Md Khalid Anwer, Mohammed F. Aldawsari, Esra Koca and Levent Yurdaer Aydemir
Gels 2023, 9(3), 233; https://doi.org/10.3390/gels9030233 - 16 Mar 2023
Cited by 18 | Viewed by 2692
Abstract
The aim of this study was to examine the effect of Sage (Salvia sclarea) essential oil (SEO) on the physiochemical and antioxidant properties of sodium alginate (SA) and casein (CA) based films. Thermal, mechanical, optical, structural, chemical, crystalline, and barrier properties [...] Read more.
The aim of this study was to examine the effect of Sage (Salvia sclarea) essential oil (SEO) on the physiochemical and antioxidant properties of sodium alginate (SA) and casein (CA) based films. Thermal, mechanical, optical, structural, chemical, crystalline, and barrier properties were examined using TGA, texture analyzer, colorimeter, SEM, FTIR, and XRD. Chemical compounds of the SEO were identified via GC–MS, the most important of which were linalyl acetate (43.32%) and linalool (28.51%). The results showed that incorporating SEO caused a significant decrease in tensile strength (1.022–0.140 Mpa), elongation at break (28.2–14.6%), moisture content (25.04–14.7%) and transparency (86.1–56.2%); however, WVP (0.427–0.667 × 10⁻¹² g·cm/cm2·s·Pa) increased. SEM analysis showed that the incorporation of SEO increased the homogeneousness of films. TGA analysis showed that SEO-loaded films showed better thermal stability than others. FTIR analysis revealed the compatibility between the components of the films. Furthermore, increasing the concentration of SEO increased the antioxidant activity of the films. Thus, the present film shows a potential application in the food packaging industry. Full article
Show Figures

Graphical abstract

Graphical abstract
Full article ">Figure 1
<p>GC–MS analysis of the sage essential oil.</p>
Full article ">Figure 2
<p>Visual characterization of different samples of SA–CA-based edible films. Control or SE-1: SA + CA; SE-2: SA + CA + SEO 5 μL; SE-3: SA + CA + SEO 10 μL; and SE-4: SA + CA + SEO 15 μL.</p>
Full article ">Figure 3
<p>TGA analysis of different samples of SA–CA-based edible films. Control of SE-1: SA + CA; SE-2: SA + CA + SEO 5 μL; SE-3: SA + CA + SEO 10 μL; and SE-4; SA + CA + SEO 15 μL.</p>
Full article ">Figure 4
<p>XRD characterization of different samples of SA–CA-based edible films. Control or SE-1: SA + CA; SE-2: SA + CA + SEO 5 μL; SE-3: SA + CA + SEO 10 μL; and SE-4; SA + CA + SEO 15 μL.</p>
Full article ">Figure 5
<p>SEM examination of different samples of SA–CA-based edible films. Control or SE-1: SA + CA; SE-2: SA + CA+ SEO 5 μL; SE-3: SA + CA + SEO 10 μL; and SE-4; SA + CA+ SEO 15 μL. Red arrows for particles on the surface. Yellow arrows for pores, and green arrows for cracks on the surface.</p>
Full article ">Figure 6
<p>FTIR analysis of different samples of SA–CA-based edible films. Control of SE-1: SA + CA; SE-2: SA + CA+ SEO 5 μL; SE-3: SA + CA + SEO 10 μL; and SE-4; SA + CA + SEO 15 μL.</p>
Full article ">Figure 7
<p>Antioxidant activity of SA–CA-based edible film samples. Control of SE-1: SA + CA; SE-2: SA + CA + SEO 5 μL; SE-3: SA + CA + SEO 10 μL; and SE-4; SA + CA + SEO 15 μL.</p>
Full article ">
Previous Issue
Next Issue
Back to TopTop