[go: up one dir, main page]

Next Issue
Volume 9, March
Previous Issue
Volume 9, January


Gels, Volume 9, Issue 2 (February 2023) – 99 articles

Cover Story (view full-size image): 
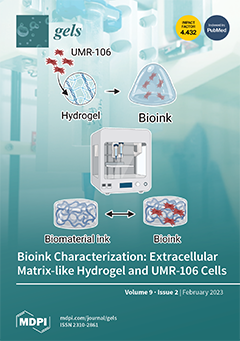
Three-dimensional in vitro models represent a challenging opportunity to advance in tissue engineering, as they are an alternative method that better mimics the real complexity of tissues in vivo, compared to 2D cultures. The advent of technologies such as 3D bioprinting allows the production of 3D cellular microenvironments thanks to the controlled spatial deposition of bioinks, i.e., a mix of a biomaterial (usually hydrogel) and biological components (e.g., cells). Such bioinks must satisfy precise requirements for 3D bioprinting. In this work, we describe a protocol that denotes a strong approach for bioink characterization evaluating the hydrogel formulation repeatability, printability, and biocompatibility. View this paper
  • Issues are regarded as officially published after their release is announced to the table of contents alert mailing list.
  • You may sign up for e-mail alerts to receive table of contents of newly released issues.
  • PDF is the official format for papers published in both, html and pdf forms. To view the papers in pdf format, click on the "PDF Full-text" link, and use the free Adobe Reader to open them.
Order results
Result details
Section
Select all
Export citation of selected articles as:
13 pages, 6164 KiB  
Article
Directional-Freezing-Assisted In Situ Sol–Gel Strategy to Synthesize High-Strength, Fire-Resistant, and Hydrophobic Wood-Based Composite Aerogels for Thermal Insulation
by Yan Hou, Junyong Chen, Defang Pan and Lu Zhao
Gels 2023, 9(2), 170; https://doi.org/10.3390/gels9020170 - 20 Feb 2023
Cited by 4 | Viewed by 2502
Abstract
The undesirable inherent natural characteristics of wood, such as low mechanical strength, flammability, and hygroscopicity, limit its potential applications in the thermal insulation industry. Overcoming these disadvantages can greatly expand the application scope of wood. A new attempt at wood modification, the directional-freezing-assisted [...] Read more.
The undesirable inherent natural characteristics of wood, such as low mechanical strength, flammability, and hygroscopicity, limit its potential applications in the thermal insulation industry. Overcoming these disadvantages can greatly expand the application scope of wood. A new attempt at wood modification, the directional-freezing-assisted in situ sol–gel strategy, was used to obtain wood–silica composite aerogels with the unique multi-level ordered porous structure of wood. This method enables silica nanoparticles to successfully replace lignin and facilitates the formation of strong hydrogen bonds between the silica and cellulose molecules. This results in improved mechanical properties for the composite with a density similar to that of natural wood but a mechanical strength that can be up to five times greater. The thermal conductivity coefficient is also reduced to 0.032 W (m·K)−1 compared to 0.066 W (m·K)−1 for natural wood. This aerogel composite exhibits improved fire resistance and hygroscopicity, with a decomposition temperature increase of approximately 45 °C compared to natural wood. Additionally, the composite demonstrates self-extinguishing behavior, with the structure remaining intact after combustion, and thus enhanced fire resistance. Simultaneously, the enhanced aerogel composite hydrophobicity, with water contact angle of up to 120°, is beneficial to a prominent thermal insulation performance in a high-humidity environment. The successful synthesis of wood-based composite aerogels provides a new and innovative approach for the utilization of wood resources in the thermal insulation industry. Full article
(This article belongs to the Special Issue Advances in Biopolymer Aerogels and Their Composites)
Show Figures

Figure 1

Figure 1
<p>Schematic of the fabrication of wood-based composite aerogels via the directional−freezing−assisted in situ sol−gel strategy.</p>
Full article ">Figure 2
<p>Optical photographs and SEM images of (<b>a</b>−<b>c</b>) NW, (<b>d</b>−<b>f</b>) DW, and (<b>g</b>−<b>i</b>) DW/Si-10 aerogel.</p>
Full article ">Figure 3
<p>(<b>a</b>) Chemical composition and (<b>b</b>) FT−IR spectra of the samples.</p>
Full article ">Figure 4
<p>(<b>a</b>) SEM image of the DW/Si-10 aerogel, (<b>b</b>) Element (C, O, Si) content of the DW/Si-10 aerogel, (<b>c</b>) C, (<b>d</b>) O, and (<b>e</b>) Si EDS spectrum of the DW/Si-10 aerogel.</p>
Full article ">Figure 5
<p>(<b>a</b>) Stress−strain curves of the samples (inset is the schematic of compression test) and (<b>b</b>) elastic modulus and strength at 60% compression of the NW and DW/Si-x aerogels.</p>
Full article ">Figure 6
<p>(<b>a</b>) Densities and thermal conductivity of the samples and (<b>b</b>) the experimental setup; inset is the point heat source.</p>
Full article ">Figure 7
<p>Infrared images of the DW/Si-10 aerogel at a point heat source of 102 °C; “max” and “min” in the Figure body express the highest and minimum temperature in the infrared region, respectively.</p>
Full article ">Figure 8
<p>(<b>a</b>) WCAs of the samples. Water dropped onto the surface of (<b>b</b>) NW, (<b>c</b>) DW, and (<b>d</b>) DW/Si-10; the water was colored orange with methyl orange before the experiments; inset is the morphology of water droplets on the DW/Si-x material surface.</p>
Full article ">Figure 9
<p>(<b>a</b>) TGA curves (measured in air), and (<b>b</b>) the experimental setup.</p>
Full article ">
12 pages, 1786 KiB  
Article
Hydrogel Encapsulation of Genome-Engineered Stem Cells for Long-Term Self-Regulating Anti-Cytokine Therapy
by Kelsey H. Collins, Lara Pferdehirt, Leila S. Saleh, Alireza Savadipour, Luke E. Springer, Kristin L. Lenz, Dominic M. Thompson, Jr., Sara J. Oswald, Christine T. N. Pham and Farshid Guilak
Gels 2023, 9(2), 169; https://doi.org/10.3390/gels9020169 - 20 Feb 2023
Cited by 7 | Viewed by 4299
Abstract
Biologic therapies have revolutionized treatment options for rheumatoid arthritis (RA) but their continuous administration at high doses may lead to adverse events. Thus, the development of improved drug delivery systems that can sense and respond commensurately to disease flares represents an unmet medical [...] Read more.
Biologic therapies have revolutionized treatment options for rheumatoid arthritis (RA) but their continuous administration at high doses may lead to adverse events. Thus, the development of improved drug delivery systems that can sense and respond commensurately to disease flares represents an unmet medical need. Toward this end, we generated induced pluripotent stem cells (iPSCs) that express interleukin-1 receptor antagonist (IL-1Ra, an inhibitor of IL-1) in a feedback-controlled manner driven by the macrophage chemoattractant protein-1 (Ccl2) promoter. Cells were seeded in agarose hydrogel constructs made from 3D printed molds that can be injected subcutaneously via a blunt needle, thus simplifying implantation of the constructs, and the translational potential. We demonstrated that the subcutaneously injected agarose hydrogels containing genome-edited Ccl2-IL1Ra iPSCs showed significant therapeutic efficacy in the K/BxN model of inflammatory arthritis, with nearly complete abolishment of disease severity in the front paws. These implants also exhibited improved implant longevity as compared to the previous studies using 3D woven scaffolds, which require surgical implantation. This minimally invasive cell-based drug delivery strategy may be adapted for the treatment of other autoimmune or chronic diseases, potentially accelerating translation to the clinic. Full article
(This article belongs to the Special Issue Bioprinting Hydrogels)
Show Figures

Figure 1

Figure 1
<p>(<b>A</b>) Schematic of agarose constructs of different thicknesses (2.4 mm [surface area = 36.8 mm<sup>2</sup>], 1.6 mm [29.2 mm<sup>2</sup>], and 0.75 mm [21.2 mm<sup>2</sup>]) loaded with Ccl2-IL1Ra iPSCs at the same cell densities and stimulated for chondrogenesis for 3 weeks. (<b>B</b>) After 24 h and 72 h of 1 ng/mL IL-1α treatment, the 2.4 and 1.6 mm constructs loaded with Ccl2-IL1Ra iPSCs produce similar levels of IL-1Ra, significantly exceeding the IL-1Ra production levels in the 1.6 mm construct loaded with Ccl2-Luc cells shown by dashed lines. (<b>C</b>) Fluorescent live/dead labeling (green = live; red = dead) show uniformly distributed live cells throughout the thickness of the 2.4 and 1.6 mm constructs, as well as relatively uniform proteoglycan staining by Safranin-O, scale bars: 500 µm. One-way ANOVA with Tukey’s post-hoc test, n = 4–5/group/timepoint. Different letters (a,b) indicate groups are significantly different from one another (<span class="html-italic">p</span> &lt; 0.05).</p>
Full article ">Figure 2
<p>(<b>A</b>) Custom-designed molds (left) were 3D-printed to generate cell-laden agarose rod constructs, which were aspirated into a wide-bore needle (middle) for minimally-invasive implantation subcutaneously through a small dorsal incision (right). (<b>B</b>) Ccl2-luc agarose rod constructs were challenged with 1 ng/mL IL-1α imaged via IVIS to observe activation over time, shown here is a time course of the same two constructs at 1 h, 4 h, and 12 h post IL-1α challenge. (<b>C</b>) Constructs showed robust activation with repeated washout (designated “W”) and reactivation with 1 ng/mL IL-1α. n = 2–6 samples/group/timepoint.</p>
Full article ">Figure 3
<p>(<b>A</b>) Luminescence activity by IVIS 10 weeks after Ccl2-Luc agarose construct implantation indicates that cell activation peaked over the first 3 days after K/BxN serum challenge (<b>B</b>). (<b>C</b>) Luminescence activity by IVIS from Ccl2-Luc agarose constructs 28 weeks after implantation indicates cell activation after repeated K/BxN challenge. (<b>D</b>) Ccl2-Luc constructs demonstrated predominantly live cells upon explantation at 28 weeks, scale = 1 mm. (<b>E</b>,<b>F</b>) Ccl2-Luc constructs explanted after 1 and 28 weeks of implantation and challenged with 1 ng/mL IL-1α exhibited robust luminescence intensities ex vivo. n = 5–10 animals/group compared by 2-way repeated measures ANOVA and Dunnet’s or Tukey’s post-hoc test, n = 2–8/group/timepoint.</p>
Full article ">Figure 4
<p>(<b>A</b>) Timeline showing in vivo K/BxN serum transfer arthritis (STA) studies at 1 week, 10 weeks, or 28 weeks post-subcutaneous implantation of Ccl2-IL1Ra agarose rods. Clinical scores of K/BxN STA animals 1 week after implantation of Ccl2-luc or Ccl2-IL1Ra agarose rods over 6 days of observation for (<b>B</b>) overall clinical scores, (<b>C</b>) hindpaws and (<b>D</b>) front paws. (<b>E</b>) IL-1Ra levels in serum at day 2 post K/BxN serum challenge, as measured by ELISA. IL1Ra constructs significantly mitigated mechanical allodynia by (<b>F</b>) Electronic von Frey and (<b>G</b>) pressure-pain hyperalgesia. STA overall clinical scores (<b>H</b>) 10 weeks and (<b>I</b>) 28 weeks after implantation of Ccl2-IL1Ra agarose rods. Note that the degree of disease mitigation observed after 28 weeks is similar to mitigation 1 week after implantation. Different letters indicate significant main effects of group, <span class="html-italic">p</span> &lt; 0.05. N = 3–6/group, data were analyzed by 2-way repeated measures ANOVA with Dunnet’s or Tukey’s post-hoc test. Different letters indicate main effect of group <span class="html-italic">p</span> &lt; 0.05.</p>
Full article ">
16 pages, 4387 KiB  
Article
Study on the Low-Temperature Rheology of Polar Drilling Fluid and Its Regulation Method
by Ning Huang, Kaihe Lv, Jinsheng Sun, Jingping Liu, Jintang Wang and Zonglun Wang
Gels 2023, 9(2), 168; https://doi.org/10.3390/gels9020168 - 20 Feb 2023
Cited by 2 | Viewed by 2181
Abstract
Drilling fluid is the blood of drilling engineering. In the polar drilling process, the ultra-low temperature environment puts high demands on the rheological performance of drilling fluids. In this paper, the effects of temperature, ice debris concentration and weighting agent on the rheological [...] Read more.
Drilling fluid is the blood of drilling engineering. In the polar drilling process, the ultra-low temperature environment puts high demands on the rheological performance of drilling fluids. In this paper, the effects of temperature, ice debris concentration and weighting agent on the rheological properties of drilling fluids were studied. It was found that the lower the temperature and the higher the ice debris concentration, the higher the drilling fluid viscosity, but when the ice debris concentration was below 2%, the drilling fluid rheology hardly changed. Secondly, the low temperature rheological properties of drilling fluid were adjusted by three different methods: base fluid ratio, organoclay, and polymers (dimer acid, polymethacrylate, ethylene propylene copolymer, and vinyl resin). The results showed that the base fluid rheological performance was optimal when the base fluid ratio was 7:3. Compared with polymers, organoclay has the most significant improvement on the low temperature rheological performance of drilling fluid. The main reason is that organoclay can transform the drilling fluid from Newtonian to non-Newtonian fluid, which exhibits excellent shear dilution of drilling fluid. The organoclay is also more uniformly dispersed in the oil, forming a denser weak gel mesh structure, so it is more effective in improving the cuttings carrying and suspension properties of drilling fluids. However, the drilling fluid containing polymer additives is still a Newtonian fluid, which cannot form a strong mesh structure at ultra-low temperatures, and thus cannot effectively improve the low-temperature rheological performance of drilling fluid. In addition, when the amount of organoclay is 2%, the improvement rate of the yield point reaches 250% at −55 °C, which can effectively improve the cuttings carrying and suspension performance of drilling fluid at ultra-low temperature. Full article
Show Figures

Graphical abstract

Graphical abstract
Full article ">Figure 1
<p>Influence of temperature on the viscosity of drilling fluid.</p>
Full article ">Figure 2
<p>Influence of ice debris concentration on the rheological properties of drilling fluid; (<b>a</b>) viscosity; (<b>b</b>) yield point.</p>
Full article ">Figure 3
<p>Influence of the weighting agent addition on the apparent viscosity of the drilling fluid.</p>
Full article ">Figure 4
<p>Influence of the base fluid ratio on the rheological properties of the drilling fluid; (<b>a</b>) apparent viscosity; (<b>b</b>) plastic viscosity; (<b>c</b>) yield point.</p>
Full article ">Figure 5
<p>Effects of the different concentrations of organoclay on the rheological properties of the drilling fluid; (<b>a</b>) apparent viscosity; (<b>b</b>) plastic viscosity; (<b>c</b>) yield point.</p>
Full article ">Figure 6
<p>Effects of dimeric acid at different concentrations on the rheological properties of drilling fluid; (<b>a</b>) apparent viscosity; (<b>b</b>) plastic viscosity; (<b>c</b>) yield point.</p>
Full article ">Figure 7
<p>Effects of the different concentrations of polymethacrylate on the rheological properties of the drilling fluid; (<b>a</b>) apparent viscosity; (<b>b</b>) plastic viscosity; (<b>c</b>) yield point.</p>
Full article ">Figure 8
<p>Effects of the different concentrations of ethylene propylene copolymer on the rheological properties of drilling fluid; (<b>a</b>) apparent viscosity; (<b>b</b>) plastic viscosity; (<b>c</b>) yield point.</p>
Full article ">Figure 9
<p>Effects of the different concentrations of vinyl resin on the rheological properties of drilling fluid; (<b>a</b>) apparent viscosity; (<b>b</b>) plastic viscosity.</p>
Full article ">Figure 10
<p>Haake rheological curve of drilling fluid with 4% different additives; (<b>a</b>) viscosity with shear rate; (<b>b</b>) graph of shear stress variation with shear rate.</p>
Full article ">Figure 11
<p>Optical microscope images of the drilling fluid containing 4% different additives after freezing at −55 °C for 16 h; (<b>a</b>) 7:3 base fluid; (<b>b</b>) vinyl resin; (<b>c</b>) polymethacrylate; (<b>d</b>) ethylene propylene copolymer; (<b>e</b>) dimeric acid; (<b>f</b>) Baker’s organoclay.</p>
Full article ">
11 pages, 4249 KiB  
Article
Conductive and Adhesive Granular Alginate Hydrogels for On-Tissue Writable Bioelectronics
by Sumin Kim, Heewon Choi, Donghee Son and Mikyung Shin
Gels 2023, 9(2), 167; https://doi.org/10.3390/gels9020167 - 19 Feb 2023
Cited by 8 | Viewed by 3624
Abstract
Conductive hydrogels are promising materials in bioelectronics that ensure a tissue-like soft modulus and re-enact the electrophysiological function of damaged tissues. However, recent approaches to fabricating conductive hydrogels have proved difficult: fixing of the conductive hydrogels on the target tissues hydrogels requires the [...] Read more.
Conductive hydrogels are promising materials in bioelectronics that ensure a tissue-like soft modulus and re-enact the electrophysiological function of damaged tissues. However, recent approaches to fabricating conductive hydrogels have proved difficult: fixing of the conductive hydrogels on the target tissues hydrogels requires the aids from other medical glues because of their weak tissue-adhesiveness. In this study, an intrinsically conductive and tissue-adhesive granular hydrogel consisting of a PEDOT:PSS conducting polymer and an adhesive catechol-conjugated alginate polymer was fabricated via an electrohydrodynamic spraying method. Because alginate-based polymers can be crosslinked by calcium ions, alginate-catechol polymers mixed with PEDOT:PSS granular hydrogels (ACP) were easily fabricated. The fabricated ACP exhibited not only adhesive and shear-thinning properties but also conductivity similar to that of muscle tissue. Additionally, the granular structure makes the hydrogel injectable through a syringe, enabling on-tissue printing. This multifunctional granular hydrogel can be applied to soft and flexible electronics to connect humans and machines. Full article
Show Figures

Graphical abstract

Graphical abstract
Full article ">Figure 1
<p>Overall schematic of the on-tissue writable conductive hydrogel.</p>
Full article ">Figure 2
<p>Experimental setup and fabrication of Alg-CA granular hydrogel. (<b>a</b>): (<b>i</b>) Illustration of the experimental setup; (<b>ii</b>) Chemical structure and illustration of the granular hydrogel. (<b>b</b>–<b>d</b>) Size distribution and fluorescence images of AC fabricated with different voltages; 5 kV (<b>b</b>), 10 kV (<b>c</b>), and 15 kV (<b>d</b>). Size and aspect ratio were measured from fluorescence images.</p>
Full article ">Figure 3
<p>Mechanical characterization of AC and ACPs. (<b>a</b>) Morphology of fabricated ACPs. Optical images of ACP<sub>0.5</sub> (top) and ACP<sub>1</sub> (bottom) and their average size and aspect ratio. (<b>b</b>) Oscillation frequency sweep measurement of AC (black), ACP<sub>0.5</sub> (light blue), and ACP<sub>1</sub> (dark blue). Filled circles represent storage modulus (G′), and empty circles represent loss modulus (G″). (<b>c</b>) Storage modulus (black) and tan (δ) (red) value of each sample at the frequency of 1 Hz. (<b>d,e</b>) Adhesive strength of Alg bead, AC, ACP<sub>0.5</sub>, and ACP<sub>1</sub> on porcine skin tissue with the application of shear stress (<b>d</b>) and tensile stress (<b>e</b>). Experimental setup for each test is demonstrated on the left side of each panel. One-way ANOVA; ns means not significant, <span class="html-italic">* p</span> &lt; 0.05, ** <span class="html-italic">p</span> &lt; 0.01, **** <span class="html-italic">p</span> &lt; 0.0001.</p>
Full article ">Figure 4
<p>Injectability characterization of AC and ACP. (<b>a</b>) Shear-thinning behavior of AC and ACP. (<b>b</b>) Self-healing properties of AC (black), ACP<sub>0.5</sub> (light blue), and ACP<sub>1</sub> (blue). Storage modulus was plotted with filled circles. (<b>c</b>) Injection of ACPs using a 23 Ga needle. (<b>d</b>) Bending of ACP<sub>0.5</sub> printed on the porcine skin tissue in the concave or convex directions.</p>
Full article ">Figure 5
<p>Electrical characterization of AC and ACPs. (<b>a</b>) Conductivity of AC (black), ACP<sub>0.5</sub> (light blue), and ACP<sub>1</sub> (dark blue). (<b>b</b>) Schematic of LED-emitting experiment on variable substrates. (<b>c</b>) LED emission in electrical circuit serially connected with ACP<sub>1</sub> printed on elastomer substrate and porcine skin substrate. One-way ANOVA, <span class="html-italic">*** p</span> &lt; 0.001, <span class="html-italic">**** p</span> &lt; 0.0001.</p>
Full article ">Figure 6
<p>In vitro cytotoxicity of AC and ACPs. (<b>a</b>) Fluorescent images of L929 cells at 24 h after the treatment of the elutes (0.1×) from AC, ACP<sub>0.5</sub>, and ACP<sub>1</sub>. ‘NT’ as none of treatment. (<b>b</b>) Quantitative analysis of the cell viability (%). One-way ANOVA. ‘ns’ means ‘not significant’.</p>
Full article ">
33 pages, 7268 KiB  
Article
Bioengineered Water-Responsive Carboxymethyl Cellulose/Poly(vinyl alcohol) Hydrogel Hybrids for Wound Dressing and Skin Tissue Engineering Applications
by Nádia Sueli Vieira Capanema, Alexandra Ancelmo Piscitelli Mansur, Isadora Cota Carvalho, Sandhra Maria Carvalho and Herman Sander Mansur
Gels 2023, 9(2), 166; https://doi.org/10.3390/gels9020166 - 18 Feb 2023
Cited by 16 | Viewed by 3679
Abstract
The burden of chronic wounds is growing due to the increasing incidence of trauma, aging, and diabetes, resulting in therapeutic problems and increased medical costs. Thus, this study reports the synthesis and comprehensive characterization of water-responsive hybrid hydrogels based on carboxymethyl cellulose (CMC) [...] Read more.
The burden of chronic wounds is growing due to the increasing incidence of trauma, aging, and diabetes, resulting in therapeutic problems and increased medical costs. Thus, this study reports the synthesis and comprehensive characterization of water-responsive hybrid hydrogels based on carboxymethyl cellulose (CMC) and poly(vinyl alcohol) (PVA) using citric acid (CA) as the chemical crosslinking agent, with tunable physicochemical properties suitable to be applied as a wound dressing for soft tissue engineering applications. They were produced through an eco-friendly process under mild conditions. The hydrogels were designed and produced with flexible swelling degree properties through the selection of CMC molecular mass (Mw = 250 and 700 kDa) and degree of functionalization (DS = 0.81), degree of hydrolysis of PVA (DH > 99%, Mw = 84–150 kDa) associated with synthesis parameters, CMC/PVA ratio and extension of chemical crosslinking (CA/CMC:PVA ratio), for building engineered hybrid networks. The results demonstrated that highly absorbent hydrogels were produced with swelling degrees ranging from 100% to 5000%, and gel fraction from 40% to 80%, which significantly depended on the concentration of CA crosslinker and the presence of PVA as the CMC-based network modifier. The characterizations indicated that the crosslinking mechanism was mostly associated with the chemical reaction of CA carboxylic groups with hydroxyl groups of CMC and PVA polymers forming ester bonds, rendering a hybrid polymeric network. These hybrid hydrogels also presented hydrophilicity, permeability, and structural features dependent on the degree of crosslinking and composition. The hydrogels were cytocompatible with in vitro cell viability responses of over 90% towards model cell lines. Hence, it is envisioned that this research provides a simple strategy for producing biocompatible hydrogels with tailored properties as wound dressings for assisting chronic wound healing and skin tissue engineering applications. Full article
(This article belongs to the Special Issue Advances in Cellulose-Based Hydrogels (2nd Edition))
Show Figures

Graphical abstract

Graphical abstract
Full article ">Figure 1
<p>Schematic representation of the experimental design of bioengineered water-responsive CMC hydrogels, PVA hydrogels, and CMC:PVA hybrid hydrogels.</p>
Full article ">Figure 2
<p>Swelling degree (<b>a</b>) and gel fraction (<b>b</b>) properties of hydrogels of CMC crosslinked with citric acid: (<b>A</b>) CMC-250 and (<b>B</b>) CMC-700. Insets: typical hydrogel membranes of CMC-250 and CMC-700 crosslinked with CA. Effect of molecular weight of CMC in (<b>C</b>) swelling degree (inset ΔSD) and (<b>D</b>) gel fraction properties of hydrogels (inset ΔGF).</p>
Full article ">Figure 3
<p>(<b>A</b>) FTIR spectra of CMC-250 crosslinked with different amounts of citric acid: (<b>a</b>) CA/CMC = 0%, (<b>b</b>) CA/CMC = 10%, (<b>c</b>) CA/CMC = 15%, (<b>d</b>) CA/CMC = 20%, and (<b>e</b>) CA/CMC = 25%. Evolution of CMC bands with increasing citric acid content: (<b>B</b>) 1850–1500 cm<sup>−1</sup> range associated with ester bonds formation (inset: A<sub>1730</sub>/A<sub>896</sub> ratio; arrows indicate the trend) and (<b>C</b>) 3700–3000 cm<sup>−1</sup> range associated with hydrogen bonds’ consumption (inset: A<sub>3200</sub>/A<sub>896</sub> OH interchain band).</p>
Full article ">Figure 4
<p>TG (<b>a</b>,<b>b</b>) and DTG (<b>c</b>,<b>d</b>) analysis of (<b>A</b>) CMC-250_CA0 (—) and CMC-700_CA0 (<b>—</b>) and (<b>B</b>) CMC-700_CA0 (—) and CMC-700_CA25 (—) hydrogels. XPS analysis of C 1s region for (<b>C</b>) CMC-250_CA0 (<b>a</b>) and CMC-250_CA25 (<b>b</b>) and (<b>D</b>) CMC-700_CA0 (<b>a</b>) and CMC-700_CA25 (<b>b</b>) hydrogels.</p>
Full article ">Figure 5
<p>Swelling degree (<b>a</b>) and gel fraction (<b>b</b>) properties of hydrogels of PVA crosslinked with citric acid (inset: digital image of PVA_CA25).</p>
Full article ">Figure 6
<p>(<b>A</b>) FTIR spectra of PVA crosslinked with different amounts of CA/PVA: (<b>a</b>) 0%, (<b>b</b>) 10%, (<b>c</b>) 15%, (<b>d</b>) 20%, and (<b>e</b>) 25%. Evolution of (<b>B</b>) C=O (1714 cm<sup>−1</sup>) and O-C=O (1730 cm<sup>−1</sup>) (inset: A<sub>C=O</sub>/A<sub>CH3</sub> and A<sub>O-C=O</sub>/A<sub>CH3</sub> ratios), and (<b>C</b>) C-OH band (1390 cm<sup>−1</sup>, inset: A<sub>C-OH</sub>/A<sub>CH3</sub> ratio). Arrows indicate the trend of the parameter/band.</p>
Full article ">Figure 7
<p>(<b>A</b>) TG (<b>a</b>,<b>b</b>) and DTG (<b>c</b>,<b>d</b>) analysis of PVA_CA0 (—) and PVA_CA25(<b>—</b>) hydrogels (inset DSC curves). XPS analysis of C 1s region of (<b>B</b>) PVA_CA0 and (<b>C</b>) PVA_CA25 hydrogels.</p>
Full article ">Figure 8
<p>Swelling degree ((<b>A</b>) CMC-250:PVA, (<b>B</b>) CMC-700:PVA, and (<b>C</b>) effect of CMC Mw. Inset: digital images of hybrids at CA25) and gel fraction ((<b>D</b>) CMC-250:PVA and (<b>E</b>) CMC-700:PVA) properties of hybrids crosslinked with different amounts of CA: (<b>a</b>) CMC-250:PVA_CA15, (<b>b</b>) CMC-250:PVA_CA20, (<b>c</b>) CMC-250:PVA_CA25, (<b>d</b>) CMC-700:PVA_CA15, (<b>e</b>) CMC-700:PVA_CA20, and (<b>f</b>) CMC-700:PVA_CA25.</p>
Full article ">Figure 9
<p>(<b>A</b>) FTIR spectra of CMC-250:PVA with (<b>a</b>) CA0, (<b>b</b>) CA15, and (<b>c</b>) CA25. Detail of FTIR spectra in the range of 3700–3000 cm<sup>−1</sup> for (<b>B</b>) CMC-250:PVA and (<b>C</b>) CMC-700:PVA ((<b>a</b>) CA0, (<b>b</b>) CA15, and (<b>c</b>) CA25). Evolution of the ratio of bands A<sub>3200</sub>/A<sub>896</sub> as a function of PVA content for (<b>D</b>) CMC-250:PVA and (<b>E</b>) CMC-700:PVA ((<b>a</b>) CA0, (<b>b</b>) CA15, and (<b>c</b>) CA25).</p>
Full article ">Figure 10
<p>(<b>A</b>) TG (<b>a</b>–<b>c</b>) and DTG (<b>d</b>,<b>f</b>) analysis of CMC-700_CA0 (—, solid line), PVA_CA0 (<b>—</b>), and CMC-700:PVA_CA0 (---, dashed line) hydrogels. (<b>B</b>) TG (<b>a</b>,<b>b</b>) and DTG (<b>c</b>,<b>d</b>) analysis of CMC-700:PVA_CA0 (—) and CMC-700:PVA_CA25 (<b>—</b>) hydrogels. (<b>C</b>) TG (<b>a</b>–<b>c</b>) and DTG (<b>d</b>–<b>f</b>) analysis of CMC-700_CA25 (—), PVA_CA25 (<b>—</b>), and CMC-700:PVA_CA25 (---) hydrogels.</p>
Full article ">Figure 11
<p>XPS analysis of C 1s region of (<b>A</b>) CMC-250:PVA and (<b>B</b>) CMC-700:PVA hybrids with CA/polymer content (<b>a</b>) 0% and (<b>b</b>) 25%.</p>
Full article ">Figure 12
<p>(<b>A</b>) SEM images of CMC-700:PVA blend before (<b>left side</b>, CA0) and after (<b>right side</b>, CA25) crosslinking reactions (5000×, scale bar = 20 μm). SEM images of crosslinked (<b>B</b>) CMC-250_CA20, (<b>C</b>) PVA_CA20, and (<b>D</b>) CMC-700:PVA_CA25 (20,000×, scale bar = 5 μm).</p>
Full article ">Figure 13
<p>(<b>A</b>) Evaluation of wettability of crosslinked hydrogels (CA/polymer = 25%) based on the static contact angle measurements (sessile drop method), including typical digital images obtained for different systems under evaluation. (<b>B</b>) Permeability of crosslinked hydrogels.</p>
Full article ">Figure 14
<p>Cell viability results of HEK293T and A375 cell cultures based on MTT protocols after 24 h of incubation with hydrogels.</p>
Full article ">
19 pages, 2635 KiB  
Article
Calcitermin-Loaded Smart Gels Activity against Candida albicans: A Preliminary In Vitro Study
by Denise Bellotti, Maria D’Accolti, Walter Pula, Nicolas Huang, Fanny Simeliere, Elisabetta Caselli, Elisabetta Esposito and Maurizio Remelli
Gels 2023, 9(2), 165; https://doi.org/10.3390/gels9020165 - 18 Feb 2023
Cited by 7 | Viewed by 1872
Abstract
Calcitermin is an antimicrobial peptide of 15 amino acids found in human nasal fluid characterized by antifungal and antibacterial properties. Candida albicans is the most common human fungal pathogen affecting many tissues, such as vaginal mucosa. In this study a formulation suitable for [...] Read more.
Calcitermin is an antimicrobial peptide of 15 amino acids found in human nasal fluid characterized by antifungal and antibacterial properties. Candida albicans is the most common human fungal pathogen affecting many tissues, such as vaginal mucosa. In this study a formulation suitable for calcitermin administration on vaginal mucosa was developed for the treatment of fungal infections. To favor topical application, mucosal adhesion, and permanence, gels based on poloxamer 407 and xanthan gum were designed and compared with regard to their rheological behavior, erosion, and leakage. The selected gel was loaded with calcitermin, whose release kinetic was evaluated in vitro by Franz cells. An antifungal activity assay was conducted to assess the calcitermin anticandidal potential and the effect of its inclusion in the selected gel. The rheological study revealed the elastic and viscous moduli behavior as a function of poloxamer 407 and xanthan gum concentration. Xanthan gum presence decreased the transition temperature of the gel, while prolonging its erosion and leakage. Particularly, poloxamer 407, 18% and xanthan gum 0.4% were chosen. The calcitermin loading in the selected gel resulted in a transparent and homogeneous formulation and in a 4-fold decrease of the release rate with respect to the calcitermin solution, as evidenced by Franz cell study. The anticandidal activity tests demonstrated that calcitermin-loaded gel was more active against Candida albicans with respect to the peptide solution. Full article
Show Figures

Graphical abstract

Graphical abstract
Full article ">Figure 1
<p>Primary structure of Cal (VAIALKAAHYHTHKE).</p>
Full article ">Figure 2
<p>Variation of elastic G′ and viscous G″ moduli as a function of temperature; analyses were performed on gels based on p-407 15 or 18% and x-gum 0.1 (<b>a</b>), 0.2 (<b>b</b>), or 0.4 (<b>c</b>) %, <span class="html-italic">w</span>/<span class="html-italic">w</span>.</p>
Full article ">Figure 3
<p>Erosion profiles of G15/0.1, G15/0.2, G15/0.4, G18/0.1, G18/0.2, and G18/0.4 at 37 °C. Results are shown as the percentage of remaining gel weight as a function of time. Data are the mean of three experiments ± s.d.</p>
Full article ">Figure 4
<p>Comparative leakage test performed on formulations colored by Coomassie blue dye for imaging. Images (<b>a</b>) and leakage distances (<b>b</b>) were taken 10 s after placing the formulations on the slides. Data are the mean of three experiments ± s.d.</p>
Full article ">Figure 5
<p>In vitro release kinetics of Cal from Sol Cal (x) and G18/0.4 Cal (<span style="color:#4472C4">o</span>). Data corresponds to the mean values of six experiments ± s.d.</p>
Full article ">Figure 6
<p>Antimicrobial activity of Cal peptide in aqueous buffer (AB). (<b>a</b>) Effect after 3 h of incubation; (<b>b</b>) Effect after 24 h of incubation. CTR, control yeast, receiving AB buffer without Cal; CFU, colony forming units. Results are expressed ad mean value of CFUs ± SD obtained in triplicate samples from two independent experiments; * <span class="html-italic">p</span> value ≤ 0.05; ** <span class="html-italic">p</span> value ≤ 0.01.</p>
Full article ">Figure 7
<p>Antifungal activity of G18/0.4 Cal. (<b>a</b>) Effect after 3 h of contact. (<b>b</b>) Effect after 24 h of contact. CTR, control yeasts receiving G18/0.4 gel without Cal; CFU, colony forming units. Results are expressed as mean value of CFUs ± s.d. obtained from triplicate samples from two independent experiments; ** <span class="html-italic">p</span> value &lt; 0.01; *** <span class="html-italic">p</span> values &lt; 0.001.</p>
Full article ">
10 pages, 1925 KiB  
Article
Spatial Control over Catalyst Positioning for Increased Micromotor Efficiency
by Shauni Keller, Serena P. Teora, Arif Keskin, Luuk J. C. Daris, Norman A. P. E. Samuels, Moussa Boujemaa and Daniela A. Wilson
Gels 2023, 9(2), 164; https://doi.org/10.3390/gels9020164 - 18 Feb 2023
Cited by 2 | Viewed by 2054
Abstract
Motion is influenced by many different aspects of a micromotor’s design, such as shape, roughness and the type of materials used. When designing a motor, asymmetry is the main requirement to take into account, either in shape or in catalyst distribution. It influences [...] Read more.
Motion is influenced by many different aspects of a micromotor’s design, such as shape, roughness and the type of materials used. When designing a motor, asymmetry is the main requirement to take into account, either in shape or in catalyst distribution. It influences both speed and directionality since it dictates the location of propulsion force. Here, we combine asymmetry in shape and asymmetry in catalyst distribution to study the motion of soft micromotors. A microfluidic method is utilized to generate aqueous double emulsions, which upon UV-exposure form asymmetric microgels. Taking advantage of the flexibility of this method, we fabricated micromotors with homogeneous catalyst distribution throughout the microbead and micromotors with different degrees of catalyst localization within the active site. Spatial control over catalyst positioning is advantageous since less enzyme is needed for the same propulsion speed as the homogeneous system and it provides further confinement and compartmentalization of the catalyst. This proof-of-concept of our new design will make the use of enzymes as driving forces for motors more accessible, as well as providing a new route for compartmentalizing enzymes at interfaces without the need for catalyst-specific functionalization. Full article
(This article belongs to the Special Issue Hydrogels, Microgels, and Nanogels: From Fundamentals to Applications)
Show Figures

Graphical abstract

Graphical abstract
Full article ">Figure 1
<p>Schematic representation of the experimental design. (<b>A</b>) Close-up of the ATPS-based microfluidic chip to generate droplet-in-droplet morphology. An aqueous-two-phase jet is formed at the first cross junction, which is emulsified at the second cross junction by a surfactant containing oil. (<b>B</b>) Asymmetric microgels are obtained after UV-polymerization of the droplets generated by the microfluidic chip; upon addition to hydrogen peroxide the catalyst, catalase, will decompose the fuel to water and propelling oxygen. (<b>C</b>) Two methods to position the catalyst, either homogeneously through incorporation in the gel or spatially through adding it to the polysaccharide, templating phase.</p>
Full article ">Figure 2
<p>Confocal microscopy images of the different micromotor systems. Catalase was labelled with a fluorescent dye, Alexa 647, to analyse its position inside the motor. Bright field images are shown left, and the corresponding fluorescence images are on the right. The position of the motor is shown in dashed lines and the fluorescence intensity profile (bottom left) was obtained over the solid line going from the opening inside the motor. Spatial control over the catalyst was obtained by dissolving the enzyme in the polysaccharide phase prior to injection into the chip. As a control the catalyst was dissolved in the PEGDA gel phase, and a homogeneous distribution throughout the bead was observed. Scale bar is 20 µm.</p>
Full article ">Figure 3
<p>(<b>A</b>) Bright field microscopy overlay of bubble propulsion of the three different polysaccharide systems with an interval of 0.5, 1, and 6 s for dextran 10 kDa, 70 kDa and Ficoll 400 kDa, respectively. (<b>B</b>) Typical trajectories of each motor system. Scale bar is 20 µm.</p>
Full article ">Figure 4
<p>(<b>A</b>) The average speed over 10 s of the enzyme-localized systems compared to the previously obtained homogeneous systems [<a href="#B6-gels-09-00164" class="html-bibr">6</a>] for all three polysaccharides at 4% hydrogen peroxide concentration. (<b>B</b>) The instantaneous speed of both systems was analysed over a time-course up to 60 s after addition at 4% hydrogen peroxide concentration.</p>
Full article ">
14 pages, 2033 KiB  
Article
Development of a Polyherbal Topical Gel for the Treatment of Acne
by Benedict Jose Chellathurai, Ramyadevi Anburose, Mohammad H. Alyami, Mohan Sellappan, Mohammad F. Bayan, Balakumar Chandrasekaran, Kumarappan Chidambaram and Mohamed Rahamathulla
Gels 2023, 9(2), 163; https://doi.org/10.3390/gels9020163 - 17 Feb 2023
Cited by 11 | Viewed by 4682
Abstract
The present work aimed to formulate and evaluate a polyherbal gel using Aloe barbadensis and extract of Vigna radiata for the treatment of acne, a disorder of the skin in which hair follicles and sebaceous glands are blocked, causing inflammation and redness of [...] Read more.
The present work aimed to formulate and evaluate a polyherbal gel using Aloe barbadensis and extract of Vigna radiata for the treatment of acne, a disorder of the skin in which hair follicles and sebaceous glands are blocked, causing inflammation and redness of the skin. Aloe barbadensis pulp was collected and mixed with the extract of Vigna radiata and formulated into a gel using Carbopol 940, triethanolamine, and propylene glycol as the gelling agent, viscosity modifier, and pH modifier, respectively. The gel was evaluated for its antimicrobial properties against Staphylococcus aureus, Escherichia coli, and Candida albicans. Antimicrobial agents, such as gentamycin and fluconazole, were used as the standards. The developed formulation showed promising zone of inhibition. The gel was further evaluated for its physicochemical properties. The formulation showed a promising effect on acne together with the additive effect of Aloe barbadensis on skin. Full article
Show Figures

Figure 1

Figure 1
<p>Zone of inhibition of <span class="html-italic">Vigna radiata</span> extract towards <span class="html-italic">Staphylococcus aureus</span> (<b>1</b>) 12.4 mm, (<b>2</b>) 12.3 mm, (<b>3</b>) 12.1 mm and (<b>c</b>) control.</p>
Full article ">Figure 2
<p>Zone of inhibition of <span class="html-italic">Vigna radiata</span> extract toward <span class="html-italic">Escherichia coli</span> (<b>1</b>) 13.2 mm, (<b>2</b>) 13.1 mm, (<b>3</b>) 13.1 mm and (<b>c</b>) control.</p>
Full article ">Figure 3
<p>Zone of inhibition of <span class="html-italic">Vigna radiata</span> extract toward <span class="html-italic">Candida albicans</span> (<b>1</b>) 12.4 mm, (<b>2</b>) 12.3 mm, (<b>3</b>) 12.5 mm and (<b>c</b>) control.</p>
Full article ">Figure 4
<p>Standard Gentamycin on <span class="html-italic">Staphylococcus aureus</span> at 10 mcg in duplicate at ZOI of 22.2 mm.</p>
Full article ">Figure 5
<p>Standard Gentamycin on <span class="html-italic">Escherichia coli</span> at 10 mcg in duplicate at ZOI of 22.3 mm.</p>
Full article ">Figure 6
<p>Standard Fluconazole on <span class="html-italic">Candida albicans</span> at 25 mcg in duplicate at ZOI of 22.2 mm.</p>
Full article ">Figure 7
<p>Image of formulated polyherbal gel containing <span class="html-italic">Vigna radiata</span> and <span class="html-italic">Aloe barbadensis</span>.</p>
Full article ">
15 pages, 6814 KiB  
Article
Ultrasensitive and Self-Powered Multiparameter Pressure–Temperature–Humidity Sensor Based on Ultra-Flexible Conductive Silica Aerogel
by Song He, Chunhua Du, Hongliang Sheng, Chunxiang He, Xinyu Liu, Xin Jin, Qilin Chen and Fuliang Tian
Gels 2023, 9(2), 162; https://doi.org/10.3390/gels9020162 - 17 Feb 2023
Cited by 5 | Viewed by 1854
Abstract
The application of silica aerogel has been limited because of its poor mechanical properties. In order to expand the application scope of silica aerogel, this study fabricated an ultra-flexible conductive silica aerogel as a multiparameter sensor. The sample is fabricated by introducing poly [...] Read more.
The application of silica aerogel has been limited because of its poor mechanical properties. In order to expand the application scope of silica aerogel, this study fabricated an ultra-flexible conductive silica aerogel as a multiparameter sensor. The sample is fabricated by introducing poly (3,4-ethylenedioxythiophene):polystyrene sulfonate (PEDOT:PSS) on a base of ultra-flexible silica aerogel, which was prepared by a diene synthesis reaction at atmospheric pressure. The pressure, temperature, and humidity can be converted into electrical signals. The pressure sensitivity can reach up to 54.88 kPa−1, and the detection limit is as low as 5 Pa. The temperature resolution is up to 0.1 K, and the response time of humidity is within 4 s. More importantly, the developed multiparameter sensor can be self-powered to realize multiparameter sensing of pressure, temperature, and humidity. The ultra-flexible conductive silica aerogel is a promising candidate for monitoring human activities and fire-affected areas. Full article
(This article belongs to the Special Issue Aerogels: Synthesis and Applications)
Show Figures

Graphical abstract

Graphical abstract
Full article ">Figure 1
<p>(<b>a</b>) Scanning electron microscopy of silica aerogel with PEDOT:PSS; (<b>b</b>–<b>e</b>) elemental mapping of silica aerogel with PEDOT:PSS.</p>
Full article ">Figure 2
<p>(<b>a</b>) Variations in sensor current with voltage without applied pressure; (<b>b</b>) resistance of the sensor with different applied pressures; (<b>c</b>) stress-strain curves of ultra-flexible silica aerogel for 20 cycles; (<b>d</b>) stability test of the conductive aerogel sensing property at 0.18 kPa.</p>
Full article ">Figure 3
<p>(<b>a</b>) Relative changes in current corresponding to different applied pressures; (<b>b</b>) sensitivity in the range of 0–0.9 kPa; (<b>c</b>) sensitivity in the range of 0.9–9 kPa; (<b>d</b>) I-V curves under different pressures.</p>
Full article ">Figure 4
<p>(<b>a</b>) Thermal voltage change with different temperature gradients; (<b>b</b>) I-V curves of the multiparameter sensor device under various temperature gradients. (<b>c</b>,<b>d</b>) TG-DTG curves of silica aerogel without PEDOT:PSS and with PEDOT:PSS; (<b>e</b>,<b>f</b>) Test of repeatability of 10 cycles for the pressure sensor after baking at 100 °C for 30 min.</p>
Full article ">Figure 5
<p>(<b>a</b>) The change in voltage with time under different humidities at ΔT = 35 K; (<b>b</b>) the change in ionic thermal voltage with different humidity gradients.</p>
Full article ">Figure 6
<p>(<b>a</b>) Test circuit of the self-powered sensor; (<b>b</b>) the index finger pressed the conductive aerogel with different strengths; (<b>c</b>,<b>d</b>) changes in voltage and current during pressing; (<b>e</b>,<b>f</b>) changes in electric resistance and applied pressure during pressing.</p>
Full article ">Figure 7
<p>(<b>a</b>,<b>b</b>) Fire sensing at a certain distance from the fire source by the multiparameter sensor; (<b>c</b>,<b>d</b>) ammeter and voltmeter readings of the sensor 10 cm away from the fire source; (<b>e</b>,<b>f</b>) ammeter and voltmeter readings of the sensor 30 cm away from the fire source.</p>
Full article ">Figure 8
<p>(<b>a</b>,<b>b</b>) Fire extinguishing sensing at a certain distance from the fire source by the multiparameter sensor; (<b>c</b>,<b>d</b>) ammeter and voltmeter readings of the sensor 10 cm away from the fire extinguishing point; (<b>e</b>,<b>f</b>) ammeter and voltmeter readings of the sensor 30 cm away from the fire extinguishing point.</p>
Full article ">Figure 9
<p>(<b>a</b>) Synthesis of the vinyl aerogel; (<b>b</b>) synthesis of the ultra-flexible aerogel; (<b>c</b>) preparation of conductive silica aerogel by compounding PEDOT:PSS.</p>
Full article ">Figure 10
<p>Schematic diagram of a multiparameter sensor setup.</p>
Full article ">
27 pages, 4370 KiB  
Review
Polymer Gels: Classification and Recent Developments in Biomedical Applications
by Mariana Chelu and Adina Magdalena Musuc
Gels 2023, 9(2), 161; https://doi.org/10.3390/gels9020161 - 17 Feb 2023
Cited by 38 | Viewed by 10149
Abstract
Polymer gels are a valuable class of polymeric materials that have recently attracted significant interest due to the exceptional properties such as versatility, soft-structure, flexibility and stimuli-responsive, biodegradability, and biocompatibility. Based on their properties, polymer gels can be used in a wide range [...] Read more.
Polymer gels are a valuable class of polymeric materials that have recently attracted significant interest due to the exceptional properties such as versatility, soft-structure, flexibility and stimuli-responsive, biodegradability, and biocompatibility. Based on their properties, polymer gels can be used in a wide range of applications: food industry, agriculture, biomedical, and biosensors. The utilization of polymer gels in different medical and industrial applications requires a better understanding of the formation process, the factors which affect the gel’s stability, and the structure-rheological properties relationship. The present review aims to give an overview of the polymer gels, the classification of polymer gels’ materials to highlight their important features, and the recent development in biomedical applications. Several perspectives on future advancement of polymer hydrogel are offered. Full article
(This article belongs to the Section Gel Analysis and Characterization)
Show Figures

Figure 1

Figure 1
<p>Type of materials used for synthesis of hydrogel based on their origin [<a href="#B15-gels-09-00161" class="html-bibr">15</a>].</p>
Full article ">Figure 2
<p>Classification of polymer gels.</p>
Full article ">Figure 3
<p>(<b>a</b>) Representation of various categories of hydrogels. (<b>b</b>) Preparation by cross-linking between polymer chains [<a href="#B63-gels-09-00161" class="html-bibr">63</a>].</p>
Full article ">Figure 4
<p>A graphical representation of polymer gels phase transition of representative hydrogels. (<b>a</b>) temperature responsive; (<b>b</b>) pH responsive; (<b>c</b>) tonic strength responsive [<a href="#B64-gels-09-00161" class="html-bibr">64</a>].</p>
Full article ">Figure 5
<p>Mechanism of pH-responsive hydrogel system [<a href="#B76-gels-09-00161" class="html-bibr">76</a>].</p>
Full article ">Figure 6
<p>Schematic representation of structure-effect relationship of polymer gels.</p>
Full article ">Figure 7
<p>Schematic representation of the formation of a hybrid hydrogel [<a href="#B81-gels-09-00161" class="html-bibr">81</a>].</p>
Full article ">Figure 8
<p>Schematic representation of biomedical applications of polymer gels [<a href="#B92-gels-09-00161" class="html-bibr">92</a>].</p>
Full article ">Figure 9
<p>Stages of wound healing process [<a href="#B124-gels-09-00161" class="html-bibr">124</a>].</p>
Full article ">Figure 10
<p>The schematic representation of simultaneous formation of the magnetic gel containing Ni nanoparticles [<a href="#B133-gels-09-00161" class="html-bibr">133</a>].</p>
Full article ">Figure 11
<p>Images of the synthesized material (<b>a</b>) PVA gel; (<b>b</b>) PVA/Ni magnetic gel; (<b>c</b>) Ni-nanoparticles (NPs) in the magnetic field; (<b>d</b>) PVA/Ni magnetic gel in the magnetic field [<a href="#B133-gels-09-00161" class="html-bibr">133</a>].</p>
Full article ">Figure 12
<p>The mechanism of DNA-PEG hydrogels detection assay [<a href="#B165-gels-09-00161" class="html-bibr">165</a>].</p>
Full article ">
24 pages, 5498 KiB  
Article
Origin of the Springback Effect in Ambient-Pressure-Dried Silica Aerogels: The Effect of Surface Silylation
by Fabian Zemke, Julien Gonthier, Ernesto Scoppola, Ulla Simon, Maged F. Bekheet, Wolfgang Wagermaier and Aleksander Gurlo
Gels 2023, 9(2), 160; https://doi.org/10.3390/gels9020160 - 16 Feb 2023
Cited by 8 | Viewed by 2443
Abstract
Ambient pressure drying (APD) can prospectively reduce the costs of aerogel fabrication and processing. APD relies solely on preventing shrinkage or making it reversible. The latter, i.e., the aerogel re-expansion after drying (so-called springback effect—SBE), needs to be controlled for reproducible aerogel fabrication [...] Read more.
Ambient pressure drying (APD) can prospectively reduce the costs of aerogel fabrication and processing. APD relies solely on preventing shrinkage or making it reversible. The latter, i.e., the aerogel re-expansion after drying (so-called springback effect—SBE), needs to be controlled for reproducible aerogel fabrication by APD. This can be achieved by an appropriate surface functionalization of aerogel materials (e.g., SiO2). This work addresses the fabrication of monolithic SiO2 aerogels and xerogels by APD. The effect of several silylation agents, i.e., trimethylchlorosilane, triethylchlorosilane, and hexamethyldisilazane on the SBE is studied in detail, applying several complementary experimental techniques, allowing the evaluation of the macroscopic and microscopic morphology as well as the composition of SiO2 aerogels. Here, we show that some physical properties, e.g., the bulk density, the macroscopic structure, and pore sizes/volumes, were significantly affected by the re-expansion. However, silylation did not necessarily lead to full re-expansion. Therefore, similarities in the molecular composition could not be equated to similarities in the SBE. The influences of steric hindrance and reactivity are discussed. The impact of silylation is crucial in tailoring the SBE and, as a result, the APD of monolithic aerogels. Full article
(This article belongs to the Special Issue Recent Advances in Aerogels)
Show Figures

Figure 1

Figure 1
<p>Proposed mechanisms of the silica gel network for (<b>I</b>) hydrophobization by trimethylchlorosilane, (<b>II</b>) triethylchlorosilane, and (<b>III</b>) hexamethyldisilazane. The silanol end groups react with the respective silylation agents, while splitting off either hydrochloric acid or ammonia.</p>
Full article ">Figure 2
<p>ATR-FTIR spectra were collected on the unmodified UN (blue), hexamethyldisilazane-modified HM (orange), triethylchlorosilane-modified TE (green), and trimethylchlorosilane-modified TM samples (pink) after APD. The modified samples showed typical bands for silylation.</p>
Full article ">Figure 3
<p>(<b>A</b>) <sup>29</sup>Si, (<b>B</b>) <sup>13</sup>C, and (<b>C</b>) <sup>1</sup>H NMR spectra of the unmodified UN (blue), hexamethyldisilazane-modified HM (orange), triethylchlorosilane-modified TE (green), and trimethylchlorosilane-modified TM samples (pink). A vertical shift was used for better visibility and a grey dotted baseline is shown.</p>
Full article ">Figure 4
<p>TGA measurements coupled with MS for the (<b>A</b>) unmodified UN (blue), (<b>B</b>) hexamethyldisilazane-modified HM (orange), (<b>C</b>) triethylchlorosilane-modified TE (green), and (<b>D</b>) trimethylchlorosilane-modified TM samples (pink). The ion current of the MS measurement is shown for selected molecular weights of 18 <span class="html-italic">m</span>/<span class="html-italic">z</span> (solid), 15 <span class="html-italic">m</span>/<span class="html-italic">z</span> (dot), and 29 <span class="html-italic">m</span>/<span class="html-italic">z</span> (dash-dot). A vertical black line was drawn to highlight changes in the MS measurements.</p>
Full article ">Figure 5
<p>SEM images of the unmodified UN (top left), hexamethyldisilazane-modified HM (top right), triethylchlorosilane-modified TE (bottom left), and trimethylchlorosilane-modified TM samples (bottom right) after APD drying showed differences in their microscopic structure. While all displayed spherical particle morphologies, the size was bigger for the TM in comparison to the UN, the HM, and the TE samples. Additionally, inlets are shown with photographs of the respective monoliths, showing a decrease in size in the order of the TM, the TE, the HM, and the UN samples.</p>
Full article ">Figure 6
<p>The samples as they appear in the Dragonfly software after segmentation. From left to right, the unmodified UN, hexamethyldisilazane-modified HM, triethylchlorosilane-modified TE, and trimethylchlorosilane-modified TM samples are shown. One dataset from each surface modification batch was selected. Additionally, a scale bar was added for the TE sample for visualization.</p>
Full article ">Figure 7
<p>Evaluations of the unmodified UN (blue), hexamethyldisilazane-modified HM (orange), triethylchlorosilane-modified TE (green), and trimethylchlorosilane-modified TM (pink) samples for (<b>A</b>) the bulk density measured by µCT; (<b>B</b>) the skeletal density determined by helium pycnometry; (<b>C</b>) the porosity calculated from the measurements of the bulk and skeletal density shown with their respective errors. The measurements show decreasing bulk densities in the order of the UN, the HM, the TE, and the TM samples, indicating a strong influence of surface modification.</p>
Full article ">Figure 8
<p>Sketch of the influences of a surface modification on an unmodified sample (X1), via TMCS or HMDS (X2) or TECS (X3) on the overall molecular structure. Here, a chain with two silica atoms is shown with the calculated molecular masses, accessible areas, and Connolly volume inaccessible by a solvent with a radius of 0.5 Å. The grid of the 3D structures represents the volume inaccessible by this solvent. This illustration is a simplification and values should be considered with care.</p>
Full article ">Figure 9
<p>Results with a vertical shift of the unmodified UN (blue), hexamethyldisilazane-modified HM (orange), triethylchlorosilane-modified TE (green), and trimethylchlorosilane-modified TM (pink) samples of (<b>A</b>) nitrogen adsorption (Ads.) and desorption (Des.) isotherms, as well as their respective specific surface areas; (<b>B</b>) the NLDFT evaluations with equilibrium model and cylindrical pore geometry. The pore width diameter showed an overall decrease in the order of the TM, the TE, the HM, and the UN samples, while a noticeable change in isotherms was visible.</p>
Full article ">Figure 10
<p>The main differences in drying behavior, chemical composition, density, porosity and microstructure between the unmodified UN, hexamethyldisilazane-modified HM, triethylchlorosilane-modified TE, and trimethylchlorosilane-modified TM silica gels. The chemical formulas of HMDS, TECS, and TMCS are visualized underneath HM, TE, and TM, respectively. Each sample shows the macroscopic structure as captured by µCT and the microscopic structure by SEM, as well as measured information about the primary particles. The comparison of the measured parameters is displayed as an arrow for each sample. From left to right, the following information is shown: bulk density ρ<sub>b</sub> (light green), porosity P (green), skeletal density ρ<sub>s</sub> (blue), specific surface area SSA (pink), pore size D<sub>p</sub> (magenta), carbon and hydrogen elemental analysis (purple), detected FTIR groups (red), detected <sup>29</sup>Si (dark orange), <sup>13</sup>C (orange), and <sup>1</sup>H (yellow) NMR spectra, primary particle size by SAXS (brown), and main TGA weight loss (grey).</p>
Full article ">
13 pages, 4965 KiB  
Article
Synthesis and Characterization of Gamma Radiation Induced Diallyldimethylammonium Chloride-Acrylic Acid-(3-Acrylamidopropyl) Trimethylammonium Chloride Superabsorbent Hydrogel
by Md Murshed Bhuyan and Jae-Ho Jeong
Gels 2023, 9(2), 159; https://doi.org/10.3390/gels9020159 - 16 Feb 2023
Cited by 7 | Viewed by 1934
Abstract
The gamma radiation technique is simple and time-saving for the synthesis of pure hydrogels. The present work focuses on synthesizing and characterizing Diallyldimethylammonium Chloride-Acrylic acid-(3-Acrylamidopropyl) trimethylammonium Chloride (DADMAC-AAc-APTAC) superabsorbent hydrogels. The hydrogels were synthesized by applying gamma radiation of different doses (2 kGy [...] Read more.
The gamma radiation technique is simple and time-saving for the synthesis of pure hydrogels. The present work focuses on synthesizing and characterizing Diallyldimethylammonium Chloride-Acrylic acid-(3-Acrylamidopropyl) trimethylammonium Chloride (DADMAC-AAc-APTAC) superabsorbent hydrogels. The hydrogels were synthesized by applying gamma radiation of different doses (2 kGy to 30 kGy) to two different compositions of monomers. The equilibrium swelling was found to be 33483.48% of dried gel for a 1:0.5:1 composition ratio of monomers at a 2 kGy radiation dose. Therefore, on the basis of equilibrium swelling, 2 kGy is the optimum radiation dose for synthesizing the hydrogel. Fourier transform infrared (FTIR), nuclear magnetic resonance (NMR) spectroscopy, and X-ray diffraction (XRD) characterization techniques were used to analyze and confirm the structure of the hydrogel. Thermogravimetric analysis (TGA) and Scanning electron microscopy (SEM) equipped with energy dispersive spectroscopy (EDS) clearly showed the thermal stability and surface morphology of the gel. Therefore, it can be concluded that hydrogels can be used in metal adsorption, drug delivery, and other fields of study. Full article
Show Figures

Figure 1

Figure 1
<p>Effect of radiation dose on gel fraction of hydrogel.</p>
Full article ">Figure 2
<p>The effect of gamma radiation dose on equilibrium swelling of the hydrogel at room temperature.</p>
Full article ">Figure 3
<p>DADMAC-Aac-APTAC hydrogel before and after swelling.</p>
Full article ">Figure 4
<p>FTIR spectrum of DADMAC-AAc-APTAC hydrogel.</p>
Full article ">Figure 5
<p>XRD spectrum of DADMAC-AAc-APTAC hydrogel.</p>
Full article ">Figure 6
<p><sup>1</sup>H NMR of DADMAC-AAc-APTAC hydrogel.</p>
Full article ">Figure 7
<p>TGA graph of DADMAC-AAc-APTAC gel prepared by 2 kGy radiation dose.</p>
Full article ">Figure 8
<p>(<b>a</b>) SEM and (<b>b</b>) EDS of DADMAC-AAc-APTAC hydrogel.</p>
Full article ">Figure 8 Cont.
<p>(<b>a</b>) SEM and (<b>b</b>) EDS of DADMAC-AAc-APTAC hydrogel.</p>
Full article ">Scheme 1
<p>Probable polymerization of DADMAC-AAc-APTAC hydrogel.</p>
Full article ">
13 pages, 3833 KiB  
Article
Enhanced Rupture Force in a Cut-Dispersed Double-Network Hydrogel
by Shilei Zhu, Dongdong Yan, Lin Chen, Yan Wang, Fengbo Zhu, Yanan Ye, Yong Zheng, Wenwen Yu and Qiang Zheng
Gels 2023, 9(2), 158; https://doi.org/10.3390/gels9020158 - 16 Feb 2023
Cited by 1 | Viewed by 1749
Abstract
The Kirigami approach is an effective way to realize controllable deformation of intelligent materials via introducing cuts into bulk materials. For materials ranging from ordinary stiff materials such as glass, ceramics, and metals to soft materials, including ordinary hydrogels and elastomers, all of [...] Read more.
The Kirigami approach is an effective way to realize controllable deformation of intelligent materials via introducing cuts into bulk materials. For materials ranging from ordinary stiff materials such as glass, ceramics, and metals to soft materials, including ordinary hydrogels and elastomers, all of them are all sensitive to the presence of cuts, which usually act as defects to deteriorate mechanical properties. Herein, we study the influence of the cuts on the mechanical properties by introducing “dispersed macro-scale cuts” into a model tough double network (DN) hydrogel (named D-cut gel), which consists of a rigid and brittle first network and a ductile stretchable second network. For comparison, DN gels with “continuous cuts” having the same number of interconnected cuts (named C-cut gel) were chosen. The fracture tests of D-cut gel and C-cut gel with different cut patterns were performed. The fracture observation revealed that crack blunting occurred at each cut tip, and a large wrinkle-like zone was formed where the wrinkles were parallel to the propagation direction of the cut. By utilizing homemade circular polarizing optical systems, we found that introducing dispersed cuts increases the rupture force by homogenizing the stress around the crack tip surrounding every cut, which reduces stress concentration in one certain cut. We believe this work reveals the fracture mechanism of tough soft materials with a kirigami cut structure, which should guide the design of advanced soft and tough materials along this line. Full article
(This article belongs to the Special Issue Properties and Structure of Hydrogel-Related Materials)
Show Figures

Graphical abstract

Graphical abstract
Full article ">Figure 1
<p>Scheme of the structural models with dispersed cuts and continuous cuts patterns for fracture experiments. (<b>a</b>) Scheme of the structural model containing an array of dispersed cuts investigated in this work. The length scale <span class="html-italic">h</span><sub>1</sub> is defined as the horizontal size of the triangle-shaped cuts, while <span class="html-italic">h</span><sub>2</sub> represents the horizontal spacing between adjacent cuts. In this work, the <span class="html-italic">h</span><sub>1</sub> is kept constant at 1.5 mm for simplicity. (<b>b</b>) The structural models with dispersed cuts at different spacing ratios <span class="html-italic">h</span><sub>1</sub>:<span class="html-italic">h</span><sub>2</sub> (1:0.5, 1:1, 1:2, 1:3, and 1:4) and their counterpart structural models with the same number of aligned continuous cuts. The pure shear model was used as the reference.</p>
Full article ">Figure 2
<p>Representative force curves of highly deformable DN hydrogels under different structural models with dispersed cuts (D-cut gels) and continuous cuts (C-cut gels). The representative force (<span class="html-italic">F</span>)–displacement (<span class="html-italic">x</span>) curves of DN hydrogels under different structural models containing dispersed cuts and continuous cuts at different spacing ratios <span class="html-italic">h</span><sub>1</sub>:<span class="html-italic">h</span><sub>2</sub> of 1:0.5 (<b>a</b>), 1:1 (<b>b</b>), 1:2 (<b>c</b>), 1:3 (<b>d</b>), and 1:4 (<b>e</b>). The force curves of samples with a pure shear geometry were also provided in (<b>a</b>,<b>c</b>,<b>e</b>) for comparison.</p>
Full article ">Figure 3
<p>Effect of spacing ratios <span class="html-italic">h</span><sub>1</sub>:<span class="html-italic">h</span><sub>2</sub> and dispersed/continuous cuts on the mechanical behaviors of DN hydrogel samples in fracture experiments. (<b>a</b>) Summarized force (<span class="html-italic">F</span>)–displacement (<span class="html-italic">x</span>) curves of DN hydrogels. (<b>b</b>) Rupture force (<span class="html-italic">F</span><sub>rupture</sub>), (<b>c</b>) critical stretch ratio at rupture point (<span class="html-italic">λ</span><sub>rupture</sub>), and (<b>d</b>) critical bulk stress at rupture point (<span class="html-italic">σ</span><sub>r,bulk</sub>) for DN hydrogel samples containing dispersed cuts (D-cut gels) and continuous cuts (C-cut gels) at different spacing ratios <span class="html-italic">h</span><sub>1</sub>:<span class="html-italic">h</span><sub>2</sub> (1:0.5, 1:1, 1:2, 1:3, and 1:4).</p>
Full article ">Figure 4
<p>The rupture force ratio (<span class="html-italic">F</span><sub>dis</sub>/<span class="html-italic">F</span><sub>con</sub>) and normalized rupture stretch ratio (<span class="html-italic">λ</span><sub>dis</sub>/<span class="html-italic">λ</span><sub>con</sub>) as functions of spacing ratios <span class="html-italic">h</span><sub>1</sub>:<span class="html-italic">h</span><sub>2</sub>. The <span class="html-italic">F</span><sub>dis</sub> and <span class="html-italic">F</span><sub>con</sub> represent the rupture forces in fracture specimens containing dispersed cuts and continuous cuts, respectively. The <span class="html-italic">λ</span><sub>dis</sub> and <span class="html-italic">λ</span><sub>con</sub> denote the rupture stretch ratios in fracture experiments containing dispersed cuts (D-cut gels) and continuous cuts (C-cut gels), respectively.</p>
Full article ">Figure 5
<p>Birefringence observation during fracture of D-cut and C-cut gels at spacing ratio <span class="html-italic">h</span><sub>1</sub>:<span class="html-italic">h</span><sub>2</sub> of 1:0.5. (<b>a</b>,<b>b</b>) The representative snapshots of crack evolution in DN hydrogel samples under different structural models containing dispersed cuts ((<b>a</b>) D-cut gel) and continuous cuts ((<b>b</b>) C-cut gel) at spacing ratio <span class="html-italic">h</span><sub>1</sub>:<span class="html-italic">h</span><sub>2</sub> of 1:0.5.</p>
Full article ">Figure 6
<p>Birefringence observation during fracture of D-cut and C-cut gels at spacing ratio <span class="html-italic">h</span><sub>1</sub>:<span class="html-italic">h</span><sub>2</sub> of 1:2. (<b>a</b>,<b>b</b>) The representative snapshots of crack evolution in DN hydrogel samples under different structural models containing dispersed cuts ((<b>a</b>) D-cut gel) and continuous cuts ((<b>b</b>) C-cut gel) at spacing ratio <span class="html-italic">h</span><sub>1</sub>:<span class="html-italic">h</span><sub>2</sub> of 1:2.</p>
Full article ">Figure 7
<p>Birefringence observation during fracture of D-cut and C-cut gels at spacing ratio <span class="html-italic">h</span><sub>1</sub>:<span class="html-italic">h</span><sub>2</sub> of 1:4. (<b>a</b>,<b>b</b>) The representative snapshots of crack evolution in DN hydrogel samples under different structural models containing dispersed cuts ((<b>a</b>) D-cut gel) and continuous cuts ((<b>b</b>) C-cut gel) at spacing ratio <span class="html-italic">h</span><sub>1</sub>:<span class="html-italic">h</span><sub>2</sub> of 1:4.</p>
Full article ">Figure 8
<p>The normalized stress concentration ratio (the ratio between tensile yielding stress and critical bulk stress, <span class="html-italic">σ</span><sub>y,tens</sub><span class="html-italic">/σ</span><sub>r,bulk</sub>) as functions of spacing ratios <span class="html-italic">h</span><sub>1</sub>:<span class="html-italic">h</span><sub>2</sub>.</p>
Full article ">Figure 9
<p>The crack tip structure of DN hydrogels was observed by optical microscopy. (<b>a</b>,<b>b</b>) The representative crack tip structure in DN hydrogel samples before and after loading to a stretch ratio λ of 2 under different structural models containing dispersed cuts (<b>a</b>) and continuous cuts (<b>b</b>) at spacing ratio <span class="html-italic">h</span><sub>1</sub>:<span class="html-italic">h</span><sub>2</sub> of 1:2. Wrinkles-like damaged structure can be observed ahead of the crack tip, corresponding to the damage zone observed by birefringence.</p>
Full article ">
14 pages, 1927 KiB  
Article
Detection of Gel-Forming Polymers via Calcium Crosslinking, Applied to the Screening of Extracellular Polymeric Substances Extracted from Biological Aggregates
by Abdo Bou-Sarkis, Etienne Paul, Elisabeth Girbal-Neuhauser, Nicolas Derlon and Yolaine Bessiere
Gels 2023, 9(2), 157; https://doi.org/10.3390/gels9020157 - 16 Feb 2023
Cited by 2 | Viewed by 2120
Abstract
The valorization of biological aggregates through the extraction of hydrogel-forming polymers can enhance the economics and sustainability of various processes in which bacteria are involved in organic waste transformation, such as wastewater treatment. Achieving these goals requires the development of a method capable [...] Read more.
The valorization of biological aggregates through the extraction of hydrogel-forming polymers can enhance the economics and sustainability of various processes in which bacteria are involved in organic waste transformation, such as wastewater treatment. Achieving these goals requires the development of a method capable of detecting the presence of gel-forming polymers in complex mixtures containing biopolymers that are most often unknown and uncharacterized. A miniaturized screening method capable of detecting gelation via ionic crosslinking using only 1 to 3 mg of the tested samples (commercial molecules or extracellular polymeric substances, EPSs) is proposed. The method consists of calculating a percentage of reactivity (%R) through UV-vis spectra and determining the percentage of gel volume (%Vg) formed after the addition of calcium. Both factors were combined to give a gelling factor (GF), and the test was applied to pure commercial molecules (BSA, DNA, alginate (ALV), and a mixture of them), allowing the classification of the following solutions according to their gel-forming capacity: GF(ALV) > GF(ALV+DNA) > GF(BSA+ALV+DNA) > GF(BSA+ALV) > GF(DNA) > GF(BSA+DNA) > GF(BSA). As a relevant tool for screening hydrogel-forming solutions, the method was applied to the EPS extracted from aerobic granular sludge. The EPS (0.5% w/v) had a GF of 0.16 ± 0.03, equivalent to approximately half of the GF of ALV (0.38 ± 0.02 at 0.5% w/v). The developed test pushes the limits of the existing gel-detection techniques because it allows for quicker, less consuming, and more informative gelation detection through the use of simple methods that do not require sophisticated equipment. Full article
(This article belongs to the Special Issue Preparation, Properties and Applications of Functional Hydrogels)
Show Figures

Graphical abstract

Graphical abstract
Full article ">Figure 1
<p>Effect of calcium concentration using UV-vis spectroscopy for ALV at 1.5% (<span class="html-italic">w</span>/<span class="html-italic">v</span>). For each calcium concentration, the spectrum shown is the average of three supernatant spectra obtained after gelation and includes the correction by the volume of supernatant/initial total volume (Vs/Vt).</p>
Full article ">Figure 2
<p>Effect of the polymer concentration (% <span class="html-italic">w</span>/<span class="html-italic">v</span>) of pure standard molecules on the %R, %Vg, and GF. The results are obtained through three gelation replicates and the standard deviations were represented as bars.</p>
Full article ">Figure 3
<p>SEM observation of gels made of ALV (<b>A</b>), and DNA (<b>B</b>) at 1.5% (<span class="html-italic">w</span>/<span class="html-italic">v</span>) and 0.1 M Calcium.</p>
Full article ">Figure 4
<p>The %R, %Vg, and GF of the mixtures of the standard molecules, calibrated at 0.5% (<span class="html-italic">w</span>/<span class="html-italic">v</span>) for each molecule with 0.1 M calcium. The results are obtained through three gelation replicates and the standard deviations were represented as bars.</p>
Full article ">Figure 5
<p>Classification of solutions according to their GF, %R, and %Vg.</p>
Full article ">Figure 6
<p>Comparison of the efficiency of the extraction protocol for the selection of gelling molecules using the developed method. The %R, %Vg, and GF are used to detect the capacity of solutions at 0.5% (<span class="html-italic">w</span>/<span class="html-italic">v</span>) and 0.1 M calcium to form gels. The results are obtained through three gelation replicates and the standard deviations were represented as bars.</p>
Full article ">Figure 7
<p>The GI of different solutions at 0.5% (<span class="html-italic">w</span>/<span class="html-italic">v</span>) with 0.1 M calcium, allowing for a comparison of their gelling capacities (between each other and to a reference molecule ALV).</p>
Full article ">
18 pages, 4815 KiB  
Article
Preparation and Performance Evaluation of a Self-Crosslinking Emulsion-Type Fracturing Fluid for Quasi-Dry CO2 Fracturing
by Jiani Hu, Meilong Fu, Minxuan Li, Yan Zheng, Guojun Li and Baofeng Hou
Gels 2023, 9(2), 156; https://doi.org/10.3390/gels9020156 - 15 Feb 2023
Cited by 2 | Viewed by 1886
Abstract
Quasi-dry CO2 fracturing technology is a new CO2 fracturing technology that combines liquid CO2 fracturing (dry CO2 fracturing) and water-based fracturing. It uses a liquid CO2 system containing a small amount of water-based fracturing fluid to carry sand, [...] Read more.
Quasi-dry CO2 fracturing technology is a new CO2 fracturing technology that combines liquid CO2 fracturing (dry CO2 fracturing) and water-based fracturing. It uses a liquid CO2 system containing a small amount of water-based fracturing fluid to carry sand, and it is characterized by sand blending at normal pressure, convenient preparation, the integrated application of resistance reduction and sand carrying, and no dedicated closed sand blender requirement. We developed a self-crosslinking emulsion-type water-based fracturing fluid (ZJL-1), which contained ionic bonds, hydrogen bonds, van der Waals forces, and hydrophobic associations, for quasi-dry CO2 fracturing, and the comprehensive properties of the ZJL-1 fracturing fluid were evaluated. The results showed that the ZJL-1 fracturing fluid had obvious viscoelastic characteristics, a heat loss rate of less than 10% at 200 °C, a good thermal stability, sufficient rheology under high temperature and high shear conditions, and a good thermal stability. The resistance reduction rate reached 70%, which demonstrates a good resistance reduction performance. Compared with conventional guar fracturing fluid, ZJL-1 can carry more sand and has a lower core damage rate. The on-site use of quasi-dry fracturing showed that optimizing the mixing ratio of liquid CO2 fracturing fluid and ZJL-1 fracturing fluid effectively enhanced oil and gas recovery. This can be used to optimize quasi-dry fracturing and can be used as a reference. Full article
(This article belongs to the Special Issue Recent Advances in Polymeric Gel for Geo-Energy Recovery)
Show Figures

Figure 1

Figure 1
<p>Molecular structure of AMPS.</p>
Full article ">Figure 2
<p>Molecular structure of the self-crosslinking emulsion thickener.</p>
Full article ">Figure 3
<p>Test device for measuring frictional drag in high-temperature and high-pressure fluid circulation loops. 1—Fluid pressure pump; 2—high pressure container; 3—flow meter; 4—injection pump; 5—thickener storage tank; 6—flow meter; 7—injection pump; 8—blending tank; 9—pipe heater; 10—mass flow meter; 11—pressurizing pump; 12—inlet pressure sensor; 13—pipe viewport; 14—test pipes with diameters of 6 mm, l0 mm, and 14 mm, respectively; 15—outlet pressure sensor; 16—separator; 17—temperature and pressure regulators.</p>
Full article ">Figure 4
<p>Core damage test system. 1—Temperature and pressure control system; 2—temperature sensor; 3—pressure transducer; 4—magnetic sensor; 5—oil; 6—formation water; 7—constant-flux pump; 8—confining pressure; 9—backpressure valve; 10—core gripper; 11—volumetric cylinder; 12—electrical machine; 13—container.</p>
Full article ">Figure 5
<p>FTIR spectra of AMPS and ZJL-1.</p>
Full article ">Figure 6
<p>SEM images of ZJL-1. (<b>A</b>). 200 Um; (<b>B</b>). 100 um; (<b>C</b>). 50 um; (<b>D</b>). 20 um.</p>
Full article ">Figure 6 Cont.
<p>SEM images of ZJL-1. (<b>A</b>). 200 Um; (<b>B</b>). 100 um; (<b>C</b>). 50 um; (<b>D</b>). 20 um.</p>
Full article ">Figure 7
<p>Associations in the ZJL-1.</p>
Full article ">Figure 8
<p>Thermogravimetric curves for different concentrations of ZJL-1.</p>
Full article ">Figure 9
<p>Viscoelasticities at different thickener concentrations.</p>
Full article ">Figure 10
<p>Shear resistance tests of the ZJL-1 fracturing fluid.</p>
Full article ">Figure 11
<p>Plots of drag reduction efficiency versus displacement.</p>
Full article ">Figure 12
<p>Relationships between the ZJL-1 fracturing fluid concentration and sedimentation rate and viscosity.</p>
Full article ">Figure 13
<p>Relationships between the concentration of conventional guar fracturing fluid and the sedimentation rate and viscosity.</p>
Full article ">Figure 14
<p>Fracturing construction parameters and construction curves.</p>
Full article ">
15 pages, 6223 KiB  
Article
Enhancing Conductivity and Self-Healing Properties of PVA/GEL/OSA Composite Hydrogels by GO/SWNTs for Electronic Skin
by Xiaohu Chen, Haonan Zhang, Jiashu Cui, Yanen Wang, Mingyang Li, Juan Zhang, Changgeng Wang, Zhisheng Liu and Qinghua Wei
Gels 2023, 9(2), 155; https://doi.org/10.3390/gels9020155 - 15 Feb 2023
Cited by 5 | Viewed by 2272
Abstract
The use of flexible, self-healing conductive hydrogels as a type of typical electronic skin with the function of transmitting sensory signals has attracted wide attention in the field of biomaterials. In this study, composite hydrogels based on polyvinyl alcohol (PVA), gelatin (GEL), oxidized [...] Read more.
The use of flexible, self-healing conductive hydrogels as a type of typical electronic skin with the function of transmitting sensory signals has attracted wide attention in the field of biomaterials. In this study, composite hydrogels based on polyvinyl alcohol (PVA), gelatin (GEL), oxidized sodium alginate (OSA), graphene oxide (GO), and single-walled carbon nanotubes (SWNTs) were successfully prepared. The hydrogen and imine bonding of the composite hydrogels gives them excellent self-healing properties. Their self-healing properties restore 68% of their breaking strength and over 95% of their electrical conductivity. The addition of GO and SWNTs enables the PGO-GS hydrogels to achieve a compressive modulus and conductivity of 42.2 kPa and 29.6 mS/m, which is 8.2 times and 1.5 times that of pure PGO, respectively. Furthermore, the PGO-GS hydrogels can produce profound feedback signals in response to deformation caused by external forces and human movements such as finger flexion and speech. In addition, the PGO-GS hydrogels exhibit superior biocompatibility compared to PGO. All of these results indicate that the PGO-GS hydrogels have great potential with respect to future applications in the field of electronic skin. Full article
Show Figures

Figure 1

Figure 1
<p>The SEM images of (<b>a</b>) PGO hydrogel, (<b>b</b>) PGO-GS1 hydrogel, (<b>c</b>) PGO-GS3 hydrogel, and (<b>d</b>) PGO-GS5 hydrogel.</p>
Full article ">Figure 2
<p>The FTIR spectrum of (<b>a</b>) SA and OSA; (<b>b</b>) GEL, PVA, and OSA; (<b>c</b>) PGO and PGO-GS hydrogels. (<b>d</b>) The XRD patterns of PGO and PGO-GS hydrogels.</p>
Full article ">Figure 3
<p>(<b>a</b>) The compression stress–strain curves of PGO and PGO-GS hydrogels. (<b>b</b>) The compressive modulus of PGO and PGO-GS hydrogels.</p>
Full article ">Figure 4
<p>(<b>a</b>) The brightness of LED when hydrogel was connected to the circuit. (<b>b</b>) The conductivity and resistance of hydrogels. (<b>c</b>) The brightness of the LED when bending the hydrogel. (The applied voltage of all displayed circuits is 10 V.)</p>
Full article ">Figure 5
<p>(<b>a</b>) Photos of the self-healing process of hydrogels. (<b>b</b>) The tensile curves of the initial hydrogel and the 48 h self-healing hydrogel (PGO-GS3). (<b>c</b>) Conductivity of initial hydrogel and the 48 h self-healing process of the hydrogel (PGO-GS3). (<b>d</b>) The self-healing process of the PGO hydrogel under optical microscope.</p>
Full article ">Figure 6
<p>Sensing signals of encapsulated hydrogel corresponding to (<b>a</b>) finger bending, (<b>b</b>) the vocalization of the word “Nice”, (<b>c</b>) the vocalization of the word “LOVE,” and (<b>d</b>) the vocalization of the word “China”.</p>
Full article ">Figure 7
<p>(<b>a</b>) Preparation process of OSA. (<b>b</b>) Mass fraction of each component solution of composite hydrogel. (<b>c</b>) Preparatory process for PGO-GS hydrogel.</p>
Full article ">
16 pages, 2772 KiB  
Article
Amino-Functionalized Cellulose Nanofiber/Lignosulfonate New Aerogel Adsorbent for the Removal of Dyes and Heavy Metals from Wastewater
by Islam Elsayed, Gregory T. Schueneman, Emad M. El-Giar and El Barbary Hassan
Gels 2023, 9(2), 154; https://doi.org/10.3390/gels9020154 - 14 Feb 2023
Cited by 21 | Viewed by 3205
Abstract
Due to the increasingly widespread water pollutants and the high cost of treatment methods, there is a demand for new, inexpensive, renewable, and biodegradable adsorbent materials for the purification of wastewater contaminants. In this study, a new biocomposite aerogel (Amf-CNF/LS) was prepared using [...] Read more.
Due to the increasingly widespread water pollutants and the high cost of treatment methods, there is a demand for new, inexpensive, renewable, and biodegradable adsorbent materials for the purification of wastewater contaminants. In this study, a new biocomposite aerogel (Amf-CNF/LS) was prepared using a chemically cross-linking method between the amino-functionalized cellulose nanofibers (Amf-CNF) and lignosulfonates (LS). The physical and chemical properties of the prepared aerogel were investigated using several techniques including elemental analysis, scanning electron microscopy (SEM-EDS), Fourier transform infrared spectroscopy (FTIR), thermal gravimetric analysis (TGA), and N2 adsorption-desorption analysis. The Amf-CNF/LS aerogel was then applied for the removal of methylene blue (MB), rhodamine B dye (RhB), and the heavy metal cadmium ion (Cd2+) from synthetic wastewater solutions. The adsorption parameters controlling the adsorption process including the pH, contact time, adsorbent dosage, and adsorbate concen-tration were optimized. High adsorption kinetics and isotherms were observed, with the adsorption isotherms of the Amf-CNF/LS aerogel fitting the Langmuir model with maximum adsorption capacities of 170.94, 147.28, and 129.87 mg/g for MB, RhB, and Cd2+, respectively. These results show that Amf-CNF/LS aerogel is a promising green and inexpensive adsorbent for MB, RhB, and Cd2+ removal from wastewater. Full article
(This article belongs to the Special Issue Recent Advances in Aerogel-Based Composites)
Show Figures

Figure 1

Figure 1
<p>(<b>a</b>) Point of zero charge (PZC) determination curve of Amf-CNF/LS, (<b>b</b>–<b>d</b>) speciation curves at different pH values for MB, RhB, and Cd<sup>2+</sup> adsorptions, respectively.</p>
Full article ">Figure 2
<p>(<b>a</b>) FTIR spectra of Amf-CNF and Amf-CNF/LS aerogels. (<b>b</b>) Nitrogen adsorption-desorption isotherms at −196 °C and BJH average pore size distribution of the Amf-CNF/LS aerogel.</p>
Full article ">Figure 3
<p>(<b>a</b>,<b>b</b>) SEM images of the amino-modified cellulose nanofibers (Amf-CNF) and (Amf-CNF/LS) aerogels, (<b>c</b>) The metal content curve of Amf-CNF/LS aerogel. (<b>d</b>–<b>h</b>) SEM-EDS images.</p>
Full article ">Figure 4
<p>(<b>a</b>,<b>b</b>) The adsorption results with non-linear and linear fittings of the pseudo-first order kinetic model, respectively. (<b>c</b>,<b>d</b>) The adsorption results with non-linear and linear fittings of the pseudo-second order kinetic model, respectively.</p>
Full article ">Figure 5
<p>(<b>a</b>,<b>b</b>) The experimental adsorption results with non-linear and linear fittings of the Langmuir isotherm model. (<b>c</b>,<b>d</b>) The experimental adsorption results with non-linear and linear fittings of the Freundlich isotherm model.</p>
Full article ">Figure 6
<p>Illustration of the possible adsorption mechanism between the Amf-CNF/LS aerogel and MB, RhB, and Cd<sup>2+</sup> adsorbates.</p>
Full article ">Figure 7
<p>The chemical structures of (<b>a</b>) methylene blue and (<b>b</b>) rhodamine B.</p>
Full article ">Scheme 1
<p>The proposed mechanism for the Amf-CNF/LS aerogel formation.</p>
Full article ">
41 pages, 6482 KiB  
Review
Nanocomposite Hydrogels as Functional Extracellular Matrices
by Stijn Jooken, Olivier Deschaume and Carmen Bartic
Gels 2023, 9(2), 153; https://doi.org/10.3390/gels9020153 - 13 Feb 2023
Cited by 7 | Viewed by 2657
Abstract
Over recent years, nano-engineered materials have become an important component of artificial extracellular matrices. On one hand, these materials enable static enhancement of the bulk properties of cell scaffolds, for instance, they can alter mechanical properties or electrical conductivity, in order to better [...] Read more.
Over recent years, nano-engineered materials have become an important component of artificial extracellular matrices. On one hand, these materials enable static enhancement of the bulk properties of cell scaffolds, for instance, they can alter mechanical properties or electrical conductivity, in order to better mimic the in vivo cell environment. Yet, many nanomaterials also exhibit dynamic, remotely tunable optical, electrical, magnetic, or acoustic properties, and therefore, can be used to non-invasively deliver localized, dynamic stimuli to cells cultured in artificial ECMs in three dimensions. Vice versa, the same, functional nanomaterials, can also report changing environmental conditions—whether or not, as a result of a dynamically applied stimulus—and as such provide means for wireless, long-term monitoring of the cell status inside the culture. In this review article, we present an overview of the technological advances regarding the incorporation of functional nanomaterials in artificial extracellular matrices, highlighting both passive and dynamically tunable nano-engineered components. Full article
(This article belongs to the Section Gel Chemistry and Physics)
Show Figures

Figure 1

Figure 1
<p>Material toolbox available for mimicking the cell microenvironment. Parts of this figure are adapted with permission from Ref. [<a href="#B6-gels-09-00153" class="html-bibr">6</a>]. Copyright 2017 American Chemical Society.</p>
Full article ">Figure 2
<p>Directional cell growth on magnetically aligned nanocomposite hydrogels. (<b>A</b>) Fluorescence image of human mesenchymal stem cells on top of GelMA containing 1. non-oriented IONPs (scalebar 400 µm) 2. oriented IONP filaments (scalebar 400 µm) 3. oriented IONP filaments (scalebar 100 µm). (<b>B</b>) Fluorescence images of D API (blue) and phalloidin (green) stained C2C12 differentiated cells with (+HS) and without (−HS) horse serum, cultured on top of GelMA (G), GelMA with non-oriented IONPs (G/RIOPs), and GelMA with oriented IONP filaments (G/AIOPs) (scale bar 20 µm). (<b>C</b>) Fluorescence image of DRG (red, Alexa fluor 633) cultured in a fibrin hydrogel with 3 vol% of IONP-PLGA microgels (green, fluorescein) both randomly oriented and aligned (scale bar 200 µm). (<b>D</b>) Distribution of neurite orientation starting at the white full circle. The edge of the DRG body is marked by the white dotted circle. Panels (<b>A</b>,<b>B</b>) are reprinted with permission from Ref. [<a href="#B103-gels-09-00153" class="html-bibr">103</a>]. Copyright 2019 Wiley. Panels (<b>C</b>,<b>D</b>) are reprinted with permission from Ref. [<a href="#B106-gels-09-00153" class="html-bibr">106</a>]. Copyright 2017 American Chemical Society.</p>
Full article ">Figure 3
<p>(<b>A</b>) Cardiac phenotypes on CNT-, GO-, and rGO-GelMA nanocomposite scaffolds. Fluorescence microscopy image of cardiomyocyte culture, labeled for sarcomeric α-actinin (green), Cx-43 (red), and nuclei (blue). (<b>B</b>) Schematic representation of important functional proteins during cardiomyocyte maturation. (<b>C</b>) Relative intensity of vinculin, z-line length of sarcomeric α-actinin, connexin-43, and Tropinin I after 5 days of culture as determined from microscopy images as shown in panel (<b>A</b>) (* <span class="html-italic">p</span> &lt; 0.05, ** <span class="html-italic">p</span> &lt; 0.005, *** <span class="html-italic">p</span> &lt; 0.005). (<b>D</b>) Schematic illustration of stem cell culture of mouse embryoid bodies (EBs) in GelMA containing 0.5 mg/mL random or aligned CNTs with electrical stimulation (ES) of 1 Hz, 3V and the percentage of beating EBs on pristine GelMA and CNT-GelMA in the presence (+ES) and absence (−ES) of electrical stimulation after cardiac differentiation. (* <span class="html-italic">p</span> &lt; 0.05) <b>E</b>) Fluorescence confocal microscopy image showing F-actin (green) and nucleus (blue) staining of cardiomyocytes cultured within GelMA and GelMA-GNR hydrogels for 7 days. The inset shows the Fourier transform, indicating local alignment of the F-actin fibers (indicated with white arrows). Scale bar 50 µm. (<b>F</b>) The alignment distribution for the nuclei from panel (<b>D</b>), indicating no global alignment of the nuclei within the (GNR-)GelMA scaffolds. (<b>G</b>) Synchronized beat rates from day 3 to day 5 for the various GNR-GelMA scaffolds shown in panel (<b>D</b>). (* <span class="html-italic">p</span> &lt; 0.05) Panels (<b>A</b>–<b>C</b>) reprinted with permission from Ref. [<a href="#B133-gels-09-00153" class="html-bibr">133</a>]. Copyright 2019 American Chemical Society. Panel (<b>D</b>) reprinted with permission from Ref. [<a href="#B82-gels-09-00153" class="html-bibr">82</a>]. Copyright 2016 Elsevier. Panels (<b>E</b>–<b>G</b>) reprinted with permission from Ref. [<a href="#B137-gels-09-00153" class="html-bibr">137</a>]. Copyright 2016 Elsevier.</p>
Full article ">Figure 4
<p>Opto-electric cell stimulation using QDs. (<b>A</b>) Schematic illustration of the interaction of a quantum dot with the cell membrane. (<b>B</b>) The voltage response of a current-clamped cortical neuron cultured on a CdSe QD film. (<b>C</b>) The current response of a voltage-clamped cortical neuron on a CdSe QD film. The figure is reprinted with permission from Ref. [<a href="#B187-gels-09-00153" class="html-bibr">187</a>]. Copyright 2012 Optical Society of America.</p>
Full article ">Figure 5
<p>GNP-based optomechanical hydrogel actuation. (<b>A</b>) Illustration of a 3D GNR-PEG nanocomposite hydrogel for cell mechanical actuation and (<b>B</b>) an encapsulated SH-SY5Y cell ‘beating’ in response to 1 Hz NIR laser stimulation. (<b>C</b>) Illustration of the operating principle of PNIPMAM-encapsulated GNRs and (<b>D</b>) TEM-image of the NPs (Scale bar 1 μm, inset scale bar 200 nm), the hydrodynamic diameter as a function of temperature as measured by dynamic light scattering and the UV-vis-NIR absorbance spectrum at 25 °C and 55 °C with n red the NIR wavelength used for remote actuation. (<b>E</b>) GNR heating deforms a PNIPAM matrix exerting stress on the cell, cultured on top. The flexible nanowires embedded in the hydrogel translate the deformation into a force. (<b>F</b>) Epifluorescence images of the cells (1, 3) and brightfield images of the underlying microstructures (2, 4). The laser is focused at the center of the dashed circle that outlines the area where the hydrogel is contracted. Images (1, 2) indicate the start of the experiment, while (3, 4) are the same cells 3 s after 18 mW laser illumination. The locations of two microstructures at both timepoints are marked by the yellow dashed lines, and the elongation from 9 µm (2) to 13 µm (4) is indicated by the yellow arrows. Scale bars are 10 µm. Panels (<b>A</b>,<b>B</b>) are reprinted with permission from Ref. [<a href="#B211-gels-09-00153" class="html-bibr">211</a>]. Copyright 2022 Wiley. Panels (<b>C</b>,<b>D</b>) are reprinted with permission from Ref. [<a href="#B210-gels-09-00153" class="html-bibr">210</a>]. Copyright 2020 American Chemical Society. Panels (<b>E</b>,<b>F)</b> are reprinted with permission from Ref. [<a href="#B207-gels-09-00153" class="html-bibr">207</a>].</p>
Full article ">Figure 6
<p>Electrochemical monitoring in 3D scaffolds. (<b>A</b>) Schematic representation of a 3D planar electrode impedance sensor for bulk monitoring of cell proliferation in 3D systems and (<b>B</b>) normalized cell growth curves as measured by 2D electric cell-substrate impedance sensing (ECIS) and 3D electric cell/matrigel-substrate impedance sensing (ECMIS) of 2D and 3D cultures of HpeG2 cells on top/within, treated with different 10 µL of the anti-cancer drugs Cisplatin, Taxol and Sorafenib. The cell index (CI) value represents normalized impedance change. The (fluorescence) microscopy images display cell morphology and live/dead staining of the different conditions in 3D ECMIS after 96 h. (<b>C</b>) Schematic representation of a PCP/Pt 3D electrochemical scaffold. (<b>D</b>) Picture of the PCP/Pt scaffold in cell culture. (<b>E</b>) Amplitude of the amperometric response of the PCP/Pt scaffold (vs. Ag/AgCl) upon the addition of 2 µL DSF-CuCl2 and NMS873 to MCF-7 (red trace), Hela (blue trace) and HUVEC (black trace) cells cultured for 5h on the electrochemical scaffold. (<b>F</b>) Transient amperometric response of the cells to 2 µL of the anti-cancer drugs DSF-CuCl2 and NMS873 corresponding to the data in panel (<b>E</b>). Panels (<b>A</b>,<b>B</b>) are reprinted with permission from Ref. [<a href="#B254-gels-09-00153" class="html-bibr">254</a>]. Copyright 2019 Elsevier. Panels (<b>C</b>–<b>F</b>) are reprinted with permission from Ref. [<a href="#B257-gels-09-00153" class="html-bibr">257</a>]. Copyright 2019 American Chemical Society.</p>
Full article ">
37 pages, 17529 KiB  
Article
Phosphonation of Alginate–Polyethyleneimine Beads for the Enhanced Removal of Cs(I) and Sr(II) from Aqueous Solutions
by Khalid A. M. Salih, Kanggen Zhou, Mohammed F. Hamza, Hamed Mira, Yuezhou Wei, Shunyan Ning, Eric Guibal and Waheed M. Salem
Gels 2023, 9(2), 152; https://doi.org/10.3390/gels9020152 - 11 Feb 2023
Cited by 5 | Viewed by 2470
Abstract
Although Cs(I) and Sr(II) are not strategic and hazardous metal ions, their recovery from aqueous solutions is of great concern for the nuclear industry. The objective of this work consists of designing a new sorbent for the simultaneous recovery of these metals with [...] Read more.
Although Cs(I) and Sr(II) are not strategic and hazardous metal ions, their recovery from aqueous solutions is of great concern for the nuclear industry. The objective of this work consists of designing a new sorbent for the simultaneous recovery of these metals with selectivity against other metals. The strategy is based on the functionalization of algal/polyethyleneimine hydrogel beads by phosphonation. The materials are characterized by textural, thermo-degradation, FTIR, elemental, titration, and SEM-EDX analyses to confirm the chemical modification. To evaluate the validity of this modification, the sorption of Cs(I) and Sr(II) is compared with pristine support under different operating conditions: the pH effect, kinetics, and isotherms are investigated in mono-component and binary solutions, before investigating the selectivity (against competitor metals) and the possibility to reuse the sorbent. The functionalized sorbent shows a preference for Sr(II), enhanced sorption capacities, a higher stability at recycling, and greater selectivity against alkali, alkaline-earth, and heavy metal ions. Finally, the sorption properties are compared for Cs(I) and Sr(II) removal in a complex solution (seawater sample). The combination of these results confirms the superiority of phosphonated sorbent over pristine support with promising performances to be further evaluated with effluents containing radionuclides. Full article
(This article belongs to the Special Issue Innovative Biopolymer-Based Hydrogels)
Show Figures

Figure 1

Figure 1
<p>FTIR spectra of ALG-PEI (<b>a</b>) and APO-PEI (<b>b</b>) sorbents at different stages of use: pristine material, after conditioning at pH 7 (the pH of metal sorption, referenced as “sorbent + Soln.”), after Cs(I) or Sr(II) sorption, after five cycles of sorption/desorption; wavenumber range: 1800–400 cm<sup>−1</sup>.</p>
Full article ">Figure 2
<p>Effect of pH on Cs(I) and Sr(II) sorption using ALG-PEI and APO-PEI sorbents (C<sub>0</sub>: 0.802 mmol Cs L<sup>−1</sup> or 2.128 mmol Sr L<sup>−1</sup>; sorbent dose, SD: 0.67 g L<sup>−1</sup>; v: 210 rpm; time: 48 h; T: 21 ± 1 °C).</p>
Full article ">Figure 3
<p>Uptake kinetics for Cs(I) and Sr(II) sorption using ALG-PEI and APO-PEI sorbents (C<sub>0</sub>: 0.760 mmol Cs L<sup>−1</sup> or 1.188 mmol Sr L<sup>−1</sup>; sorbent dose, SD: 0.67 g L<sup>−1</sup>; v: 210 rpm; pH<sub>0</sub>: 7; T: 21 ± 1 °C).</p>
Full article ">Figure 4
<p>Sorption isotherms for Cs(I) (<b>a</b>) and Sr(II) (<b>b</b>) using ALG-PEI and APO-PEI sorbents: modeling with Sips equation (pH<sub>0</sub>: 7; C<sub>0</sub>: 0.08–6.11 mmol Cs L<sup>−1</sup> or 0.12–9.32 mmol Sr L<sup>−1</sup>; SD: 0.67 g L<sup>−1</sup>; v: 210 rpm; time: 48 h; t: 21 ±1 °C).</p>
Full article ">Figure 5
<p>Metal sorption from multicomponent solutions using ALG-PEI (<b>a</b>,<b>c</b>) and APO-PEI (<b>b</b>,<b>d</b>) sorbents: effect of pH<sub>eq</sub> on SC<sub>Cs/metal</sub> (<b>a</b>,<b>c</b>) and SC<sub>Sr/metal</sub> (<b>b</b>,<b>d</b>) (C<sub>0</sub>, mmol L<sup>−1</sup>: 0.883 Na(I), 0.530 Ca(II), 1.020 Mg(II), 0.881 Fe(III), 0.875 Al(III), 1.088 Cs(I), and 0.959 Sr(II); time: 24 h; v: 210 rpm; T: 21 ± 1 °C; SC<sub>Cs/Cs</sub> and SC<sub>Sr/Sr</sub> are mentioned as internal standard = 1).</p>
Full article ">Figure 6
<p>Concentration factor (C = q<sub>eq</sub>/C<sub>0</sub>, L g<sup>−1</sup>) (<b>a</b>) and distribution ratio (D = q<sub>eq</sub>/C<sub>eq</sub>, L g<sup>−1</sup>) (<b>b</b>) for selected elements for the treatment of the seawater sample using ALG-PEI and APO-PEI sorbents (for initial concentrations, see <a href="#gels-09-00152-t0A8" class="html-table">Table A8</a>; SD: 0.2 g L<sup>−1</sup>; pH<sub>0</sub>: 7.59; pH<sub>eq</sub>: 7.51; time: 24 h; v: 210 rpm; T: 21 ± 1 °C; individual numbers represent the enhancement factor associated with the functionalization of ALG-PEI sorbent).</p>
Full article ">Scheme 1
<p>Prospective binding mechanisms for Cs(I) and Sr(II) sorption onto ALG-PEI and APO-PEI sorbents.</p>
Full article ">Scheme 2
<p>Synthesis procedures for the preparation of ALG-PEI and APO-PEI sorbents.</p>
Full article ">Figure A1
<p>SEM photos for shape and size evaluation of sorbent particles.</p>
Full article ">Figure A2
<p>Textural analysis of APO-PEI sorbents: (<b>a</b>) N<sub>2</sub> sorption and desorption isotherms (BET method) and (<b>b</b>) pore size distribution (BJH method).</p>
Full article ">Figure A3
<p>Characterization of thermal degradation of ALG-PEI (<b>a</b>,<b>c</b>) and APO-PEI sorbents (<b>b</b>,<b>d</b>): TGA curves (weight loss, (<b>a</b>,<b>b</b>)) and DTG curves (<b>c</b>,<b>d</b>).</p>
Full article ">Figure A3 Cont.
<p>Characterization of thermal degradation of ALG-PEI (<b>a</b>,<b>c</b>) and APO-PEI sorbents (<b>b</b>,<b>d</b>): TGA curves (weight loss, (<b>a</b>,<b>b</b>)) and DTG curves (<b>c</b>,<b>d</b>).</p>
Full article ">Figure A4
<p>SEM observation (<b>left</b> panels) and semi-quantitative EDX analysis (<b>right</b> panels) of ALG-PEI (<b>a</b>) and APO-PEI (<b>b</b>).</p>
Full article ">Figure A5
<p>SEM observation (<b>left</b> panels) and semi-quantitative EDX analysis (<b>right</b> panels) of ALG-PEI after Sr(II) sorption (<b>a</b>) and Cs(I) sorption (<b>b</b>), and of APO-PEI after Sr(II) sorption (<b>c</b>) and Cs(I) sorption (<b>d</b>).</p>
Full article ">Figure A6
<p>SEM-EDX analysis of cross-sections of ALG-PEI sorbent before and after Cs(I) and Sr(II) sorption.</p>
Full article ">Figure A7
<p>SEM-EDX analysis of cross-sections of APO-PEI sorbent before and after Cs(I) and Sr(II) sorption.</p>
Full article ">Figure A8
<p>Determination of pH<sub>PZC</sub> values of ALG-PEI and APO-PEI sorbents (pH-drift method; background salt solution: 0.1 M NaCl; sorbent dose, SD: 2 g L<sup>−1</sup>; time: 48 h; agitation, v: 210 rpm; T: 21 ± 1 °C).</p>
Full article ">Figure A9
<p>Speciation diagrams of Cs(I) (<b>a</b>) and Sr(II) (<b>b</b>) (under the experimental conditions selected for the study of pH effect, calculations using Visual MINTEQ software [<a href="#B76-gels-09-00152" class="html-bibr">76</a>]).</p>
Full article ">Figure A10
<p>Effect of pH on Cs(I) and Sr(II) sorption: (<b>a</b>) log<sub>10</sub> D vs. pH<sub>eq</sub> plot and (<b>b</b>) pH variation during metal sorption for ALG-PEI and APO-PEI sorbents (C<sub>0</sub>: 0.802 mmol Cs L<sup>−1</sup> or 2.128 mmol Sr L<sup>−1</sup>; sorbent dose, SD: 0.67 g L<sup>−1</sup>; v: 210 rpm; time: 48 h; T: 21 ± 1 °C).</p>
Full article ">Figure A11
<p>Effect of the pH on the selectivity coefficient (SC<sub>Cs/Sr</sub>) using ALG-PEI and APO-PEI sorbents (binary solutions: 0.754 mmol Cs L<sup>−1</sup> and 1.227 mmol Sr L<sup>−1</sup>; SD: 0.67 g L<sup>−1</sup>; v: 210 rpm; time: 48 h; T: 21 ± 1 °C).</p>
Full article ">Figure A12
<p>Uptake kinetics for Cs(I) and Sr(II) sorption using APO-PEI sorbents from binary solution (C<sub>0</sub>: 0.751 mmol Cs L<sup>−1</sup> and 1.148 mmol Sr L<sup>−1</sup>; sorbent dose, SD: 0.67 g L<sup>−1</sup>; v: 210 rpm; pH<sub>0</sub>: 7; T: 21 ± 1 °C).</p>
Full article ">Figure A13
<p>Sorption isotherms for Cs(I) (<b>a</b>) and Sr(II) (<b>b</b>) using ALG-PEI and APO-PEI sorbents: modeling with the Langmuir equation (pH<sub>0</sub>: 7; C<sub>0</sub>: 0.08–6.11 mmol Cs L<sup>−1</sup> or 0.12–9.32 mmol Sr L<sup>−1</sup>; SD: 0.67 g L<sup>−1</sup>; v: 210 rpm; time: 48 h; t: 21 ± 1 °C).</p>
Full article ">Figure A14
<p>Modeling of Cs(I) and Sr(II) sorption isotherms (onto APO-PEI beads) using the Langmuir dual site model (LDS) (for experimental conditions, see <a href="#gels-09-00152-f0A12" class="html-fig">Figure A12</a>).</p>
Full article ">Figure A15
<p>Cs(I) and Sr(II) sorption isotherms from binary solutions using ALG-PEI (<b>a</b>) and APO-PEI (<b>b</b>) sorbents (compared with isotherms from mono-component solutions—C<sub>0</sub>: 0.07–6.11 mmol Cs L<sup>−1</sup> and 0.11–9.23 mmol Sr L<sup>−1</sup>, with Sr/Cs molar ratio ≈1.5; pH<sub>0</sub>: 7; SD: 0.67 g L<sup>−1</sup>; v: 210 rpm; T: 21 ± 1 °C).</p>
Full article ">Figure A16
<p>Metal sorption from multicomponent solutions using ALG-PEI (<b>a</b>) and APO-PEI (<b>b</b>) sorbents: effect of pH<sub>eq</sub> on log<sub>10</sub>D vs. pH<sub>eq</sub> (C<sub>0</sub>, mmol L<sup>−1</sup>: 0.883 Na(I), 0.530 Ca(II), 1.020 Mg(II), 0.881 Fe(III), 0.875 Al(III), 1.088 Cs(I), and 0.959 Sr(II); time: 24 h; v: 210 rpm; T: 21 ± 1 °C).</p>
Full article ">Figure A17
<p>Sorption capacity (proportionality given by the size of the bubble) vs. the positioning of individual metals in the covalent index/ionic index space (data collected from [<a href="#B1-gels-09-00152" class="html-bibr">1</a>,<a href="#B63-gels-09-00152" class="html-bibr">63</a>,<a href="#B100-gels-09-00152" class="html-bibr">100</a>]).</p>
Full article ">Figure A18
<p>Cs(I) and Sr(II) desorption kinetics for ALG-PEI and APO-PEI sorbents: case of mono-component systems (metal-loaded samples collected at equilibrium from the relevant kinetics; SD: 2.67 g L<sup>−1</sup>; eluent: 0.2 M HNO<sub>3</sub>; v: 210 rpm; T: 21 ± 1 °C).</p>
Full article ">Figure A19
<p>Cs(I) and Sr(II) desorption kinetics for APO-PEI sorbent: case of binary systems (metal-loaded samples collected at equilibrium from the relevant kinetics; SD: 2.67 g L<sup>−1</sup>; eluent: 0.2 M HNO<sub>3</sub>; v: 210 rpm; T: 21 ± 1 °C).</p>
Full article ">Figure A20
<p>Location of sample collection (Beihai, China).</p>
Full article ">Figure A21
<p>Time evolution of sorption efficiency for major elements (<b>a</b>) and trace elements (<b>b</b>) using ALG-PEI (empty symbols) and APO-PEI (filled symbols) sorbents (initial concentrations see <a href="#gels-09-00152-t0A8" class="html-table">Table A8</a>; SD: 0.2 g L<sup>−1</sup>; pH<sub>0</sub>: 7.59; pH<sub>eq</sub>: 7.51; v: 210 rpm; T: 21 ± 1 °C).</p>
Full article ">Figure A22
<p>SEM observation (<b>left</b> panel) and semi-quantitative EDX analysis (<b>right</b> panels) of ALG-PEI (<b>a</b>) and APO-PEI (<b>b</b>) after the treatment of seawater.</p>
Full article ">
19 pages, 8417 KiB  
Article
Rheological Performance of High-Temperature-Resistant, Salt-Resistant Fracturing Fluid Gel Based on Organic-Zirconium-Crosslinked HPAM
by Hui Xin, Bo Fang, Luyao Yu, Yongjun Lu, Ke Xu and Kejing Li
Gels 2023, 9(2), 151; https://doi.org/10.3390/gels9020151 - 11 Feb 2023
Cited by 9 | Viewed by 2284
Abstract
Development of low-cost, high-temperature-resistant and salt-resistant fracturing fluids is a hot and difficult issue in reservoir fluids modification. In this study, an organic zirconium crosslinker that was synthesized and crosslinked with partially hydrolyzed polyacrylamide (HPAM) was employed as a cost-effective polymer thickener to [...] Read more.
Development of low-cost, high-temperature-resistant and salt-resistant fracturing fluids is a hot and difficult issue in reservoir fluids modification. In this study, an organic zirconium crosslinker that was synthesized and crosslinked with partially hydrolyzed polyacrylamide (HPAM) was employed as a cost-effective polymer thickener to synthesize a high-temperature-resistant and salt-resistant fracturing fluid. The rheological properties of HPAM in tap water solutions and 2 × 10⁴ mg/L salt solutions were analyzed. The results demonstrated that addition of salt reduced viscosity and viscoelasticity of HPAM solutions. Molecular dynamics (MD) simulation results indicated that, due to electrostatic interaction, the carboxylate ions of HPAM formed an ionic bridge with metal cations, curling the conformation, decreasing the radius of rotation and thus decreasing viscosity. However, optimizing fracturing fluids formulation can mitigate the detrimental effects of salt on HPAM. The rheological characteristics of the HPAM fracturing fluid crosslinking process were analyzed and a crosslinking rheological kinetic equation was established under small-amplitude oscillatory shear (SAOS) test. The results of a large-amplitude oscillation shear (LAOS) test indicate that the heating effect on crosslinking is stronger than the shear effect on crosslinking. High-temperature-resistant and shear-resistant experiments demonstrated good performance of fracturing fluids of tap water and salt solution at 200 °C and 180 °C. Full article
(This article belongs to the Special Issue Advanced Gels for Oil Recovery)
Show Figures

Graphical abstract

Graphical abstract
Full article ">Figure 1
<p>The apparent shear viscosity (<math display="inline"><semantics> <mi>η</mi> </semantics></math>) of HPAM in deionized (DI) water, tap water and 2 × 10<sup>4</sup> mg/L (1.5 × 10<sup>4</sup> mg/L NaCl and 0.5 × 10<sup>4</sup> mg/L CaCl<sub>2</sub>) salt solution at 30 °C and shear rate of 100 s<sup>−1</sup>.</p>
Full article ">Figure 2
<p>Viscosity (<math display="inline"><semantics> <mi>η</mi> </semantics></math>) as a function of shear rate (<math display="inline"><semantics> <mover accent="true"> <mi>γ</mi> <mo>˙</mo> </mover> </semantics></math> ) of 0.6 wt% HPAM in deionized (DI) water, tap water and 2 × 10<sup>4</sup> mg/L (1.5 × 10<sup>4</sup> mg/L NaCl and 0.5 × 10<sup>4</sup> mg/L CaCl<sub>2</sub>) salt solution at 30 °C. Solid lines represent the best fit for the Carreau model.</p>
Full article ">Figure 3
<p>The storage modulus (<math display="inline"><semantics> <mrow> <mi>G</mi> <msup> <mrow/> <mo>′</mo> </msup> </mrow> </semantics></math>) and loss modulus (<math display="inline"><semantics> <mrow> <mi>G</mi> <msup> <mrow/> <mo>″</mo> </msup> </mrow> </semantics></math>) of 0.6 wt% HPAM at different strains (<math display="inline"><semantics> <mi>γ</mi> </semantics></math>) in tap water and 2 × 10<sup>4</sup> mg/L (1.5 × 10<sup>4</sup> mg/L NaCl and 0.5 × 10<sup>4</sup> mg/L CaCl<sub>2</sub>) salt solution at 30 °C and <span class="html-italic">f</span> = 1 Hz.</p>
Full article ">Figure 4
<p>HPAM initial conformation. Cyan represents carbon atoms, red represents oxygen atoms and blue represents nitrogen atoms.</p>
Full article ">Figure 5
<p>The conformation of HPAM after 50 ns simulation in (<b>a</b>) water solution, (<b>b</b>) NaCl solution and (<b>c</b>) CaCl<sub>2</sub> solution at 300 K and 1 atm.Cyan represents carbon atoms, red represents oxygen atoms and blue represents nitrogen atoms.</p>
Full article ">Figure 6
<p>Radius of rotation of HPAM in different solutions (aqueous, NaCl solution and CaCl<sub>2</sub> solution).</p>
Full article ">Figure 7
<p>Number of salt bridges between O atom in -COO<sup>−</sup> group of HPAM and cation (Na<sup>+</sup> and Ca<sup>2+</sup>).</p>
Full article ">Figure 8
<p>Effect of pH control agent dosage on the storage modulus (<math display="inline"><semantics> <mrow> <mi>G</mi> <msup> <mrow/> <mo>′</mo> </msup> </mrow> </semantics></math>) and loss modulus (<math display="inline"><semantics> <mrow> <mi>G</mi> <msup> <mrow/> <mo>″</mo> </msup> </mrow> </semantics></math>) of the system (C<sub>(Zr crosslinker)</sub> = 1.5%) at 30 °C, <math display="inline"><semantics> <mrow> <mi>f</mi> <mo>=</mo> <mn>1</mn> </mrow> </semantics></math> Hz and <math display="inline"><semantics> <mi>γ</mi> </semantics></math> = 10%. (<b>a</b>) Tap water system. (<b>b</b>) Salt solution system.</p>
Full article ">Figure 9
<p>Effect of Zr crosslinker dosage on the storage modulus (<math display="inline"><semantics> <mrow> <mi>G</mi> <msup> <mrow/> <mo>′</mo> </msup> </mrow> </semantics></math>) and loss modulus (<math display="inline"><semantics> <mrow> <mi>G</mi> <msup> <mrow/> <mo>″</mo> </msup> </mrow> </semantics></math>) of the fracturing fluid gel (C<sub>(pH control agent)</sub> = 1.25%) at 30 °C, <math display="inline"><semantics> <mrow> <mi>f</mi> <mo>=</mo> <mn>1</mn> </mrow> </semantics></math> Hz and <math display="inline"><semantics> <mi>γ</mi> </semantics></math> = 10%. (<b>a</b>) Tap water system. (<b>b</b>) Salt solution system.</p>
Full article ">Figure 10
<p>(<b>a</b>,<b>b</b>) Digital photographs and schematic diagram and (<b>c</b>,<b>d</b>) microstructure images of the crosslinked HPAM fracturing fluid gel in tap water system and salt solution system.</p>
Full article ">Figure 11
<p>The relationship between the dynamic storage modulus (<math display="inline"><semantics> <mrow> <mi>G</mi> <msup> <mrow/> <mo>′</mo> </msup> </mrow> </semantics></math>) and time for various strains (1%, 10%, 30%, 50%) in (<b>a</b>) the tap water and (<b>b</b>) salt solution systems at 30 °C and <math display="inline"><semantics> <mrow> <mi>f</mi> <mo>=</mo> <mn>1</mn> </mrow> </semantics></math> Hz.</p>
Full article ">Figure 12
<p>Schematic diagram of effect of shear strain on the interaction of HPAM with organic zirconium crosslinker. Step1, zirconium ions (Zr<sup>4+</sup>) diffuse into HPAM polymer (The green arrow represents the diffusion trend of Zr<sup>4+</sup>). Step2, Zr<sup>4+</sup> form ligand bonds with carboxyl groups (-COO<sup>−</sup>) of HPAM under appropriate strain. Step3, the cross-linked structure was disrupted under large strain.</p>
Full article ">Figure 13
<p>The relationship between dynamic storage modulus (<math display="inline"><semantics> <mrow> <mi>G</mi> <msup> <mrow/> <mo>′</mo> </msup> </mrow> </semantics></math>) and time for various temperatures (30 °C, 50 °C, 70 °C) at 30 °C and <math display="inline"><semantics> <mrow> <mi>f</mi> <mo>=</mo> <mn>1</mn> </mrow> </semantics></math> Hz. in (<b>a</b>) the tap water system and (<b>b</b>) salt solution systems.</p>
Full article ">Figure 14
<p>(<b>a</b>) Nonlinear storage modulus <math display="inline"><semantics> <mrow> <msubsup> <mi>G</mi> <mn>1</mn> <msup> <mrow/> <mo>′</mo> </msup> </msubsup> </mrow> </semantics></math> and loss modulus <math display="inline"><semantics> <mrow> <msub> <mi>G</mi> <mn>1</mn> </msub> <msup> <mrow/> <mo>″</mo> </msup> </mrow> </semantics></math> and (<b>b</b>) Lissajous curve with time (t) and temperature (T) of hydraulic fracturing fluid system in tap water at <math display="inline"><semantics> <mi>γ</mi> </semantics></math> = 100%.</p>
Full article ">Figure 15
<p>(<b>a</b>) Nonlinear storage modulus <math display="inline"><semantics> <mrow> <msubsup> <mi>G</mi> <mn>1</mn> <msup> <mrow/> <mo>′</mo> </msup> </msubsup> </mrow> </semantics></math> and loss modulus <math display="inline"><semantics> <mrow> <msub> <mi>G</mi> <mn>1</mn> </msub> <msup> <mrow/> <mo>″</mo> </msup> </mrow> </semantics></math> and (<b>b</b>) Lissajous curve with time (t) and temperature (T) of hydraulic fracturing fluid system in salt solution at <math display="inline"><semantics> <mi>γ</mi> </semantics></math> = 100%.</p>
Full article ">Figure 16
<p>The maximum strain modulus (<math display="inline"><semantics> <mrow> <msubsup> <mi>G</mi> <mi>L</mi> <msup> <mrow/> <mo>′</mo> </msup> </msubsup> </mrow> </semantics></math>) and the minimum strain modulus (<math display="inline"><semantics> <mrow> <msubsup> <mi>G</mi> <mi>M</mi> <msup> <mrow/> <mo>′</mo> </msup> </msubsup> </mrow> </semantics></math>) as a function of temperature (T) and time (t). (<b>a</b>) Tap water system. (<b>b</b>) Salt solution system.</p>
Full article ">Figure 17
<p>High-temperature resistance and shear resistance curves of 0.6 wt% HPAM polymer fracturing fluid at 200 °C and 100 s<sup>−1</sup>.</p>
Full article ">Figure 18
<p>High-temperature resistance and shear resistance curves of 0.6 wt% HPAM polymer fracturing fluid with a salinity of 2 × 10<sup>4</sup> mg/L (1.5 × 10<sup>4</sup> mg/L NaCl and 0.5 × 10<sup>4</sup> mg/L CaCl<sub>2</sub>) at 180 °C and 100 s<sup>−1</sup>.</p>
Full article ">Figure 19
<p>The molecular structure of HPAM in aqueous solutions.</p>
Full article ">
17 pages, 1893 KiB  
Article
Organogel of Acai Oil in Cosmetics: Microstructure, Stability, Rheology and Mechanical Properties
by Suellen Christtine da Costa Sanches, Maria Inês Ré, José Otávio Carréra Silva-Júnior and Roseane Maria Ribeiro-Costa
Gels 2023, 9(2), 150; https://doi.org/10.3390/gels9020150 - 10 Feb 2023
Cited by 8 | Viewed by 2266
Abstract
Organogel (OG) is a semi-solid material composed of gelling molecules organized in the presence of an appropriate organic solvent, through physical or chemical interactions, in a continuous net. This investigation aimed at preparing and characterizing an organogel from acai oil with hyaluronic acid [...] Read more.
Organogel (OG) is a semi-solid material composed of gelling molecules organized in the presence of an appropriate organic solvent, through physical or chemical interactions, in a continuous net. This investigation aimed at preparing and characterizing an organogel from acai oil with hyaluronic acid (HA) structured by 12-hydroxystearic acid (12-HSA), aiming at topical anti-aging application. Organogels containing or not containing HA were analyzed by Fourier-transform Infrared Spectroscopy, polarized light optical microscopy, thermal analysis, texture analysis, rheology, HA quantification and oxidative stability. The organogel containing hyaluronic acid (OG + HA) has a spherulitic texture morphology with a net-like structure and absorption bands that evidenced the presence of HA in the three-dimensional net of organogel. The thermal analysis confirmed the gelation and the insertion of HA, as well as a good thermal stability, which is also confirmed by the study of oxidative stability carried out under different temperature conditions for 90 days. The texture and rheology studies indicated a viscoelastic behavior. HA quantification shows the efficiency of the HA cross-linking process in the three-dimensional net of organogel with 11.22 µg/mL for cross-linked HA. Thus, it is concluded that OG + HA shows potentially promising physicochemical characteristics for the development of a cosmetic system. Full article
Show Figures

Graphical abstract

Graphical abstract
Full article ">Figure 1
<p>FTIR spectrum of 12HSA, OG, AH, and OG + HA submitted to a resolution of 2 cm<sup>−1</sup> and a range of 4000 to 400 cm<sup>−1</sup>.</p>
Full article ">Figure 2
<p>Microphotographs of OG (<b>A</b>) and OG + HA (<b>B</b>). Magnification at 50×.</p>
Full article ">Figure 3
<p>TG (<b>A</b>) DTG (<b>B</b>) curve of HA, 12HT, OG and OG + HA in N<sub>2</sub> atmosphere (50 mL/min) and 10 °C/min heating, in a temperature range from 25 to 600 °C.</p>
Full article ">Figure 4
<p>Differential exploratory calorimetry curve of OG and OG + HA in N<sub>2</sub> atmosphere (50 mL/min) and 10 °C/min heating, over a temperature range from 25 to 550 °C.</p>
Full article ">Figure 5
<p>Strength over time in a double compression test of OG (<b>A</b>) and OG + HA (<b>B</b>).</p>
Full article ">Figure 6
<p>Apparent viscosity of OG and OG + HA.</p>
Full article ">Figure 7
<p>Complex module of OG (<b>A</b>) and OG + HA (<b>B</b>).</p>
Full article ">
11 pages, 1509 KiB  
Technical Note
Crosslinking of Bovine Gelatin Gels by Genipin Revisited Using Ferrule-Top Micro-Indentation
by Vincent Ball
Gels 2023, 9(2), 149; https://doi.org/10.3390/gels9020149 - 10 Feb 2023
Cited by 1 | Viewed by 1542
Abstract
(1) Background: Gelatin is widely used in food science, bioengineering, and as a sealant. However, for most of those applications, the mechanical properties of gelatin gels need to be improved by means of physical or chemical crosslinking. Among the used chemical agents, genipin [...] Read more.
(1) Background: Gelatin is widely used in food science, bioengineering, and as a sealant. However, for most of those applications, the mechanical properties of gelatin gels need to be improved by means of physical or chemical crosslinking. Among the used chemical agents, genipin allows low cytotoxicity in addition to improved Young’s modulus. However, the mechanical properties of gelatin–genipin gels have only been investigated at the macroscale, and there is no knowledge of the influence of the genipin concentration on the surface homogeneity of Young’s modulus. (2) Methods: To this aim, the influence of genipin concentration on Young’s modulus of gelatin gels was investigated by means of ferrule-top micro-indentation. The data were compared with storage moduli obtained by shear rheology data. (3) Results: Ferrule-top indentation measurements allowed us to show that Young’s moduli of gelatin–genipin gels increase up to a plateau value after approximately 12 mg/mL in genipin and 4 h of crosslinking. Young’s moduli distribute with high homogeneity over 80 µm × 80 µm surface areas and are consistent with the storage moduli obtained by shear rheology. (4) Conclusions: It has been shown that ferrule-top indentation data fitted with the Hertz model yield Young’s moduli of gelatin–genipin gels which are consistent with the storage moduli obtained by characterization at the macroscale using shear rheometry. In addition, Young’s moduli are homogenously distributed (with some irregularities at the highest genipin concentrations) and can be increased by two orders of magnitude with respect to the uncrosslinked gel. Full article
(This article belongs to the Special Issue Structured Gels: Mechanics, Responsivity and Applications)
Show Figures

Figure 1

Figure 1
<p>(<b>A</b>) Absorbance spectra of a gelatin–genipin 2 gel deposited on a quartz slide as a function of time as indicated in the inset. (<b>B</b>) Time evolution of the absorbance at 610 nm of the gelatin–genipin 2 gel deposited on a quartz slide.</p>
Full article ">Figure 2
<p>Prototypal indentation curve with the approach and retraction part of the cantilever on a gelatin-genipin 2 gel after 4 h of ageing. The red line corresponds to the fit of the Hertz model to the load-indentation curve during the approach phase. The red and blue arrows correspond to the approach and retraction regime, respectively.</p>
Full article ">Figure 3
<p>Time evolution of Young’s modulus of gelatin–genipin <span class="html-italic">x</span> gels with <span class="html-italic">x</span> = 0 (black disks, ●), <span class="html-italic">x</span> = 5 (red disks, <span style="color:red">●</span>) and <span class="html-italic">x</span> = 10 (blue disks, <span style="color:#1B13B3">●</span>) mg/mL. The data correspond to 25 individual measurements performed at different locations on the gel surface. The error bars correspond to ± one standard deviation.</p>
Full article ">Figure 4
<p>Maps (80 µm × 80 µm) of Young’s modulus of gelatin–genipin <span class="html-italic">x</span> gels as a function of increasing genipin concentrations (as indicated on the right vertical scale) after 4 h of gelation in the absence or the presence of genipin. Each vertex on those maps corresponds to a local determination of Young’s modulus.</p>
Full article ">Figure 5
<p>Frequency sweep experiment performed on gelatin–genipin 3 gel after 4 h of crosslinking.</p>
Full article ">Figure 6
<p>Evolution of the Young’s (◯) and storage moduli (●) of gelatin–genipin <span class="html-italic">x</span> gels after 4 h of reticulation in the presence of <span class="html-italic">x</span> mg/mL genipin in the gelling medium.</p>
Full article ">
11 pages, 1668 KiB  
Article
Stiffness-Modulation of Collagen Gels by Genipin-Crosslinking for Cell Culture
by Seiichiro Ishihara, Haruna Kurosawa and Hisashi Haga
Gels 2023, 9(2), 148; https://doi.org/10.3390/gels9020148 - 10 Feb 2023
Cited by 11 | Viewed by 3643
Abstract
The stiffness of extracellular matrices (ECMs) is critical for cellular functions. Therefore, modulating the stiffness of ECMs in vitro is necessary to investigate the role of stiffness in cellular phenomena. Collagen gels are widely used for cell culture matrices in vitro. However, modulation [...] Read more.
The stiffness of extracellular matrices (ECMs) is critical for cellular functions. Therefore, modulating the stiffness of ECMs in vitro is necessary to investigate the role of stiffness in cellular phenomena. Collagen gels are widely used for cell culture matrices in vitro. However, modulation of the stiffness in collagen gels for cell culture is challenging owing to the limited knowledge of the method to increase the stiffness while maintaining low cytotoxicity. Here, we established a novel method to modulate collagen gel stiffness from 0.0292 to 12.5 kPa with low cytotoxicity. We prepared collagens with genipin, a low-cytotoxic crosslinker of amines, at different concentrations and successfully modulated the stiffness of the gels. In addition, on 10 mM genipin-mixed collagen gels (approximately 12.5 kPa), H1299 human lung cancer cells showed spreading morphology and nuclear localization of yes-associated protein (YAP), typical phenomena of cells on stiff ECMs. Mouse mesenchymal stromal cells on 10 mM genipin-mixed collagen gels differentiated to vascular smooth muscle cells. On the other hand, the cells on 0 mM genipin-mixed collagen gels (approximately 0.0292 kPa) differentiated to visceral smooth muscle cells. Our new method provides a novel way to prepare stiffness-modulated collagen gels with low cytotoxicity in cell culture. Full article
Show Figures

Graphical abstract

Graphical abstract
Full article ">Figure 1
<p>(<b>A</b>) The schematic procedure of preparing genipin-mixed collagen gels for cell culture. HEPES: N-2-hydroxyethylpiperazine-N-2-ethane sulfonic acid, DMEM: Dulbecco’s modified Eagle’s medium, FBS: fetal bovine serum. (<b>B</b>) Young’s moduli of the 0, 0.01, 0.05, 0.1, 0.5, 1, or 10 mM genipin-mixed collagen gels. Mean ± S.D. <span class="html-italic">N</span> = 3 experiments.</p>
Full article ">Figure 2
<p>(<b>A</b>) Cell morphology of H1299 cells on the 0, 0.01, or 10 mM genipin-mixed collagen gels or collagen-coated glass substrates. Scale bar = 100 μm. (<b>B</b>) Cell area of H1299 cells shown in (<b>A</b>). Mean ± S.D. <span class="html-italic">N</span> = at least 23 cells in 3 independent experiments. <span class="html-italic">p</span> value was calculated using Welch’s <span class="html-italic">t</span>-test with Bonferroni correction.</p>
Full article ">Figure 3
<p>(<b>A</b>) Fluorescent staining of nuclei and YAP of H1299 cells on the 0, 0.01, or 10 mM genipin-mixed collagen gels or collagen-coated glass substrates. Scale bar = 50 μm. (<b>B</b>) YAP localization of H1299 cells shown in (<b>A</b>). Mean ± S.E. <span class="html-italic">N</span> = at least 84 cells in 4 independent experiments. <span class="html-italic">p</span> value was calculated using Welch’s <span class="html-italic">t</span>-test with Bonferroni correction.</p>
Full article ">Figure 4
<p>(<b>A</b>) Cell morphology of mouse mesenchymal stromal cells on the 0 or 10 mM genipin-mixed collagen gels or collagen-coated plastic substrates with smooth muscle-differentiation condition. Scale bar = 100 μm. (<b>B</b>) qPCR of ACTA2 and ACTG2 in (<b>A</b>). S18 was used as an internal control. Mean ± S.D. <span class="html-italic">N</span> = 3 independent experiments. * Statistical significance determined with 95% confidence interval with Bonferroni correction.</p>
Full article ">Figure 5
<p>(<b>A</b>) Cell morphology of mouse mesenchymal stromal cells on the 0 or 10 mM genipin-mixed collagen gels or collagen-coated plastic substrates with adipogenic condition. Scale bar = 100 μm. (<b>B</b>) qPCR of CEBPA and PPARG in (<b>A</b>). S18 was used as an internal control. Mean ± S.D. <span class="html-italic">N</span> = 3 independent experiments. * Statistical significance determined with 95% confidence interval with Bonferroni correction.</p>
Full article ">Figure 6
<p>Stiffness-modulation of genipin-mixed collagen gels with the indicated genipin concentrations. The reported stiffness of brain, lung, liver, and tumor is also shown [<a href="#B6-gels-09-00148" class="html-bibr">6</a>,<a href="#B9-gels-09-00148" class="html-bibr">9</a>].</p>
Full article ">
29 pages, 5462 KiB  
Article
Preparation, Characterization, and Evaluation of Cytotoxicity of Fast Dissolving Hydrogel Based Oral Thin Films Containing Pregabalin and Methylcobalamin
by Emrah Özakar, Rukiye Sevinç-Özakar and Bilal Yılmaz
Gels 2023, 9(2), 147; https://doi.org/10.3390/gels9020147 - 9 Feb 2023
Cited by 8 | Viewed by 4439
Abstract
The oral availability of many drugs is problematic due to the pH of the stomach, enzymes, and first-pass effects through the liver. However, especially geriatric, pediatric, bedridden, or mentally handicapped patients and those with dysphagia have difficulty swallowing or chewing solid dosage forms. [...] Read more.
The oral availability of many drugs is problematic due to the pH of the stomach, enzymes, and first-pass effects through the liver. However, especially geriatric, pediatric, bedridden, or mentally handicapped patients and those with dysphagia have difficulty swallowing or chewing solid dosage forms. Oral Thin Films (OTFs) are one of the new drug delivery systems that can solve these problems. Pregabalin (PG) and Methylcobalamin (MC), which are frequently preferred for pain originating in the central nervous system, were brought together for the first time using OTF technology in this study. In this study, a quantification method for PG and MC was developed and validated simultaneously. Optimum formulations were selected with organoleptic and morphological controls, moisture absorption capacity, swelling capacity, percent elongation, foldability, pH, weight variability, thickness, disintegration time, and transparency tests on OTFs prepared by the solvent pouring method. Content uniformity, dissolution rate, determination of release kinetics, SEM, XRD, FT-IR, DSC, long-term stability, and cytotoxicity studies on the tongue epithelial cell line (SCC-9) were performed on selected OTFs. As a result, OTFs containing PG-MC, which are non-toxic, highly flexible, transparent, compatible with intraoral pH, with fast disintegration time (<30 s), and acceptable in taste and appearance, have been developed successfully. Full article
(This article belongs to the Special Issue The Role of Mucus Gel Layer in Drug and Nutraceutical Delivery)
Show Figures

Graphical abstract

Graphical abstract
Full article ">Figure 1
<p>Chemical structure of PG (<b>a</b>) [<a href="#B16-gels-09-00147" class="html-bibr">16</a>,<a href="#B17-gels-09-00147" class="html-bibr">17</a>] and MC (<b>b</b>) [<a href="#B18-gels-09-00147" class="html-bibr">18</a>].</p>
Full article ">Figure 2
<p>Chromatogram of PG and MC.</p>
Full article ">Figure 3
<p>Blank OTFs (<b>left</b>), PG and MC included OTF (<b>right</b>).</p>
Full article ">Figure 4
<p>Elongation percentage experiment and images taken during the experiment.</p>
Full article ">Figure 5
<p>FT-IR spectra of PG, MC, and optimum formulations.</p>
Full article ">Figure 6
<p>XRD diagrams of PG, MC, and optimum formulations.</p>
Full article ">Figure 7
<p>DSC thermograms of pure drugs, optimum formulations, and physical mixtures (<b>a</b>) PG, (<b>b</b>) MC, (<b>c</b>) F5, (<b>d</b>) F8, (<b>e</b>) F13, and (<b>f</b>) physical mixture.</p>
Full article ">Figure 8
<p>SEM images of pure drugs and selected formulations (<b>a</b>) PG, (<b>b</b>) MC, (<b>c</b>) F5, (<b>d</b>) F8, and (<b>e</b>) F13.</p>
Full article ">Figure 9
<p>Cell viability test results of Blank, F5, F8, and F13. Negative control (NC) cells were grown to contain medium only. Positive control (PC) cells were treated with 10% DMSO. Statistical significance is shown as * (<span class="html-italic">p</span> &lt; 0.05) compared to the NC.</p>
Full article ">Figure 10
<p>Preparation of OTFs.</p>
Full article ">
30 pages, 3803 KiB  
Review
Applications of Hydrogels in Drug Delivery for Oral and Maxillofacial Diseases
by Lijia Liu, Dan Wu, Heng Tu, Mengjiao Cao, Mengxin Li, Li Peng and Jing Yang
Gels 2023, 9(2), 146; https://doi.org/10.3390/gels9020146 - 9 Feb 2023
Cited by 11 | Viewed by 4601
Abstract
Oral and maxillofacial diseases have an important impact on local function, facial appearance, and general health. As a multifunctional platform, hydrogels are widely used in the biomedical field due to their excellent physicochemical properties. In recent years, a large number of studies have [...] Read more.
Oral and maxillofacial diseases have an important impact on local function, facial appearance, and general health. As a multifunctional platform, hydrogels are widely used in the biomedical field due to their excellent physicochemical properties. In recent years, a large number of studies have been conducted to adapt hydrogels to the complex oral and maxillofacial environment by modulating their pore size, swelling, degradability, stimulus-response properties, etc. Meanwhile, many studies have attempted to use hydrogels as drug delivery carriers to load drugs, cytokines, and stem cells for antibacterial, anticancer, and tissue regeneration applications in oral and maxillofacial regions. This paper reviews the application and research progress of hydrogel-based drug delivery systems in the treatment of oral and maxillofacial diseases such as caries, endodontic diseases, periodontal diseases, maxillofacial bone diseases, mucosal diseases, oral cancer, etc. The characteristics and applications of hydrogels and drug-delivery systems employed for the treatment of different diseases are discussed in order to provide a reference for further research on hydrogel drug-delivery systems in the future. Full article
(This article belongs to the Special Issue Gels: Applications in Drug Delivery and Tissue Engineering)
Show Figures

Figure 1

Figure 1
<p>(<b>A</b>) physical and (<b>B</b>) chemical crosslinking techniques employed for gelatin hydrogel formation. Reprinted with permission from Ref. [<a href="#B10-gels-09-00146" class="html-bibr">10</a>] Copyright 2022 Elsevier.</p>
Full article ">Figure 2
<p>Applications of hydrogels in drug delivery for oral and maxillofacial diseases.</p>
Full article ">Figure 3
<p>Schematic diagram of fabrication of GelMA/PL/Laponite microspheres and its application for endodontic regeneration. (1) GelMA, Platelet Lysate, and Laponite formed a hydrogel precursor. (2) Hydrogel precursors mixed with hDPSCs to make microspheres. (3) Preparation of microspheres by electrostatic microdroplet method. (4) Microspheres were collected after centrifugation and observed under the microscope. (5) In vitro biological experiments including the viability, spreading, proliferation, and differentiation behaviors of hDPSCs encapsulated in the microspheres, as well as the effects of released PL-derived GFs on tube-formation of HUVECs and hDPSCs migration behavior were systematically carried out. (6) In vivo studies were done to further evaluate whether this hybrid microsphere system could facilitate angiogenesis and histogenesis when subcutaneously implanted in immune deficiency mouse model. Reprinted with permission from Ref. [<a href="#B40-gels-09-00146" class="html-bibr">40</a>] Copyright 2021 Elsevier.</p>
Full article ">Figure 4
<p>Schematic illustration of the preparation and application of the CS/β-GP/gelatin hydrogels. Reprinted with permission from Ref. [<a href="#B112-gels-09-00146" class="html-bibr">112</a>] Copyright 2019 Elsevier.</p>
Full article ">Figure 5
<p>Schematic Illustration of TC-PCM@GNC-PND as a Combined Platform for Hyperthermia and Antibiotics with an Obvious Synergistic Antibacterial Effect. Reprinted with permission from Ref. [<a href="#B61-gels-09-00146" class="html-bibr">61</a>] Copyright 2020 American Chemical Society.</p>
Full article ">Figure 6
<p>Schematic illustration of the preparation of (<b>A</b>) CM and (<b>B</b>) CA@CM/MD composite sponges, as well as the application for the prevention of dry sockets after tooth removal. The CM with the porous structure were prepared by combining ionotropic gelation with biomimetic mineralization. After Ca<sup>2+</sup> crosslinking, lyophilization, and electrostatic interaction, CA@CM/MD composite sponges were fabricated and shaped to the root-like shape for better suitability and applicability. Reprinted with permission from Ref. [<a href="#B132-gels-09-00146" class="html-bibr">132</a>] Copyright 2022 Elsevier.</p>
Full article ">Figure 7
<p>Scheme of mucoadhesive KPV@PPP_E hydrogel for chemotherapy-induced oral mucositis. Reprinted with permission from Ref. [<a href="#B58-gels-09-00146" class="html-bibr">58</a>] Copyright 2022 Royal Society of Chemistry.</p>
Full article ">Figure 8
<p>Schematic diagram of the in situ thermosensitive hydrogel containing GA micelles for improving anti-tumor immunity against OSCC. The GA micelle-encapsulated PLEL sol was locally injected into the tumor, formed hydrogel at the body temperature, and continually released GA in situ, thus exerting the chemotherapeutic effect and anti-tumor immune activation. The mice treated with GA-MIC-GEL showed increased cytotoxic T cells as well as reduced immunosuppressive cells at the tumor sites, suggesting the T cell activation and reversal of the tumor immune microenvironment. Besides, the systemic expression of PD-1 in GA-MIC-GEL treated mice also decreased. Reprinted with permission from Ref. [<a href="#B56-gels-09-00146" class="html-bibr">56</a>] Copyright 2022 Elsevier.</p>
Full article ">
19 pages, 5877 KiB  
Article
Metal-Coordinated Dynamics and Viscoelastic Properties of Double-Network Hydrogels
by Shilei Zhu, Yan Wang, Zhe Wang, Lin Chen, Fengbo Zhu, Yanan Ye, Yong Zheng, Wenwen Yu and Qiang Zheng
Gels 2023, 9(2), 145; https://doi.org/10.3390/gels9020145 - 9 Feb 2023
Cited by 2 | Viewed by 2025
Abstract
Biological soft tissues are intrinsically viscoelastic materials which play a significant role in affecting the activity of cells. As potential artificial alternatives, double-network (DN) gels, however, are pure elastic and mechanically time independent. The viscoelasticization of DN gels is an urgent challenge in [...] Read more.
Biological soft tissues are intrinsically viscoelastic materials which play a significant role in affecting the activity of cells. As potential artificial alternatives, double-network (DN) gels, however, are pure elastic and mechanically time independent. The viscoelasticization of DN gels is an urgent challenge in enabling DN gels to be used for advanced development of biomaterial applications. Herein, we demonstrate a simple approach to regulate the viscoelasticity of tough double-network (DN) hydrogels by forming sulfonate–metal coordination. Owing to the dynamic nature of the coordination bonds, the resultant hydrogels possess highly viscoelastic, mechanical time-dependent, and self-recovery properties. Rheological measurements are performed to investigate the linear dynamic mechanical behavior at small strains. The tensile tests and cyclic tensile tests are also systematically performed to evaluate the rate-dependent large deformation mechanical behaviors and energy dissipation behaviors of various ion-loaded DN hydrogels. It has been revealed based on the systematic analysis that robust strong sulfonate–Zr4+ coordination interactions not only serve as dynamic crosslinks imparting viscoelastic rate-dependent mechanical performances, but also strongly affect the relative strength of the first PAMPS network, thereby increasing the yielding stress σy and the fracture stress at break σb and reducing the stretch ratio at break λb. It is envisioned that the viscoelasticization of DN gels enables versatile applications in the biomedical and engineering fields. Full article
(This article belongs to the Special Issue Properties and Structure of Hydrogel-Related Materials)
Show Figures

Graphical abstract

Graphical abstract
Full article ">Figure 1
<p>Schematics of design and transformation of the virgin elastic DN hydrogels to viscoelastic materials via metal-coordination complex. As-prepared DN hydrogels in metal–ion solutions are denoted as “DN−M<sup>n+</sup>−C<sub>m</sub>−AP”, while the DN hydrogels equilibrated in water afterward are denoted as “DN−M<sup>n+</sup>−C<sub>m</sub>−E”, where the notations “AP” and “E” mean “as-prepared” and “equilibrated”, respectively, and C<sub>m</sub> (M) represents the metal–ion concentration in solution. The metal–ions used in this work are Na<sup>+</sup>, Fe<sup>3+,</sup> and Zr<sup>4+</sup>.</p>
Full article ">Figure 2
<p>Linear dynamic mechanical behavior of virgin DN, DN−Zr<sup>4+</sup>−0.1 M−AP and DN−Zr<sup>4+</sup>−0.1 M−E hydrogels. Frequency dependence of (<b>a</b>) storage moduli G′, (<b>b</b>) loss moduli G″ and (<b>c</b>) loss factor tan <span class="html-italic">δ</span> for virgin DN hydrogels. Frequency dependence of (<b>d</b>) storage moduli G′, (<b>e</b>) loss moduli G″ and (<b>f</b>) loss factor tan <span class="html-italic">δ</span> for DN−Zr<sup>4+</sup>−0.1 M−AP; frequency dependence of (<b>g</b>) storage moduli G′, (<b>h</b>) loss moduli G″ and (<b>i</b>) loss factor tan <span class="html-italic">δ</span> for DN−Zr<sup>4+</sup>−0.1 M−E hydrogels.</p>
Full article ">Figure 3
<p>Master curves of the storage modulus G′, loss modulus G″, and loss factor tanδ of DN−Zr<sup>4+</sup>−0.1 M−AP hydrogels (<b>a</b>) and DN−Zr<sup>4+</sup>−0.1 M−E hydrogels (<b>b</b>). The measurements were performed from 0.1 to 100 rad/s at a shear strain of 0.2%, at different temperatures from 8 °C to 88 °C with an interval temperature of 8 °C, and the results were obtained by performing classical time–temperature superposition shifts at a reference temperature of at 24 °C, deduced from the data in <a href="#gels-09-00145-f002" class="html-fig">Figure 2</a> using horizontal shift factor a<sub>T</sub> and without vertical shift. Arrhenius plot depicting the temperature dependence of the shift factors a<sub>T</sub> used for generating master curves of DN−Zr<sup>4+</sup>−0.1 M−AP hydrogels (<b>c</b>) and DN−Zr<sup>4+</sup>−0.1 M−E hydrogels (<b>d</b>). The apparent activation energy values were calculated from the slope of the curves.</p>
Full article ">Figure 4
<p>Tensile behaviors and cyclic tensile behaviors for various DN hydrogels with Zr<sup>4+</sup> as metal ions for the metal coordination complex. (<b>a</b>) Rate-independent elastic tensile behaviors of the virgin DN hydrogels under different deformation rates ranging from 10 to 1000 mm/min. (<b>b</b>) Rate-dependent viscoelastic tensile behaviors of the DN−Zr<sup>4+</sup>−0.1 M−AP hydrogels under different deformation rates ranging from 10 to 1000 mm/min. (<b>c</b>) Rate-dependent viscoelastic tensile behaviors of the DN−Zr<sup>4+</sup>−0.1 M−E hydrogels under different deformation rates ranging from 10 to 1000 mm/min. (<b>d</b>–<b>f</b>) Sequential loading–unloading cycles for the virgin DN gels (<b>d</b>), DN−Zr<sup>4+</sup>−0.1 M−AP hydrogels (<b>e</b>), and DN−Zr<sup>4+</sup>−0.1 M−E hydrogels (<b>f</b>) at a deformation rate of 100 mm/min. The virgin DN hydrogels show completely irreversible hysteresis, while the rate-dependent viscoelastic DN−Zr<sup>4+</sup>−0.1 M−AP hydrogels and DN−Zr<sup>4+</sup>−0.1 M−E hydrogels show partially reversible hysteresis. The total mechanical hysteresis W<sub>total</sub> (<b>g</b>), the reversible mechanical hysteresis W<sub>re</sub> (<b>h</b>), and the recovery ratio W<sub>re</sub>/W<sub>total</sub> (<b>i</b>) as functions of tensile strain for various DN hydrogels.</p>
Full article ">Figure 5
<p>Tensile behaviors and cyclic tensile behaviors for various DN hydrogels with Na<sup>+</sup> as metal ions. (<b>a</b>,<b>b</b>) Rate-independent tensile behaviors of the DN−Na<sup>+</sup>−1.0 M−AP (<b>a</b>) and DN−Na<sup>+</sup>−1.0 M−E (<b>b</b>) hydrogels under different deformation rates ranging from 10 to 1000 mm/min. (<b>c</b>,<b>d</b>) Sequential loading–unloading cycles for the DN−Na<sup>+</sup>−1.0 M−AP hydrogels (<b>c</b>) and DN−Na<sup>+</sup>−1.0 M−E hydrogels (<b>d</b>) at a deformation rate of 100 mm/min. The rate-independent elastic DN−Na<sup>+</sup>−1.0 M−AP and DN−Na<sup>+</sup>−1.0 M−E hydrogels show completely irreversible hysteresis.</p>
Full article ">Figure 6
<p>Tensile behaviors and cyclic tensile behaviors for various DN hydrogels coordinated with Fe<sup>3+</sup> ions. (<b>a</b>,<b>b</b>) Rate-independent tensile behaviors of the DN−Fe<sup>3+</sup>−0.1 M−AP (<b>a</b>) and rate-dependent tensile behaviors of the DN−Fe<sup>3+</sup>−0.1 M−E (<b>b</b>) hydrogels under different deformation rates ranging from 10 to 1000 mm/min. (<b>c</b>,<b>d</b>) Sequential loading–unloading cycles for the DN−Fe<sup>3+</sup>−0.1 M−AP hydrogels (<b>c</b>) and DN−Fe<sup>3+</sup>−0.1 M−E hydrogels (<b>d</b>) at a deformation rate of 100 mm/min. The rate-independent elastic DN−Fe<sup>3+</sup>−0.1 M−AP hydrogels show irreversible hysteresis, while the rate-dependent viscoelastic DN−Fe<sup>3+</sup>−0.1 M−E hydrogels show partially reversible hysteresis owing to the metal coordination interactions.</p>
Full article ">Figure 7
<p>(<b>a</b>–<b>c</b>) The rescaled stress σλ<sub>s</sub><sup>2</sup>–rescaled stretch ratio λλ<sub>s</sub> curves for DN hydrogels coordinated with Na<sup>+</sup> (<b>a</b>), Fe<sup>3+</sup> (<b>b</b>), and Zr<sup>4+</sup> (<b>c</b>) as metal ions under different deformation rates ranging from 10 to 1000 mm/min.</p>
Full article ">Figure 8
<p>(<b>a</b>,<b>b</b>) Dependence of the Young’s modulus <span class="html-italic">E</span> (<b>a</b>) and the rescaled Young’s modulus <span class="html-italic">E</span>λ<sub>s</sub> (<b>b</b>) on strain rate for various DN hydrogels. (<b>c</b>,<b>d</b>) Dependence of the yielding stretch ratio λ<sub>y</sub> (<b>c</b>) and the rescaled yielding stretch ratio λ<sub>y</sub>λ<sub>s</sub> (<b>d</b>) on strain rate for various DN hydrogels. (<b>e</b>,<b>f</b>) Dependence of the yielding stress σ<sub>y</sub> (<b>c</b>) and the rescaled yielding stress σ<sub>y</sub>λ<sub>s</sub><sup>2</sup> (<b>d</b>) on strain rate for various DN hydrogels.</p>
Full article ">Figure 9
<p>The ratio of breaking force of first network strands <span class="html-italic">f</span><sub>b</sub>/<span class="html-italic">f</span><sub>b,0</sub> for various DN hydrogels relative to the virgin DN gels. The <span class="html-italic">f</span><sub>b</sub> and <span class="html-italic">f</span><sub>b,0</sub> represent the breaking force of first network in various DN hydrogels and the virgin DN gels, respectively.</p>
Full article ">Figure 10
<p>(<b>a</b>–<b>c</b>) Dependence of the stretch ratio at break λ<sub>b</sub> (<b>a</b>), the stress at break σ<sub>b</sub> (<b>b</b>), and work of extension <span class="html-italic">W</span><sub>b</sub> (<b>c</b>) on strain rate for various DN hydrogels.</p>
Full article ">
18 pages, 6973 KiB  
Review
Recent Progress in Hydrogel-Based Synthetic Cartilage: Focus on Lubrication and Load-Bearing Capacities
by Fei Qiu, Xiaopeng Fan, Wen Chen, Chunming Xu, Yumei Li and Renjian Xie
Gels 2023, 9(2), 144; https://doi.org/10.3390/gels9020144 - 8 Feb 2023
Cited by 7 | Viewed by 4174
Abstract
Articular cartilage (AC), which covers the ends of bones in joints, particularly the knee joints, provides a robust interface to maintain frictionless movement during daily life due to its remarkable lubricating and load-bearing capacities. However, osteoarthritis (OA), characterized by the progressive degradation of [...] Read more.
Articular cartilage (AC), which covers the ends of bones in joints, particularly the knee joints, provides a robust interface to maintain frictionless movement during daily life due to its remarkable lubricating and load-bearing capacities. However, osteoarthritis (OA), characterized by the progressive degradation of AC, compromises the properties of AC and thus leads to frayed and rough interfaces between the bones, which subsequently accelerates the progression of OA. Hydrogels, composed of highly hydrated and interconnected polymer chains, are potential candidates for AC replacement due to their physical and chemical properties being similar to those of AC. In this review, we summarize the recent progress of hydrogel-based synthetic cartilage, or cartilage-like hydrogels, with a particular focus on their lubrication and load-bearing properties. The different formulations, current limitations, and challenges of such hydrogels are also discussed. Moreover, we discuss the future directions of hydrogel-based synthetic cartilage to repair and even regenerate the damaged AC. Full article
(This article belongs to the Special Issue Advanced Hydrogels for Regenerative Medicine and Tissue Engineering)
Show Figures

Figure 1

Figure 1
<p>Illustration of the components and structure of AC. (<b>A</b>) The knee synovial joint is mainly composed of the synovial membrane, AC, and the synovial fluid within the synovial cavity. (<b>B</b>) AC is characterized by its layered structure. Chondrocytes make up less than 5% (volume fraction) of AC. The main composition of ECM, type II collagen, glycosaminoglycans, collagen X, and the depth-dependent modulus, are indicated. (<b>C</b>) Illustration of the outer surface of AC that determines the lubrication performance of AC. Glycosaminoglycans, including hyaluronic acid (HA) and aggrecan, as well as lubricin and phospholipids (are not shown here) synergically assemble to form a lubrication layer outer of the AC surface to determine its remarkable lubrication at high pressure. Reprinted with permission from Ref [<a href="#B4-gels-09-00144" class="html-bibr">4</a>]. Copyright 2021, Wiley-VCH.</p>
Full article ">Figure 2
<p>Schematic illustration of ICRS classification system of AC defects (<b>A</b>) and schematic diagram of traditionally used clinical repair strategies and hydrogel-based AC tissue engineering for AC defects (<b>B</b>). Reprinted with permission from Ref [<a href="#B28-gels-09-00144" class="html-bibr">28</a>]. Copyright 2022, Elsevier.</p>
Full article ">Figure 3
<p>Synthetic hydrogel composites with mechanical strength comparable to or even greater than AC. (<b>A</b>) Illustration of the BC–PVA–PAMPS hydrogel fabrication process. Reprinted with permission from Ref [<a href="#B62-gels-09-00144" class="html-bibr">62</a>]. Copyright 2020, Wiley-VCH. (<b>B</b>) Compressive strength and compressive modulus of annealed BC–PVA–PAMPS hydrogel (mean ± SD), and the friction coefficient of annealed BC–PVA–PAMPS hydrogels sliding against AC. (<b>C</b>) Illustration of treatment of AC defect using annealed BC–PVA–PAMPS hydrogel. Panels (<b>B</b>,<b>C</b>) are reprinted with permission from Ref [<a href="#B63-gels-09-00144" class="html-bibr">63</a>]. Copyright 2022, Wiley-VCH.</p>
Full article ">Figure 4
<p>Phospholipid-inspired cartilage-like hydrogels. (<b>A</b>) Illustration of the self-lubricating and lipid-incorporated hydrogel. The incorporated lipids formed micro-reservoirs throughout the gel bulk, and additional micro-reservoirs were exposed due to friction, which enabled the boundary lubrication layer of the lipids to form on the surface, leading to a reduction in friction via hydration lubrication. Reprinted with permission from Ref [<a href="#B67-gels-09-00144" class="html-bibr">67</a>]. Copyright 2022, Elsevier. (<b>B</b>) Schematic illustrating of the formation PMS-HSPC(SUV)-HA hydrogel and the synergistic lubrication mechanism. The super-lubricated state after the incorporation of lipid SUV and HA was mainly attributed to the synergistic lubrication effect between lipids and HA after the formation of uniformly arranged lipid liposomes around the HA structure. Reprinted with permission from Ref [<a href="#B65-gels-09-00144" class="html-bibr">65</a>]. Copyright 2022, Elsevier. (<b>C</b>) Schematic illustration of the synthesis of lipid-lubricated hydrogels with biocompatible, high-strength lipid-lubrication performance. Reprinted with permission from Ref [<a href="#B66-gels-09-00144" class="html-bibr">66</a>]. Copyright 2022, Elsevier.</p>
Full article ">Figure 5
<p>Typical cartilage structure-inspired hydrogels. (<b>A</b>) The main components consisted of an AC lubrication system within the AC superficial layer (left). The SEM cross-sectional morphology of Composite-LP, which clearly shows the load-bearing phase and lubrication phase (right). (<b>B</b>) The friction coefficients of the Composite-LP, Hg-LP, Composite, and Hg samples (load, 1 N; frequency, 1 Hz). Panels (<b>A</b>,<b>B</b>) are reprinted with permission from Ref [<a href="#B25-gels-09-00144" class="html-bibr">25</a>]. Copyright 2022, American Chemical Society. (<b>C</b>) Schematic illustration of the bilayer-oriented heterogeneous hydrogel (BH-CF/MMT hydrogel). (<b>D</b>) The compressive strength and compressive modulus (<b>D</b>) and the average friction coefficient (<b>E</b>) of the bilayer-oriented heterogeneous hydrogel compared with control groups (bilayer unoriented hydrogel, A-MMT hydrogel, and A-MMT hydrogel). Reprinted with permission from Ref [<a href="#B70-gels-09-00144" class="html-bibr">70</a>]. Copyright 2022, American Chemical Society.</p>
Full article ">Figure 6
<p>Preparation of cartilage components (proteoglycans and lubricin) and layer structure-inspired “CS” and layer “CS-Fe” hydrogels and their main functions, including mechanical adaptability, low friction, and inflammation regulation. Reprinted with permission from Ref [<a href="#B71-gels-09-00144" class="html-bibr">71</a>]. Copyright 2022, American Chemical Society.</p>
Full article ">Figure 7
<p>(<b>A</b>) Steps in the synthesis of POx/PAA double-network hydrogels. (<b>B</b>) Compressive strength and failure load of AC and POx/PAA hydrogels in PBS (pH 7.4). (<b>C</b>) The friction coefficient of POx/PAA hydrogels lubricated by PBS (pH 7.4) and egg white. Reprinted with permission from Ref [<a href="#B75-gels-09-00144" class="html-bibr">75</a>]. Copyright 2022, John Wiley and Sons.</p>
Full article ">Figure 8
<p>(<b>A</b>) Schematic illustration of the fabrication procedures of TEHy-x via the swelling-freeze–thaw method. (<b>B</b>) Compressive toughness and compressive strength of TEHy-x under different numbers of FTS cycles. (<b>C</b>) Static and sliding friction coefficients of TEHy-6 under different loads. (<b>D</b>) Summary and comparison of seven properties of the TEHy-x and AC in a radar chart. Reprinted with permission from Ref [<a href="#B82-gels-09-00144" class="html-bibr">82</a>]. Copyright 2022, American Chemical Society.</p>
Full article ">
15 pages, 2123 KiB  
Article
Pluronics-Based Drug Delivery Systems for Flavonoids Anticancer Treatment
by Sylwia Ronka, Aleksandra Kowalczyk, Dagmara Baczyńska and Anna K. Żołnierczyk
Gels 2023, 9(2), 143; https://doi.org/10.3390/gels9020143 - 8 Feb 2023
Cited by 5 | Viewed by 2393
Abstract
This research concerns the investigation of the preparation of polymeric nanocarriers containing a flavonoid—naringenin, xanthohumol or isoxanthohumol—based on Pluronics by the thin-film formation method. The size of the formed micelles and their stability upon dilution were evaluated using Dynamic light scattering (DLS) analysis; [...] Read more.
This research concerns the investigation of the preparation of polymeric nanocarriers containing a flavonoid—naringenin, xanthohumol or isoxanthohumol—based on Pluronics by the thin-film formation method. The size of the formed micelles and their stability upon dilution were evaluated using Dynamic light scattering (DLS) analysis; the high values of the drug loading and the encapsulation efficiency confirmed that the proposed systems of flavonoids delivery consisting of Pluronic P123 and F127 nanomicelles could effectively distribute the drug into tumour tissues, which makes these nanocarriers ideal candidates for passive targeting of cancer cells by the enhanced permeation and retention (EPR) effect. The in vitro cytotoxicity of proposed flavonoids in the Pluronic formulations was investigated by the SRB assay with human colon cancer cells. We designed mixed polymeric micelles, which was a successful drug delivery system for the case of naringenin not being able to enhance the bioavailability and cytotoxic activity of xanthohumol and isoxanthohumol. Furthermore, it was observed that the higher amount of polymer in the formulation achieved better cytotoxic activity. Full article
(This article belongs to the Special Issue Nanosized Gel as a Drug Delivery System)
Show Figures

Graphical abstract

Graphical abstract
Full article ">Figure 1
<p>Comparison of the naringenin suspension (0.125 mg/mL) (<b>1</b>), and naringenin-loaded micelles solutions in water with various drug to polymer ratios: Pluronic P123 micelles 1:5 C = 0.750 mg/mL (<b>2</b>), Pluronic P123 and F127 mixed micelles 1:5 C = 0.750 mg/mL (<b>3</b>), Pluronic P123 and F127 mixed micelles 1:50 C = 6.375 mg/mL (<b>4</b>).</p>
Full article ">Figure 2
<p>Comparison of the xanthohumol suspension (0.125 mg/mL) (<b>1</b>), and xanthohumol-loaded micelles solutions in water with various drug to polymer ratios: Pluronic P123 and F127 mixed micelles 1:5 C = 0.75 mg/mL (<b>2</b>), 1:10 C = 1.375 mg/mL (<b>3</b>) and 1:20 C = 2.625 mg/mL (<b>4</b>).</p>
Full article ">Figure 3
<p>Size distribution of xanthohumol-loaded polymeric micelles based on Pluronics P123 and F127 (ratio 1:10). Mean diameter 30.5 ± 18.0 nm.</p>
Full article ">Figure 4
<p>Results of DSC analysis of crude naringenin (<b>a</b>), Pluronic F127 (<b>b</b>) and naringenin–Pluronic F127 1:10 nanoparticles (<b>c</b>).</p>
Full article ">Figure 4 Cont.
<p>Results of DSC analysis of crude naringenin (<b>a</b>), Pluronic F127 (<b>b</b>) and naringenin–Pluronic F127 1:10 nanoparticles (<b>c</b>).</p>
Full article ">Figure 5
<p>In vitro release profile of naringenin-loaded P123/F127 Pluronic micelles (ratio 1:5) and free naringenin.</p>
Full article ">Figure 6
<p>In vitro release profile of isoxanthohumol-loaded P123/F127 Pluronic micelles (ratio 1:5) and free isoxanthohumol.</p>
Full article ">Figure 7
<p>Chemical structures of the tested flavonoids: (<b>a</b>) naringenin, (<b>b</b>) xanthohumol and (<b>c</b>) isoxanthohumol.</p>
Full article ">
15 pages, 8157 KiB  
Article
Effect of Storage Time and Temperature on Digestibility, Thermal, and Rheological Properties of Retrograded Rice
by Ishita Chakraborty, Indira Govindaraju, Steffi Kunnel, Vishwanath Managuli and Nirmal Mazumder
Gels 2023, 9(2), 142; https://doi.org/10.3390/gels9020142 - 8 Feb 2023
Cited by 14 | Viewed by 6405
Abstract
Retrogradation is defined as the recrystallization or realignment of amylose and amylopectin chains upon cooling of gelatinization starch gels. The storage conditions such as the storage time and temperature are crucial factors that influence and govern the degree of retrogradation and in turn, [...] Read more.
Retrogradation is defined as the recrystallization or realignment of amylose and amylopectin chains upon cooling of gelatinization starch gels. The storage conditions such as the storage time and temperature are crucial factors that influence and govern the degree of retrogradation and in turn, affect the formation of resistant starch and alteration of thermal and rheological properties. This article investigates the effect of storage time and temperature on the properties of retrograded rice starch. Rice kernels of five different indigenous varieties, namely Diasang lahi, Khaju lahi, Dhusuri bao, Omkar, and Bili rajamudi were cooked by boiling in water and stored at 4 °C and −20 °C for 6 and 12 h, respectively. Differential scanning calorimetry (DSC) studies revealed in raw form that Bili rajamudi exhibited the highest peak gelatinization temperature (Tp, °C) at 79.05 °C whereas Diasang lahi showed the least Tp at 56.12 °C. Further, it was indicated that the Tp and degree of retrogradation (DR%) also increase with increasing time and decreasing temperature of storage. All samples stored at −20 °C for 12 h exhibited the highest degree of retrogradation DR%. Amongst all five varieties stored at −20 °C for 12 h, Omkar exhibited the highest %DR, followed by Bili rajamudi, Khaju lahi, Dhusuri bao, and Diasang lahi. A negative correlation was also established between Tp and resistant starch content (RS%). It was also observed that the resistant starch (RS%) content increased with the increasing time and decreasing temperature of storage. A strong negative correlation was observed between RS% and non-resistant starch (NRS%). Further, rheological studies indicated that retrogradation also affects the viscosity and dynamic rheological properties of starch. In this study, it was evident that extending storage duration from 6 to 12 h and lowering temperature from 4 to −20 °C impact retrogradation of rice starch, which in turn affects the starch’s gelatinization, digestibility, and rheology. Rice starch retrograded at lower temperatures for a longer period could prove to be extremely beneficial for development of food products with better textural properties and high RS content or low glycemic index. Full article
(This article belongs to the Section Gel Analysis and Characterization)
Show Figures

Figure 1

Figure 1
<p>DSC endotherms showing peak gelatinization (T<sub>p</sub>) of native starch and retrograded rice samples: (<b>a</b>) Diasang lahi, (<b>b</b>) Khaju lahi, (<b>c</b>) Dhusuri bao, (<b>d</b>) Omkar, and (<b>e</b>) Bili rajamudi.</p>
Full article ">Figure 2
<p>Degree of retrogradation (%DR) increases with increasing time and decreasing temperature of storage: (<b>a</b>) Diasang lahi, (<b>b</b>) Khaju lahi, (<b>c</b>) Dhusuri bao, (<b>d</b>) Omkar, and (<b>e</b>) Bili rajamudi.</p>
Full article ">Figure 3
<p>Total starch (TS%), non-resistant starch (NRS%), and resistant starch (RS%) with increasing time and decreasing temperature of storage: (<b>a</b>) Diasang lahi, (<b>b</b>) Khaju lahi, (<b>c</b>) Dhusuri bao, (<b>d</b>) Omkar, and (<b>e</b>) Bili rajamudi. (<sup>ns</sup> <span class="html-italic">p</span> &gt; 0.05, * <span class="html-italic">p</span> &lt; 0.05, ** <span class="html-italic">p</span> &lt; 0.01, *** <span class="html-italic">p</span> &lt; 0.001).</p>
Full article ">Figure 4
<p>Relationship between apparent viscosity and shearing rate of rice samples subjected to different storage conditions for retrogradation: (<b>a</b>) Diasang lahi, (<b>b</b>) Khaju lahi, (<b>c</b>) Dhusuri bao, (<b>d</b>) Omkar, and (<b>e</b>) Bili rajamudi.</p>
Full article ">Figure 5
<p>Loss modulus (G”) as a function of the angular frequency of rice samples subjected to different storage conditions for retrogradation: (<b>a</b>) Diasang lahi, (<b>b</b>) Khaju lahi, (<b>c</b>) Dhusuri bao, (<b>d</b>) Omkar, and (<b>e</b>) Bili rajamudi.</p>
Full article ">Figure 6
<p>Storage modulus (G’) as a function of the angular frequency of rice samples subjected to different storage conditions for retrogradation: (<b>a</b>) Diasang lahi, (<b>b</b>) Khaju lahi, (<b>c</b>) Dhusuri bao, (<b>d</b>) Omkar, and (<b>e</b>) Bili rajamudi.</p>
Full article ">Figure 7
<p>Loss tangent (tanδ = G”/G’) as a function of the angular frequency of rice samples subjected to different storage conditions for retrogradation: (<b>a</b>) Diasang lahi, (<b>b</b>) Khaju lahi, (<b>c</b>) Dhusuri bao, (<b>d</b>) Omkar, and (<b>e</b>) Bili rajamudi.</p>
Full article ">Figure 8
<p>Matrix showing correlation between resistant starch content (RS%), non-resistant starch (NRS %), peak gelatinization temperature (Tp), and gelatinization/retrogradation enthalpy (ΔH): (<b>a</b>) Diasang lahi, (<b>b</b>) Khaju lahi, (<b>c</b>) Dhusuri bao, (<b>d</b>) Omkar, and (<b>e</b>) Bili rajamudi.</p>
Full article ">
13 pages, 7739 KiB  
Article
Construction of Engineered Muscle Tissue Consisting of Myotube Bundles in a Collagen Gel Matrix
by Kazuya Furusawa, Yuuki Kawahana and Ryoya Miyashita
Gels 2023, 9(2), 141; https://doi.org/10.3390/gels9020141 - 8 Feb 2023
Viewed by 2523
Abstract
Tissue engineering methods that aim to mimic the hierarchical structure of skeletal muscle tissue have been widely developed due to utilities in various fields of biology, including regenerative medicine, food technology, and soft robotics. Most methods have aimed to reproduce the microscopical morphology [...] Read more.
Tissue engineering methods that aim to mimic the hierarchical structure of skeletal muscle tissue have been widely developed due to utilities in various fields of biology, including regenerative medicine, food technology, and soft robotics. Most methods have aimed to reproduce the microscopical morphology of skeletal muscles, such as the orientation of myotubes and the sarcomere structure, and there is still a need to develop a method to reproduce the macroscopical morphology. Therefore, in this study, we aim to establish a method to reproduce the macroscopic morphology of skeletal muscle by constructing an engineered muscle tissue (EMT) by culturing embryonic chicken myoblast-like cells that are unidirectionally aligned in collagen hydrogels with micro-channels (i.e., MCCG). Whole mount fluorescent imaging of the EMT showed that the myotubes were unidirectionally aligned and that they were bundled in the collagen gel matrix. The myotubes contracted in response to periodic electrostimulations with a frequency range of 0.5–2.0 Hz, but not at 5.0 Hz. Compression tests of the EMT showed that the EMT had anisotropic elasticity. In addition, by measuring the relaxation moduli of the EMTs, an anisotropy of relaxation strengths was observed. The observed anisotropies could be attributed to differences in maturation and connectivity of myotubes in the directions perpendicular and parallel to the long axis of the micro-channels of the MCCG. Full article
(This article belongs to the Special Issue Shaping and Structuring of Polymer Gels)
Show Figures

Graphical abstract

Graphical abstract
Full article ">Figure 1
<p>Whole mount fluorescence microscopy images of the EMT obtained at different culture periods ((<b>A</b>) 3 days, (<b>B</b>) 14 days, and (<b>C</b>) 32 days). Nuclei, F-actin, and collagen are colored blue, green, and red, respectively.</p>
Full article ">Figure 2
<p>Fluorescent images of myotubes in the micro-channels of the MCCG.</p>
Full article ">Figure 3
<p>Time course displacement of the EMT (<span class="html-italic">d</span>(<span class="html-italic">t</span>)) during the periodical electrostimulation: (<b>A</b>) whole process; (<b>B</b>) 27–67 s; (<b>C</b>) 67–108 s; (<b>D</b>) 108–149 s.</p>
Full article ">Figure 4
<p>Fast Fourier transform applied to the signals illustrated in <a href="#gels-09-00141-f003" class="html-fig">Figure 3</a>B–D.</p>
Full article ">Figure 5
<p>(<b>A</b>,<b>B</b>) Stress–strain curves of the EMT and MCCG in the perpendicular and parallel directions. All measured data (<span class="html-italic">n</span> = 4) are shown; (<b>C</b>) comparison of elastic moduli of the EMT and MCCG. Error bars indicate standard deviation (<span class="html-italic">n</span> = 4). The asterisk indicates significant differences of <span class="html-italic">p</span> &lt; 0.05. Comparison performed by using ANOVA test and post hoc Tukey’s test.</p>
Full article ">Figure 6
<p>Relaxation moduli of the EMT in the perpendicular and parallel directions. All measured results are summarized in the figure (<span class="html-italic">n</span> = 3).</p>
Full article ">Figure 7
<p>Comparison of the relaxation parameters between the perpendicular direction and the parallel direction. Error bars indicate standard deviation (<span class="html-italic">n</span> = 3). Asterisks indicate significant differences of <span class="html-italic">p</span> &lt; 0.05. The comparisons were performed by using Student’s <span class="html-italic">t</span>-test.</p>
Full article ">
Previous Issue
Next Issue
Back to TopTop