[go: up one dir, main page]

Next Issue
Volume 11, June
Previous Issue
Volume 11, April


Antioxidants, Volume 11, Issue 5 (May 2022) – 238 articles

Cover Story (view full-size image): 
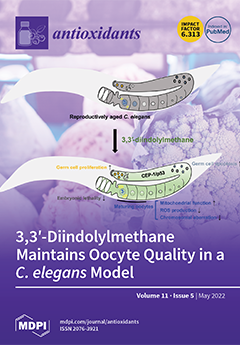
The decline of reproductive capacity with reduced oocyte quality accompanied by advanced maternal age is an emerging issue. Here, we suggest a natural antioxidant 3,3'-diindolylmethane (DIM) as a beneficial modulator that can improve the quality of oocytes in reproductive-aged mothers. Mitochondrial dysfunction with increased reactive oxygen species (ROS) production appears in aged oocytes. DIM supplementation improves oocyte quality, including mitochondrial function, ROS production, and chromosomal morphology, in aged C. elegans mothers. DIM supplementation activates CEP-1/p53 in the germ line of C. elegans to maintain the levels of germ cell proliferation and apoptosis, highly associated with the improved oocyte quality. As a result, the reproductively aged C. elegans showed reduced embryonic lethality by DIM supplementation. View this paper
  • Issues are regarded as officially published after their release is announced to the table of contents alert mailing list.
  • You may sign up for e-mail alerts to receive table of contents of newly released issues.
  • PDF is the official format for papers published in both, html and pdf forms. To view the papers in pdf format, click on the "PDF Full-text" link, and use the free Adobe Reader to open them.
Order results
Result details
Section
Select all
Export citation of selected articles as:
15 pages, 1164 KiB  
Review
Mitochondrial ROS, ER Stress, and Nrf2 Crosstalk in the Regulation of Mitochondrial Apoptosis Induced by Arsenite
by Orazio Cantoni, Ester Zito, Andrea Guidarelli, Mara Fiorani and Pietro Ghezzi
Antioxidants 2022, 11(5), 1034; https://doi.org/10.3390/antiox11051034 - 23 May 2022
Cited by 22 | Viewed by 4516
Abstract
Long-term ingestion of arsenicals, a heterogeneous group of toxic compounds, has been associated with a wide spectrum of human pathologies, which include various malignancies. Although their mechanism of toxicity remains largely unknown, it is generally believed that arsenicals mainly produce their effects via [...] Read more.
Long-term ingestion of arsenicals, a heterogeneous group of toxic compounds, has been associated with a wide spectrum of human pathologies, which include various malignancies. Although their mechanism of toxicity remains largely unknown, it is generally believed that arsenicals mainly produce their effects via direct binding to protein thiols and ROS formation in different subcellular compartments. The generality of these mechanisms most probably accounts for the different effects mediated by different forms of the metalloid in a variety of cells and tissues. In order to learn more about the molecular mechanisms of cyto- and genotoxicity, there is a need to focus on specific arsenic compounds under tightly controlled conditions. This review focuses on the mechanisms regulating the mitochondrial formation of ROS after exposure to low concentrations of a specific arsenic compound, NaAsO2, and their crosstalk with the nuclear factor (erythroid-2 related) factor 2 antioxidant signaling and the endoplasmic reticulum stress response. Full article
(This article belongs to the Special Issue 10th Anniversary of Antioxidants—Review Collection)
Show Figures

Figure 1

Figure 1
<p>Crosstalk between arsenite-induced mitochondrial ROS, ER stress, and Nrf2. Arsenite promotes mitoO<sub>2</sub><sup>•−</sup> formation via a mechanism requiring interactions with the mitochondrial respiratory chain and an accumulation of Ca<sup>2+</sup> in these organelles. The metalloid initially stimulates Ca<sup>2+</sup> release from the IP<sub>3</sub>R, which, although not directly taken up by the mitochondria, nevertheless contributes to this event via RyR stimulation. Indeed, due to the close apposition with the mitochondria, only the fraction of Ca<sup>2+</sup> the RyR can be taken up by the mitochondria. Cells uniquely expressing the IP<sub>3</sub>R, in which these channels are in close contact with the mitochondria, failed to generate mitoO<sub>2</sub><sup>•−</sup> in response to arsenite. RyR activation was regulated by ERO1α and the resulting mitochondrial accumulation of Ca<sup>2+</sup> was critical for the formation of mitoO<sub>2</sub><sup>•</sup>. In this perspective, while the ER stress response appears upstream to mitoO<sub>2</sub><sup>•−</sup> formation, it is nevertheless reasonable to predict that persistent mitoO<sub>2</sub><sup>•−</sup>-derived H<sub>2</sub>O<sub>2</sub> promotes mitochondrial dysfunction and toxicity. The early ER stress response was also critically connected through mitoO<sub>2</sub><sup>•</sup> formation with the triggering of the Nrf2 cytoprotective signaling, which indeed significantly mitigated and delayed the onset of MPT-dependent apoptosis.</p>
Full article ">Figure 2
<p>Mechanisms of Nrf2 activation by arsenite. The different pathways by which arsenite can promote the transcriptional activation of Nrf2 are highlighted. ① Arsenite stimulates ROS production by NADPH oxidase in the plasma membrane and by mitochondria; ② ROS and arsenite oxidize Keap1 and Nrf2 directly or induce Keap1 sequestration via p62; ③ arsenite causes ER stress which activates Nrf2 via PERK; ④ as a result, Nrf2 is freed, translocates to the nucleus and activates the transcription of several enzymes; ⑤ additionally, arsenite can induce neosynthesis of Nrf2 protein at the transcriptional level.</p>
Full article ">
10 pages, 1696 KiB  
Article
β-Carotene Increases Activity of Cytochrome P450 2E1 during Ethanol Consumption
by Cristian Sandoval, Luciana Mella, Karina Godoy, Khosrow Adeli and Jorge Farías
Antioxidants 2022, 11(5), 1033; https://doi.org/10.3390/antiox11051033 - 23 May 2022
Cited by 7 | Viewed by 2627
Abstract
One of the key routes through which ethanol induces oxidative stress appears to be the activation of cytochrome P450 2E1 at different levels of ethanol intake. Our aim was to determine if oral β-carotene intake had an antioxidant effect on CYP2E1 gene expression [...] Read more.
One of the key routes through which ethanol induces oxidative stress appears to be the activation of cytochrome P450 2E1 at different levels of ethanol intake. Our aim was to determine if oral β-carotene intake had an antioxidant effect on CYP2E1 gene expression in mice that had previously consumed ethanol. C57BL/6 mice were used and distributed into: control (C), low-dose alcohol (LA), moderate-dose alcohol (MA), β-carotene (B), low-dose alcohol+β-carotene (LA + B), and moderate-dose alcohol+β-carotene (MA + B). Animals were euthanized at the end of the experiment, and liver tissue was taken from each one. CYP2E1 was measured using qPCR to detect liver damage. The relative expression level of each RNA was estimated using the comparative threshold cycle (Ct) technique (2−ΔΔCT method) by averaging the Ct values from three replicates. The LA+B (2267 ± 0.707) and MA+B (2.307 ± 0.384) groups had the highest CYP2E1 fold change values. On the other hand, the C (1.053 ± 0.292) and LA (1.240 ± 0.163) groups had the lowest levels. These results suggest that ethanol feeding produced a fold increase in CYP2E1 protein in mice as compared to the control group. Increased CYP2E1 activity was found to support the hypothesis that β-carotene might be dangerous during ethanol exposure in animal models. Our findings imply that β-carotene can increase the hepatic damage caused by low and high doses of alcohol. Therefore, the quantity of alcohol ingested, the exposure period, the regulatory mechanisms of alcoholic liver damage, and the signaling pathways involved in the consumption of both alcohol and antioxidant must all be considered. Full article
(This article belongs to the Special Issue Effect of Dietary Antioxidants in Chronic Disease Prevention)
Show Figures

Figure 1

Figure 1
<p>Comparison of <span class="html-italic">ACTB</span> gene expression from control and experimental groups, respectively.</p>
Full article ">Figure 2
<p>Comparison of <span class="html-italic">GAPDH</span> gene expression from control and experimental groups, respectively.</p>
Full article ">Figure 3
<p>Delta Ct values of <span class="html-italic">CYP2E1</span> mRNA of control and experimental groups. Bars represent mean ± SD values of ∆Ct per group; a: significant differences (<span class="html-italic">p</span> &lt; 0.05) with the C group; b: significant differences (<span class="html-italic">p</span> &lt; 0.05) with the LA group; c: significant differences (<span class="html-italic">p</span> &lt; 0.05) with the MA group.</p>
Full article ">Figure 4
<p><span class="html-italic">CYP2E1</span> mRNA fold change is expressed as fold change using the ΔΔCt method in experimental groups with respect to the control group (calibrator). Bars represent mean ± SD values of fold change per group; a: significant differences (<span class="html-italic">p</span> &lt; 0.05) with the C group; b: significant differences (<span class="html-italic">p</span> &lt; 0.05) with the LA group; c: significant differences (<span class="html-italic">p</span> &lt; 0.05) with the MA group.</p>
Full article ">
15 pages, 2343 KiB  
Article
Protective Effect of Alpinia oxyphylla Fruit against tert-Butyl Hydroperoxide-Induced Toxicity in HepG2 Cells via Nrf2 Activation and Free Radical Scavenging and Its Active Molecules
by Chae Lee Park, Ji Hoon Kim, Je-Seung Jeon, Ju-hee Lee, Kaixuan Zhang, Shuo Guo, Do-hyun Lee, Eun Mei Gao, Rak Ho Son, Young-Mi Kim, Gyu Hwan Park and Chul Young Kim
Antioxidants 2022, 11(5), 1032; https://doi.org/10.3390/antiox11051032 - 23 May 2022
Cited by 8 | Viewed by 2404
Abstract
Alpinia oxyphylla Miq. (Zingiberaceae) extract exerts protective activity against tert-butyl hydroperoxide-induced toxicity in HepG2 cells, and the antioxidant response element (ARE) luciferase activity increased 6-fold at 30 μg/mL in HepG2 cells transiently transfected with ARE-luciferase. To identify active molecules, activity-guided isolation of [...] Read more.
Alpinia oxyphylla Miq. (Zingiberaceae) extract exerts protective activity against tert-butyl hydroperoxide-induced toxicity in HepG2 cells, and the antioxidant response element (ARE) luciferase activity increased 6-fold at 30 μg/mL in HepG2 cells transiently transfected with ARE-luciferase. To identify active molecules, activity-guided isolation of the crude extract led to four sesquiterpenes (1, 2, 5, 6) and two diarylheptanoids (3 and 4) from an n-hexane extract and six sesquiterpenes (712) from an ethyl acetate extract. Chemical structures were elucidated by one-dimensional, two-dimensional nuclear magnetic resonance (1D-, 2D-NMR), and mass (MS) spectral data. Among the isolated compounds, eudesma-3,11-dien-2-one (2) promoted the nuclear accumulation of nuclear factor (erythroid-derived 2)-like 2 (Nrf2) and increased the promoter property of the ARE. Diarylheptanoids, yakuchinone A (3), and 5′-hydroxyl-yakuchinone A (4) showed radical scavenging activity in 2,2-diphenyl-1-picrylhydrazyl (DPPH) and 3-ethylbenzothiazoline-6-sulphonic acid (ABTS) assays. Furthermore, optimization of extraction solvents (ratios of water and ethanol) was performed by comparison of contents of active compounds, ARE-inducing activity, radical scavenging activity, and HepG2 cell protective activity. As a result, 75% ethanol was the best solvent for the extraction of A. oxyphylla fruit. This study demonstrated that A. oxyphylla exerted antioxidant effects via the Nrf2/HO-1 (heme oxygenase-1) pathway and radical scavenging along with active markers eudesma-3,11-dien-2-one (2) and yakuchinone A (3). Full article
Show Figures

Figure 1

Figure 1
<p>Crude extract of <span class="html-italic">A. oxyphylla</span> induced ARE-luciferase activity in ARE transfected-HepG2 cells. (<b>A</b>) HPLC chromatogram of crude extract of <span class="html-italic">A. oxyphylla</span>. (<b>B</b>) Relative ARE induction activity of crude extract (μg/mL). (<b>C</b>) Relative ARE activity of solvent partitioned extracts from crude extract. (<b>D</b>) HPLC chromatograms of <span class="html-italic">n</span>-hexane extract and EtOAc extract. Data are presented as the mean ± S.D. (<span class="html-italic">n</span> = 3). ** <span class="html-italic">p</span> &lt; 0.01 (compared with the vehicle-treated control). SUL: sulforaphane was treated as a positive control.</p>
Full article ">Figure 2
<p><sup>1</sup>H-NMR spectra of compound <b>4</b> in CDCl<sub>3</sub> and CD<sub>3</sub>OD (400 MHz).</p>
Full article ">Figure 3
<p>Key <sup>1</sup>H-<sup>1</sup>H COSY (bold) and HMBC (arrows) correlations for compound <b>4</b>.</p>
Full article ">Figure 4
<p>Chemical structures of isolated compounds <b>1</b>–<b>12</b> and their ARE-luciferase induction activity in HepG2 cells. (<b>A</b>) Compounds <b>1</b>–<b>6</b> were isolated from <span class="html-italic">n</span>-hexane extract. (<b>B</b>) Compounds <b>7</b>–<b>12</b> were purified from EtOAc extract. (<b>C</b>) The relative ARE induction activity of each compound to 5 μM sulforaphane (%). Each compound was treated at a concentration of 30 μM. Data are presented as the mean ± S.D. (<span class="html-italic">n</span> = 3). * <span class="html-italic">p</span> &lt; 0.05, ** <span class="html-italic">p</span> &lt; 0.01 (compared with the vehicle-treated control). Sulforaphane (SUL) was treated as a positive control.</p>
Full article ">Figure 5
<p>Protection against <span class="html-italic">t</span>-BHP-induced toxicity of total extract (<b>A</b>) and pure compounds <b>2</b>–<b>4</b> (<b>B</b>–<b>D</b>) from <span class="html-italic">A</span>. <span class="html-italic">oxyphylla</span>. HepG2-ARE cells were pre-treated with each compound (3, 10, 30, or 100 µM) for 12 h and added <span class="html-italic">t</span>-BHP (300 µM) for 4 h. Data are presented as the mean ± S.D. (<span class="html-italic">n</span> = 3). * <span class="html-italic">p</span> &lt; 0.05, ** <span class="html-italic">p</span> &lt; 0.01 (compared with the vehicle-treated control).</p>
Full article ">Figure 6
<p>DPPH (<b>A</b>) and ABTS (<b>B</b>) radical scavenging activity of compounds <b>2</b>–<b>4</b>. The treated concentrations of compounds <b>2</b>–<b>4</b> were 3, 10, 30, and 100 μM. Trolox was used as a positive control. Data are presented as the mean ± S.D. (<span class="html-italic">n</span> = 3). ** <span class="html-italic">p</span> &lt; 0.01 (compared with the vehicle-treated control).</p>
Full article ">Figure 7
<p>Induction of the nuclear Nrf2 protein and HO-1 levels in HepG2 cells by compound <b>2</b> or crude extract. Nuclear Nrf2 protein levels in HepG2 cells exposed to compound <b>2</b> for the indicated concentrations (<b>A</b>) and treated with 30 μM compound <b>2</b> for the indicated times (<b>B</b>). Western blot of HO-1 induced by treatment of compound <b>2</b> (<b>C</b>) and crude extract (<b>D</b>) for the indicated concentrations. Data are presented as the mean ± S.D. (<span class="html-italic">n</span> = 3). * <span class="html-italic">p</span> &lt; 0.05, ** <span class="html-italic">p</span> &lt; 0.01 (compared with the vehicle-treated control).</p>
Full article ">Figure 8
<p>Effects of ethanol-water composition on the DPPH (<b>A</b>), ABTS (<b>B</b>) radical scavenging, ARE-luciferase induction (<b>C</b>), and HepG2 cell protective (<b>D</b>) activity. Data are presented as the mean ± S.D. (<span class="html-italic">n</span> = 3). ** <span class="html-italic">p</span> &lt; 0.01 (compared with the vehicle-treated control).</p>
Full article ">Figure 9
<p>Proposed mechanism of active ingredients of <span class="html-italic">A. oxyphylla</span> for the protective activity against <span class="html-italic">t</span>-BHP-induced toxicity in HepG2 cells.</p>
Full article ">
13 pages, 2143 KiB  
Article
Ultrafine Diesel Exhaust Particles Induce Apoptosis of Oligodendrocytes by Increasing Intracellular Reactive Oxygen Species through NADPH Oxidase Activation
by Ji Young Kim, Jin-Hee Kim, Yong-Dae Kim and Je Hoon Seo
Antioxidants 2022, 11(5), 1031; https://doi.org/10.3390/antiox11051031 - 23 May 2022
Cited by 7 | Viewed by 2489
Abstract
Diesel exhaust particles (DEPs) are a main contributor to air pollution. Ultrafine DEPs can cause neurodegenerative diseases by increasing intracellular reactive oxygen species (ROS). Compared with other cells in the brain, oligodendrocytes responsible for myelination are more susceptible to oxidative stress. However, the [...] Read more.
Diesel exhaust particles (DEPs) are a main contributor to air pollution. Ultrafine DEPs can cause neurodegenerative diseases by increasing intracellular reactive oxygen species (ROS). Compared with other cells in the brain, oligodendrocytes responsible for myelination are more susceptible to oxidative stress. However, the mechanisms underlying ROS generation in oligodendrocytes and the susceptibility of oligodendrocytes to ROS by ultrafine DEPs remain unclear. Herein, we examined the effects of excessive ROS generated by NOX2, an isoform of the NADPH oxidase family, after exposure to ultrafine DEPs (200 μg/mL) on the survival of two types of oligodendrocytes—oligodendrocyte precursor cells (OPCs) and mature oligodendrocytes (mOLs)––isolated from the brain of neonatal rats. In addition, mice were exposed to ultrafine DEP suspension (20 μL, 0.4 mg/mL) via the nasal route for 1 week, after which the expression of NOX2 and cleaved caspase-3 was examined in the white matter of the cerebellum. Exposure to DEPs significantly increased NOX2 expression and ROS generation in OPCs and mOLs. OPCs and mOLs clearly exhibited viability reduction, and a significant change in p53, Bax, Bcl-2, and cleaved caspase-3 expression, after DEP exposure. In contrast, treatment with berberine (BBR), an NOX2 inhibitor, significantly mitigated these effects. In mice exposed to DEP, the presence of NOX2-positive and cleaved caspase-3-positive oligodendrocytes was demonstrated in the cerebellar white matter; NOX2 and cleaved caspase-3 expression in the cerebellum lysates was significantly increased. BBR treatment returned expression of these proteins to control levels. These results demonstrate that the susceptibility of OPCs and mOLs to ultrafine DEPs is, at least in part, caused by excessive ROS produced by NOX2 and the sequential changes in the expression of p53, Bax, Bcl-2, and cleaved caspase-3. Overall, NOX2 inhibitor enhances the survival of two types of oligodendrocytes. Full article
(This article belongs to the Special Issue Pharmacology of Antioxidants)
Show Figures

Graphical abstract

Graphical abstract
Full article ">Figure 1
<p>The expression of specific antigens and morphology of primary cells isolated from the brains of neonatal rats. (<b>A</b>–<b>D</b>) Specific antigen expression. OPCs, mOLs, astrocytes, and cortical neurons are labeled with specific antibodies. (<b>E</b>–<b>H</b>) Morphology. The unique shapes of OPCs, mOLs, astrocytes, and cortical neurons are visualized using phase-contrast microscopy. ASTs = astrocytes, CxNs = cortical neurons. Scale bar = 50 μm.</p>
Full article ">Figure 2
<p>Detection of ROS generation using the DCF assay in brain cells after exposure to various concentrations of ultrafine DEPs (2, 20, 200 μg/mL). Compared with the control, the ROS levels are significantly increased in OPCs and mOLs at 2 μg/mL and tend to be increased in proportion to the ultrafine DEP concentrations. Note that the ROS levels of astrocytes and cortical neurons are not changed after exposure to ultrafine DEP. Cont = control, ASTs = astrocytes, CxNs = cortical neurons. * <span class="html-italic">p</span> &lt; 0.05 vs. control.</p>
Full article ">Figure 3
<p>Expression of gp91phox (NOX2) in brain cells after exposure to ultrafine DEPs. (<b>A</b>) Quantitative analysis. The gp91phox expressions in OPCs and mOLs exposed to ultrafine DEPs (200 μg/mL) are significantly higher than those of each control group. However, BBR treatment significantly suppresses the gp91phox expressions in OPCs and mOLs exposed to ultrafine DEPs. There are no differences in the gp91phox expressions of astrocytes and cortical neurons in each group. (<b>B</b>) Immunofluorescence. The gp91phox expressions in OPCs and mOLs exposed to ultrafine DEPs are markedly increased compared with those of each control group. However, BBR treatment suppresses the gp91phox expressions in OPCs and mOLs exposed to ultrafine DEPs. Changes in gp91phox expressions are not observed in astrocytes and cortical neurons in each group. ASTs = astrocytes, CxNs = cortical neurons. * <span class="html-italic">p</span> &lt; 0.05 for DEP group vs. control, # <span class="html-italic">p</span> &lt; 0.05 for DEP + BBR group vs. DEP group. Scale bar = 200 μm.</p>
Full article ">Figure 4
<p>Detection of ROS generation in brain cells after exposure to ultrafine DEPs. (<b>A</b>) DCF assay. ROS generation in OPCs and mOLs after exposure to ultrafine DEP (200 μg/mL) is significantly increased compared with that in each control group. However, BBR treatment significantly inhibits ROS generation in OPCs and mOLs exposed to ultrafine DEPs. (<b>B</b>) DHE staining. ROS generation after exposure to ultrafine DEPs is markedly increased in OPCs and mOLs, whereas ROS generation is not observed in astrocytes and cortical neurons in each group. ASTs = astrocytes, CxNs = cortical neurons. * <span class="html-italic">p</span> &lt; 0.05 for DEP group vs. control, # <span class="html-italic">p</span> &lt; 0.05 for DEP + BBR group vs. DEP group. Scale bar = 200 μm.</p>
Full article ">Figure 5
<p>Expression of p53, Bax, Bcl-2, and cleaved caspase-3 in brain cells after exposure to ultrafine DEP. The expressions of p53 (<b>A</b>), Bax (<b>B</b>), and cleaved caspase-3 (<b>D</b>) are significantly increased and the expression of Bcl-2 (<b>C</b>) is significantly decreased in OPCs and mOLs after exposure to ultrafine DEPs (200 μg/mL) compared with those in the control groups. However, BBR treatment significantly suppresses the expressions of p53 (<b>A</b>), Bax (<b>B</b>), and cleaved caspase-3 (<b>D</b>) and recovers the expression of Bcl-2 <b>(C)</b> in OPCs and mOLs exposed to ultrafine DEPs. There are no differences in the expressions of p53 (<b>A</b>), Bax (<b>B</b>), Bcl-2 (<b>C</b>), and cleaved caspase-3 (<b>D</b>) in astrocytes and cortical neurons in each group. ASTs = astrocytes, CxNs = cortical neurons. * <span class="html-italic">p</span> &lt; 0.05 for DEP group vs. control, # <span class="html-italic">p</span> &lt; 0.05 for DEP + BBR group vs. DEP group.</p>
Full article ">Figure 6
<p>Viability analyses of brain cells after exposure to ultrafine DEP. (<b>A</b>) MTT assay. The survival rates of OPCs and mOLs exposed to ultrafine DEPs (200 μg/mL) are significantly decreased compared with those in each control group. BBR treatment inhibits the significant decrease of the survival rates of OPCs and mOLs exposed to ultrafine DEPs. There are no significant changes in the survival rates of astrocytes and cortical neurons compared with that in each control group. (<b>B</b>) Annexin V assay. The total proportions of apoptotic OPCs and mOLs are significantly increased compared with those in each control group. BBR treatment inhibits the significant increase of the total proportions of apoptotic OPCs and mOLs exposed to ultrafine DEPs. Although the total proportions of apoptotic astrocytes and cortical neurons are slightly elevated, there are no statistical changes compared with those in each control group. (<b>C</b>) Hoechst staining. The number of damaged OPCs and mOLs with condensed or fragmented nuclei after ultrafine DEP exposure (200 μg/mL) are markedly increased compared with that in each control group. However, BBR treatment inhibits the increase of the number of damaged OPCs and mOLs exposed to ultrafine DEPs. Damaged astrocytes and cortical neurons are not observed in the three groups. ASTs = astrocytes, CxNs = cortical neurons. * <span class="html-italic">p</span> &lt; 0.05 for DEP group vs. control, # <span class="html-italic">p</span> &lt; 0.05 for DEP + BBR group vs. DEP group. Scale bar = 200 μm.</p>
Full article ">Figure 7
<p>Expressions of gp91phox (NOX2) and cleaved caspase-3 in the cerebellum of mice exposed to ultrafine DEPs for 1 week. (<b>A</b>,<b>B</b>) Double immunofluorescence staining. Unlike the control, the CAII-positive and aBC-positive oligodendrocytes overlapped with the gp91phox (<b>A</b>) and cleaved caspase-3 (<b>B</b>) are found in the cerebellar white matter of the mouse brain exposed to ultrafine DEPs. (<b>C</b>,<b>D</b>) Quantitative analysis. The expressions of gp91phox (<b>C</b>) and cleaved caspase-3 (<b>D</b>) in the mouse cerebellum exposed to ultrafine DEPs are significantly higher than those in each control group. However, BBR treatment significantly suppressed the expressions of gp91phox and cleaved caspase-3 in the cerebellum exposed to ultrafine DEPs. * <span class="html-italic">p</span> &lt; 0.05 for DEP group vs. control, # <span class="html-italic">p</span> &lt; 0.05 for DEP + BBR group vs. DEP group. Scale bar = 10 μm.</p>
Full article ">
22 pages, 2823 KiB  
Article
Identification of Modulators of the C. elegans Aryl Hydrocarbon Receptor and Characterization of Transcriptomic and Metabolic AhR-1 Profiles
by Lucie Larigot, Linh-Chi Bui, Marine de Bouvier, Ophélie Pierre, Grégory Pinon, Justine Fiocca, Mohammad Ozeir, Cendrine Tourette, Chris Ottolenghi, Sandrine Imbeaud, Clément Pontoizeau, Benjamin J. Blaise, Aline Chevallier, Céline Tomkiewicz, Béatrice Legrand, Bénédicte Elena-Herrmann, Christian Néri, Vanessa Brinkmann, Pierre Nioche, Robert Barouki, Natascia Ventura, Julien Dairou and Xavier Coumouladd Show full author list remove Hide full author list
Antioxidants 2022, 11(5), 1030; https://doi.org/10.3390/antiox11051030 - 23 May 2022
Cited by 4 | Viewed by 3237
Abstract
The Aryl hydrocarbon Receptor (AhR) is a xenobiotic sensor in vertebrates, regulating the metabolism of its own ligands. However, no ligand has been identified to date for any AhR in invertebrates. In C. elegans, the AhR ortholog, AHR-1, displays physiological functions. [...] Read more.
The Aryl hydrocarbon Receptor (AhR) is a xenobiotic sensor in vertebrates, regulating the metabolism of its own ligands. However, no ligand has been identified to date for any AhR in invertebrates. In C. elegans, the AhR ortholog, AHR-1, displays physiological functions. Therefore, we compared the transcriptomic and metabolic profiles of worms expressing AHR-1 or not and investigated the putative panel of chemical AHR-1 modulators. The metabolomic profiling indicated a role for AHR-1 in amino acids, carbohydrates, and fatty acids metabolism. The transcriptional profiling in neurons expressing AHR-1, identified 95 down-regulated genes and 76 up-regulated genes associated with neuronal and metabolic functions in the nervous system. A gene reporter system allowed us to identify several AHR-1 modulators including bacterial, dietary, or environmental compounds. These results shed new light on the biological functions of AHR-1 in C. elegans and perspectives on the evolution of the AhR functions across species. Full article
(This article belongs to the Special Issue The 10th Anniversary of Antioxidants: Past, Present and Future)
Show Figures

Figure 1

Figure 1
<p>OPLS model discriminating WT-GFP and mutant-GFP (<b>A</b>) or N2 and <span class="html-italic">ahr-1</span>(<span class="html-italic">ia03</span>) (<b>B</b>). Top: Score plots. Bottom: Loading plots. (<b>A</b>) R2 = 0.783, Q2 = 0.973. mutant-GFP is associated with high levels of phenylalanine, cystathionine, lysine, b-alanine, glutamine, tyrosine, valine, leucine and isoleucine, and low levels of allantoin, trehalose, phosphocholine and glycerophosphocholine, glutamate, cyclic fatty acids and glyceryl of lipids, by comparison to WT-GFP. (<b>B</b>) R2 = 0.903, Q2 = 0.93. <span class="html-italic">ahr-1</span>(<span class="html-italic">ia03</span>) is associated with high levels of phenylalanine, glycerol, betaine, cystathionine, lysine, asparagine, tyrosine, valine, leucine and isoleucine, and low levels of allantoin, trehalose, glycerophosphocholine, phosphocholine, cyclic fatty acids and glyceryl of lipids, by comparison to N2.</p>
Full article ">Figure 2
<p>Requirement of AHR-1 and AHA-1 for transcriptional activity. (<b>A</b>) Structure of AHR-1 WT, <span class="html-italic">ahr-1(ju145)</span> and <span class="html-italic">ahr-1(ia03)</span> proteins. The 602 amino acids AHR-1 WT protein is truncated in <span class="html-italic">ahr-1</span>(<span class="html-italic">ju145)</span> as a result of a C to T point mutation that leads to a stop codon (Huang et al., 2004). The <span class="html-italic">ahr-1(ia03)</span> mutant allele contains a 1517 bp deletion from 205 bp 5′ of exon 4 to 30 bp 5′ of exon 8 that results in a frameshift and a premature stop codon (Qin and Powell-Coffman, 2004). (<b>B</b>) The requirement of the two partners is examined in the screening model. The Cos-7 cells transfection is carried out in different conditions with 5 ng/well of <span class="html-italic">ahr-1</span> (WT or mutants) and <span class="html-italic">aha-1</span> plasmids and without FBS: either with the empty vector (pcDNA3) or with only one of the two partners (AHA-1, <span class="html-italic">ahr-1</span><span class="html-italic">(ju145)</span> or AHR-1 WT) and with the two partners (<span class="html-italic">ahr-1</span>(<span class="html-italic">ju145)</span>:AHA-1 and AHR-1 WT:AHA-1). Six independent experiments were performed in duplicate, error bars represent SD. Friedman test with Dunn’s multiple comparisons post-test * <span class="html-italic">p</span>-value &lt; 0.05, *** <span class="html-italic">p</span>-value &lt; 0.001.</p>
Full article ">Figure 3
<p>Comparison between Cos-7 cells transfected with <span class="html-italic">C. elegans ahr-1</span> or human <span class="html-italic">ahr</span>. Cos-7 cells were transfected with the empty vector (pcDNA3) or with <span class="html-italic">C. elegans ahr-1</span>/<span class="html-italic">aha-1</span> or with human <span class="html-italic">ahr</span>/<span class="html-italic">arnt</span>. After transfection and culture for 24 h in 0% FBS medium, cells were treated for 24 h with 10 nM of TCDD. The relative activity represents the Firefly measurement normalized to the Renilla measurement for each condition. Three independent experiments were performed in duplicate, error bars represent SD. ANOVA followed with comparison test of each column with the control column (pcDNA3—No treatment) *** <span class="html-italic">p</span>-value &lt; 0.001.</p>
Full article ">Figure 4
<p>AHR-1 basal activity in Cos-7 cells. Different plasmid concentrations and FBS conditions were tested during the screening model optimization. (<b>A</b>) Comparison between the transfection of the empty vector (pcDNA3) and the two partners (<span class="html-italic">ahr-1</span> and <span class="html-italic">aha-1</span> plasmids) in Cos-7 cells cultured with 10% FBS. (<b>B</b>) Comparison between the transfection of <span class="html-italic">ahr-1</span> and <span class="html-italic">aha-1</span> plasmids in Cos-7 cells cultured either in 0% FBS or in 10% FBS. The relative activity represents the measurement of the Firefly activity normalized to the Renilla measurement for each condition. Six independent experiments were performed in duplicate, error bars represent SD. ANOVA with Bonferroni’s multiple comparison post-test * <span class="html-italic">p</span>-value &lt; 0.05, *** <span class="html-italic">p</span>-value &lt; 0.001.</p>
Full article ">Figure 5
<p>Summary of significant AHR-1 modulators in Cos-7 cells. Positive (<b>A</b>) and negative (<b>B</b>) modulator’s concentrations are represented with the dependent-AHR-1 fold induction of Firefly luciferase. Example of a positive (<b>C</b>), and negative (<b>D</b>) modulator dependent concentration effect on AHR-1 activity. Six independent experiments were performed in duplicate, fold induction is standardized to the vehicle which is 1. Statistical significances relative to the vehicle were examined: * <span class="html-italic">p</span>-value &lt; 0.05; ** <span class="html-italic">p</span>-value &lt; 0.01; *** <span class="html-italic">p</span>-value &lt; 0.001. (<b>E</b>) Molecular structure of the positive (green) and negative (red) modulators of AHR-1.</p>
Full article ">Figure 5 Cont.
<p>Summary of significant AHR-1 modulators in Cos-7 cells. Positive (<b>A</b>) and negative (<b>B</b>) modulator’s concentrations are represented with the dependent-AHR-1 fold induction of Firefly luciferase. Example of a positive (<b>C</b>), and negative (<b>D</b>) modulator dependent concentration effect on AHR-1 activity. Six independent experiments were performed in duplicate, fold induction is standardized to the vehicle which is 1. Statistical significances relative to the vehicle were examined: * <span class="html-italic">p</span>-value &lt; 0.05; ** <span class="html-italic">p</span>-value &lt; 0.01; *** <span class="html-italic">p</span>-value &lt; 0.001. (<b>E</b>) Molecular structure of the positive (green) and negative (red) modulators of AHR-1.</p>
Full article ">Figure 6
<p>Time course of 3MC, a positive modulator of AHR-1 in Cos-7 cells. After transfection and culture for 24 h in 0% FBS medium, cells were treated for 24 h with 3-methylcholanthrene 5 µM. After 3 h, 5 h, 16 h and 26 h of treatment, cells were lysed, and Firefly luciferase luminescence was read. Six independent experiments were performed in duplicate, error bars represent SD, fold induction is standardized to the vehicle which is 1. Statistical significances relative to the vehicle were examined: ANOVA with Bonferroni’s multiple comparison post-test, * <span class="html-italic">p</span>-value &lt; 0.05.</p>
Full article ">
15 pages, 2945 KiB  
Article
Anti-Inflammatory, Anti-Apoptotic, and Antioxidant Roles of Honey, Royal Jelly, and Propolis in Suppressing Nephrotoxicity Induced by Doxorubicin in Male Albino Rats
by Hanaa K. Mohamed, Maysa A. Mobasher, Rasha A. Ebiya, Marwa T. Hassen, Howaida M. Hagag, Radwa El-Sayed, Shaimaa Abdel-Ghany, Manal M. Said and Nabil S. Awad
Antioxidants 2022, 11(5), 1029; https://doi.org/10.3390/antiox11051029 - 23 May 2022
Cited by 27 | Viewed by 3894
Abstract
Nephrotoxicity is one of the limiting factors for using doxorubicin (DOX). Honey, propolis, and royal jelly were evaluated for their ability to protect against nephrotoxicity caused by DOX. Forty-two adult albino rats were divided into control groups. The DOX group was injected i.p. [...] Read more.
Nephrotoxicity is one of the limiting factors for using doxorubicin (DOX). Honey, propolis, and royal jelly were evaluated for their ability to protect against nephrotoxicity caused by DOX. Forty-two adult albino rats were divided into control groups. The DOX group was injected i.p. with a weekly dose of 3 mg/kg of DOX for six weeks. The DOX plus honey treated group was injected with DOX and on the next day, received 500 mg/kg/day of honey orally for 21 days. The DOX plus royal jelly treated group was injected with DOX and on the following day, received 100 mg/kg/day of royal jelly orally for 21 days. The DOX plus propolis treated group received DOX and on the following day, was treated orally with 50 mg/kg/day of propolis for 21 days. The DOX plus combined treatment group received DOX and on the following day, was treated with a mix of honey, royal jelly, and propolis orally for 21 days. Results confirmed that DOX raised creatinine, urea, MDA, and TNF-α while decreasing GPX and SOD. Damages and elevated caspase-3 expression were discovered during renal tissue’s histopathological and immunohistochemical studies. Combined treatment with honey, royal jelly, and propolis improved biochemical, histological, and immunohistochemical studies in the renal tissue. qRT-PCR revealed increased expression of poly (ADP-Ribose) polymerase-1 (PARP-1) and a decline of Bcl-2 in the DOX group. However, combined treatment induced a significant decrease in the PARP-1 gene and increased Bcl-2 expression levels. In addition, the combined treatment led to significant improvement in the expression of both PARP-1 and Bcl-2 genes. In conclusion, the combined treatment effectively inhibited nephrotoxicity induced by DOX. Full article
(This article belongs to the Special Issue Antioxidant Activity of Honey Bee Products)
Show Figures

Figure 1

Figure 1
<p>Effect of honey (H), royal jelly (R), and propolis (P) on the renal functions in rats treated with Doxorubicin, (<b>A</b>) creatinine, and (<b>B</b>) urea. Values are shown as mean ± SE. Different lowercase letters indicate significant differences compared to the corresponding value in the control group at <span class="html-italic">p</span> &lt; 0.05.</p>
Full article ">Figure 2
<p>Effect of honey, royal jelly, and propolis on the oxidative marker and antioxidant enzyme activity in renal tissues of rats treated with Doxorubicin, (<b>A</b>) MDA, (<b>B</b>) SOD, and (<b>C</b>) GPX. Values are shown as mean ± SE. Statistically, Different lowercase letters indicate significant differences compared to the corresponding value in the control group at <span class="html-italic">p</span> &lt; 0.05.</p>
Full article ">Figure 3
<p>Effect of honey, royal jelly, and propolis on TNF-α of rats treated with Doxorubicin. Values are shown as mean ± SE. Statistically. Different lowercase letters indicate significant differences compared to the corresponding value in the control group at <span class="html-italic">p</span> &lt; 0.05.</p>
Full article ">Figure 4
<p>Control group (<b>A</b>) high power view shows average glomeruli with average Bowman’s spaces, average proximal tubules with preserved brush borders (black arrow), average distal tubules, and average interstitium (H&amp;E); Dox group (<b>B</b>) showing focal cystic dilation of renal tubules with focal interstitial nephritis (H&amp;E); Dox + H group (<b>C</b>) showing apparently normal renal cortex with few tubules containing renal cast (arrow) (H&amp;E); (<b>D</b>) (Dox + R), showing some degenerating renal tubules (H&amp;E); Dox + P group (<b>E</b>) showing apparently normal renal medulla (H&amp;E); Dox + H + R + P group (<b>F</b>) showing apparently normal renal cortex (H&amp;E).</p>
Full article ">Figure 5
<p>Control group (<b>A</b>) high power view showing negative expression of caspase 3 (immunostaining); Dox group (<b>B</b>) showing higher expression of caspase 3 (immunostaining); Dox + H group (<b>C</b>) and Dox + R group (<b>D</b>) showing moderate expression of caspase 3 (immunostaining); Dox + P group (<b>E</b>) and Dox + H + R + P group (<b>F</b>) show weak expression of caspase 3 (immunostaining). (<b>G</b>) Optical density% for Caspase 3 in experimental groups. Results are expressed as mean ± S.E.M. and analyzed using one-way ANOVA followed by Bonferroni’s test for multiple comparisons. * <span class="html-italic">p</span> ≤ 0.05 versus control group. <sup>&amp;</sup> <span class="html-italic">p</span> ≤ 0.05 versus Dox group. <sup>a</sup> <span class="html-italic">p ≤ 0.05</span> versus Dox + H group. <sup>b</sup> <span class="html-italic">p</span> ≤ 0.05 versus Dox + R group. <span class="html-italic">n</span> = 5.</p>
Full article ">Figure 6
<p>Histogram for poly (ADP-ribose) polymerase 1 (PARP-1) and Bcl2 genes expression in response to treatment with honey (H), propolis (P), and royal jelly (R) mix (H + P + R) on rats treated with Doxorubicin. The groups are negative control; Dox treated group (Dox); the Dox +hony treated group (Dox + H); the Dox + royal jelly treated group (Dox + R); the Dox +propolis treated group (Dox + P); the Dox + mix of honey, royal jelly, and propolis treated group (Dox + H + P + R). * mean significant <span class="html-italic">p</span>-value less than 0.05. ** mean significant <span class="html-italic">p</span>-value less than 0.01.</p>
Full article ">Figure 7
<p>Schematic diagram showing the experimental design and relevant results. <span class="html-fig-inline" id="antioxidants-11-01029-i001"> <img alt="Antioxidants 11 01029 i001" src="/antioxidants/antioxidants-11-01029/article_deploy/html/images/antioxidants-11-01029-i001.png"/></span> Upregulation of the parameter. <span class="html-fig-inline" id="antioxidants-11-01029-i002"> <img alt="Antioxidants 11 01029 i002" src="/antioxidants/antioxidants-11-01029/article_deploy/html/images/antioxidants-11-01029-i002.png"/></span> Downlegulation of the parameter.</p>
Full article ">
16 pages, 673 KiB  
Review
The Systemic Effects of Exercise on the Systemic Effects of Alzheimer’s Disease
by Dora Aczel, Bernadett Gyorgy, Peter Bakonyi, RehAn BukhAri, Ricardo Pinho, Istvan Boldogh, Gu Yaodong and Zsolt Radak
Antioxidants 2022, 11(5), 1028; https://doi.org/10.3390/antiox11051028 - 23 May 2022
Cited by 9 | Viewed by 3980
Abstract
Alzheimer’s disease (AD) is a progressive degenerative disorder and a leading cause of dementia in the elderly. The etiology of AD is multifactorial, including an increased oxidative state, deposition of amyloid plaques, and neurofibrillary tangles of the tau protein. The formation of amyloid [...] Read more.
Alzheimer’s disease (AD) is a progressive degenerative disorder and a leading cause of dementia in the elderly. The etiology of AD is multifactorial, including an increased oxidative state, deposition of amyloid plaques, and neurofibrillary tangles of the tau protein. The formation of amyloid plaques is considered one of the first signs of the illness, but only in the central nervous system (CNS). Interestingly, results indicate that AD is not just localized in the brain but is also found in organs distant from the brain, such as the cardiovascular system, gut microbiome, liver, testes, and kidney. These observations make AD a complex systemic disorder. Still, no effective medications have been found, but regular physical activity has been considered to have a positive impact on this challenging disease. While several articles have been published on the benefits of physical activity on AD development in the CNS, its peripheral effects have not been discussed in detail. The provocative question arising is the following: is it possible that the beneficial effects of regular exercise on AD are due to the systemic impact of training, rather than just the effects of exercise on the brain? If so, does this mean that the level of fitness of these peripheral organs can directly or indirectly influence the incidence or progress of AD? Therefore, the present paper aims to summarize the systemic effects of both regular exercise and AD and point out how common exercise-induced adaptation via peripheral organs can decrease the incidence of AD or attenuate the progress of AD. Full article
(This article belongs to the Special Issue Redox Signaling in Exercise Physiology)
Show Figures

Figure 1

Figure 1
<p>AD is a complex systemic disorder, which induces the degenerative process in organs distant from the brain: cardiovascular system, gut microbiome, liver, testes, and kidney are involved (red arrows). Therefore, increased physical activity has been reported to have a preventive effect on all organs in AD (blue arrows). Aβ—β-amyloid; AD—Alzheimer’s disease; bm—basement membrane; BMP—bone morphogenetic protein; NO—nitric oxide, PACAP—pituitary--cyclase-activating polypeptide; TAD—trained AD.</p>
Full article ">
4 pages, 197 KiB  
Editorial
Paradox Role of Oxidative Stress in Cancer: State of the Art
by Cinzia Domenicotti and Barbara Marengo
Antioxidants 2022, 11(5), 1027; https://doi.org/10.3390/antiox11051027 - 23 May 2022
Cited by 4 | Viewed by 1638
Abstract
The modulation of oxidative stress is essential for the maintenance of redox homeostasis in healthy and cancer cells [...] Full article
(This article belongs to the Special Issue Paradox Role of Oxidative Stress in Cancer: State of the Art)
16 pages, 1957 KiB  
Article
Randomized Clinical Trial of How Long-Term Glutathione Supplementation Offers Protection from Oxidative Damage and Improves HbA1c in Elderly Type 2 Diabetic Patients
by Saurabh Kalamkar, Jhankar Acharya, Arjun Kolappurath Madathil, Vijay Gajjar, Uma Divate, Sucheta Karandikar-Iyer, Pranay Goel and Saroj Ghaskadbi
Antioxidants 2022, 11(5), 1026; https://doi.org/10.3390/antiox11051026 - 23 May 2022
Cited by 17 | Viewed by 7562
Abstract
Complications in type 2 diabetes (T2D) arise from hyperglycemia-induced oxidative stress. Here, we examined the effectiveness of supplementation with the endogenous antioxidant glutathione (GSH) during anti-diabetic treatment. A total of 104 non-diabetic and 250 diabetic individuals on anti-diabetic therapy, of either sex and [...] Read more.
Complications in type 2 diabetes (T2D) arise from hyperglycemia-induced oxidative stress. Here, we examined the effectiveness of supplementation with the endogenous antioxidant glutathione (GSH) during anti-diabetic treatment. A total of 104 non-diabetic and 250 diabetic individuals on anti-diabetic therapy, of either sex and aged between 30 and 78 years, were recruited. A total of 125 diabetic patients were additionally given 500 mg oral GSH supplementation daily for a period of six months. Fasting and PP glucose, insulin, HbA1c, GSH, oxidized glutathione (GSSG), and 8-hydroxy-2-deoxy guanosine (8-OHdG) were measured upon recruitment and after three and six months of supplementation. Statistical significance and effect size were assessed longitudinally across all arms. Blood GSH increased (Cohen’s d = 1.01) and 8-OHdG decreased (Cohen’s d = −1.07) significantly within three months (p < 0.001) in diabetic individuals. A post hoc sub-group analysis showed that HbA1c (Cohen’s d = −0.41; p < 0.05) and fasting insulin levels (Cohen’s d = 0.56; p < 0.05) changed significantly in diabetic individuals above 55 years. GSH supplementation caused a significant increase in blood GSH and helped maintain the baseline HbA1c overall. These results suggest GSH supplementation is of considerable benefit to patients above 55 years, not only supporting decreased glycated hemoglobin (HbA1c) and 8-OHdG but also increasing fasting insulin. The clinical implication of our study is that the oral administration of GSH potentially complements anti-diabetic therapy in achieving better glycemic targets, especially in the elderly population. Full article
(This article belongs to the Special Issue Antioxidants in Diabetes)
Show Figures

Figure 1

Figure 1
<p>Flowchart for study design.</p>
Full article ">Figure 2
<p><b>The effect size of changes in blood biochemical parameters.</b> Six-month changes in the biochemical parameters of D and DG groups were compared here on a forest plot with effect size and corresponding 95% confidence intervals (CI). Effect size (Cohen’s d) calculated between 6-month changes in the concentration of biochemical variables are denoted on the <span class="html-italic">x</span>-axis. The group-wise means of 6-month changes in the concentration of these variables were compared using two-sample permutation tests. The significance of these comparisons is denoted by the p values mentioned to the right of horizontal lines for CI. Significance level is *** <span class="html-italic">p</span> &lt; 0.001 for respective comparisons. Effect size takes either a positive or negative sign based on the direction of change: a positive effect size increases towards the right and a negative effect towards the left. Vertical dotted lines represent different classifications of effect size. In particular, “Medium” effects are labeled at 0.5 and −0.5, and “Large” effects at 0.8 and −0.8. Abbreviations used here are, HbA1c—glycated hemoglobin, GSH—reduced glutathione, PP glucose—postprandial glucose, PP insulin—postprandial insulin, and 8-OHdG—8-hydroxy-2-deoxy guanosine.</p>
Full article ">Figure 3
<p><b>Longitudinal changes in the concentration of (a) GSH and (b) GSSG in different groups.</b> The measured data for (<b>a</b>) GSH and (<b>b</b>) GSSG concentrations from Control, D, and DG groups at α, β, and γ visits are shown here with box and whiskers plots. Mean (black circles for Control, blue for D, and red for DG groups, respectively) and inter-quartile ranges (IQR) of the data are overlaid over the corresponding box plots. The group-wise means at different visits are connected using solid lines with the same color. Significance levels displayed above β, and γ visits denote the comparisons with α visit using permutation tests. Significance level is *** <span class="html-italic">p</span> &lt; 0.001 for respective comparisons. Abbreviations used here are, GSH—reduced glutathione, and GSSG—oxidized glutathione.</p>
Full article ">Figure 4
<p><b>Longitudinal changes in glycemic parameters</b>. The measured data for (<b>a</b>) 8-OHdG, (<b>b</b>) fasting glucose, (<b>c</b>) PP glucose, (<b>d</b>) HbA1c, (<b>e</b>) fasting insulin, and (<b>f</b>) PP insulin concentrations from Control, D, and DG groups at α, β, and γ visits are shown here with box and whiskers plots. Mean (black circles for Control, blue for D, and red for DG groups) and IQR of the data are overlaid over the corresponding box plot. The group-wise means at different visits of a group are connected using solid lines with the same color. Significance levels (*) displayed above β, and γ visits denote the comparisons with α visit using permutation tests. Significance levels are * <span class="html-italic">p</span> &lt; 0.05, ** <span class="html-italic">p</span> &lt; 0.01, and *** <span class="html-italic">p</span> &lt; 0.001 for respective comparisons. Abbreviations used here are, 8-OHdG—8-hydroxy-2-deoxy guanosine, PP glucose—postprandial glucose, HbA1c—glycated hemoglobin, PP insulin—postprandial Insulin.</p>
Full article ">Figure 4 Cont.
<p><b>Longitudinal changes in glycemic parameters</b>. The measured data for (<b>a</b>) 8-OHdG, (<b>b</b>) fasting glucose, (<b>c</b>) PP glucose, (<b>d</b>) HbA1c, (<b>e</b>) fasting insulin, and (<b>f</b>) PP insulin concentrations from Control, D, and DG groups at α, β, and γ visits are shown here with box and whiskers plots. Mean (black circles for Control, blue for D, and red for DG groups) and IQR of the data are overlaid over the corresponding box plot. The group-wise means at different visits of a group are connected using solid lines with the same color. Significance levels (*) displayed above β, and γ visits denote the comparisons with α visit using permutation tests. Significance levels are * <span class="html-italic">p</span> &lt; 0.05, ** <span class="html-italic">p</span> &lt; 0.01, and *** <span class="html-italic">p</span> &lt; 0.001 for respective comparisons. Abbreviations used here are, 8-OHdG—8-hydroxy-2-deoxy guanosine, PP glucose—postprandial glucose, HbA1c—glycated hemoglobin, PP insulin—postprandial Insulin.</p>
Full article ">Figure 5
<p><b>The effect size of changes in blood biochemical parameters of elderly diabetic patients.</b> Six-month changes in the biochemical parameters of those in D and DG sub-groups were compared here on a forest plot with effect size and 95% confidence intervals. Effect size (Cohen’s d) calculated between 6-month changes in the concentration of biochemical variables are denoted on the <span class="html-italic">x</span>-axis. The group-wise means of 6-month changes in the concentration of these variables were compared using two-sample permutation tests. The significance of these comparisons is denoted by the p values mentioned to the right of horizontal lines for CI. Significance levels are * <span class="html-italic">p</span> &lt; 0.05, ** <span class="html-italic">p</span> &lt; 0.01, and *** <span class="html-italic">p</span> &lt; 0.001 for respective comparisons.</p>
Full article ">
18 pages, 3415 KiB  
Review
Plant- and Animal-Based Antioxidants’ Structure, Efficacy, Mechanisms, and Applications: A Review
by Edirisinghe Dewage Nalaka Sandun Abeyrathne, Kichang Nam, Xi Huang and Dong Uk Ahn
Antioxidants 2022, 11(5), 1025; https://doi.org/10.3390/antiox11051025 - 23 May 2022
Cited by 71 | Viewed by 7049
Abstract
Antioxidants are compounds that normally prevent lipid and protein oxidation. They play a major role in preventing many adverse conditions in the human body, including inflammation and cancer. Synthetic antioxidants are widely used in the food industry to prevent the production of adverse [...] Read more.
Antioxidants are compounds that normally prevent lipid and protein oxidation. They play a major role in preventing many adverse conditions in the human body, including inflammation and cancer. Synthetic antioxidants are widely used in the food industry to prevent the production of adverse compounds that harm humans. However, plant- and animal-based antioxidants are more appealing to consumers than synthetic antioxidants. Plant-based antioxidants are mainly phenolic compounds, carotenoids, and vitamins, while animal-based antioxidants are mainly whole protein or the peptides of meat, fish, egg, milk, and plant proteins. Plant-based antioxidants mainly consist of aromatic rings, while animal-based antioxidants mainly consist of amino acids. The phenolic compounds and peptides act differently in preventing oxidation and can be used in the food and pharmaceutical industries. Therefore, compared with animal-based antioxidants, plant-based compounds are more practical in the food industry. Even though plant-based antioxidant compounds are good sources of antioxidants, animal-based peptides (individual peptides) cannot be considered antioxidant compounds to add to food. However, they can be considered an ingredient that will enhance the antioxidant capacity. This review mainly compares plant- and animal-based antioxidants’ structure, efficacy, mechanisms, and applications. Full article
(This article belongs to the Section Extraction and Industrial Applications of Antioxidants)
Show Figures

Graphical abstract

Graphical abstract
Full article ">Figure 1
<p>Plant phenolic compound breakdown. This Figure is reproduced from ref. [<a href="#B23-antioxidants-11-01025" class="html-bibr">23</a>]. Copyright 2019 (Dirimanov &amp; Högger, 2019).</p>
Full article ">Figure 2
<p>Common phenolic acids found in food plants.</p>
Full article ">Figure 3
<p>Chemical structures of common flavonoids.</p>
Full article ">Figure 4
<p>Chemical structure of stilbene and its derivatives.</p>
Full article ">Figure 5
<p>Structure of sesamol, sesamin, and sesamolin. This Figure is reproduced from ref. [<a href="#B34-antioxidants-11-01025" class="html-bibr">34</a>]. Copyright 2016 Wiley.</p>
Full article ">Figure 6
<p>Structure of different classes of terpenoids.</p>
Full article ">Figure 7
<p>Structure of Tannic acid.</p>
Full article ">Figure 8
<p>Structure of Theaflavin and Thearubigin in black tea.</p>
Full article ">Figure 9
<p>Different chemical structures of catechins found in green tea.</p>
Full article ">
16 pages, 7936 KiB  
Article
Alginate-Chitosan Coated Nanoliposomes as Effective Delivery Systems for Bamboo Leaf Flavonoids: Characterization, In Vitro Release, Skin Permeation and Anti-Senescence Activity
by Yanpei Gu, Zhenlei Zhao, Fan Xue and Ying Zhang
Antioxidants 2022, 11(5), 1024; https://doi.org/10.3390/antiox11051024 - 23 May 2022
Cited by 13 | Viewed by 2894
Abstract
The use of bamboo leaf flavonoids (BLF) as functional food and cosmetic ingredients is limited by low bioavailability and difficulty in being absorbed by the intestine or skin. The aim of this study was to prepare BLF-loaded alginate-chitosan coated nanoliposomes (AL-CH-BLF-Lip) to overcome [...] Read more.
The use of bamboo leaf flavonoids (BLF) as functional food and cosmetic ingredients is limited by low bioavailability and difficulty in being absorbed by the intestine or skin. The aim of this study was to prepare BLF-loaded alginate-chitosan coated nanoliposomes (AL-CH-BLF-Lip) to overcome these challenges. The nanocarriers were characterized by dynamic light scattering, high performance liquid chromatography, Fourier transform infrared spectroscopy and differential scanning calorimetry. The biological activity was analyzed by in vitro antioxidant activity, transdermal absorption, cytotoxicity and AAPH induced HaCaT cell senescence model. The results showed that the size of nanocarriers ranged from 152.13 to 228.90 nm and had a low polydispersity index (0.25–0.36). Chitosan (CH) and alginate (AL) were successfully coated on BLF-loaded nanoliposomes (BLF-Lip), the encapsulation efficiency of BLF-Lip, BLF-loaded chitosan coated nanoliposomes (CH-BLF-Lip) and AL-CH-BLF-Lip were 71.31%, 78.77% and 82.74%, respectively. In addition, BLF-Lip, CH-BLF-Lip and AL-CH-BLF-Lip showed better in vitro release and free radical scavenging ability compared with naked BLF. In particular, the skin permeability of BLF-Lip, CH-BLF-Lip, and AL-CH-BLF-Lip increased 2.1, 2.4 and 2.9 times after 24 h, respectively. Furthermore, the use of nanoliposomes could significantly improve the anti-senescence activity of BLF (p < 0.01). Conclusively, alginate-chitosan coated nanoliposomes are promising delivery systems for BLF that can be used in functional foods and cosmetics. Full article
(This article belongs to the Special Issue Dietary Antioxidants and Cosmetics)
Show Figures

Figure 1

Figure 1
<p>Fourier transform infrared (FTIR) spectra of bamboo leaf flavonoids (BLF), BLF−loaded nanoliposomes (BLF−Lip), chitosan (CH), alginate (AL) and BLF−loaded chitosan coated nanoliposomes (CH−BLF−Lip) and BLF−loaded alginate-chitosan coated nanoliposomes (AL−CH−BLF−Lip).</p>
Full article ">Figure 2
<p>DSC analysis. BLF-Lip, Tc, Phase transition temperature; ΔH, Enthalpy variation. BLF-Lip, BLF-loaded nanoliposomes; CH-BLF-Lip, BLF-loaded chitosan coated nanoliposomes; AL-CH-BLF-Lip, BLF-loaded alginate-chitosan coated nanoliposomes.</p>
Full article ">Figure 3
<p>Illustration of the electrostatic deposition of chitosan and alginate layer onto the surface of nanoliposomes. BLF-Lip, BLF-loaded nanoliposomes; CH-BLF-Lip, BLF-loaded chitosan coated nanoliposomes; AL-CH-BLF-Lip, BLF-loaded alginate-chitosan coated nanoliposomes.</p>
Full article ">Figure 4
<p>(<b>A</b>) ABTS radical scavenging capacity. (<b>B</b>) DPPH radical scavenging capacity. Data are presented as mean ± SD of three independent replications, ** <span class="html-italic">p</span> &lt; 0.01 vs. BLF group. BLF, bamboo leaf flavonoids; BLF-Lip, BLF-loaded nanoliposomes; CH-BLF-Lip, BLF-loaded chitosan coated nanoliposomes; AL-CH-BLF-Lip, BLF-loaded alginate-chitosan coated nanoliposomes.</p>
Full article ">Figure 5
<p>In vitro release behavior of naked BLF and BLF releasing from different BLF-loaded nanoliposomes. Data were presented as mean ± SD of three independent replications. BLF, bamboo leaf flavonoids; BLF-Lip, BLF-loaded nanoliposomes; CH-BLF-Lip, BLF-loaded chitosan coated nanoliposomes; AL-CH-BLF-Lip, BLF-loaded alginate-chitosan coated nanoliposomes.</p>
Full article ">Figure 6
<p>In vitro skin penetration of naked BLF and BLF releasing from different BLF-loaded nanoliposomes. Data were presented as mean ± SD of three independent replications. BLF, bamboo leaf flavonoids; BLF-Lip, BLF-loaded nanoliposomes; CH-BLF-Lip, BLF-loaded chitosan coated nanoliposomes; AL-CH-BLF-Lip, BLF-loaded alginate-chitosan coated nanoliposomes.</p>
Full article ">Figure 7
<p>(<b>A</b>) The cytotoxicity at different concentrations (10–160 μg/mL BLF) of naked BLF and different BLF-loaded nanoliposomes in HaCaT cells. (<b>B</b>) The restoration effect of naked BLF and different BLF-loaded nanoliposomes (10 μg/mL BLF) on the inhibition of proliferation induced by AAPH in HaCaT cells. Data were presented as mean ± SD of three independent replications. ** <span class="html-italic">p</span> &lt; 0.01 vs. AAPH group, # <span class="html-italic">p</span> &lt; 0.05, ## <span class="html-italic">p</span> &lt; 0.01 vs. AAPH + BLF group. BLF, bamboo leaf flavonoids; BLF-Lip, BLF-loaded nanoliposomes; CH-BLF-Lip, BLF-loaded chitosan coated nanoliposomes; AL-CH-BLF-Lip, BLF-loaded alginate-chitosan coated nanoliposomes; AAPH, 2,2′-Azobis (2-methylpropionamidine) dihydrochloride.</p>
Full article ">Figure 8
<p>Representative images of SAHF formation. Scale bar = 10 μm. The percentage of SAHF positive cells was shown below. Data were presented as mean ± SD of three independent replications. ** <span class="html-italic">p</span> &lt; 0.01 vs. AAPH group, ## <span class="html-italic">p</span> &lt; 0.01 vs. AAPH + BLF group. BLF, bamboo leaf flavonoids; BLF-Lip, BLF-loaded nanoliposomes; CH-BLF-Lip, BLF-loaded chitosan coated nanoliposomes; AL-CH-BLF-Lip, BLF-loaded alginate-chitosan coated nanoliposomes; AAPH, 2,2′-Azobis (2-methylpropionamidine) dihydrochloride.</p>
Full article ">Figure 9
<p>Protein expression of p16 (<b>A</b>), p21(<b>B</b>), and K9M-H3 (<b>C</b>) determined by western blotting. Quantitation was shown on the right. Data were presented as mean ± SD of three independent replications. ** <span class="html-italic">p</span> &lt; 0.01 vs. AAPH treated group. # <span class="html-italic">p</span> &lt; 0.05, ## <span class="html-italic">p</span> &lt; 0.01 vs. AAPH + BLF treated group. NS, no significant difference.</p>
Full article ">
18 pages, 6673 KiB  
Article
β-Sitosterol Glucoside-Loaded Nanosystem Ameliorates Insulin Resistance and Oxidative Stress in Streptozotocin-Induced Diabetic Rats
by Sherif M. Afifi, Naglaa M. Ammar, Rabab Kamel, Tuba Esatbeyoglu and Heba A. Hassan
Antioxidants 2022, 11(5), 1023; https://doi.org/10.3390/antiox11051023 - 22 May 2022
Cited by 9 | Viewed by 3282
Abstract
β-Sitosterol glucoside (SG), isolated from Senecio petasitis (Family Asteraceae), was loaded in self-nanoemulsifying drug delivery systems (SEDDS) in a trial to enhance its solubility and biological effect. Various co-surfactants were tested to prepare a successful SEDDS. The selected SG-loaded SEDDS had a [...] Read more.
β-Sitosterol glucoside (SG), isolated from Senecio petasitis (Family Asteraceae), was loaded in self-nanoemulsifying drug delivery systems (SEDDS) in a trial to enhance its solubility and biological effect. Various co-surfactants were tested to prepare a successful SEDDS. The selected SG-loaded SEDDS had a droplet size of 134 ± 15.2 nm with a homogenous distribution (polydispersity index 0.296 ± 0.02). It also demonstrated a significant augmentation of SG in vitro release by 4-fold compared to the free drug suspension. The in vivo insulin sensitivity and antidiabetic effect of the prepared SG-loaded SEDDS were further assessed in streptozotocin-induced hyperglycemic rats. The hypoglycemic effect of SG-loaded nanosystem was evidenced by decreased serum glucose and insulin by 63.22% and 53.11%, respectively. Homeostasis model assessment-insulin resistance (HOMA-IR) index demonstrated a significant reduction by 5.4-fold in the diabetic group treated by SG-loaded nanosystem and exhibited reduced glucagon level by 40.85%. In addition, treatment with SG-loaded nanosystem significantly decreased serum MDA (malondialdehyde) and increased catalase levels by 38.31% and 64.45%, respectively. Histopathological investigations also supported the protective effect of SG-loaded nanosystem on the pancreas. The promising ability of SG-loaded nanosystem to ameliorate insulin resistance, protect against oxidative stress, and restore pancreatic β-cell secretory function warrants its inclusion in further studies during diabetes progression. Full article
(This article belongs to the Special Issue Applications of Antioxidant Nanoparticles)
Show Figures

Figure 1

Figure 1
<p>Particle size of the selected drug-loaded SEDDS.</p>
Full article ">Figure 2
<p>Zeta potential value of the selected drug-loaded SEDDS.</p>
Full article ">Figure 3
<p>In vitro release study of the drug from the prepared SEDDS compared to the drug suspension.</p>
Full article ">Figure 4
<p>Transmission electron microscopy (TEM) photograph of the tested drug-loaded SEDDS.</p>
Full article ">Figure 5
<p>Effect of <span class="html-italic">β</span>-sitosterol glucoside on body weight (<b>A</b>) and blood glucose level (<b>B</b>) in STZ-induced diabetic rats. Each value denotes mean ± SEM (<span class="html-italic">n</span> = 6). Statistical analysis was carried out by one-way ANOVA followed by Tukey’s post-hoc test. <sup>a</sup> significantly different from normal control. <sup>b</sup> significantly different from diabetic control at <span class="html-italic">p</span> &lt; 0.05.</p>
Full article ">Figure 6
<p>Effect of <span class="html-italic">β</span>-sitosterol glucoside on serum insulin (<b>A</b>), HOMA- IR (<b>B</b>), and ITT (<b>C</b>) in STZ-induced diabetic rats. Each value denotes mean ± SEM (<span class="html-italic">n</span> = 6). Statistical analysis was carried out by one-way ANOVA followed by Tukey’s post-hoc test. <sup>a</sup> significantly different from normal control. <sup>b</sup> significantly different from diabetic control at <span class="html-italic">p</span> &lt; 0.05. * significantly different from diabetic control at <span class="html-italic">p</span> &lt; 0.05 for ITT.</p>
Full article ">Figure 7
<p>Effect of <span class="html-italic">β</span>-sitosterol glucoside on MDA (<b>A</b>), catalase (<b>B</b>), and glucagon levels (<b>C</b>) in STZ-induced diabetic rats. Each value denotes mean ± SEM (<span class="html-italic">n</span> = 6). Statistical analysis was carried out by one-way ANOVA followed by Tukey’s post-hoc test. <sup>a</sup> significantly different from normal control. <sup>b</sup> significantly different from diabetic control at <span class="html-italic">p</span> &lt; 0.05.</p>
Full article ">Figure 8
<p>Histopathology of rat pancreatic tissue stained with hematoxylin and eosin determined by light electric microscopy (×40); (<b>A</b>): normal control revealing normal histological structure of cells; (<b>B</b>): diabetic control demonstrated atrophy (Black arrows), oedema (Blue arrows), and a drastic decrease in the number of the islets of Langerhans cells; (<b>C</b>): diabetic + drug suspension exhibited a remarkable recovery; (<b>D</b>): diabetic + unmedicated nanosystem resulted in atrophy (Black arrows) and regression in the size contour of the islets of Langerhans cells; and (<b>E</b>): diabetic + medicated nanosystem, revealing no histopathological alteration in the islets of Langerhans cells compared to normal control.</p>
Full article ">
13 pages, 12148 KiB  
Article
Cerebral Oxidative Stress in Early Alzheimer’s Disease Evaluated by 64Cu-ATSM PET/MRI: A Preliminary Study
by Hidehiko Okazawa, Masamichi Ikawa, Tetsuya Tsujikawa, Tetsuya Mori, Akira Makino, Yasushi Kiyono, Yasunari Nakamoto, Hirotaka Kosaka and Makoto Yoneda
Antioxidants 2022, 11(5), 1022; https://doi.org/10.3390/antiox11051022 - 22 May 2022
Cited by 9 | Viewed by 2645
Abstract
Oxidative stress imaging using diacetyl-bis (N4-methylthiosemicarbazone) (Cu-ATSM) was applied to the evaluation of patients with early Alzheimer’s disease (eAD). Ten eAD patients (72 ± 9 years) and 10 age-matched healthy controls (HCs) (73 ± 9 years) participated in this study. [...] Read more.
Oxidative stress imaging using diacetyl-bis (N4-methylthiosemicarbazone) (Cu-ATSM) was applied to the evaluation of patients with early Alzheimer’s disease (eAD). Ten eAD patients (72 ± 9 years) and 10 age-matched healthy controls (HCs) (73 ± 9 years) participated in this study. They underwent dynamic PET/MRI using 11C-PiB and 64Cu-ATSM with multiple MRI sequences. To evaluate cerebral oxidative stress, three parameters of 64Cu-ATSM PET were compared: standardized uptake value (SUV), tracer influx rate (Kin), and a rate constant k3. The input functions were estimated by the image-derived input function method. The relative differences were analyzed by statistical parametric mapping (SPM) using SUV and Kin images. All eAD patients had positive and HC subjects had negative PiB accumulation, and MMSE scores were significantly different between them. The 64Cu-ATSM accumulation tended to be higher in eAD than in HCs for both SUV and Kin. When comparing absolute values, eAD patients had a greater Kin in the posterior cingulate cortex and a greater k3 in the hippocampus compared with lobar cortical values of HCs. In SPM analysis, eAD had an increased left operculum and decreased bilateral hippocampus and anterior cingulate cortex compared to HCs. 64Cu-ATSM PET/MRI and tracer kinetic analysis elucidated cerebral oxidative stress in the eAD patients, particularly in the cingulate cortex and hippocampus. Full article
Show Figures

Figure 1

Figure 1
<p>Kinetic model of <sup>64</sup>Cu-ATSM. <sup>64</sup>Cu(II) is reduced to <sup>64</sup>Cu(I) and irreversibly dissociated from ATSM chelate. Therefore, the 1-tissue compartment 3-parameter model represents the tracer kinetics well.</p>
Full article ">Figure 2
<p>An example of ROIs for frontal (blue), temporal (green), parietal (magenta), and occipital (red) lobes, hippocampus (orange) and posterior cingulate cortex (gray) drawn in a single subject.</p>
Full article ">Figure 3
<p>Representative images of HCs (<b>A</b>) and eAD (<b>B</b>) for SUV and K<sub>in</sub> (mL/min/100 g) PET image (left) and fusion image (right). The right end column shows sagittal view of SUV (top two rows) and K<sub>in</sub> (bottom two rows). The left end column shows T1WI-MRI of identical slice location. Note accumulations of the PCC and hippocampus are elevated in eAD patients compared with HCs.</p>
Full article ">Figure 3 Cont.
<p>Representative images of HCs (<b>A</b>) and eAD (<b>B</b>) for SUV and K<sub>in</sub> (mL/min/100 g) PET image (left) and fusion image (right). The right end column shows sagittal view of SUV (top two rows) and K<sub>in</sub> (bottom two rows). The left end column shows T1WI-MRI of identical slice location. Note accumulations of the PCC and hippocampus are elevated in eAD patients compared with HCs.</p>
Full article ">Figure 4
<p>(<b>A</b>) The whole arterial blood radioactivity concentration was estimated by the IDIF method (circle), which was then corrected to the real input function (x and solid line) by the undissociated rate of <sup>64</sup>Cu-ATSM (insert) [<a href="#B11-antioxidants-11-01022" class="html-bibr">11</a>]. (<b>B</b>) The Patlak plot calculated from the corrected IDIF (C<sub>p</sub>) and cerebral tissue counts (C<sub>t</sub>) shows good linearity in the later phase of <sup>64</sup>Cu-ATSM PET scan (slope: 0.032, <span class="html-italic">r</span><sup>2</sup> = 0.994). The slope represents K<sub>in</sub> value. (<b>C</b>) Representative NLS fitting based on two-tissue compartment three-parameter model. The fitting provides an estimate of k<sub>3</sub>.</p>
Full article ">Figure 4 Cont.
<p>(<b>A</b>) The whole arterial blood radioactivity concentration was estimated by the IDIF method (circle), which was then corrected to the real input function (x and solid line) by the undissociated rate of <sup>64</sup>Cu-ATSM (insert) [<a href="#B11-antioxidants-11-01022" class="html-bibr">11</a>]. (<b>B</b>) The Patlak plot calculated from the corrected IDIF (C<sub>p</sub>) and cerebral tissue counts (C<sub>t</sub>) shows good linearity in the later phase of <sup>64</sup>Cu-ATSM PET scan (slope: 0.032, <span class="html-italic">r</span><sup>2</sup> = 0.994). The slope represents K<sub>in</sub> value. (<b>C</b>) Representative NLS fitting based on two-tissue compartment three-parameter model. The fitting provides an estimate of k<sub>3</sub>.</p>
Full article ">Figure 5
<p>Mean values of regional K<sub>in</sub> (mL/min/100 g) (<b>A</b>), k<sub>3</sub> (×10<sup>2</sup> /min) (<b>B</b>), and K<sub>1</sub> (mL/min/100 g) (<b>C</b>) obtained by the manual ROIs method. K<sub>in</sub> of eAD (gray) in the PCC region was significantly greater than those of the frontal and parietal regions in HCs (white) (* <span class="html-italic">p</span> &lt; 0.05). On the other hand, k<sub>3</sub> of eAD in the hippocampus was greater than other cortical values of HCs (* <span class="html-italic">p</span> &lt; 0.05), particularly in the parietal region (<sup>†</sup> <span class="html-italic">p</span> &lt; 0.01). K1 in the hippocampus showed significant decreases for both groups (<sup>†</sup> <span class="html-italic">p</span> &lt; 0.01) compared with the frontal and parietal regions including PCC. SUV did not show regional differences (see <a href="#antioxidants-11-01022-t002" class="html-table">Table 2</a>).</p>
Full article ">Figure 6
<p>SPM analysis showed regional differences between eAD and HCs. (<b>A</b>) HC minus eAD (SUV) showed regional reductions of eAD in ACC and bilateral hippocampus. (<b>B</b>) eAD minus HC (K<sub>in</sub>) showed a regional increase in left central operculum of eAD.</p>
Full article ">
29 pages, 901 KiB  
Review
Physiological and Clinical Aspects of Bioactive Peptides from Marine Animals
by Sukwasa Chakniramol, Andreas Wierschem, Man-Gi Cho and Khawaja Muhammad Imran Bashir
Antioxidants 2022, 11(5), 1021; https://doi.org/10.3390/antiox11051021 - 22 May 2022
Cited by 13 | Viewed by 3126
Abstract
Biological molecules in nutraceuticals and functional foods have proven physiological properties to treat human chronic diseases. These molecules contribute to applications in the food and pharmaceutical industries by preventing food spoilage and cellular injury. Technological advancement in the screening and characterization of bioactive [...] Read more.
Biological molecules in nutraceuticals and functional foods have proven physiological properties to treat human chronic diseases. These molecules contribute to applications in the food and pharmaceutical industries by preventing food spoilage and cellular injury. Technological advancement in the screening and characterization of bioactive peptides has enabled scientists to understand the associated molecules. Consistent collaboration among nutritionists, pharmacists, food scientists, and bioengineers to find new bioactive compounds with higher therapeutic potential against nutrition-related diseases highlights the potential of the bioactive peptides for food and pharmaceutic industries. Among the popular dietary supplements, marine animals have always been considered imperative due to their rich nutritional values and byproduct use in the food and pharmaceutical industries. The bioactive peptides isolated from marine animals are well-known for their higher bioactivities against human diseases. The physiological properties of fish-based hydrolyzed proteins and peptides have been claimed through in vitro, in vivo, and clinical trials. However, systematic study on the physiological and clinical significance of these bioactive peptides is scarce. In this review, we not only discuss the physiological and clinical significance of antioxidant and anticancer peptides derived from marine animals, but we also compare their biological activities through existing in vitro and in vivo studies. Full article
(This article belongs to the Section Health Outcomes of Antioxidants and Oxidative Stress)
Show Figures

Figure 1

Figure 1
<p>Current methods of producing marine animal-based protein hydrolysates and peptides.</p>
Full article ">Figure 2
<p>Schematic diagram of search strategy.</p>
Full article ">
21 pages, 6600 KiB  
Article
Evaluation of Antioxidant Capacity and Gut Microbiota Modulatory Effects of Different Kinds of Berries
by Jiebiao Chen, Yichen Shu, Yanhong Chen, Zhiwei Ge, Changfeng Zhang, Jinping Cao, Xian Li, Yue Wang and Chongde Sun
Antioxidants 2022, 11(5), 1020; https://doi.org/10.3390/antiox11051020 - 22 May 2022
Cited by 17 | Viewed by 4426
Abstract
Berries are fairly favored by consumers. Phenolic compounds are the major phytochemicals in berries, among which anthocyanins are one of the most studied. Phenolic compounds are reported to have prebiotic-like effects. In the present study, we identified the anthocyanin profiles, evaluated and compared [...] Read more.
Berries are fairly favored by consumers. Phenolic compounds are the major phytochemicals in berries, among which anthocyanins are one of the most studied. Phenolic compounds are reported to have prebiotic-like effects. In the present study, we identified the anthocyanin profiles, evaluated and compared the antioxidant capacities and gut microbiota modulatory effects of nine common berries, namely blackberry, black goji berry, blueberry, mulberry, red Chinese bayberry, raspberry, red goji berry, strawberry and white Chinese bayberry. Anthocyanin profiles were identified by UPLC-Triple-TOF/MS. In vitro antioxidant capacity was evaluated by four chemical assays (DPPH, ABTS, FRAP and ORAC). In vivo antioxidant capacity and gut microbiota modulatory effects evaluation was carried out by treating healthy mice with different berry extracts for two weeks. The results show that most berries could improve internal antioxidant status, reflected by elevated serum or colonic T-AOC, GSH, T-SOD, CAT, and GSH-PX levels, as well as decreased MDA content. All berries significantly altered the gut microbiota composition. The modulatory effects of the berries were much the same, namely by the enrichment of beneficial SCFAs-producing bacteria and the inhibition of potentially harmful bacteria. Our study shed light on the gut microbiota modulatory effect of different berries and may offer consumers useful consumption guidance. Full article
(This article belongs to the Special Issue Antioxidants in Fruits and Vegetables)
Show Figures

Figure 1

Figure 1
<p>Fruit materials and berry anthocyanin profiles. (<b>a</b>) Berries studied in the present research. (<b>b</b>) UPLC chromatogram of anthocyanin profiles identified in different kinds of berry extract (λ = 520 nm). These are as follows: 1: Dp-3-<span class="html-italic">O</span>-hex; 2: Cy-3-<span class="html-italic">O</span>-sop; 3: Cy-3-<span class="html-italic">O</span>-2G-glucosylrutinoside; 4: Cy-3-<span class="html-italic">O</span>-glc; 5: Cy-3-<span class="html-italic">O</span>-rut; 6: Pet-3-<span class="html-italic">O</span>-hex; 7: Pel-3-<span class="html-italic">O</span>-glc; 8: Cy-3-<span class="html-italic">O</span>-ara; 9: Pel-3-<span class="html-italic">O</span>-rut; 10: Pet-3-<span class="html-italic">O</span>-ara and Peo-3-<span class="html-italic">O</span>-hex; 11: <span class="html-italic">N</span>,<span class="html-italic">N</span>′-dicaffeoylspermidine; 12: Cy-3-<span class="html-italic">O</span>-xyl; 13: Mv-3-<span class="html-italic">O</span>-gal; 14: Mv-3-<span class="html-italic">O</span>-glc; 15: Cy-3-<span class="html-italic">O</span>-(6-<span class="html-italic">O</span>-malonyl-β-<span class="html-small-caps">d</span>)-glc; 16: Mv-3-<span class="html-italic">O</span>-ara; 17: Cy-3-<span class="html-italic">O</span>-dioxalylglucoside; 18: Dp-3-<span class="html-italic">O</span>-rut(<span class="html-italic">trans</span>-<span class="html-italic">p</span>-coumaroyl)-5-<span class="html-italic">O</span>-glc; 19: Pel-3-<span class="html-italic">O</span>-malonylglucoside; 20: Pet-3-<span class="html-italic">O</span>-rut(<span class="html-italic">cis</span>-<span class="html-italic">p</span>-coumaroyl)-5-<span class="html-italic">O</span>-glc or Pet-3-<span class="html-italic">O</span>-rut(<span class="html-italic">trans</span>-<span class="html-italic">p</span>-coumaroyl)-5-<span class="html-italic">O</span>-glc. Abbreviations: dp: delphinidin; cy: cyanidin; pet: petunidin; pel: pelargonidin; peo: peonidin; mv: malvidin; hex: hexoside; sop: sophoroside; glc: glucoside; rut: rutinoside; ara: arabinoside; xyl: xyloside; gal: galactoside.</p>
Full article ">Figure 2
<p>Evaluation of in vitro and in vivo antioxidant capacities of different kinds of berries. (<b>a</b>) Antioxidant capacities evaluation of different kinds of berry extract based on DPPH, ABTS, FRAP and ORAC. All samples were analyzed in triplicate. Error bars were expressed as mean ± SEM. Statistical significance was determined by one-way ANOVA with Turkey tests for multiple-group comparisons. Different letters mean significant difference between the groups (<span class="html-italic">p</span> &lt; 0.05). (<b>b</b>) Influence of berry extracts on the physical condition and (<b>c</b>) antioxidant capacities of healthy objects. Error bars were expressed as mean ± SEM (n = 7/group). Statistical significance was determined by Mann-Whitney <span class="html-italic">U</span> test for two groups comparisons. *, compared with control group. *, <span class="html-italic">p</span> &lt; 0.05; **, <span class="html-italic">p</span> &lt; 0.01.</p>
Full article ">Figure 3
<p>Administration of berries extracts significantly altered the gut microbiota composition. (<b>a</b>) Principal coordinate analysis (PCoA) plot based on Unweighted UniFrac matrix of the gut microbiota composition at the OTU level from different groups (n = 7/group). Pairwise comparisons using the permutational multivariate analysis of variance (PERMANOVA) test. (<b>b</b>) Alpha diversity analysis of gut bacterial richness (sobs, ace and chao indices) and diversity (Shannon index) from different mouse groups (n = 7/group), statistical significance was determined by Mann-Whitney <span class="html-italic">U</span> test for two groups comparisons. *, compared with control group. *, <span class="html-italic">p</span> &lt; 0.05; **, <span class="html-italic">p</span> &lt; 0.01.</p>
Full article ">Figure 4
<p>Bacterial taxonomic profiling at the (<b>a</b>) phylum level and (<b>b</b>) genus level of gut bacteria from different mouse groups (n = 7/group).</p>
Full article ">Figure 5
<p>LEfSe analysis for differential abundant taxa detected between control group and each berry group. Threshold parameters were set as <span class="html-italic">p</span> = 0.05 for the Mann-Whitney <span class="html-italic">U</span> test. Linear discriminant analysis (LDA) score was &gt;2.0.</p>
Full article ">Figure 6
<p>The relative abundance of top 15 genera with significant difference compared with control group in each berry group. Statistical significance was determined by Mann-Whitney <span class="html-italic">U</span> test for two groups comparisons. *, compared with control group. *, <span class="html-italic">p</span> &lt; 0.05; **, <span class="html-italic">p</span> &lt; 0.01. (n = 7/group).</p>
Full article ">Figure 7
<p>Heatmap of the bacterial species significantly altered by each berry administration. Statistical significance was determined by Mann-Whitney <span class="html-italic">U</span> test for two groups comparisons. *, compared with control group. *, <span class="html-italic">p</span> &lt; 0.05; **, <span class="html-italic">p</span> &lt; 0.01. (n = 7/group).</p>
Full article ">
13 pages, 2405 KiB  
Article
Resveratrol Treatment Induces Mito-miRNome Modification in Follicular Fluid from Aged Women with a Poor Prognosis for In Vitro Fertilization Cycles
by Rosalia Battaglia, Angela Caponnetto, Anna Maria Caringella, Anna Cortone, Carmen Ferrara, Salvatore Smirni, Rossana Iannitti, Michele Purrello, Giuseppe D’Amato, Bernard Fioretti and Cinzia Di Pietro
Antioxidants 2022, 11(5), 1019; https://doi.org/10.3390/antiox11051019 - 21 May 2022
Cited by 15 | Viewed by 3568
Abstract
Advanced maternal age impairs reproductive performance, influencing the quantity and the quality of oocytes. Mitochondria dysfunction seems to play a decisive role in conditioning the quality of the female gamete. Different in vitro and in vivo studies, demonstrated the antioxidant and anti-inflammatory activities [...] Read more.
Advanced maternal age impairs reproductive performance, influencing the quantity and the quality of oocytes. Mitochondria dysfunction seems to play a decisive role in conditioning the quality of the female gamete. Different in vitro and in vivo studies, demonstrated the antioxidant and anti-inflammatory activities of Resveratrol and its ability to improve mitochondria function even if the exact mechanism of action has not yet been demonstrated in human oocytes. In this paper, by retrospective analysis, we evaluated follicular fluid (FF) miRNome modification in aged women with a poor ovarian reserve receiving a resveratrol-based supplement the three months before the in vitro Fertilization (IVF) cycle. We found 13 differentially expressed microRNAs (miRNAs) in women treated with resveratrol and specifically miR-125b-5p, miR-132-3p, miR-19a-3p, miR-30a-5p and miR-660-5p, regulating mitochondrial proteins, are able to control metabolism and mitochondrial biogenesis. MiRNA expression differences, observed after resveratrol treatment in FF from women with a poor prognosis for IVF, demonstrated that resveratrol may act on mitomiRNAs to improve follicular microenvironment by transcriptomic and proteomic modifications in granulosa cells. Full article
(This article belongs to the Special Issue Mitochondria Biology in Reproductive Function)
Show Figures

Figure 1

Figure 1
<p>Nanostring miRNA profiling analysis. Volcano plot displaying the differences in fold change (log2FC) of miRNA expression in resveratrol treated FF samples vs. CTRL obtained after data normalization analysis. The <span class="html-italic">x</span>-axis indicates differences in log2FC and the <span class="html-italic">y</span>-axis indicates the −log10 <span class="html-italic">p</span>-value. The horizontal dashed line indicates the threshold for probability of significance (<span class="html-italic">p</span> = 0.05) and the vertical dashed lines set the threshold to 0.5 for the difference in FC of miRNA expression. miRNAs whose expression level is at least 0.5-fold different in resveratrol treated FF samples compared to CTRL, with <span class="html-italic">p</span> &lt; 0.05 corrected for multiple testing by using the Bonferroni method, are indicated by green dots.</p>
Full article ">Figure 2
<p>Relative expression of miRNAs in FF samples. DE miRNA relative expression in resveratrol treated FF samples vs. CTRL is shown by box-and-whisker plots. Expression data are represented as log2normalized counts. Significant <span class="html-italic">p</span>-values corrected for multiple testing by using the Benja-mini-Hochberg method are indicated by &lt;&lt;*&gt;&gt; (* <span class="html-italic">p</span>-value ≤ 0.05).</p>
Full article ">Figure 3
<p>KEGG pathway analysis of DE miRNAs. Functional enrichment analysis of all DE miRNA target genes using KEGG pathway analysis. Log (<span class="html-italic">p</span>-value) is indicated by a yellow-red-coloured key.</p>
Full article ">Figure 4
<p>DE miRNA target genes related to the cellular response to oxidative stress. Regulatory network showing the interaction between miR-125b-5p, miR-132-3p, miR-19a-3p, miR-30a-5p and miR-660-5p and their validated mRNA targets. Orange ellipses represent miRNAs and white rectangles represent mRNA target genes involved in the cellular response to oxidative stress.</p>
Full article ">Figure 5
<p>DE miRNA target genes related to oocyte meiosis. Regulatory network showing the interaction between miR-125b-5p, miR-132-3p, miR-19a-3p, miR-30a-5p, miR-660-5p and their validated mRNA targets. Red ellipses represent miRNAs and white rectangles represent mRNA target genes involved in oocyte meiosis.</p>
Full article ">Figure 6
<p>Impact of Resveratrol supplementation on IVF outcome. (<b>A</b>) Box and whisker plots showing the number (%) of fertilized good quality oocytes (MII) in treated and control groups. Statistically significant <span class="html-italic">p</span>-values (<span class="html-italic">p</span> ≤ 0.05) are indicated by asterisks. (<b>B</b>) Correlation matrix obtained by calculating Pearson correlation coefficients for mitomiR expression (FC) and biochemical pregnancy scores. The correlation values are indicated by a color gradient from green (negative correlation) to red (positive correlation), as shown in the colored bar. Statistically significant <span class="html-italic">p</span>-values (<span class="html-italic">p</span> ≤ 0.05) are indicated by asterisks. (<b>C</b>) Scatterplot on miRNAs tightly correlated and showing the best-fit line obtained from linear regression analysis.</p>
Full article ">
7 pages, 229 KiB  
Editorial
Oxygen Sensing: Physiology and Pathophysiology
by Philip I. Aaronson and Asuncion Rocher
Antioxidants 2022, 11(5), 1018; https://doi.org/10.3390/antiox11051018 - 21 May 2022
Cited by 1 | Viewed by 1887
Abstract
Oxygen is such an essential element for life that multiple mechanisms have evolved to maintain oxygen homeostasis, including those which detect decreases in arterial O2 and generate adaptive responses to hypoxia [...] Full article
(This article belongs to the Special Issue Physiology and Pathophysiology of Oxygen Sensitivity)
22 pages, 1864 KiB  
Article
Unveiling the Phytochemical Profile and Biological Potential of Five Artemisia Species
by Adriana Trifan, Gokhan Zengin, Kouadio Ibrahime Sinan, Elwira Sieniawska, Rafal Sawicki, Magdalena Maciejewska-Turska, Krystyna Skalikca-Woźniak and Simon Vlad Luca
Antioxidants 2022, 11(5), 1017; https://doi.org/10.3390/antiox11051017 - 21 May 2022
Cited by 35 | Viewed by 3609
Abstract
The Artemisia L. genus comprises over 500 species with important medicinal and economic attributes. Our study aimed at providing a comprehensive metabolite profiling and bioactivity assessment of five Artemisia species collected from northeastern Romania (A. absinthium L., A. annua L., A. austriaca [...] Read more.
The Artemisia L. genus comprises over 500 species with important medicinal and economic attributes. Our study aimed at providing a comprehensive metabolite profiling and bioactivity assessment of five Artemisia species collected from northeastern Romania (A. absinthium L., A. annua L., A. austriaca Jacq., A. pontica L. and A. vulgaris L.). Liquid chromatography–tandem high-resolution mass spectrometry (LC-HRMS/MS) analysis of methanol and chloroform extracts obtained from the roots and aerial parts of the plants led to the identification of 15 phenolic acids (mostly hydroxycinnamic acid derivatives), 26 flavonoids (poly-hydroxylated/poly-methoxylated flavone derivatives, present only in the aerial parts), 14 sesquiterpene lactones, 3 coumarins, 1 lignan and 7 fatty acids. Clustered image map (CIM) analysis of the phytochemical profiles revealed that A. annua was similar to A. absinthium and that A. pontica was similar to A. austriaca, whereas A. vulgaris represented a cluster of its own. Correlated with their total phenolic contents, the methanol extracts from both parts of the plants showed the highest antioxidant effects, as assessed by the DPPH and ABTS radical scavenging, CUPRAC, FRAP and total antioxidant capacity methods. Artemisia extracts proved to be promising sources of enzyme inhibitory agents, with the methanol aerial part extracts being the most active samples against acetylcholinesterase and glucosidase. All Artemisia samples displayed good antibacterial effects against Mycobacterium tuberculosis H37Ra, with MIC values of 64–256 mg/L. In conclusion, the investigated Artemisia species proved to be rich sources of bioactives endowed with antioxidant, enzyme inhibitory and anti-mycobacterial properties. Full article
Show Figures

Figure 1

Figure 1
<p>Correlation analysis of the phytochemical composition and biological activities. ABTS, 2,2′-azino-bis (3-ethylbenzothiazoline) 6-sulfonic acid; AChE, acetylcholinesterase; BChE, butyrylcholinesterase; CUPRAC, cupric ion reducing antioxidant capacity; DPPH, 1,1-diphenyl-2-picrylhydrazyl; FRAP, ferric ion reducing antioxidant power; MCA, metal chelating activity; PDA, phosphomolybdenum activity; TPAC, total phenolic acid content; TPC, total phenolic content. Compounds numbered as in <a href="#antioxidants-11-01017-t002" class="html-table">Table 2</a>.</p>
Full article ">Figure 2
<p>Exploratory principal component analysis. (<b>A</b>–<b>C</b>) Contribution of biological activities to the principal components of the PCA. (<b>D</b>–<b>F</b>) Scatter plot showing the distribution of the samples in the factorial plan derived from the three retained principal components.</p>
Full article ">Figure 3
<p>Clustered image map (red color: high bioactivity; blue color: low bioactivity) based on the biological activities dataset.</p>
Full article ">Figure 4
<p>Clustered image map (red color: high bioactivity; blue color: low bioactivity) based on the chemical composition dataset.</p>
Full article ">
15 pages, 2242 KiB  
Article
Taurine Administration Counteracts Aging-Associated Impingement of Skeletal Muscle Regeneration by Reducing Inflammation and Oxidative Stress
by Alessandra Barbiera, Silvia Sorrentino, Damon Fard, Elisa Lepore, Gigliola Sica, Gabriella Dobrowolny, Luca Tamagnone and Bianca Maria Scicchitano
Antioxidants 2022, 11(5), 1016; https://doi.org/10.3390/antiox11051016 - 21 May 2022
Cited by 13 | Viewed by 5587
Abstract
Sarcopenia, which occurs during aging, is characterized by the gradual loss of skeletal muscle mass and function, resulting in a functional decline in physical abilities. Several factors contribute to the onset of sarcopenia, including reduced regenerative capacity, chronic low-grade inflammation, mitochondrial dysfunction, and [...] Read more.
Sarcopenia, which occurs during aging, is characterized by the gradual loss of skeletal muscle mass and function, resulting in a functional decline in physical abilities. Several factors contribute to the onset of sarcopenia, including reduced regenerative capacity, chronic low-grade inflammation, mitochondrial dysfunction, and increased oxidative stress, leading to the activation of catabolic pathways. Physical activity and adequate protein intake are considered effective strategies able to reduce the incidence and severity of sarcopenia by exerting beneficial effects in improving the muscular anabolic response during aging. Taurine is a non-essential amino acid that is highly expressed in mammalian tissues and, particularly, in skeletal muscle where it is involved in the regulation of biological processes and where it acts as an antioxidant and anti-inflammatory factor. Here, we evaluated whether taurine administration in old mice counteracts the physiopathological effects of aging in skeletal muscle. We showed that, in injured muscle, taurine enhances the regenerative process by downregulating the inflammatory response and preserving muscle fiber integrity. Moreover, taurine attenuates ROS production in aged muscles by maintaining a proper cellular redox balance, acting as an antioxidant molecule. Although further studies are needed to better elucidate the molecular mechanisms responsible for the beneficial effect of taurine on skeletal muscle homeostasis, these data demonstrate that taurine administration ameliorates the microenvironment allowing an efficient regenerative process and attenuation of the catabolic pathways related to the onset of sarcopenia. Full article
Show Figures

Figure 1

Figure 1
<p>Taurine administration counteracts aging impingement of skeletal muscle regeneration. (<b>A</b>,<b>B</b>,<b>G</b>,<b>H</b>) Morphological analysis was performed by H&amp;E staining of TA cross-sections derived from uninjured mice (panels a and b) and after CTX injections (panels c and d) in the presence or absence of taurine administration (original magnification ×20). (<b>C</b>) Morphometric analysis of the fiber cross-section area (CSA) of the TA muscles of control and taurine-treated mice after 5 weeks of treatment. (<b>I</b>) Histogram showing the percentage of distribution of the regenerating fiber cross-sectional areas in the injured TA muscles of control and taurine-treated mice after 1 week of regeneration. Regenerating fibers are highlighted by an arrow; necrotic fibers are highlighted by an asterisk. (<b>D</b>) Western blotting analyses of total lysates were achieved to evaluate the expression levels of phospho-mTOR and mTOR. A representative blot is shown. (<b>E</b>) The graph shows the densitometric analysis of the ratio between phospho-mTOR/mTOR levels performed by using a stain-free blot to verify the sample loading. (<b>F</b>) Real-time PCR analysis of FBXO32 levels in the TA muscles of the control and taurine-treated mice. All the values referring to the morphometric analysis were obtained using the ImageJ analysis software. (<b>C</b>,<b>I</b>) Statistical analysis was performed with the Mann–Whitney rank-sum test, *** <span class="html-italic">p</span> &lt; 0.001. (<b>E</b>,<b>F</b>) Statistical analysis was performed using Student’s <span class="html-italic">t</span>-test. * <span class="html-italic">p</span> &lt; 0.05. <span class="html-italic">n</span> ≥ 3 mice per group. Data are represented as mean ± SEM. (<b>E</b>) • and ■ represent samples from Control and Taurine-treated groups, respectively; (<b>F</b>) ■ and▲ represent samples from Control and Taurine-treated groups, respectively.</p>
Full article ">Figure 2
<p>Taurine attenuates inflammatory processes in damaged skeletal muscles of aged mice. (<b>A</b>) Nonspecific esterase staining was performed on transverse cryosections of TA muscles of aged mice (original magnification ×20). Panel a, Control; panel b, Taurine; panel c, CTX; panel d, Taurine+CTX. Inflammatory mononucleated cells are highlighted by an arrow; necrotic fibers are highlighted by an asterisk. (<b>B</b>) Graph values represent the mean ± SEM of the number of inflammatory cells per unit area in muscle cross-sections. (<b>C</b>) Western blotting analyses of total lysates were carried out to evaluate the levels of phospho-NF-kB and NF-kB. A representative blot is shown. (<b>D</b>–<b>F</b>) The graphs show the densitometric analysis of the phospho-NF-kB and NF-kB levels and the phospho-NF-kB/NF-kB ratio, performed by using a stain-free blot to verify the sample loading. Statistical analysis was performed by one-way ANOVA multiple comparisons, * <span class="html-italic">p</span> &lt; 0.05, *** <span class="html-italic">p</span> &lt; 0.001, <span class="html-italic">n</span> = 4 mice per group. Data are represented as mean ± SEM. •, ■, ▲ and ▼ represent samples from control, taurine-, CTX-, taurine+CTX-treated groups.</p>
Full article ">Figure 3
<p>Taurine modulation of PGC1-α, MEF2C, slow-MHC, and fast-MHC expression. (<b>A</b>,<b>B</b>) Real-time PCR analysis of PGC1-α and MEF2C expression in the TA muscles of young and old mice treated with or without taurine. (<b>C</b>,<b>E</b>,<b>G</b>) Western blot analyses of total lysates obtained from TA muscles were carried out to evaluate the expression levels of slow MHC, fast MHC, and MF20. Representative blots are shown. (<b>D</b>,<b>F</b>,<b>H</b>) Densitometric analysis was performed by using a stain-free blot to verify the sample loading. Statistical analysis was performed by one way ANOVA multiple comparison * <span class="html-italic">p</span> &lt; 0.05, *** <span class="html-italic">p</span> &lt; 0.001, **** <span class="html-italic">p</span> &lt; 0.0001, <span class="html-italic">n</span> ≥ 3 mice per group. Data are represented as mean ± SEM. •, ■ and ▲ represent samples from Young, Old, and Old+ taurine groups.</p>
Full article ">Figure 4
<p>Taurine treatment attenuates oxidative stress in old mice. (<b>A</b>) Western blot analyses of total lysates obtained from TA muscles were carried out to evaluate the levels of G6PD and Gp91phox. A representative blot is shown. (<b>B</b>,<b>C</b>) Densitometric analysis was performed using a stain-free blot to verify the loading of the samples. (<b>D</b>–<b>F</b>) Real-time PCR analysis of SOD1, GPX1, and CAT expression in TA muscles treated as indicated above. (<b>G</b>) Western blot analyses of total lysates obtained from TA muscles were carried out to evaluate the levels of SOD1. A representative blot is shown. (<b>H</b>) Densitometric analysis was performed using a stain-free blot to verify the loading of the samples. (<b>I</b>) Immunofluorescence analysis of 4-HNE used as a marker of oxidative stress and slow-MHC expression. (<b>J</b>) Quantification of 4-HNE fluorescence intensity. Statistical analysis was performed using one way ANOVA multiple comparison * <span class="html-italic">p</span> &lt; 0.05, *** <span class="html-italic">p</span> &lt; 0.001, **** <span class="html-italic">p</span> &lt; 0.0001, <span class="html-italic">n</span> ≥ 3 mice per group. Data are represented as mean ± SEM. •, ■ and ▲ represent samples from Young, Old, and Old+ taurine groups.</p>
Full article ">Scheme 1
<p>Graphic representation of the experimental design.</p>
Full article ">
8 pages, 1207 KiB  
Article
Thyroid Disorders in Patients Treated with Dimethyl Fumarate for Multiple Sclerosis: A Retrospective Observational Study
by Cédric O. Renaud, Panos G. Ziros, Amandine Mathias, Caroline Pot and Gerasimos P. Sykiotis
Antioxidants 2022, 11(5), 1015; https://doi.org/10.3390/antiox11051015 - 21 May 2022
Cited by 2 | Viewed by 2827
Abstract
Background: Dimethyl fumarate (DMF), a drug used for the treatment of multiple sclerosis (MS) and psoriasis, has been shown to activate the Keap1/Nrf2 antioxidant response. Nrf2 exerts pleiotropic roles in the thyroid gland; among others, single nucleotide polymorphisms (SNPs) in the gene encoding [...] Read more.
Background: Dimethyl fumarate (DMF), a drug used for the treatment of multiple sclerosis (MS) and psoriasis, has been shown to activate the Keap1/Nrf2 antioxidant response. Nrf2 exerts pleiotropic roles in the thyroid gland; among others, single nucleotide polymorphisms (SNPs) in the gene encoding Nrf2 modulate the risk of Hashimoto’s thyroiditis (HT), suggesting that pharmacological activation of Nrf2 might also be protective. However, a patient with acute exacerbation of HT after starting DMF for MS was recently reported, raising questions about the thyroidal safety of Nrf2 activators. Methods: In a retrospective observational study, we investigated the prevalence and incidence of thyroid disorders (TD) among 163 patients with MS treated with DMF. Results: Only 7/163 patients (4.3%) were diagnosed with functional TD; most (5/163, 3.0%) were diagnosed before DMF treatment. Functional TD were diagnosed under or after DMF in only 2 patients (1.2%). Under DMF, one patient developed transient mild hypothyroidism with negative thyroid autoantibodies. After DMF discontinuation, another patient developed hyperthyroidism due to Graves’ disease. No patient developed thyroid structural disease under or after DMF. Conclusions: The very low incidence of functional TD indicates an overall very good thyroid tolerance of DMF, arguing against screening for TD in MS patients considered for or treated with DMF, and supporting the further study of Nrf2 activators for the prevention and treatment of TD. Full article
(This article belongs to the Topic Cellular Redox Homeostasis)
Show Figures

Figure 1

Figure 1
<p>(<b>a</b>) Temporal evolution of thyroid function tests and thyroid autoantibody titers in the patient with GD. Treatments were as follows: beta-1a interferon, 44 mcg 3/week (22.06.2011–24.10.2011. We recommend writing in this format, 22 June 2011.); natalizumab, 300 mg 1/month (04.11.2011–06.02.2014); DMF, 240 mg 2/day (11.03.2014–12.10.2017); teriflunomid, 14 mg/day (28.10.2017–20.07.2018); methylprednisone, 1 g/day (02.05.2018–06.05.2018); and ocrelizumab, 300 mg/6 months (since 28.08.2018); (<b>b</b>) technetium-99m thyroid scintigraphy showing diffusely increased uptake by the thyroid gland (as compared to very low uptake in the salivary glands); and (<b>c</b>) composite ultrasound image of the thyroid gland showing diffuse heterogeneity with alternative isoechoic and hypoechoic areas.</p>
Full article ">
12 pages, 1390 KiB  
Article
Online Extraction–DPPH–HPLC–DAD–QTOF-MS System for Efficient Screening and Identification of Antioxidants from Citrus aurantium L. var. amara (Rutaceae): Integrating Sample Preparation and Antioxidants Profiling
by Yecheng Xiao, Fuhua Fu, Youhe Wei, Shuyun Shi and Yang Shan
Antioxidants 2022, 11(5), 1014; https://doi.org/10.3390/antiox11051014 - 20 May 2022
Cited by 12 | Viewed by 2450
Abstract
The lack of a direct connection between solid edible or medical natural products and bioactive compound profiling is a bottleneck in natural product research and quality control. Here, a novel integrated system, online extraction (OLE)–2,2′-diphenyl-1-picrylhydrazyl (DPPH)–HPLC−DAD−QTOF-MS, was fabricated to extract, screen, and identify [...] Read more.
The lack of a direct connection between solid edible or medical natural products and bioactive compound profiling is a bottleneck in natural product research and quality control. Here, a novel integrated system, online extraction (OLE)–2,2′-diphenyl-1-picrylhydrazyl (DPPH)–HPLC−DAD−QTOF-MS, was fabricated to extract, screen, and identify antioxidants from the whole fruit of Citrus aurantium L. var. amara (CAVA, Rutaceae) simply, rapidly, and efficiently. The system consumes less sample (1.0 mg of CAVA powder) and requires a shorter analytical time (45 min for sample extraction, antioxidants screening, separation, and identification). Eight antioxidant flavonoids were screened and identified, and six available flavanones were sensitively, precisely, and accurately quantified. Two major flavanone glycosides, naringin (50.37 ± 0.43 mg/g) and neohesperidin (38.20 ± 0.27 mg/g), exhibit potent DPPH scavenging activities with IC50 values of 111.9 ± 10.06 and 178.55 ± 11.28 μg/mL. A minor flavanone aglycone, hesperitin (0.73 ± 0.06 mg/g), presents stronger DPPH scavenging activity (IC50, 39.07 ± 2.51 μg/mL). Furthermore, density functional theory calculations demonstrated their electron transport ability and chemical reactivity, which confirmed the screened results. The results indicate that the developed OLE–DPPH–HPLC−DAD−QTOF-MS system provides new perspectives for analysis of antioxidants from complex natural products, which also contribute to the quality evaluation of CAVA. Full article
Show Figures

Graphical abstract

Graphical abstract
Full article ">Figure 1
<p>The diagrammatic drawing of OLE–DPPH–HPLC–DAD–QTOF-MS/MS.</p>
Full article ">Figure 2
<p>(<b>A</b>) HPLC chromatograms at 254 nm for CAVA (20 μL, 11.5 mg/mL) (a) and 1.0 mg of dried CAVA (b); (<b>B</b>) chromatogram of CAVA-based OLE; (<b>C</b>) OLE–DPPH–HPLC chromatogram at 254 nm for CAVA (1.0 mg); (<b>D</b>) total ion current (TIC) chromatogram for CAVA (1.0 mg) in positive ion mode.</p>
Full article ">Figure 3
<p>Structures of potential antioxidants in CAVA.</p>
Full article ">Figure 4
<p>TD-DFT calculations of screened flavonoids.</p>
Full article ">
14 pages, 6201 KiB  
Article
Hot Water Extract of Sasa borealis (Hack.) Makino & Shibata Abate Hydrogen Peroxide-Induced Oxidative Stress and Apoptosis in Kidney Epithelial Cells
by Ilekuttige Priyan Shanura Fernando, Kirinde Gedara Isuru Sandanuwan Kirindage, Arachchige Maheshika Kumari Jayasinghe, Eui Jeong Han, Mawalle Kankanamge Hasitha Madhawa Dias, Kyung Pil Kang, Sung Ig Moon, Tai Sun Shin, Ayeong Ma, Kyungsook Jung and Ginnae Ahn
Antioxidants 2022, 11(5), 1013; https://doi.org/10.3390/antiox11051013 - 20 May 2022
Viewed by 2888
Abstract
Sasa borealis (Hack.) Makino & Shibata or broad-leaf bamboo is famous for its richness of bioactive natural products and its uses in traditional medicine for its anti-inflammatory, diuretic, and antipyretic properties and preventive effects against hypertension, arteriosclerosis, cardiovascular disease, and cancer. The present [...] Read more.
Sasa borealis (Hack.) Makino & Shibata or broad-leaf bamboo is famous for its richness of bioactive natural products and its uses in traditional medicine for its anti-inflammatory, diuretic, and antipyretic properties and preventive effects against hypertension, arteriosclerosis, cardiovascular disease, and cancer. The present study investigated the antioxidant activity of S. borealis hot water extract (SBH) and its effects in ameliorating hydrogen peroxide-induced oxidative stress, using an African green monkey kidney epithelial cell line (Vero). Known polyphenols in SBH were quantified by HPLC analysis. SBH indicated a dose-dependent increase for reducing power, ABTS+ (IC50 = 96.44 ± 0.61 µg/mL) and DPPH (IC50 = 125.78 ± 4.41 µg/mL) radical scavenging activities. SBH markedly reduced intracellular reactive oxygen species (ROS) generation in the Vero cells and increased the protective effects against H2O2-induced oxidative stress by reducing apoptosis. Other than the direct involvement in neutralizing ROS, metabolites in SBH were also found to induce NRF2-mediated production of antioxidant enzymes, HO-1, and NQO1. These findings imply that S. borealis hot water extract can be utilized to create nutraceutical and functional foods that can help to relieve the effects of oxidative stress in both acute and chronic kidney injury. Full article
(This article belongs to the Special Issue Mitochondrial Oxidative Stress in Kidney Injury)
Show Figures

Graphical abstract

Graphical abstract
Full article ">Figure 1
<p>HPLC composition analysis of polyphenols in SBH. Chromatogram of (<b>A</b>) flavonoid reference standard and (<b>B</b>) SBH. Compounds in SBH were separated using a gradient elution program with a mobile phase consisting of 0.1% formic acid in methanol (solvent A) and 0.1% formic acid in water (solvent B) at a flow rate of 0.34 mL/min; (<b>C</b>) Chemical structures of the polyphenols found in SBH.</p>
Full article ">Figure 2
<p>Antioxidant activities of SBH. (<b>A</b>) ABTS<sup>+</sup> radical scavenging; (<b>B</b>) reducing power; (<b>C</b>) DPPH radical scavenging; and (<b>D</b>) oxygen radical absorbance capacity of SBH. Experiments were carried out in triplicate and results were represented as means ± standard deviation (SD) (<span class="html-italic">n</span> = 3). Means denoted by different letters are significantly different at <span class="html-italic">p</span> &lt; 0.05.</p>
Full article ">Figure 3
<p>Cytocompatibility and protective effects of SBH against H<sub>2</sub>O<sub>2</sub>-induced oxidative stress in Vero cells. (<b>A</b>) Effects of SBH on Vero cell viability; Effects of SBH against H<sub>2</sub>O<sub>2</sub>-induced (<b>B</b>) intracellular ROS levels and (<b>C</b>) cell viability; (<b>D</b>) SBH’s effects on H<sub>2</sub>O<sub>2</sub>-induced intracellular ROS levels as studied by fluorescence microscopy. Experiments were carried out in triplicate and results were represented as means ± SD (<span class="html-italic">n</span> = 3). Means denoted by different letters are significantly different at <span class="html-italic">p</span> &lt; 0.05.</p>
Full article ">Figure 4
<p>Effects of SBH in reducing mitochondrial depolarization and anti-apoptotic effects in H<sub>2</sub>O<sub>2</sub>-induced Vero cells. (<b>A</b>) Effects of SBH against H<sub>2</sub>O<sub>2</sub>-induced mitochondrial depolarization; (<b>B</b>) Effects of SBH against H<sub>2</sub>O<sub>2</sub>-induced apoptotic body formation; and (<b>C</b>) reduction of the apoptotic hyperdiploid cell population. Experiments were carried out in triplicate (<span class="html-italic">n</span> = 3) to ensure repeatability.</p>
Full article ">Figure 5
<p>Effects of SBH in mitochondria-mediated apoptosis in H<sub>2</sub>O<sub>2</sub>-induced Vero cells. Experiments were carried out in triplicate and results were represented as means ± SD (<span class="html-italic">n</span> = 3). Means denoted by different letters are significantly different at <span class="html-italic">p</span> &lt; 0.05.</p>
Full article ">Figure 6
<p>Effects of SBH in increasing the activation of Nrf2/HO-1/NQO1 signaling pathway in H<sub>2</sub>O<sub>2</sub>-induced Vero cells. (<b>A</b>) Western blot analysis and (<b>B</b>) immunofluorescence analysis of Nrf2 nuclear translocation. Experiments were carried out in triplicate (<span class="html-italic">n</span> = 3) to ensure repeatability.3.8. SBH suppressed NF-κB and MAPK signaling in H<sub>2</sub>O<sub>2</sub>-induced Vero cells.</p>
Full article ">Figure 7
<p>Effects of SBH in suppressing NF-κB and MAPK signaling in H<sub>2</sub>O<sub>2</sub>-induced Vero cells. Effects of SBH on NF-κB signaling pathway analyzed by (<b>A</b>) Western blot analysis and (<b>B</b>) immunofluorescence analysis of NF-κB p65 nuclear translocation; (<b>C</b>) Western blot analysis of key MAPK signaling molecules. Experiments were carried out in triplicate (<span class="html-italic">n</span> = 3) to ensure repeatability.</p>
Full article ">
8 pages, 706 KiB  
Editorial
Antioxidant Defences and Redox Homeostasis in Animals
by Peter F. Surai and Katie Earle-Payne
Antioxidants 2022, 11(5), 1012; https://doi.org/10.3390/antiox11051012 - 20 May 2022
Cited by 18 | Viewed by 2640
Abstract
For many years reactive oxygen species (ROS) production in biological systems has been considered to be detrimental [...] Full article
(This article belongs to the Special Issue Antioxidant Defences and Redox Homeostasis in Animals)
Show Figures

Figure 1

Figure 1
<p>Hypothetical redox homeostasis and stress-response interaction scheme (adapted from [<a href="#B1-antioxidants-11-01012" class="html-bibr">1</a>,<a href="#B10-antioxidants-11-01012" class="html-bibr">10</a>,<a href="#B11-antioxidants-11-01012" class="html-bibr">11</a>,<a href="#B18-antioxidants-11-01012" class="html-bibr">18</a>,<a href="#B19-antioxidants-11-01012" class="html-bibr">19</a>]. AMPK, AMP-activated protein kinase; ATF6, activating transcription factor 6; ATM, ataxia-telangiectasia-mutated; ATR, ataxia-telangiectasia and Rad 3-related; FOXO, forkhead box protein; HIF, hypoxia inducible factor; HSF, heat shock factor; IRE1, inositol-requiring enzyme 1; NF-κβ, nuclear factor kappa-light-chain-enhancer of activated B cells; Nrf2, nuclear factor erythroid-2 related factor 2; SIRTs, sirtuins.</p>
Full article ">
16 pages, 4929 KiB  
Article
Evolution of Heme Peroxygenases: Ancient Roots and Later Evolved Branches
by Marcel Zámocký and Jana Harichová
Antioxidants 2022, 11(5), 1011; https://doi.org/10.3390/antiox11051011 - 20 May 2022
Cited by 2 | Viewed by 4323
Abstract
We reconstructed the molecular phylogeny of heme containing peroxygenases that are known as very versatile biocatalysts. These oxidoreductases capable of mainly oxyfunctionalizations constitute the peroxidase–peroxygenase superfamily. Our representative reconstruction revealed a high diversity but also well conserved sequence motifs within rather short protein [...] Read more.
We reconstructed the molecular phylogeny of heme containing peroxygenases that are known as very versatile biocatalysts. These oxidoreductases capable of mainly oxyfunctionalizations constitute the peroxidase–peroxygenase superfamily. Our representative reconstruction revealed a high diversity but also well conserved sequence motifs within rather short protein molecules. Corresponding genes coding for heme thiolate peroxidases with peroxygenase activity were detected only among various lower eukaryotes. Most of them originate in the kingdom of fungi. However, it seems to be obvious that these htp genes are present not only among fungal Dikarya but they are distributed also in the clades of Mucoromycota and Chytridiomycota with deep ancient evolutionary origins. Moreover, there is also a distinct clade formed mainly by phytopathogenic Stramenopiles where even HTP sequences from Amoebozoa can be found. The phylogenetically older heme peroxygenases are mostly intracellular, but the later evolution gave a preference for secretory proteins mainly among pathogenic fungi. We also analyzed the conservation of typical structural features within various resolved clades of peroxygenases. The presented output of our phylogenetic analysis may be useful in the rational design of specifically modified peroxygenases for various future biotech applications. Full article
(This article belongs to the Special Issue Dream Peroxygenases)
Show Figures

Graphical abstract

Graphical abstract
Full article ">Figure 1
<p>Global evolutionary tree for the peroxidase–peroxygenase superfamily obtained with the maximum likelihood method within the MEGA X suite [<a href="#B12-antioxidants-11-01011" class="html-bibr">12</a>] by using the Le_Gascuel model of amino acid substitution [<a href="#B14-antioxidants-11-01011" class="html-bibr">14</a>] and 1000 bootstrap replications. Only the distribution of phyla in major grouped clades are shown here schematically. Details of the topology for particular HTP sequences are presented in <a href="#antioxidants-11-01011-f002" class="html-fig">Figure 2</a>.</p>
Full article ">Figure 2
<p>Detailed reconstructed evolutionary tree in circular form for the analyzed 174 sequences of the peroxidase–peroxygenase superfamily obtained with the maximum likelihood method of the MEGA X suite [<a href="#B12-antioxidants-11-01011" class="html-bibr">12</a>]. The Le_Gascuel model of amino acid substitution [<a href="#B14-antioxidants-11-01011" class="html-bibr">14</a>] with gamma-distributed substitution rates and with the presence of invariant sites (LG + G + I) as the statistically best proven model was applied for this reconstruction. Bootstrap analysis was performed with 1000 replications, and only values in the interval 51–100% (majority-rule consensus) are presented next to corresponding branches. All abbreviations of used sequences are listed in <a href="#app1-antioxidants-11-01011" class="html-app">Table S1</a>.</p>
Full article ">Figure 3
<p>Typical gene architecture of (<b>a</b>) mucoromycetous, (<b>b</b>) basidiomycetous, and (<b>c</b>) ascomycetous HTP gene with detection of the core promoter region (labelled green), CCAAT box (cyan), and poly-A site (violet). TSS—transcription start site. Orange—HTP coding regions. The distribution of introns and position of regulatory elements is drawn to scale according to predictions from FGENESH [<a href="#B16-antioxidants-11-01011" class="html-bibr">16</a>].</p>
Full article ">Figure 4
<p>Multiple sequence alignment of 20 selected heme thiolate peroxidases. Only three highly conserved regions from the obtained muscle protein alignment [<a href="#B11-antioxidants-11-01011" class="html-bibr">11</a>] are shown here. Complete sequence alignment in FASTA format is provided in <a href="#app1-antioxidants-11-01011" class="html-app">Figure S1</a>. Regions shown: (<b>a</b>) sequence motif around the proximal ligand of heme; (<b>b</b>) motif with amino acid ligands responsible for the binding of a metal cation; (<b>c</b>) distal site of the prosthetic heme group. Abbreviations of all sequence names are explained in <a href="#app1-antioxidants-11-01011" class="html-app">Table S1</a>, together with their accession numbers in databases. Color scheme: blue &gt; 95%, green &gt; 75%, and yellow &gt; 50% of overall conservation.</p>
Full article ">Figure 4 Cont.
<p>Multiple sequence alignment of 20 selected heme thiolate peroxidases. Only three highly conserved regions from the obtained muscle protein alignment [<a href="#B11-antioxidants-11-01011" class="html-bibr">11</a>] are shown here. Complete sequence alignment in FASTA format is provided in <a href="#app1-antioxidants-11-01011" class="html-app">Figure S1</a>. Regions shown: (<b>a</b>) sequence motif around the proximal ligand of heme; (<b>b</b>) motif with amino acid ligands responsible for the binding of a metal cation; (<b>c</b>) distal site of the prosthetic heme group. Abbreviations of all sequence names are explained in <a href="#app1-antioxidants-11-01011" class="html-app">Table S1</a>, together with their accession numbers in databases. Color scheme: blue &gt; 95%, green &gt; 75%, and yellow &gt; 50% of overall conservation.</p>
Full article ">Figure 5
<p>Structural overlay between AaeAPO (peroxygenase from <span class="html-italic">Agrocybe aegerita</span> data obtained from PDB file 2YOR [<a href="#B19-antioxidants-11-01011" class="html-bibr">19</a>]) with a homology model for RdelHTP (peroxygenase from <span class="html-italic">Rhizopus delemar</span>) obtained with Phyre<sup>2</sup> [<a href="#B17-antioxidants-11-01011" class="html-bibr">17</a>]. Color scheme: AaeAPO—cyan, RdelHTP—green, prosthetic heme group—yellow, essential amino acid residues from RdelHTP (shown in the alignment of <a href="#antioxidants-11-01011-f003" class="html-fig">Figure 3</a>) on the proximal site of heme—violet, amino acid residue on the distal site—pink. Rendered with PyMOL.</p>
Full article ">
14 pages, 1963 KiB  
Article
Hydropersulfides (RSSH) Outperform Post-Conditioning and Other Reactive Sulfur Species in Limiting Ischemia–Reperfusion Injury in the Isolated Mouse Heart
by Blaze M. Pharoah, Vinayak S. Khodade, Alexander Eremiev, Eric Bao, Ting Liu, Brian O’Rourke, Nazareno Paolocci and John P. Toscano
Antioxidants 2022, 11(5), 1010; https://doi.org/10.3390/antiox11051010 - 20 May 2022
Cited by 15 | Viewed by 3058
Abstract
Hydrogen sulfide (H2S) exhibits protective effects in cardiovascular disease such as myocardial ischemia/reperfusion (I/R) injury, cardiac hypertrophy, and atherosclerosis. Despite these findings, its mechanism of action remains elusive. Recent studies suggest that H2S can modulate protein activity through redox-based [...] Read more.
Hydrogen sulfide (H2S) exhibits protective effects in cardiovascular disease such as myocardial ischemia/reperfusion (I/R) injury, cardiac hypertrophy, and atherosclerosis. Despite these findings, its mechanism of action remains elusive. Recent studies suggest that H2S can modulate protein activity through redox-based post-translational modifications of protein cysteine residues forming hydropersulfides (RSSH). Furthermore, emerging evidence indicates that reactive sulfur species, including RSSH and polysulfides, exhibit cardioprotective action. However, it is not clear yet whether there are any pharmacological differences in the use of H2S vs. RSSH and/or polysulfides. This study aims to examine the differing cardioprotective effects of distinct reactive sulfur species (RSS) such as H2S, RSSH, and dialkyl trisulfides (RSSSR) compared with canonical ischemic post-conditioning in the context of a Langendorff ex-vivo myocardial I/R injury model. For the first time, a side-by-side study has revealed that exogenous RSSH donation is a superior approach to maintain post-ischemic function and limit infarct size when compared with other RSS and mechanical post-conditioning. Our results also suggest that RSSH preserves mitochondrial respiration in H9c2 cardiomyocytes exposed to hypoxia-reoxygenation via inhibition of oxidative phosphorylation while preserving cell viability. Full article
Show Figures

Figure 1

Figure 1
<p>Schematic presentation of the Langendorff experimental protocol. Experimental groups: (1) I/R control, after equilibrium perfusion for 20 min, mouse hearts were subjected to 20 min of no-flow ischemia followed by 90 min reperfusion; (2) IPoC, after 20 min stabilization, mouse hearts were subjected to 20 min of no-flow global ischemia followed by alternating six cycles of 10-s intervals of reperfusion and ischemia and then reperfusion for 90 min; (3) PostC, after 20 min stabilization, mouse hearts were subjected to 20 min of no-flow global ischemia followed by infusion of 100 μM of Na<sub>2</sub>S, donors <b>1</b>, <b>2</b>, <b>3</b> and <b>4</b> independently for 7 min and then reperfusion for 90 min. Abbreviations: IPoC: ischemic post-conditioning, PostC: pharmacological post-conditioning.</p>
Full article ">Figure 2
<p>Cardioprotective effects induced by mechanical or pharmacological post-conditioning with different RSS at 100 μM. (<b>A</b>) Post-ischemic left ventricular RPP functional recovery; (<b>B</b>) Post-ischemic left ventricular developed pressure recovery; (<b>C</b>) Post-ischemic left ventricular rate of contraction. Results are expressed as the mean ± SEM using values obtained at 90 min of reperfusion normalized to the respective pre-ischemic value (n = 8 in each group) * <span class="html-italic">p</span>, 0.05, ** <span class="html-italic">p</span>, 0.005, *** <span class="html-italic">p</span>, 0.001, **** <span class="html-italic">p</span> &lt; 0.0001 vs. I/R-Control.</p>
Full article ">Figure 3
<p>RSS reduce myocardial infarct size and pathological damage in isolated mice hearts subjected to I/R injury. (<b>A</b>) Representative images of TTC-stained transverse cardiac slices. (<b>B</b>) Quantitative graph of myocardial infarct size. The data represent the mean ± SEM (n = 8). (<b>C</b>) RSSH donor <b>3</b> reduces troponin-I level during reperfusion injury (n = 5). ** <span class="html-italic">p</span>, 0.005, *** <span class="html-italic">p</span>, 0.001 vs. I/R-Control.</p>
Full article ">Figure 4
<p>Effect of RSSH donor <b>3</b> on H9c2 cells during reoxyenation following hypoxia. (<b>A</b>) Dose-dependent protection of cell viability by compound <b>3</b> against 24 h of hypoxia followed by 3 h reoxygenation (n = 3) * <span class="html-italic">p</span>, 0.05, ** <span class="html-italic">p</span>, 0.005 vs. normoxic controls. (<b>B</b>) OCR of H9c2 cells under normoxia, or 24 h hypoxia followed by reoxygenation with or without precursor <b>3</b>. (<b>C</b>) Mitochondrial function parameters calculated from respiration data in (B) (n = 3) # <span class="html-italic">p</span>, 0.05, ## <span class="html-italic">p</span>, 0.005, ### <span class="html-italic">p</span>, 0.001 vs. normoxia control; * <span class="html-italic">p</span>, 0.05 vs. hypoxia group.</p>
Full article ">Scheme 1
<p>RSS donors used in this study.</p>
Full article ">
20 pages, 3584 KiB  
Article
Diclofenac: A Nonsteroidal Anti-Inflammatory Drug Inducing Cancer Cell Death by Inhibiting Microtubule Polymerization and Autophagy Flux
by Soohee Choi, Suree Kim, Jiyoung Park, Seung Eun Lee, Chaewon Kim and Dongmin Kang
Antioxidants 2022, 11(5), 1009; https://doi.org/10.3390/antiox11051009 - 20 May 2022
Cited by 12 | Viewed by 6549
Abstract
Diclofenac, a nonsteroidal anti-inflammatory drug (NSAID) used to treat inflammatory diseases induces cellular toxicity by increasing the production of reactive oxygen species (ROS) and impairing autophagic flux. In this study, we investigated whether diclofenac induces cancer cell death and the mechanism by which [...] Read more.
Diclofenac, a nonsteroidal anti-inflammatory drug (NSAID) used to treat inflammatory diseases induces cellular toxicity by increasing the production of reactive oxygen species (ROS) and impairing autophagic flux. In this study, we investigated whether diclofenac induces cancer cell death and the mechanism by which diclofenac causes cell death. We observed that diclofenac induces mitotic arrest with a half-maximal effective concentration of 170 μM and cell death with a half-maximal lethal dose of 200 µM during 18-h incubation in HeLa cells. Cellular microtubule imaging and in vitro tubulin polymerization assays demonstrated that treatment with diclofenac elicits microtubule destabilization. Autophagy relies on microtubule-mediated transport and the fusion of autophagic vesicles. We observed that diclofenac inhibits both phagophore movement, an early step of autophagy, and the fusion of autophagosomes and lysosomes, a late step of autophagy. Diclofenac also induces the fragmentation of mitochondria and the Golgi during cell death. We found that diclofenac induces cell death further in combination with 5-fuorouracil, a DNA replication inhibitor than in single treatment in cancer cells. Pancreatic cancer cells, which have high basal autophagy, are particularly sensitive to cell death by diclofenac. Our study suggests that microtubule destabilization by diclofenac induces cancer cell death via compromised spindle assembly checkpoints and increased ROS through impaired autophagy flux. Diclofenac may be a candidate therapeutic drug in certain type of cancers by inhibiting microtubule-mediated cellular events in combination with clinically utilized nucleoside metabolic inhibitors, including 5-fluorouracil, to block cancer cell proliferation. Full article
(This article belongs to the Special Issue Redox Balance and Autophagy)
Show Figures

Figure 1

Figure 1
<p>Diclofenac inhibits mitotic progression in HeLa cells. (<b>A</b>) HeLa cells expressing human histone H2B conjugated with green fluorescent protein were incubated in a medium containing vehicle (0.1% dimethyl sulfoxide [DMSO]), nocodazole (Noc, 100 nM), or various concentrations of diclofenac (DCF) for 18 h and then observed using a Nikon A1R confocal microscope. Scale bar, 50 µm. The arrows show mitotic cells. (<b>B</b>,<b>C</b>) The percentage of mitotic cells was evaluated on the basis of chromosome condensation. Data are presented as means ± SD from three independent experiments (<span class="html-italic">n</span> = 186–337 cells). Cells were treated with 100 nM of nocodazole (Noc) or 300 µM of diclofenac (DCF). (<b>D</b>–<b>F</b>) HeLa cells were incubated in a medium containing vehicle (0.1% DMSO), nocodazole (Noc, 100 nM) or various concentrations of diclofenac (DCF) for 18 h. Cell cycle stages were determined by flow cytometry. Cells containing 2n or 4n DNA are shown in histograms in part (<b>D</b>). The percentage of cells at G<sub>2</sub> and mitosis (G<sub>2</sub>/M) (<b>E</b>) or at each stage (<b>F</b>) is displayed on the base of the histogram. Diclofenac causes mitotic arrest. Data are presented as means ± SD from three independent experiments. (<b>G</b>) Cell viability assay using a water-soluble tetrazolium salt (EZ-cytox) shows that diclofenac with a half-maximal lethal dose of 200 µM has a cytotoxic effect on HeLa cells. Data are presented as means ± SD from three independent experiments. * <span class="html-italic">p</span> &lt; 0.05; ** <span class="html-italic">p</span> &lt; 0.01; *** <span class="html-italic">p</span> &lt; 0.001 (Student’s <span class="html-italic">t</span>-test).</p>
Full article ">Figure 2
<p>Diclofenac induces microtubule depolymerization. (<b>A</b>) Confocal microscopy of HeLa cells stained with antibodies to α-tubulin (green) after incubation at 37 °C (upper panel) for 6 h or at 37 °C for 3 h followed by 4 °C for 3 h. Cells were incubated in a medium containing vehicle (0.1% dimethyl sulfoxide [DMSO]), nocodazole (100 nM), taxol (100 nM), or diclofenac (170 µM, 200 µM). Nuclei were stained with 4–6-diamidino-2-phenylindole (DAPI, blue). (<b>B</b>) Quantitative analysis of mean fluorescence intensity of α-tubulin. Data are presented as means ± SD from three independent experiments (<span class="html-italic">n</span> = 52–60 cells). * <span class="html-italic">p</span> &lt; 0.05; ** <span class="html-italic">p</span> &lt; 0.01 (Student’s <span class="html-italic">t</span>-test). (<b>C</b>) Confocal microscopy of HepG2 cells stained with antibodies to α-tubulin (green) and LAMP1 (red) after incubation in a medium containing vehicle (0.1% DMSO) or diclofenac (500 µM) under fed (Dulbecco’s modified eagle medium, 10% fetal bovine serum) conditions or starved (Earle’s balanced salt solution) conditions for 8 h. Nuclei were stained with DAPI (blue). Representative images are shown. (<span class="html-italic">n</span> = 14–18 cell). Areas enclosed by the white boxes are shown at higher magnification. Yellow boxes indicate the edges of the plasma membrane. Three independent experiments were performed. Scale bar, 10 µm; scale bar in magnification; 2 µm. (<b>D</b>) In vitro tubulin polymerization. Polymerization activity was monitored in the presence of DMSO (0.01%, vehicle), taxol (10 μM), nocodazole (10 μM), or diclofenac (0.17 mM and 1.7 mM) for 30 min at 37 °C as the increase in A<sub>340</sub> nm. Two independent experiments were performed.</p>
Full article ">Figure 3
<p>Diclofenac inhibits the fusion of autophagosomes and lysosomes. (<b>A</b>) Confocal microscopy of HepG2 cells expressing mCherry-GFP-LC3 were incubated in a medium containing vehicle (0.1% dimethyl sulfoxide [DMSO]), Earle’s balanced salt solution (EBSS), rapamycin (0.25 µM), diclofenac (500 µM), or bafilomycin A1 (100 nM) for 8 h. Autophagosomes appear as yellow spots (mCherry<sup>+</sup>/GFP<sup>+</sup>) and autolysosomes appear as red spots (mCherry<sup>+</sup>/GFP<sup>−</sup>) in merged images. Nuclei were stained with 4–6-diamidino-2-phenylindole (DAPI, blue). (<b>B</b>) Quantification of autophagic vesicle number as the sum of autophagosome (mCherry<sup>+</sup>/GFP<sup>+</sup>, yellow) spot and autolysosome (mCherry<sup>+</sup>/GFP<sup>−</sup>, red) spot number per cell. (<b>C</b>) Ratio of number of autophagosomes (AP) to autolysosomes (AL) per cell. (<b>D</b>) Size of autophagosomes and autolysosomes was quantified by diameter, perimeter, length, and width of each spot. Data are presented as means ± SD from three independent experiments (<span class="html-italic">n</span> = 15 cells). (<b>E</b>) HepG2 cells were incubated in a medium containing vehicle (0.1% DMSO), EBSS, rapamycin (0.25 µM), diclofenac (500 µM), or bafilomycin A1 (100 nM) for 8 h. Total cell lysates were subjected to immunoblot analysis with antibodies to the indicated proteins. Uncropped western blots in <a href="#app1-antioxidants-11-01009" class="html-app">Figure S1</a> (<b>F</b>) The relative immunoblot intensities of LC3-II, p62, and mTor normalized by those of actin were also determined as means ± SD from three independent experiments. (<b>G</b>) Nutrient-starved (EBSS-treated) HepG2 cells expressing GFP-LC3 were incubated in a medium containing vehicle (0.1% DMSO), diclofenac (500 µM), or bafilomycin A1 (100 nM) for 8 h. Cells were then subjected to immunofluorescence analysis with antibodies to LAMP1 (lysosomal marker, red) and observed using confocal microscopy. Nuclei were stained with DAPI. (<b>H</b>) Quantification of the ratio of LC3 spots in the lysosome (trapped LC3 spots) to total LC3 spots. Lower values on the Y-axis indicate that a small number of LC3 spots exist in the lysosomes. Data are presented as means ± SD from three independent experiments (<span class="html-italic">n</span> = 29–39 cells). * <span class="html-italic">p</span> &lt; 0.05; ** <span class="html-italic">p</span> &lt; 0.01; *** <span class="html-italic">p</span> &lt; 0.001 (Student’s <span class="html-italic">t</span>-test). Scale bar, 20 µm; scale bar in inset, 2 µm.</p>
Full article ">Figure 4
<p>Diclofenac inhibits phagophore movement followed by autophagosome formation. (<b>A</b>) Nutrient-starved (Earle’s balanced salt solution) HepG2 cells expressing GFP-LC3 and mCherry-WDFY (PtdIns(3)P reporter) were incubated in a medium containing vehicle (0.1% dimethyl sulfoxide), diclofenac (500 µM), or SAR405 (500 nM) for 8 h. Nuclei were stained with 4–6-diamidino-2-phenylindole. Images were obtained from confocal microscopy. Scale bars, 20 µm; scale bar in insets, 2 µm. (<b>B</b>) Quantification of images from (<b>A</b>). The number of LC3 spots (left) and WDFY spots (middle) per cell. Relative sum intensity of WDFY fluorescence per cell (right) was measured, which reveals all PtdIns(3)P signals including aggregates as shown in diclofenac-treated cells. Data are presented as means ± SD from three independent experiments (<span class="html-italic">n</span> = 20–28 cells). *** <span class="html-italic">p</span> &lt; 0.001 (Student’s <span class="html-italic">t</span>-test).</p>
Full article ">Figure 5
<p>Diclofenac induces fragmentation of mitochondria and the Golgi during cell death. (<b>A</b>,<b>C</b>) Fed (<b>A,</b> Dulbecco’s modified eagle medium, 10% fetal bovine serum) or nutrient-starved (<b>C</b>, Earle’s balanced salt solution) HepG2 cells were incubated in a medium containing vehicle (0.1% dimethyl sulfoxide [DMSO]), <span class="html-italic">n</span>-acetylcysteine (2 mM), diclofenac (500 µM), or diclofenac (500 µM) with <span class="html-italic">n</span>-acetylcysteine (2 mM) for 8 h. Cells were stained with Mitotracker dye to measure mitochondria morphology. Images were obtained from confocal microscopy. Red line represents mitochondrial morphological skeleton for quantification. Scale bars are shown in each image. (<b>B</b>,<b>D</b>) Quantitative analysis for mitochondrial fragmentation. Ratio of mean rod length to branch length or that of median rod length to branch length of mitochondrial skeleton network per cell was calculated using the Mitochondrial Network Analysis toolset applied with Image J. Data are presented as means ± SD from three independent experiments (<span class="html-italic">n</span> = 9–13 cells). (<b>E</b>,<b>F</b>) Detection of mitochondrial reactive oxygen species using MitoSOX red. HepG2 cells were incubated in a medium containing vehicle (0.1% DMSO), rotenone (100 µM), rapamycin (0.25 µM), or diclofenac (500 µM) for 8 h. Cells were then imaged using a high-content imaging system (ImageXpress Confocal HT.ai) and red fluorescence mean intensity per cell was quantified. Data are presented as means ± SD from three independent experiments (<span class="html-italic">n</span> = 1589–2574 cells). Scale bar, 50 µm. (<b>G</b>) HepG2 cells were incubated in a medium containing vehicle (0.1% DMSO), rotenone (100 µM), rapamycin (0.25 µM), or diclofenac (500 µM) for 8 h. Cells were then subjected to immunofluorescence analysis with antibodies to Golgin97 (red). Nuclei were stained with 4–6-diamidino-2-phenylindole. Images were obtained from confocal microscopy. Scale bar, 20 µm; scale bar in inset, 2 µm. (<b>H</b>) Relative mean intensity of Golgin97 fluorescence in the perinuclear region of the cell is presented as means ± SD from three independent experiments (upper histogram, <span class="html-italic">n</span> = 42–50 cells). Cell viability assay using a water-soluble tetrazolium salt (EZ-cytox) is presented as means ± SD from three independent experiments (lower histogram). * <span class="html-italic">p</span> &lt; 0.05; ** <span class="html-italic">p</span> &lt; 0.01; *** <span class="html-italic">p</span> &lt; 0.001 (Student’s <span class="html-italic">t</span>-test).</p>
Full article ">Figure 6
<p>Cytotoxic effects of diclofenac alone or in combination with 5-fluorouracil on HeLa cells and two human pancreatic cancer cell lines (AsPc-1 and MIA PaCa-2 cells). (<b>A</b>–<b>I</b>) Cells were seeded into 96-well plates and treated with 5-fluorouracil and diclofenac alone or in combination, and cell survival was assessed 18 h after the treatment using EZ-cytox water-soluble tetrazolium salt assay. HeLa, AsPc-1, and MIA PaCa-2 cells were treated with 5-fluorouracil, diclofenac, or 5-fluorouracil plus diclofenac in combination at indicated concentrations where cytotoxicity or no cytotoxicity was observed. Combination treatment of 5-fluorouracil and diclofenac synergistically inhibited cell proliferation. Data are presented as means ± SD from three independent experiments. n.s, not significant; * <span class="html-italic">p</span> &lt; 0.05; ** <span class="html-italic">p</span> &lt; 0.01; *** <span class="html-italic">p</span> &lt; 0.001 (Student’s <span class="html-italic">t</span>-test).</p>
Full article ">Figure 7
<p>A model illustrating the death-inducing effect of diclofenac on cancer cells. Diclofenac induces microtubule depolymerization by direct binding. During the metaphase of mitosis, unattached kinetochores on chromosomes (caused by destabilization of mitotic spindles) initiate prolonged mitotic arrest followed by cell death. Diclofenac also inhibits microtubule-mediated phagophore mobilization and fusion of autophagosomes with lysosomes. Inhibited autophagy induces cell death through increased reactive oxygen species (ROS).</p>
Full article ">
13 pages, 1830 KiB  
Article
Oxidative Stress, HSP70/HSP90 and eNOS/iNOS Serum Levels in Professional Divers during Hyperbaric Exposition
by Jakub Szyller, Mariusz Kozakiewicz, Piotr Siermontowski and Dorota Kaczerska
Antioxidants 2022, 11(5), 1008; https://doi.org/10.3390/antiox11051008 - 20 May 2022
Cited by 6 | Viewed by 2212
Abstract
Heat shock proteins (HSPs) have protective effects against oxidative stress and decompression sickness. Nitric oxide may reduce bubble formation during decompression and its activity is regulated by HSPs. A simulated dive can cause the HSP response. The aim of this study was to [...] Read more.
Heat shock proteins (HSPs) have protective effects against oxidative stress and decompression sickness. Nitric oxide may reduce bubble formation during decompression and its activity is regulated by HSPs. A simulated dive can cause the HSP response. The aim of this study was to describe the effect of simulated dives on the antioxidant system, HSPs, and nitric oxide synthase response and demonste the relationship between the concentration of HSPs and the intensification of oxidative stress. A total of 20 healthy professional divers took part in training, consisting of simulated dry dives in a hyperbaric chamber and split into experiment I (30 m exposure, 400 kPa) and experiment II (60 m exposure, 700 kPa) over 24 h. The activities of superoxide dismutase (SOD), catalase (CAT), and glutathione peroxidase (GPx) and the concentrations of malondialdehyde (MDA), heat shock protein 70 (HSP70), heat shock protein 90 (HSP90), endothelial (eNOS) and inducible (iNOS) nitric oxide synthase were measured. Increases in the activity of SOD and MDA concentration were demonstrated. The activity of GPx depended on the dive profile. The HSP70 serum level in both experiments was significantly lower after the dives. The mean HSP90 level was significantly higher after the simulated dive at 60 m. A significant relationship between HSP concentration and SOD/GPx activity was demonstrated. eNOS concentration increased after 60 m exposure. No change in iNOS concentration was observed. In conclusions, the simulated dive significantly affected the antioxidant system, heat shock protein expression and nitric oxide synthase; however, the changes depend on the diving conditions. There is a relationship between the expression of HSPs and the intensity of oxidative stress. Full article
(This article belongs to the Section ROS, RNS and RSS)
Show Figures

Figure 1

Figure 1
<p>The dive profiles—30 m (<b>A</b>) and 60 m (<b>B</b>). The time of stay at depths of 30 and 60 m, including the time of the descent. Decompression stations are marked.</p>
Full article ">Figure 2
<p>Percentage changes in SOD, CAT and GPx activities and in MDA, HSP70, HSP90, and eNOS concentrations after 30 m exposure (* <span class="html-italic">p</span> &lt; 0.05, ** <span class="html-italic">p</span> &lt; 0.01, ns = <span class="html-italic">p</span> &gt; 0.05).</p>
Full article ">Figure 3
<p>Percentage changes in SOD, CAT and GPx activities and in MDA, HSP70, HSP90, and eNOS concentrations after 60 m exposure (* <span class="html-italic">p</span> &lt; 0.05, ** <span class="html-italic">p</span> &lt; 0.01, *** <span class="html-italic">p</span> &lt; 0.001, ns = <span class="html-italic">p</span> &gt; 0.05).</p>
Full article ">Figure 4
<p>Long-term effects of experiment I. The activity or concentration of biochemical parameters before the exposure of 60 m in relation to the values before and after the first experiment I (exposure of 30 m) (* <span class="html-italic">p</span> &lt; 0.05, ** <span class="html-italic">p</span> &lt; 0.01, ns = <span class="html-italic">p</span> &gt; 0.05).</p>
Full article ">Figure 5
<p>Correlation between HSP90 concentration (before diving) and SOD activity (after diving) in erythrocytes—30 m exposition (r = −0.58; <span class="html-italic">p</span> &lt; 0.05) (<b>A</b>) and 60 m exposition (r = −0.27; <span class="html-italic">p</span> &gt; 0.05) (<b>B</b>).</p>
Full article ">Figure 5 Cont.
<p>Correlation between HSP90 concentration (before diving) and SOD activity (after diving) in erythrocytes—30 m exposition (r = −0.58; <span class="html-italic">p</span> &lt; 0.05) (<b>A</b>) and 60 m exposition (r = −0.27; <span class="html-italic">p</span> &gt; 0.05) (<b>B</b>).</p>
Full article ">Figure 6
<p>Correlation between HSP90 concentration and GPx activity in RBC (before diving, r = −0.79, <span class="html-italic">p</span> &lt; 0.05; after diving r = −0.81, <span class="html-italic">p</span> &lt; 0.05), 30 m exposition.</p>
Full article ">
12 pages, 2297 KiB  
Article
Lipid-Coated Nanocrystals as a Tool for Improving the Antioxidant Activity of Resveratrol
by Monica Argenziano, Irfan Aamer Ansari, Elisabetta Muntoni, Rita Spagnolo, Anna Scomparin and Roberta Cavalli
Antioxidants 2022, 11(5), 1007; https://doi.org/10.3390/antiox11051007 - 20 May 2022
Cited by 8 | Viewed by 2463
Abstract
Trans-resveratrol, a polyphenolic phytoalexin found in various plant sources, has been the focus of increasing attention in recent years because of its role in the prevention of many human diseases, and particularly because of its antioxidant properties. However, the in vivo effect [...] Read more.
Trans-resveratrol, a polyphenolic phytoalexin found in various plant sources, has been the focus of increasing attention in recent years because of its role in the prevention of many human diseases, and particularly because of its antioxidant properties. However, the in vivo effect of trans-resveratrol after oral administration is negligible when compared to its efficacy in vitro, due to its low bioavailability. Moreover, it presents stability issues as it is an extremely photosensitive compound when exposed to light. This work aims to develop lipid-coated nanocrystals in order to improve the antioxidant activity and bioavailability of trans-resveratrol. Lipid-coated trans-resveratrol nanocrystals with sizes lower than 500 nm, spherical shapes and smooth surfaces were obtained via a milling method. They showed a faster dissolution rate than the coarse trans-resveratrol powder. The antioxidant properties of trans-resveratrol were not impaired by the milling process. The in vivo pharmacokinetics of lipid-coated trans-resveratrol nanocrystals were evaluated after oral administration to rats, with a commercial Phytosome® formulation being used for comparison purposes. An increase in the trans-resveratrol area under the curve was observed and the lipid-coated nanocrystal formulation led to an enhancement in the oral bioavailability of the compound. Full article
Show Figures

Graphical abstract

Graphical abstract
Full article ">Figure 1
<p>Chemical structures of <span class="html-italic">trans</span>-resveratrol and <span class="html-italic">cis</span>-resveratrol.</p>
Full article ">Figure 2
<p>SEM images of raw resveratrol (<b>A</b>), <span class="html-italic">trans</span>-resveratrol nanocrystals (<b>B</b>) and lipid-coated nanocrystals (<b>C</b>).</p>
Full article ">Figure 3
<p>In vitro dissolution profiles of the <span class="html-italic">trans</span>-resveratrol NCs (RV-NC) and lipid-coated <span class="html-italic">trans</span>-resveratrol NCs (LC RV-NC) in comparison with the coarse resveratrol powder (RV) and RV Phytosome<sup>®</sup>.</p>
Full article ">Figure 4
<p>(<b>A</b>) Differential scanning calorimetry (DSC) thermograms of (a) <span class="html-italic">trans</span>-resveratrol (RV), (b) RV nanocrystals (RV-NC), (c) lipid-coated RV nanocrystals (LC RV-NC), (d) RV Phytosome<sup>®</sup> and (e) phosphatidylcholine. (<b>B</b>) FTIR spectra of the coarse <span class="html-italic">trans</span>-resveratrol powder (RV), <span class="html-italic">trans</span>-resveratrol nanocrystals (RV-NC), lipid-coated <span class="html-italic">trans</span>-resveratrol nanocrystals (LC RV-NC) and phosphatidylcholine (PC).</p>
Full article ">Figure 5
<p>(<b>A</b>) In vitro antioxidant activity of <span class="html-italic">trans</span>-resveratrol nanocrystals (RV-NC), lipid-coated <span class="html-italic">trans</span>-resveratrol nanocrystals (LC RV-NC), RV Phytosome<sup>®</sup> and the coarse RV suspension (RV) at different concentrations, expressed as DPPH radical scavenging percentage. (<b>B</b>) Lipid peroxidation inhibition activity of <span class="html-italic">trans</span>-resveratrol nanocrystals (RV-NC), lipid coated <span class="html-italic">trans</span>-resveratrol nanocrystals (LC RV-NC), RV Phytosome<sup>®</sup> and the coarse RV suspension (RV), evaluated in a TBA assay. The experiments were conducted in triplicate and data are presented as means ± standard deviation (SD).</p>
Full article ">Figure 6
<p>Plasma concentrations of <span class="html-italic">trans</span>-resveratrol vs. time after the oral administration of RV coarse powder (RV), lipid-coated RV nanocrystals (LC RV-NC) and RV Phytosome<sup>®</sup>.</p>
Full article ">
20 pages, 2677 KiB  
Article
Phytochemical Characterization, Antioxidant and Anti-Proliferative Properties of Rubia cordifolia L. Extracts Prepared with Improved Extraction Conditions
by Ravikiran B. Humbare, Joyita Sarkar, Anjali A. Kulkarni, Mugdha G. Juwale, Sushil H. Deshmukh, Dinesh Amalnerkar, Manohar Chaskar, Maria C. Albertini, Marco B. L. Rocchi, Swapnil C. Kamble and Seeram Ramakrishna
Antioxidants 2022, 11(5), 1006; https://doi.org/10.3390/antiox11051006 - 20 May 2022
Cited by 6 | Viewed by 3568
Abstract
Rubia cordifolia L. (Rubiaceae) is an important plant in Indian and Chinese medical systems. Extracts prepared from the root, stem and leaf have been used traditionally for the management of various diseases. Some of the known effects are anti-inflammation, neuroprotection, anti-proliferation, immunomodulation and [...] Read more.
Rubia cordifolia L. (Rubiaceae) is an important plant in Indian and Chinese medical systems. Extracts prepared from the root, stem and leaf have been used traditionally for the management of various diseases. Some of the known effects are anti-inflammation, neuroprotection, anti-proliferation, immunomodulation and anti-tumor. A comparative account of the extracts derived from different organs that lead to the identification of the most suitable solvent is lacking. We explored the presence of phytochemicals, antioxidant activity and anti-proliferative properties of a variety of solvent-based extracts of root, and methanol extracts of stem and leaf of R. cordifolia L. The antioxidant potential was determined by DPPH, hydrogen peroxide, nitric oxide and total antioxidant assays. The anti-proliferative nature was evaluated by MTT assay on HeLa, ME-180 and HepG2 cells. The composition of the extracts was determined by UPLC-UV-MS. We found that the root extracts had the presence of higher amounts of antioxidants over the stem and leaf extracts. The root extracts prepared in methanol exhibited the highest cytotoxicity in HepG2 cells. The main compounds identified through UPLC-UV-MS of the methanol extract give credibility to the previous results. Our comprehensive study corroborates the preference given to the root over the stem and leaf for extract preparation. In conclusion, we identified the methanol extract of the root to be the most suited to have bioactivity with anti-cancer potential. Full article
(This article belongs to the Special Issue The 10th Anniversary of Antioxidants: Past, Present and Future)
Show Figures

Figure 1

Figure 1
<p>In vitro antioxidant assays (<b>A</b>) DPPH assay, (<b>B</b>) hydrogen peroxide scavenging assay, (<b>C</b>) nitric oxide scavenging assay, (<b>D</b>) total antioxidant assay of <span class="html-italic">R. cordifolia</span> root without (i) and with (ii) polyvinylpolypyrrolidone (PVPP), where: blue—ethanol extract, red—methanol extract, dark green—aqueous extract, black—ascorbic acid and (iii) leaf and stem, where: green—leaf-methanol extract (−PVPP), orange—methanol extract (+PVPP), red—stem-methanol extract (−PVPP), blue—stem-methanol extract (+PVPP).</p>
Full article ">Figure 2
<p>Principal components analysis (PCA) of <span class="html-italic">R. cordifolia</span> L antioxidant activity in PVPP untreated (–PVPP, empty symbols) and treated (+PVPP, solid plain symbols) extracts. The different samples and extractions conditions have been indicated with different shape and color symbols: methanol = circle; ethanol = triangle; aqueous = square; root = blue; leaf = red and stem = green.</p>
Full article ">Figure 3
<p>Comparative cell viability assay on three cell lines: HeLa (blue intermittent line with square marker), ME-180 (green continuous line with triangle marker) and HepG2 (red dotted line with diamond marker) using <span class="html-italic">R. cordifolia</span> extracts (<b>A</b>) methanol extract, (<b>B</b>) ethanol extract, (<b>C</b>) aqueous extract and (<b>D</b>) 5-Flurouracil. The cell viability is relative to the vehicle control (cells treated with solvent in equivalent amounts of respective extract). Results were expressed as the mean <span class="html-italic">±</span> SD of three independent experiments.</p>
Full article ">Figure 4
<p>Comparison among the IC<sub>50</sub> of HeLa (blue), ME-180 (green) and HepG2 (red) cells upon treatment with <span class="html-italic">R. cordifolia</span> root extracts of methanol, ethanol, aqueous extract and 5-Flurouracil (5-FU). Results were expressed as the mean <span class="html-italic">±</span> SD of three independent experiments, test of significance by ANOVA, wherein * and *** represent statistical significance of <span class="html-italic">p</span> &lt; 0.05 and <span class="html-italic">p</span> &lt; 0.001, respectively.</p>
Full article ">Figure 5
<p>UPLC-UV-MS analysis on positive node for methanol extract with identified peaks of 1. Pseudopurpurin, 2. Morindaparvin A.</p>
Full article ">Figure 6
<p>Chromatograms and structure (inset) of compounds identified by UPLC-UV-MS.</p>
Full article ">
34 pages, 2789 KiB  
Review
Metabolic Shades of S-D-Lactoylglutathione
by Miklós Péter Kalapos, Cinzia Antognelli and Lidia de Bari
Antioxidants 2022, 11(5), 1005; https://doi.org/10.3390/antiox11051005 - 20 May 2022
Cited by 9 | Viewed by 3607
Abstract
S-D-lactoylglutathione (SDL) is an intermediate of the glutathione-dependent metabolism of methylglyoxal (MGO) by glyoxalases. MGO is an electrophilic compound that is inevitably produced in conjunction with glucose breakdown and is essentially metabolized via the glyoxalase route. In the last decades, MGO metabolism and [...] Read more.
S-D-lactoylglutathione (SDL) is an intermediate of the glutathione-dependent metabolism of methylglyoxal (MGO) by glyoxalases. MGO is an electrophilic compound that is inevitably produced in conjunction with glucose breakdown and is essentially metabolized via the glyoxalase route. In the last decades, MGO metabolism and its cytotoxic effects have been under active investigation, while almost nothing is known about SDL. This article seeks to fill the gap by presenting an overview of the chemistry, biochemistry, physiological role and clinical importance of SDL. The effects of intracellular SDL are investigated in three main directions: as a substrate for post-translational protein modifications, as a reservoir for mitochondrial reduced glutathione and as an energy currency. In essence, all three approaches point to one direction, namely, a metabolism-related regulatory role, enhancing the cellular defense against insults. It is also suggested that an increased plasma concentration of SDL or its metabolites may possibly serve as marker molecules in hemolytic states, particularly when the cause of hemolysis is a disturbance of the pay-off phase of the glycolytic chain. Finally, SDL could also represent a useful marker in such metabolic disorders as diabetes mellitus or ketotic states, in which its formation is expected to be enhanced. Despite the lack of clear-cut evidence underlying the clinical and experimental findings, the investigation of SDL metabolism is a promising field of research. Full article
(This article belongs to the Special Issue Redox Biology of Glyoxalases)
Show Figures

Figure 1

Figure 1
<p>The interactions of the glyoxalase system with cell energy metabolism, the antioxidant system and protein function regulation. MGO formation and elimination by the glyoxalase pathway is graphically described as an integral part of cell metabolism. The routes by which SDL could contribute to cell energy production, ROS scavenging and protein function regulation are highlighted. The hourglass stresses the fact that GLO2 activity is the rate-limiting step of the MGO pathway: this could be relevant, under certain conditions, such as for an SDL level increase in the cytosol, which could favor its utilization in additional paths, such as PTPM and mitochondrial GSH pool replenishing (see the text for details). Abbreviations: GR, glutathione reductase; cGSH, cytosolic reduced glutathione; mGSH, mitochondrial reduced glutathione; GSSG, oxidized glutathione; MGO, methylglyoxal; HTA, hemithioacetal; SDL, S-D-lactoylglutathione; GLO1, glyoxalase I; cGLO2, cytosolic glyoxalase II; mGLO2, mitochondrial glyoxalase II; D-LAC, D-lactate; D-LDH, D-lactate dehydrogenase; ROS, reactive oxygen species; mROS, mitochondrial ROS; cROS, cytosolic ROS; PTPM, post-translational protein modification; N-LACT, N-lactoylation; S-GLUT, S-glutathionylation; glycolysis intermediates, cofactors and enzymes related to glycolysis are not listed.</p>
Full article ">Figure 2
<p>S-glutathionylation and N-lact(o)ylation by S-D-lactoylglutathione. Abbreviations: MGO, methylglyoxal; GSH, reduced glutathione; SDL, S-D-lactoylglutathione; GLO1, glyoxalase I; GLO2, glyoxalase II; D-LAC, D-lactate; CYS, cysteine; LYS, lysine.</p>
Full article ">Figure 3
<p>S-D-lactoylglutathione breakdown by γ-glutamyl-transferase and dipeptidase. Abbreviation: γGT, γ-glutamyl-transferase.</p>
Full article ">Figure 4
<p>Schematic illustration of mechanisms of the possible participation of GLO2 and SDL in the interactions of microtubules and actin filaments in relation to extracellular stimuli. The data upon which the figure is based are from the literature already cited in text, with the exception of the following articles that are cited here first [<a href="#B204-antioxidants-11-01005" class="html-bibr">204</a>,<a href="#B205-antioxidants-11-01005" class="html-bibr">205</a>,<a href="#B206-antioxidants-11-01005" class="html-bibr">206</a>]. Note, immunological studies proved the association between microtubules and GLO2 [<a href="#B149-antioxidants-11-01005" class="html-bibr">149</a>,<a href="#B150-antioxidants-11-01005" class="html-bibr">150</a>]. The association between actin and GLO2 results in a decrease in the enzymatic activity [<a href="#B128-antioxidants-11-01005" class="html-bibr">128</a>]. As can be seen, S-glutathionylation has an opposite effect on tubulin and actin, and this opposite effect is also recognized in the case of Rho factor, too. Rho promotes both the formation and the contractility of fibers, which are amplified by the positive feedback to it. While it enhances the stabilization of microtubules, there is a negative feedback between microtubule polymerization and Rho [<a href="#B204-antioxidants-11-01005" class="html-bibr">204</a>]. At the same time, fibers activate, while microtubules inactivate focal adhesion [<a href="#B204-antioxidants-11-01005" class="html-bibr">204</a>]. Abbreviations: MGO, methylglyoxal; GSH, reduced glutathione; SDL, S-D-lactoylglutathione; GLO1, glyoxalase I; GLO1-SG, glutathionylated glyoxalase I; GLO2, glyoxalase II; GLO2-SG, glutathionylated glyoxalase II; D-LAC, D-lactate; EGF, epidermal growth factor; EGF-R, EGF receptor; GRX, glutaredoxin; JAK, Janus kinase; man-R, mannose 6-phosphate receptor; STAT, signal transducer and activator of transcription; αT, α-tubulin; βT, β-tubulin; Pi, inorganic phosphate; (-), inhibition; (↓), decrease in activity.</p>
Full article ">Figure 5
<p>Time course of the changes in glyoxalases, Nrf2 and K<sup>+</sup><sub>ATP</sub> in HUVEC. It is to be noted that the GLO1 and GLO2 profiles at day 5 strongly resemble the activities of the enzymes in diabetes mellitus [<a href="#B39-antioxidants-11-01005" class="html-bibr">39</a>,<a href="#B110-antioxidants-11-01005" class="html-bibr">110</a>]. Abbreviations: cc, concentration; MGO, methylglyoxal; GLO1, glyoxalase I; GLO2, glyoxalase II; Nrf2, nuclear factor-erythroid 2 p45 subunit-related factor 2; K<sup>+</sup><sub>ATP,</sub> ATP-sensitive potassium channels.</p>
Full article ">Figure 6
<p>A hypothesis for the role of glyoxalases in the cellular response to stress. Abbreviations: MGO, methylglyoxal; GLO1, glyoxalase I; GLO2, glyoxalase II; GSH, reduced glutathione; mGSH, mitochondrial reduced glutathione; PTPM, post-translational protein modification.</p>
Full article ">
Previous Issue
Next Issue
Back to TopTop