[go: up one dir, main page]

Next Issue
Volume 11, May
Previous Issue
Volume 11, March


Antioxidants, Volume 11, Issue 4 (April 2022) – 194 articles

Cover Story (view full-size image): 
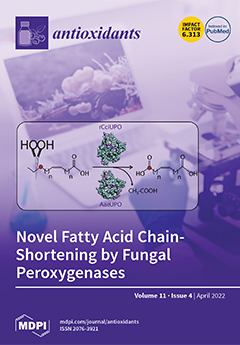
Unspecific peroxygenases (UPOs), the extracellular enzymes capable of oxygenating a potpourri of substrates with a peroxide as co-substrate, come out with a new reaction with the UPOs from Coprinopsis cinerea and Cyclocybe (Agrocybe) aegerita: carbon-chain shortening of saturated and unsaturated fatty acids, through the subterminal (ω-1 and ω-2) carbons of the chain via several oxygenations, yielding 2C-shorter dicarboxylic fatty acids. View this paper
  • Issues are regarded as officially published after their release is announced to the table of contents alert mailing list.
  • You may sign up for e-mail alerts to receive table of contents of newly released issues.
  • PDF is the official format for papers published in both, html and pdf forms. To view the papers in pdf format, click on the "PDF Full-text" link, and use the free Adobe Reader to open them.
Order results
Result details
Section
Select all
Export citation of selected articles as:
11 pages, 1514 KiB  
Article
Two Novel Lipophilic Antioxidants Derivatized from Curcumin
by Tao Liu, Xiaohan Liu, Tosin M. Olajide, Jia Xu and Xinchu Weng
Antioxidants 2022, 11(4), 796; https://doi.org/10.3390/antiox11040796 - 18 Apr 2022
Cited by 1 | Viewed by 2080
Abstract
Tert-butyl curcumin (TBC), demethylated tert-butylated curcumin (1E,6E-1,7-bis(3-tert-butyl-4,5-dihydroxyphenyl)hepta-1,6-diene-3,5-dione, DMTC), demethylated curcumin (DMC), and Cur were synthesized from the starting compound, 2-methoxy-4-methylphenol. TBC and DMTC are two novel lipophilic compounds, and Cur and DMC are polar and hydrophilic. The antioxidant activities [...] Read more.
Tert-butyl curcumin (TBC), demethylated tert-butylated curcumin (1E,6E-1,7-bis(3-tert-butyl-4,5-dihydroxyphenyl)hepta-1,6-diene-3,5-dione, DMTC), demethylated curcumin (DMC), and Cur were synthesized from the starting compound, 2-methoxy-4-methylphenol. TBC and DMTC are two novel lipophilic compounds, and Cur and DMC are polar and hydrophilic. The antioxidant activities of Cur, TBC, DMC, and DMTC were evaluated by using the methods of 2,2-diphenyl-1-(2,4,6-trinitro-phenyl)-hydrazinyl (DPPH), deep-frying, and Rancimat. Tert-butylhydroquinone (TBHQ) and Butylated hydroxytoluene (BHT) were used as comparison compounds. Both Rancimat and deep-frying tests demonstrated that DMTC was the strongest antioxidant, and TBC also had stronger antioxidant activity than Cur. In the DPPH assay, DMC showed the highest scavenging activity, followed by DMTC, TBHQ, Cur, and TBC. DMTC and TBC can be potentially used as strong antioxidants in food industry, especially for frying, baking, and other high temperature food processing. DMTC is the strongest antioxidant in oil to our knowledge. Full article
(This article belongs to the Special Issue Antioxidants in Foods II)
Show Figures

Figure 1

Figure 1
<p>Changes in conjugated dienes (CD) and acid values (AV) of soybean oil spiked with or without antioxidants during deep frying at 180 °C. (<b>a</b>) CD, (<b>b</b>) AV. (n = 2).</p>
Full article ">Scheme 1
<p>Synthetic route leading to Cur, TBC, DMC, and DMTC.</p>
Full article ">Scheme 2
<p>Elucidation of tautomerization structures of Cur and its derivatives.</p>
Full article ">Scheme 3
<p>Elucidation of the synergistic effects of <span class="html-italic">ortho</span>-hydroxyl groups on DMTC.</p>
Full article ">
34 pages, 5743 KiB  
Review
Carotenoids: Dietary Sources, Extraction, Encapsulation, Bioavailability, and Health Benefits—A Review of Recent Advancements
by Ramesh Kumar Saini, Parchuri Prasad, Veeresh Lokesh, Xiaomin Shang, Juhyun Shin, Young-Soo Keum and Ji-Ho Lee
Antioxidants 2022, 11(4), 795; https://doi.org/10.3390/antiox11040795 - 18 Apr 2022
Cited by 107 | Viewed by 11279
Abstract
Natural carotenoids (CARs), viz. β-carotene, lutein, astaxanthin, bixin, norbixin, capsanthin, lycopene, canthaxanthin, β-Apo-8-carotenal, zeaxanthin, and β-apo-8-carotenal-ester, are being studied as potential candidates in fields such as food, feed, nutraceuticals, and cosmeceuticals. CAR research is advancing in the following three major fields: (1) CAR [...] Read more.
Natural carotenoids (CARs), viz. β-carotene, lutein, astaxanthin, bixin, norbixin, capsanthin, lycopene, canthaxanthin, β-Apo-8-carotenal, zeaxanthin, and β-apo-8-carotenal-ester, are being studied as potential candidates in fields such as food, feed, nutraceuticals, and cosmeceuticals. CAR research is advancing in the following three major fields: (1) CAR production from natural sources and optimization of its downstream processing; (2) encapsulation for enhanced physical and chemical properties; and (3) preclinical, clinical, and epidemiological studies of CARs’ health benefits. This review critically discusses the recent developments in studies of the chemistry and antioxidant activity, marketing trends, dietary sources, extraction, bioaccessibility and bioavailability, encapsulation methods, dietary intake, and health benefits of CARs. Preclinical, clinical, and epidemiological studies on cancer, obesity, type 2 diabetes (T2D), cardiovascular diseases (CVD), osteoporosis, neurodegenerative disease, mental health, eye, and skin health are also discussed. Full article
(This article belongs to the Special Issue The Role of Carotenoids in Human Health (2021))
Show Figures

Figure 1

Figure 1
<p>The molecular structure of chromophore of (all-<span class="html-italic">E</span>)-β-carotene (<b>A</b>), responsible for the absorption of light in the visible range. The absorbance spectrum of (all-<span class="html-italic">E</span>)-β-carotene (<b>B</b>) is from carrots recorded using a diode array detector (DAD) in the solvent system previously used in our study [<a href="#B29-antioxidants-11-00795" class="html-bibr">29</a>] (unpublished data).</p>
Full article ">Figure 2
<p>The lipid peroxyl radical (LOO•) scavenging/detoxification by carotenoids (CARs). The carotenoid radical cation (CAR•+) can be regenerated in the presence of tocopherol (vitamin E), ascorbate (vitamin C), and glutathione.</p>
Full article ">Figure 3
<p>The marketing trends of carotenoids. Source: <a href="https://www.bccresearch.com" target="_blank">https://www.bccresearch.com</a>, accessed on 25 February 2022.</p>
Full article ">Figure 4
<p>The dietary carotenoids obtained from the major fruits and vegetables. From top to bottom, (<b>1</b>) green leafy vegetables, (<b>2</b>) pumpkin and carrot, (<b>3</b>) tomatoes, (<b>4</b>) red paprika, and (<b>5</b>) orange.</p>
Full article ">Figure 5
<p>The presence of two unmodified β-ionone rings in one molecule of β-carotene can provide two molecules of retinol (vitamin A; 100% provitamin A activity), while α-carotene and β-cryptoxanthin contain only one β-ionone ring structure (50% provitamin A activity).</p>
Full article ">Figure 6
<p>The antioxidant (in normal cells) and pro-oxidant properties of carotenoids regulate the reactive oxygen species (ROS) and modulate the nuclear factor kappa-light-chain-enhancer of activated B cells (NF-κB); nuclear factor-erythroid 2-related factor 2 (Nrf2), responsible for apoptosis of cancer cells; and survival of normal cells. Abbreviations: BAX, B-cell lymphoma 2 associated X; Bcl-2, B-cell lymphoma 2; PARP, poly (ADP-ribose) polymerase; PGE2, prostaglandin E2; TNF-α, tumor necrosis factor-alpha.</p>
Full article ">Figure 7
<p>Carotenoids block the phosphoinositide 3-kinase (PI3K)/phosphorylated protein kinase B (PKB or Akt)/mechanistic target of rapamycin (mTOR) signaling pathways, thus reducing tumor cell initiation, progression, and metastasis. Abbreviations: Bcl-2: B-cell lymphoma 2: IGF: Insulin-like growth factor: MMP9: Matrix Metallopeptidase 9.</p>
Full article ">
32 pages, 1900 KiB  
Review
Does Plant Breeding for Antioxidant-Rich Foods Have an Impact on Human Health?
by Laura Bassolino, Katia Petroni, Angela Polito, Alessandra Marinelli, Elena Azzini, Marika Ferrari, Donatella B. M. Ficco, Elisabetta Mazzucotelli, Alessandro Tondelli, Agostino Fricano, Roberta Paris, Inmaculada García-Robles, Carolina Rausell, María Dolores Real, Carlo Massimo Pozzi, Giuseppe Mandolino, Ephrem Habyarimana and Luigi Cattivelli
Antioxidants 2022, 11(4), 794; https://doi.org/10.3390/antiox11040794 - 18 Apr 2022
Cited by 16 | Viewed by 4126
Abstract
Given the general beneficial effects of antioxidants-rich foods on human health and disease prevention, there is a continuous interest in plant secondary metabolites conferring attractive colors to fruits and grains and responsible, together with others, for nutraceutical properties. Cereals and Solanaceae are important [...] Read more.
Given the general beneficial effects of antioxidants-rich foods on human health and disease prevention, there is a continuous interest in plant secondary metabolites conferring attractive colors to fruits and grains and responsible, together with others, for nutraceutical properties. Cereals and Solanaceae are important components of the human diet, thus, they are the main targets for functional food development by exploitation of genetic resources and metabolic engineering. In this review, we focus on the impact of antioxidants-rich cereal and Solanaceae derived foods on human health by analyzing natural biodiversity and biotechnological strategies aiming at increasing the antioxidant level of grains and fruits, the impact of agronomic practices and food processing on antioxidant properties combined with a focus on the current state of pre-clinical and clinical studies. Despite the strong evidence in in vitro and animal studies supporting the beneficial effects of antioxidants-rich diets in preventing diseases, clinical studies are still not sufficient to prove the impact of antioxidant rich cereal and Solanaceae derived foods on human Full article
(This article belongs to the Special Issue The Role of Antioxidant Foods and Nutraceuticals in Ageing)
Show Figures

Figure 1

Figure 1
<p>The flavonoid biosynthesis and its regulation in cereal and <span class="html-italic">Solanaceae</span> crops. Scheme of the pathway leading to the production of flavonoids and phenolic acids in monocots (<b>a</b>) and dicots (<b>b</b>). Phenylalanine is first deaminated by PAL to produce cinnamic acid, then converted by C4H into p-coumaric acid, which can enter the synthesis of hydroxycinnamic acids (i.e., chlorogenic acid and other phenolics) or it can be conjugated with coenzyme A to produce 4-coumaroyl-CoA by 4CL. CHS catalyses the condensation of p-coumaroyl-CoA with three molecules of malonyl-CoA to naringenin chalcone, then converted to the flavanone naringenin by CHI. Indeed, naringenin may be converted to flavones by FNSI/FNSII (e.g., maysin in maize), to the red phlobaphenes, derived from condensation of the 3-deoxy flavonoids apiferol and luteoforol (<b>a</b>) and to dihydroflavonols, such as dihydrokaempferol (DHK), which can then be used by F3′H to produce dihydroquercetin (DHQ) or by F3′5′H to form dihydromyricetin (DHM) (<b>b</b>). Dihydroflavonols are then converted to flavonols (e.g., kaempferol, quercetin, and myricetin) by FLS. Downstream, DFR reduces the dihydroflavonols to their respective colourless leucoanthocyanidins, which are then converted into the coloured anthocyanidins (e.g., cyanidin, pelargonidin, and delphinidin). The main enzymes catalyzing the reactions in the pathway are reported in violet. Regulatory proteins belonging to diverse classes of transcription factors are marked with coloured dots. Branches leading to different classes of flavonoids and anthocyanins are indicated with diverse colours; in B, thicker purple and red arrows highlight the branch leading to the most abundant derived anthocyanins. The name of the enzymes is detailed in the abbreviation list.</p>
Full article ">Figure 1 Cont.
<p>The flavonoid biosynthesis and its regulation in cereal and <span class="html-italic">Solanaceae</span> crops. Scheme of the pathway leading to the production of flavonoids and phenolic acids in monocots (<b>a</b>) and dicots (<b>b</b>). Phenylalanine is first deaminated by PAL to produce cinnamic acid, then converted by C4H into p-coumaric acid, which can enter the synthesis of hydroxycinnamic acids (i.e., chlorogenic acid and other phenolics) or it can be conjugated with coenzyme A to produce 4-coumaroyl-CoA by 4CL. CHS catalyses the condensation of p-coumaroyl-CoA with three molecules of malonyl-CoA to naringenin chalcone, then converted to the flavanone naringenin by CHI. Indeed, naringenin may be converted to flavones by FNSI/FNSII (e.g., maysin in maize), to the red phlobaphenes, derived from condensation of the 3-deoxy flavonoids apiferol and luteoforol (<b>a</b>) and to dihydroflavonols, such as dihydrokaempferol (DHK), which can then be used by F3′H to produce dihydroquercetin (DHQ) or by F3′5′H to form dihydromyricetin (DHM) (<b>b</b>). Dihydroflavonols are then converted to flavonols (e.g., kaempferol, quercetin, and myricetin) by FLS. Downstream, DFR reduces the dihydroflavonols to their respective colourless leucoanthocyanidins, which are then converted into the coloured anthocyanidins (e.g., cyanidin, pelargonidin, and delphinidin). The main enzymes catalyzing the reactions in the pathway are reported in violet. Regulatory proteins belonging to diverse classes of transcription factors are marked with coloured dots. Branches leading to different classes of flavonoids and anthocyanins are indicated with diverse colours; in B, thicker purple and red arrows highlight the branch leading to the most abundant derived anthocyanins. The name of the enzymes is detailed in the abbreviation list.</p>
Full article ">Figure 2
<p>A simplified overview of carotenoid pathway in cereal and <span class="html-italic">Solanaceae</span> crops. The first step in carotenoid biosynthesis is the condensation of two GGPP molecules to form phytoene catalysed by <span class="html-italic">PSY</span>, which is the main rate-limiting step in solanaceous fruits and cereal grains. Further, the conversion of phytoene to lycopene via sequential desaturation and isomerization reactions is catalysed by a set of four enzymes (PDS, ZISO, ZDS, and CRTISO). Lycopene is at the branch point of carotenoid synthesis since it can be cyclized to ß-carotene or α-carotene by LCYB and LCYE. Downstream, the sequential hydroxylation and epoxidation of these carotenes leads to the production of diverse xanthophylls (e.g., lutein and zeaxanthin). Regulatory proteins belonging to diverse classes of transcription factors are marked with coloured dots. The name of the enzymes is detailed in the abbreviation list.</p>
Full article ">
21 pages, 1389 KiB  
Article
The Butterfly Effect: Mild Soil Pollution with Heavy Metals Elicits Major Biological Consequences in Cobalt-Sensitized Broad Bean Model Plants
by Raimondas Šiukšta, Vėjūnė Pukenytė, Violeta Kleizaitė, Skaistė Bondzinskaitė and Tatjana Čėsnienė
Antioxidants 2022, 11(4), 793; https://doi.org/10.3390/antiox11040793 - 18 Apr 2022
Cited by 1 | Viewed by 2479
Abstract
Among the heavy metals (HMs), only cobalt induces a polymorphic response in Vicia faba plants, manifesting as chlorophyll morphoses and a ‘break-through’ effect resulting in the elevated accumulation of other HMs, which makes Co-pretreated broad bean plants an attractive model for investigating soil [...] Read more.
Among the heavy metals (HMs), only cobalt induces a polymorphic response in Vicia faba plants, manifesting as chlorophyll morphoses and a ‘break-through’ effect resulting in the elevated accumulation of other HMs, which makes Co-pretreated broad bean plants an attractive model for investigating soil pollution by HMs. In this study, Co-sensitized V. faba plants were used to evaluate the long-term effect of residual industrial pollution by examining biochemical (H2O2, ascorbic acid, malondialdehyde, free proline, flavonoid, polyphenols, chlorophylls, carotenoids, superoxide dismutase) and molecular (conserved DNA-derived polymorphism and transcript-derived polymorphic fragments) markers after long-term exposure. HM-polluted soil induced a significantly higher frequency of chlorophyll morphoses and lower levels of nonenzymatic antioxidants in Co-pretreated V. faba plants. Both molecular markers effectively differentiated plants from polluted and control soils into distinct clusters, showing that HMs in mildly polluted soil are capable of inducing changes in DNA coding regions. These findings illustrate that strong background abiotic stressors (pretreatment with Co) can aid investigations of mild stressors (slight levels of soil pollution) by complementing each other in antioxidant content reduction and induction of DNA changes. Full article
(This article belongs to the Special Issue Environmental Stress and Antioxidant Defences)
Show Figures

Figure 1

Figure 1
<p>Results of PCA using quantitative characteristics of broad bean plants grown in polluted soils with different extents of heavy metal pollution. DF1–DF8—polluted soil from different sites of the drill factory.</p>
Full article ">Figure 2
<p>Phenotypic groups (<b>A</b>) and frequencies (<b>B</b>) of Co-induced chlorophyll morphoses (NG—normal green, LG—light green, Y—yellow) observed in <span class="html-italic">V. faba</span> plants grown in soil possessing different pollution levels. DF1,4,6,7,8—polluted soil from different sites of the drill factory.</p>
Full article ">Figure 3
<p>Biplot of the first two principal components (PCs) (accounting for 88.3% of the variance) obtained by including two chemical analysis-based soil indices (Zs and RI), germination rate, and frequencies of Co-induced morphoses in <span class="html-italic">V. faba</span> plants grown in soils with different industrial pollution levels. Phenotypes of morphoses: NG—normal green, LG—light green, Y—yellow; C—plants grown in control soil; DF1,4,6,7,8—plants grown in soil collected from different sites of the drill factory.</p>
Full article ">Figure 4
<p>Distribution of phenotypic groups (<b>A</b>) and content of free proline (<b>B</b>), ascorbic acid (<b>C</b>), and flavonoids (<b>D</b>) in Co-pretreated <span class="html-italic">V. faba</span> plants after one month of exposure to the mildly polluted soil mix. Phenotypes of morphoses: NG—normal green, LG—light green, Y—yellow; C—plants grown in control soil; DF—plants from soil collected from different sites of the drill factory. Significance level: <sup>a</sup> <span class="html-italic">p</span> &lt; 0.05, <sup>b</sup> <span class="html-italic">p</span> &lt; 0.01, <sup>c</sup> <span class="html-italic">p</span> &lt; 0.001 compared with the respective phenotypic group from control soil; <sup>1</sup> <span class="html-italic">p</span> &lt; 0.05, compared with Co-untreated plants grown in the same soil variant.</p>
Full article ">Figure 5
<p>Biplot representing the first two principal components (PCs) (accumulating 72.5% of variance) generated using all tested biochemical parameters (ROS generation, antioxidants, and photosynthetic pigments). Ellipses enclose the same treatment and phenotypic groups of <span class="html-italic">V. faba</span> plants grown in control and polluted soils. Phenotypes of morphoses: NG—normal green, LG—light green, Y—yellow; C—plants grown in control soil; DF—plants from soil collected from different sites of the drill factory.</p>
Full article ">Figure 6
<p>UPGMA dendrograms were generated using the conserved DNA-derived polymorphism (CDDP) (<b>A</b>) and variation in the profiles of transcript-derived fragments (TDFs) (<b>B</b>). The Nei and Li genetic distances are presented on the axis, and bootstrap values from 1000 iterations are shown at the branch nodes.</p>
Full article ">
16 pages, 897 KiB  
Article
Evaluating the Nutritional and Immune Potentiating Characteristics of Unfermented and Fermented Turmeric Camel Milk in Cyclophosphamide-Induced Immunosuppression in Rats
by Thamer Aljutaily
Antioxidants 2022, 11(4), 792; https://doi.org/10.3390/antiox11040792 - 18 Apr 2022
Cited by 8 | Viewed by 3146
Abstract
Antioxidative, nutritional, and immune-boosting characteristics of turmeric-camel milk (TCM) and fermented turmeric-camel milk (FTCM) were investigated. A cyclophosphamide-induced immunosuppression rat model consisting of six experimental groups was carried out to study the effects of TCM and FTCM on weight gain, antioxidant status, immunoglobulin [...] Read more.
Antioxidative, nutritional, and immune-boosting characteristics of turmeric-camel milk (TCM) and fermented turmeric-camel milk (FTCM) were investigated. A cyclophosphamide-induced immunosuppression rat model consisting of six experimental groups was carried out to study the effects of TCM and FTCM on weight gain, antioxidant status, immunoglobulin (Igs), pro-inflammatory and anti-inflammatory cytokines, and oxidative stress biomarkers. TCM or FTCM were orally administrated at 10 or 20 mL Kg−1 rat weight to CYP-immunosuppressed rats for 2 weeks in the presence of negative (NR) and positive (CYP) control groups. The phytochemical analysis and antioxidant capacity results indicated that TCM and FTCM contained considerable phenolic content with super antioxidant activities. CYP injection affected the rats’ weight directly during the first week and then, a low weight gain percentage was recorded in treated groups at the end of the experiment. The most efficient treatment for recovering rats’ weight was administering TCM and FTCM at 20 mL kg−1. Feed efficiency significantly increased with feeding TCM and FTCM in a dose-dependent manner. A significant improvement was found in WBCs, lymphocytes, and neutrophils count, suggesting that both TCM and FTCM alleviated the CYP-induced immunity suppression in a dose-dependent manner. IgG, IgA, and IgM concentrations in the CYP + TCM at 10 or 20 mL kg−1 and CYP + FTCM at 10 or 20 mL kg−1 groups were increased significantly. Concentrations of IL-1 beta, IL-6, IL-10, IL-13, and IL-TNF-α in the CYP group were significantly lower than in the NR group. Interestingly, both TCM and FTCM, especially with high doses, significantly enhanced cytokines production. Administrating FTCM was more potent than TCM, indicating that TCM with probiotics fermentation potentiated the immunological activity in immunosuppressed rats. Treated rats with TCM and FTCM can reverse CYP inhibition of antioxidant enzyme activities, significantly increase GSH, CAT, and SOD, and decrease MDA levels in a dose-dependent manner. In conclusion, these observations indicated that FTCM exhibits better improvements in weight gain, increased immune biomarkers in terms of WBCs, enhanced pro-inflammation and anti-inflammation responses, and accelerated antioxidant activity in immunosuppressed rats compared with TCM. It could be beneficial and profitable for boosting immunity and protecting against oxidative stress. Full article
Show Figures

Figure 1

Figure 1
<p>Effects of TCM and FTCM administration on serum IgG (<b>A</b>), IgA (<b>B</b>), and IgM (<b>C</b>) concentrations in CYP-immunosuppressed rats. Results are presented as (mean ± SE, <span class="html-italic">n</span> = 8). Bars marked with different letters (a, b, c, and d) indicated statistically significant differences (<span class="html-italic">p</span> &lt; 0.05).</p>
Full article ">Figure 1 Cont.
<p>Effects of TCM and FTCM administration on serum IgG (<b>A</b>), IgA (<b>B</b>), and IgM (<b>C</b>) concentrations in CYP-immunosuppressed rats. Results are presented as (mean ± SE, <span class="html-italic">n</span> = 8). Bars marked with different letters (a, b, c, and d) indicated statistically significant differences (<span class="html-italic">p</span> &lt; 0.05).</p>
Full article ">
17 pages, 2144 KiB  
Review
The Antioxidant Effect of the Metal and Metal-Oxide Nanoparticles
by Xuemei Ge, Zhaoxin Cao and Lanling Chu
Antioxidants 2022, 11(4), 791; https://doi.org/10.3390/antiox11040791 - 18 Apr 2022
Cited by 49 | Viewed by 4335
Abstract
Inorganic nanoparticles, such as CeO3, TiO2 and Fe3O4 could be served as a platform for their excellent performance in antioxidant effect. They may offer the feasibility to be further developed for their smaller and controllable sizes, flexibility [...] Read more.
Inorganic nanoparticles, such as CeO3, TiO2 and Fe3O4 could be served as a platform for their excellent performance in antioxidant effect. They may offer the feasibility to be further developed for their smaller and controllable sizes, flexibility to be modified, relative low toxicity as well as ease of preparation. In this work, the recent progress of these nanoparticles were illustrated, and the antioxidant mechanism of the inorganic nanoparticles were introduced, which mainly included antioxidant enzyme-mimetic activity and antioxidant ROS/RNS scavenging activity. The antioxidant effects and the applications of several nanoparticles, such as CeO3, Fe3O4, TiO2 and Se, are summarized in this paper. The potential toxicity of these nanoparticles both in vitro and in vivo was well studied for the further applications. Future directions of how to utilize these inorganic nanoparticles to be further applied in some fields, such as medicine, cosmetic and functional food additives were also investigated in this paper. Full article
Show Figures

Figure 1

Figure 1
<p>Scale-up platform currently in development and inorganic particle species formed on-chip. (<b>A</b>) Flow schematic of high-throughput assembly. The structure of microfluid platform with insets of disposable positive displacement pumps and cartridge holder that does not require manual fluidic connections. (<b>B</b>) TEM images of ZnO particles prepared by using LGD variant at FRR of 1:1, 1:6, and 1:20. Iron oxide particles fabricated at a TFR of 10.5 mL/min and FRR of 1:2.</p>
Full article ">Figure 2
<p>(<b>A</b>) Structure of a nanoparticle of ceria showing 111, 110 and 100 surfaces. The structures of “perfect” 111, 110 and 100 surfaces of nanoceria simulated using DFT are consistent with the structures of the surfaces exposed by the nanoparticle. (<b>B</b>) One of the nanoparticle’s 111 surfaces after nanoceria has been reduced. Ce<sup>4+</sup> is in white, Ce<sup>3+</sup> is in blue and oxygen is red. (<b>C</b>) Interaction energy of phosphate with nanoceria for three compositions of nanoceria in a living cell. Interaction energy (kJ/mol) of phosphate at nanoceria surfaces 111 (blue triangles), 110 (green circles) and 100 (red squares).</p>
Full article ">Figure 3
<p>Examples of the fabrication process of the iron oxide nanoparticles. (<b>A</b>) Schematic representation of biosynthesis of FeONPs. (<b>B</b>) Surface modification of the nanoparticles. L−PEOXA−Fe<sub>x</sub>O<sub>y</sub> and C−PEOXA−Fe<sub>x</sub>O<sub>y</sub> NPs show different stability in HSA. Cyclic PEOXA shells could quantitatively prevent the formation of a protein corona. Linear brush shells cannot be entirely prevented.</p>
Full article ">Figure 4
<p>(<b>A</b>) The preparation process of SeNPs-C/C. (<b>B</b>) The SEM image and distribution of CTS-SeNPs as well as SeNPs-C/C.) [<a href="#B126-antioxidants-11-00791" class="html-bibr">126</a>].</p>
Full article ">Figure 5
<p>(<b>A</b>) The formation of the corona around the TiO<sub>2</sub> nanoparticles with the protein from foods. (<b>B</b>) CD spectra of protein (glutenin, gliadin, soy protein isolate, zein) and protein−nanoparticle coronas.</p>
Full article ">
20 pages, 4301 KiB  
Review
Overview of Research on Vanadium-Quercetin Complexes with a Historical Outline
by Agnieszka Ścibior
Antioxidants 2022, 11(4), 790; https://doi.org/10.3390/antiox11040790 - 17 Apr 2022
Cited by 11 | Viewed by 2625
Abstract
The present review was conducted to gather the available literature on some issues related to vanadium-quercetin (V-QUE) complexes. It was aimed at collecting data from in vitro and in vivo studies on the biological activity, behavior, antioxidant properties, and radical scavenging power of [...] Read more.
The present review was conducted to gather the available literature on some issues related to vanadium-quercetin (V-QUE) complexes. It was aimed at collecting data from in vitro and in vivo studies on the biological activity, behavior, antioxidant properties, and radical scavenging power of V-QUE complexes. The analysis of relevant findings allowed summarizing the evidence for the antidiabetic and anticarcinogenic potential of V-QUE complexes and suggested that they could serve as pharmacological agents for diabetes and cancer. These data together with other well-documented biological properties of V and QUE (common for both), which are briefly summarized in this review as well, may lay the groundwork for new therapeutic treatments and further research on a novel class of pharmaceutical molecules with better therapeutic performance. Simultaneously, the results compiled in this report point to the need for further studies on complexation of V with flavonoids to gain further insight into their behavior, identify species responsible for their physiological activity, and fully understand their mechanism of action. Full article
Show Figures

Graphical abstract

Graphical abstract
Full article ">Figure 1
<p>Graphical summary of the overviewed issues.</p>
Full article ">Figure 2
<p>Flow chart of the systematic literature review.</p>
Full article ">Figure 3
<p>Historical view on vanadium (V), quercetin (QUE), and flavonoids (Flav). Elaborated on the basis of available literature data [<a href="#B4-antioxidants-11-00790" class="html-bibr">4</a>,<a href="#B5-antioxidants-11-00790" class="html-bibr">5</a>,<a href="#B6-antioxidants-11-00790" class="html-bibr">6</a>,<a href="#B7-antioxidants-11-00790" class="html-bibr">7</a>,<a href="#B8-antioxidants-11-00790" class="html-bibr">8</a>,<a href="#B9-antioxidants-11-00790" class="html-bibr">9</a>,<a href="#B10-antioxidants-11-00790" class="html-bibr">10</a>]. * after [<a href="#B11-antioxidants-11-00790" class="html-bibr">11</a>]. Flav: flavonoids; QUE: quercetin; V: vanadium. ↑: increase.</p>
Full article ">Figure 4
<p>Metal-quercetin (QUE) complexes reported in the literature. N/A: not available.</p>
Full article ">Figure 5
<p>Selected events regarding vanadium chemistry and vanadium (V)-quercetin (QUE) complexes on the timeline. Elaborated on the basis of available literature data [<a href="#B7-antioxidants-11-00790" class="html-bibr">7</a>,<a href="#B8-antioxidants-11-00790" class="html-bibr">8</a>,<a href="#B36-antioxidants-11-00790" class="html-bibr">36</a>,<a href="#B37-antioxidants-11-00790" class="html-bibr">37</a>,<a href="#B38-antioxidants-11-00790" class="html-bibr">38</a>,<a href="#B39-antioxidants-11-00790" class="html-bibr">39</a>,<a href="#B40-antioxidants-11-00790" class="html-bibr">40</a>,<a href="#B41-antioxidants-11-00790" class="html-bibr">41</a>]. V: vanadium; QUE: quercetin; QUE 3RUT: QUE 3-rutinoside; QUESA: QUE-sulfonic acid; VO<sup>2+</sup>: oxovanadium cation (vanadyl). * after [<a href="#B42-antioxidants-11-00790" class="html-bibr">42</a>]. ↑: increase.</p>
Full article ">Figure 6
<p>Vanadium-quercetin (V-QUE) complexes—the core issues of the present report.</p>
Full article ">Figure 7
<p>Summary of research on the vanadium (V)/quercetin (QUE) insulin-like effects (<b>A</b>) and potential antidiabetic activities of V-QUE complexes (<b>B</b>) on the timeline. Elaborated on the basis of available literature data [<a href="#B51-antioxidants-11-00790" class="html-bibr">51</a>,<a href="#B52-antioxidants-11-00790" class="html-bibr">52</a>,<a href="#B53-antioxidants-11-00790" class="html-bibr">53</a>,<a href="#B54-antioxidants-11-00790" class="html-bibr">54</a>,<a href="#B55-antioxidants-11-00790" class="html-bibr">55</a>,<a href="#B56-antioxidants-11-00790" class="html-bibr">56</a>,<a href="#B57-antioxidants-11-00790" class="html-bibr">57</a>,<a href="#B58-antioxidants-11-00790" class="html-bibr">58</a>,<a href="#B59-antioxidants-11-00790" class="html-bibr">59</a>,<a href="#B60-antioxidants-11-00790" class="html-bibr">60</a>,<a href="#B61-antioxidants-11-00790" class="html-bibr">61</a>,<a href="#B62-antioxidants-11-00790" class="html-bibr">62</a>,<a href="#B63-antioxidants-11-00790" class="html-bibr">63</a>]. CHO: Chinese hamster ovary cells; GLU: glucose; IADs: isolated adipocytes; L: ligand; Metab: metabolism; Oxd: oxidation; QUE: quercetin; V: vanadium; VO<sup>2+</sup>: oxovanadium cation (vanadyl). <sup>#</sup> after [<a href="#B51-antioxidants-11-00790" class="html-bibr">51</a>]. <span class="html-fig-inline" id="antioxidants-11-00790-i001"> <img alt="Antioxidants 11 00790 i001" src="/antioxidants/antioxidants-11-00790/article_deploy/html/images/antioxidants-11-00790-i001.png"/></span> stimulation.</p>
Full article ">Figure 8
<p>Summary of research on the vanadium (V)/quercetin (QUE) anticarcinogenic properties and antitumoral activities of V-QUE complexes as well as their behavior and interactions with proteins on the timeline. Elaborated on the basis of available literature data [<a href="#B64-antioxidants-11-00790" class="html-bibr">64</a>,<a href="#B65-antioxidants-11-00790" class="html-bibr">65</a>,<a href="#B66-antioxidants-11-00790" class="html-bibr">66</a>,<a href="#B67-antioxidants-11-00790" class="html-bibr">67</a>,<a href="#B68-antioxidants-11-00790" class="html-bibr">68</a>,<a href="#B69-antioxidants-11-00790" class="html-bibr">69</a>,<a href="#B70-antioxidants-11-00790" class="html-bibr">70</a>,<a href="#B71-antioxidants-11-00790" class="html-bibr">71</a>,<a href="#B72-antioxidants-11-00790" class="html-bibr">72</a>,<a href="#B73-antioxidants-11-00790" class="html-bibr">73</a>,<a href="#B74-antioxidants-11-00790" class="html-bibr">74</a>]. Bio-Trans: biotransformation; EAC: Ehrlich ascites carcinoma; FRs: free radicals; MCF-7: human breast cancer cell line; MDAMB231: human breast cancer cell line; MDAMB468: human breast cancer cell line; QUE: quercetin; SKBr3: human breast cancer cell line; T47D: human breast cancer cell line; UMR106: rat osteosarcoma cell line; VDC: vanadocene dichloride; V-QUE: vanadium-quercetin complex; V-QUESA: vanadium-quercetin sulfonic acid.</p>
Full article ">Figure 9
<p>Biological properties of vanadium and quercetin.</p>
Full article ">
14 pages, 594 KiB  
Article
Rosemary Extracts Improved the Antioxidant Status of Low-Fat Yoghurt Sauces Enriched with Inulin
by Magdalena Martínez-Tomé, Cristina Cedeño-Pinos, Sancho Bañón and Antonia M. Jiménez-Monreal
Antioxidants 2022, 11(4), 789; https://doi.org/10.3390/antiox11040789 - 16 Apr 2022
Cited by 5 | Viewed by 2714
Abstract
Yoghurt sauces are considered fatty products which are quite susceptible to oxidation and must be stabilised using antioxidants. Novel formulations for yoghurt sauces often involve replacement of fat with dietary fibres and use of natural preservatives. The aim of the present research was [...] Read more.
Yoghurt sauces are considered fatty products which are quite susceptible to oxidation and must be stabilised using antioxidants. Novel formulations for yoghurt sauces often involve replacement of fat with dietary fibres and use of natural preservatives. The aim of the present research was to design healthier formulations for yoghurt sauces based on the replacement of sunflower oil (SO) with chicory inulin (IN) and the use of rosemary extracts (RE) as natural antioxidants. Different sauces were developed by adding IN at 2 and 5% w: w and/or 300 mg/kg lipo- and/or water-soluble rosemary extracts (RLE and/or RWE) containing 120 and 146 mg polyphenols per g extract, respectively. Nutritional value (proximate composition and caloric contribution), some physical properties (pH and CIELab colour) and antioxidant status (deoxyribose, DPPH radical scavenging, Rancimat, lipid peroxidation and linoleic acid assays) were assessed in the sauces. Replacement of SO with IN (5%) reduced fat content by 30%, roughly 15% low calories, thereby obtaining healthier sauces. As expected, the RLE was more effective than the RWE in improving antioxidant activity in lipidic environment. Using RLE enhanced the antioxidant capacity of lipid peroxidation by 44%. In the Rancimat test, this increased the oxidative protection of the sauce made with and without IN (5%) by around 20% or 45%, respectively. Similarly, using RLE doubled protection against linoleic acid oxidation. Application of IN in yoghurt sauce has nutritional (replacement of lipids with dietary fibre) and technological interest (foaming agent) and can be combined with RE of high polyphenol content as a potential functional ingredient capable of stabilising the sauces against oxidation. Full article
Show Figures

Figure 1

Figure 1
<p>Average (<span class="html-italic">n</span> = 3) antioxidant activity of six commercial yoghurt sauces evaluated using different assays (lipid peroxidation, hydroxyl and DPPH radical scavenging, autooxidation linoleic acid and Rancimat test).</p>
Full article ">
22 pages, 544 KiB  
Review
Neonatal Anesthesia and Oxidative Stress
by David A. Gascoigne, Mohammed M. Minhaj and Daniil P. Aksenov
Antioxidants 2022, 11(4), 787; https://doi.org/10.3390/antiox11040787 - 16 Apr 2022
Cited by 9 | Viewed by 3388
Abstract
Neonatal anesthesia, while often essential for surgeries or imaging procedures, is accompanied by significant risks to redox balance in the brain due to the relatively weak antioxidant system in children. Oxidative stress is characterized by concentrations of reactive oxygen species (ROS) that are [...] Read more.
Neonatal anesthesia, while often essential for surgeries or imaging procedures, is accompanied by significant risks to redox balance in the brain due to the relatively weak antioxidant system in children. Oxidative stress is characterized by concentrations of reactive oxygen species (ROS) that are elevated beyond what can be accommodated by the antioxidant defense system. In neonatal anesthesia, this has been proposed to be a contributing factor to some of the negative consequences (e.g., learning deficits and behavioral abnormalities) that are associated with early anesthetic exposure. In order to assess the relationship between neonatal anesthesia and oxidative stress, we first review the mechanisms of action of common anesthetic agents, the key pathways that produce the majority of ROS, and the main antioxidants. We then explore the possible immediate, short-term, and long-term pathways of neonatal-anesthesia-induced oxidative stress. We review a large body of literature describing oxidative stress to be evident during and immediately following neonatal anesthesia. Moreover, our review suggests that the short-term pathway has a temporally limited effect on oxidative stress, while the long-term pathway can manifest years later due to the altered development of neurons and neurovascular interactions. Full article
(This article belongs to the Special Issue Oxidative Stress and Neurodegenerative Disorders II)
Show Figures

Figure 1

Figure 1
<p>Schematic illustration of neonatal anesthesia-induced oxidative stress in the brain. During the administration of neonatal anesthesia, there are three immediate pathways (blue) for how oxidative stress (red) can manifest. These immediate pathways have three distinct sources, altered signaling, administration of supplemental oxygen, and neuronal cell death; each of these can increase the concentration of ROS and induce oxidative stress. The short-term pathway (yellow) appears to be less impactful since it is short-lived; this is shown in the figure with a dashed arrow. The long-term pathway (green) shows the delayed effects of neonatal anesthesia and how the initial damage to neurons can negatively affect neurovascular interactions, leading to oxidative stress.</p>
Full article ">
19 pages, 3343 KiB  
Article
Loss and Recovery of Glutaredoxin 5 Is Inducible by Diet in a Murine Model of Diabesity and Mediated by Free Fatty Acids In Vitro
by Sebastian Friedrich Petry, Axel Römer, Divya Rawat, Lara Brunner, Nina Lerch, Mengmeng Zhou, Rekha Grewal, Fatemeh Sharifpanah, Heinrich Sauer, Gunter Peter Eckert and Thomas Linn
Antioxidants 2022, 11(4), 788; https://doi.org/10.3390/antiox11040788 - 15 Apr 2022
Cited by 3 | Viewed by 3217
Abstract
Free fatty acids (FFA), hyperglycemia, and inflammatory cytokines are major mediators of β-cell toxicity in type 2 diabetes mellitus, impairing mitochondrial metabolism. Glutaredoxin 5 (Glrx5) is a mitochondrial protein involved in the assembly of iron–sulfur clusters required for complexes of the respiratory chain. [...] Read more.
Free fatty acids (FFA), hyperglycemia, and inflammatory cytokines are major mediators of β-cell toxicity in type 2 diabetes mellitus, impairing mitochondrial metabolism. Glutaredoxin 5 (Glrx5) is a mitochondrial protein involved in the assembly of iron–sulfur clusters required for complexes of the respiratory chain. We have provided evidence that islet cells are deprived of Glrx5, correlating with impaired insulin secretion during diabetes in genetically obese mice. In this study, we induced diabesity in C57BL/6J mice in vivo by feeding the mice a high-fat diet (HFD) and modelled the diabetic metabolism in MIN6 cells through exposure to FFA, glucose, or inflammatory cytokines in vitro. qRT-PCR, ELISA, immunohisto-/cytochemistry, bioluminescence, and respirometry were employed to study Glrx5, insulin secretion, and mitochondrial biomarkers. The HFD induced a depletion of islet Glrx5 concomitant with an obese phenotype, elevated FFA in serum and reactive oxygen species in islets, and impaired glucose tolerance. Exposure of MIN6 cells to FFA led to a loss of Glrx5 in vitro. The FFA-induced depletion of Glrx5 coincided with significantly altered mitochondrial biomarkers. In summary, we provide evidence that Glrx5 is regulated by FFA in type 2 diabetes mellitus and is linked to mitochondrial dysfunction and blunted insulin secretion. Full article
(This article belongs to the Special Issue Thioredoxin and Glutaredoxin Systems II)
Show Figures

Figure 1

Figure 1
<p>Experimental setup of the animal experiment. Male C57BL/6J mice were divided into the experimental (Exp) and control (Ctrl) groups at the age of 7 weeks after 2 weeks of adaption to our animal housing. Control animals were fed a control diet (CD, ca. 3514 kcal/kg, 10% of energy from fat, 66% from carbohydrates, and 24% from protein) throughout the study period. The experimental group was fed a high-fat diet (HFD, ca. 5389 kcal/kg, 70% of energy from fat, 14% from carbohydrates, and 16% from protein) from 7 to 20 weeks of age, followed by rescue feeding with the CD for 3 weeks, and another cycle of the HFD for 4 weeks. Euthanasia was carried out in both groups at 7, 20, 23, and 27 weeks of age.</p>
Full article ">Figure 2
<p>Fasting and dynamic blood glucose levels, body weight, free fatty acid levels, and pancreas weight of the research animals. IPGTT and euthanasia was conducted before dietary changes and at the end of the experimental procedure at 7, 20, 23, and 27 weeks of age. Fasting blood glucose levels and body weight were monitored every two weeks until 20 weeks of age, and then weekly. (<b>A</b>) Body weight and (<b>B</b>) fasting blood glucose values at 7, 20, 23, and 27 weeks of age; <span class="html-italic">n</span> = 5–33 mice/timepoint/group. (<b>C</b>) Blood FFA levels as determined by ELISA; <span class="html-italic">n</span> = three mice/timepoint/group. (<b>D</b>) Pancreas weight; <span class="html-italic">n</span> = six mice/timepoint/group. (<b>E</b>–<b>H</b>) IPGTT results at (<b>E</b>) 7, (<b>F</b>) 20, (<b>G</b>) 23, and (<b>H</b>) 27 weeks of age; <span class="html-italic">n</span> = five mice/timepoint/group. For each graph, the white bars represent the controls, and the black bars represent the experimental group. *** denotes <span class="html-italic">p</span> &lt; 0.001, ** <span class="html-italic">p</span> &lt; 0.005, and * <span class="html-italic">p</span> &lt; 0.05 ((<b>A</b>–<b>D</b>): two-way ANOVA, (<b>E</b>–<b>H</b>): unpaired <span class="html-italic">t</span>-test).</p>
Full article ">Figure 3
<p>Immunohistological and Ins1 and Glrx5 mRNA expression analysis. The immunohistological staining patterns of insulin and Glrx5 were analyzed at 7, 20, 23, and 27 weeks of age. Glrx5 staining was quantified by calculating the ratio of the Glrx5/insulin staining area. The mRNA expression of <span class="html-italic">Ins1</span> and <span class="html-italic">Glrx5</span> was studied using qRT-PCR. (<b>A</b>–<b>F</b>, <b>J</b>–<b>O</b>, <b>S</b>–<b>X</b>, <b>AB</b>–<b>AG</b>) Representative images taken from the immunohistological analysis of insulin and Glrx5 presenting size-matched representative islets of both groups of mice ((<b>A</b>–<b>C</b>) controls, 7 weeks; (<b>D</b>–<b>F</b>) HFD, 7 weeks; (<b>J</b>–<b>L</b>) controls, 20 weeks; (<b>M</b>–<b>O</b>) HFD, 20 weeks; (<b>S</b>–<b>U</b>) controls, 23 weeks; (<b>V</b>–<b>X</b>) HFD, 23 weeks; (<b>AB</b>–<b>AD</b>) controls, 27 weeks; (<b>AE</b>–<b>AG</b>) HFD, 27 weeks). Green = insulin, red = Glrx5, blue = nuclei. Scale bars represent 100 µm. Images were taken at 200× magnification. <span class="html-italic">n</span> = 33–67 islets of three to four mice/timepoint/group. (<b>G</b>,<b>P</b>,<b>Y</b>,<b>AH</b>) The quantification of Glrx5 staining. (<b>H</b>,<b>Q</b>,<b>Z</b>,<b>AI</b>) The islet mRNA expression of Glrx5 and (<b>I</b>,<b>R</b>,<b>AA</b>,<b>AJ</b>) of Ins1 given as fold change controls vs. HFD for each time point. <span class="html-italic">n</span> = six mice/timepoint/group. For each graph, the white bars represent the controls, and the black bars represent the experimental group. **** denotes <span class="html-italic">p</span> &lt; 0.0001, ** <span class="html-italic">p</span> &lt; 0.005, and * <span class="html-italic">p</span> &lt; 0.05 (two-way ANOVA).</p>
Full article ">Figure 4
<p>Pancreatic islet ROS production and glucose stimulation. ROS were quantified in pancreatic islets from animals of both groups at 7, 20, and 23 weeks of age by DCFH-DA staining and analysis with a confocal microscope. The glucose stimulation and consecutive measurements of insulin in islet lysates and the medium were conducted in both groups at 27 weeks of age. (<b>A</b>) The ROS production of primary islets at 7, 20, and 23 weeks of age. <span class="html-italic">n</span> = 63–65 islets of three mice/timepoint/group. (<b>B</b>,<b>C</b>) The amount of insulin in the (<b>B</b>) lysates and (<b>C</b>) culture medium of the islets before and after stimulation with 300 mg/dL glucose. <span class="html-italic">n</span> = five islets of three mice/timepoint/group, four runs. For each graph, the white bars represent the controls, and the black bars represent the experimental group. **** denotes <span class="html-italic">p</span> &lt; 0.0001, ** <span class="html-italic">p</span> &lt; 0.005, and * <span class="html-italic">p</span> &lt; 0.05 (two-way ANOVA).</p>
Full article ">Figure 5
<p>MIN6 Glrx5 level and insulin secretion. (<b>A</b>,<b>B</b>) Diabetic conditions were modelled in MIN6 cells employing a 48 h period of pre-incubation with 400 µM palmitic acid (PA) followed by 1 h of starvation and exposure to increasing concentrations of glucose for 24 h. (<b>C</b>,<b>D</b>) Furthermore, we employed a treatment with 0.75, 1.5, or 3 mM oleic acid for 24 h, (<b>E</b>,<b>F</b>) and a 2 h period of starvation followed by exposure to 5, 10, 20, or 30 mM glucose for 24 h, or (<b>G</b>,<b>H</b>) a cytokine mix (10 ng/mL TNF-α, 5 ng/mL IL-1β, and 100 ng/mL IFN-γ) for 24 or 48 h, respectively. The protein level of Glrx5 in lysate and insulin in the culture medium of β-cells exposed to (<b>A</b>,<b>B</b>) glucose for 24 h after and without pre-incubation with 400 µM palmitate and 1h of starvation; (<b>C</b>,<b>D</b>) oleic acid for 24 h; (<b>E</b>,<b>F</b>) glucose for 24 h after 2 h of starvation; and (<b>G</b>,<b>H</b>) a mix of 10 ng/mL TNF-α, 5 ng/mL IL-1β, and 100 ng/mL IFN-γ for 24 or 48 h. Insulin and Glrx5 were measured by ELISA and normalized by total protein. The white bars represent the controls, and the black bars represent the (pre)-treated cells. <span class="html-italic">n</span> = 3–5. **** denotes <span class="html-italic">p</span> &lt; 0.0001, *** <span class="html-italic">p</span> &lt; 0.001, ** <span class="html-italic">p</span> &lt; 0.005, and * <span class="html-italic">p</span> &lt;0.05 (one-/two-way ANOVA).</p>
Full article ">Figure 6
<p>Cytological analysis of MIN6 insulin and Glrx5 content. MIN6 cells exposed to 1.5 mM oleic acid for 24 h were stained for insulin and Glrx5 and compared with the controls. Staining was quantified by measuring the integrated density using ImageJ software. The values for insulin and Glrx5 were correlated. (<b>A</b>) The correlation of insulin with Glrx5 in the control cells and (<b>B</b>) after treatment with 1.5 mM oleic acid for 24 h. <span class="html-italic">n</span> = 4 (9–35 cells/run, Pearson).</p>
Full article ">Figure 7
<p>ATP production and the O<sub>2</sub> flux in the respiratory chain after FFA treatment. Cellular ATP levels were analyzed employing a luciferase-based bioluminescence assay. Respiratory states were measured with an Oxygraph and an O<sub>2</sub> probe. (<b>A</b>) ATP after exposure to oleic acid for 24 h or (<b>B</b>) after pre-incubation with 400 µM palmitate, 1 h of starvation, and exposure to glucose. (<b>C</b>–<b>H</b>) The O<sub>2</sub> flux in the respiratory chain after exposure to 0.75 mM oleic acid for 24 h. The white bars represent the controls, and the black bars represent the (pre-)treated cells. <span class="html-italic">n</span> = 12. **** denotes <span class="html-italic">p</span> &lt; 0.0001, *** <span class="html-italic">p</span> &lt; 0.001, ** <span class="html-italic">p</span> &lt; 0.005 and * <span class="html-italic">p</span> &lt; 0.05 (one-way ANOVA/unpaired <span class="html-italic">t</span>-test).</p>
Full article ">
18 pages, 7691 KiB  
Article
Antioxidant and Anticancer Activities of Synthesized Methylated and Acetylated Derivatives of Natural Bromophenols
by Hui Dong, Li Wang, Meng Guo, Dimitrios Stagos, Antonis Giakountis, Varvara Trachana, Xiukun Lin, Yankai Liu and Ming Liu
Antioxidants 2022, 11(4), 786; https://doi.org/10.3390/antiox11040786 - 15 Apr 2022
Cited by 3 | Viewed by 2319
Abstract
Natural bromophenols are important secondary metabolites in marine algae. Derivatives of these bromophenol are potential candidates for the drug development due to their biological activities, such as antioxidant, anticancer, anti-diabetic and anti-inflammatory activity. In our present study, we have designed and synthesized a [...] Read more.
Natural bromophenols are important secondary metabolites in marine algae. Derivatives of these bromophenol are potential candidates for the drug development due to their biological activities, such as antioxidant, anticancer, anti-diabetic and anti-inflammatory activity. In our present study, we have designed and synthesized a series of new methylated and acetylated bromophenol derivatives from easily available materials using simple operation procedures and evaluated their antioxidant and anticancer activities on the cellular level. The results showed that 2.,3-dibromo-1-(((2-bromo-4,5-dimethoxybenzyl)oxy)methyl)-4,5-dimethoxybenzene (3b-9) and (oxybis(methylene))bis(4-bromo-6-methoxy-3,1-phenylene) diacetate (4b-3) compounds ameliorated H2O2-induced oxidative damage and ROS generation in HaCaT keratinocytes. Compounds 2.,3-dibromo-1-(((2-bromo-4,5-dimethoxybenzyl)oxy)methyl)-4,5-dimethoxybenzene (3b-9) and (oxybis(methylene) )bis(4-bromo-6-methoxy-3,1-phenylene) diacetate (4b-3) also increased the TrxR1 and HO-1 expression while not affecting Nrf2 expression in HaCaT. In addition, compounds (oxybis(methylene)bis(2-bromo-6-methoxy-4,1-phenylene) diacetate (4b-4) inhibited the viability and induced apoptosis of leukemia K562 cells while not affecting the cell cycle distribution. The present work indicated that some of these bromophenol derivatives possess significant antioxidant and anticancer potential, which merits further investigation. Full article
(This article belongs to the Special Issue Antioxidant and Chemopreventive Activity of Natural Compounds)
Show Figures

Figure 1

Figure 1
<p>The chemical structure of natural bromophenol bis(2,3,6-tribromo-4,5-dihydroxybenzyl)ether (BTDE, <b>a</b>) and bis(2,3-dibromo-4,5-dihydroxybenzyl)ether (BDDE, <b>b</b>).</p>
Full article ">Figure 2
<p><b>3b-9</b> and <b>4b-3</b> reverses oxidative damage in HaCaT cells. HaCaT cells were incubated with different concentration of <b>3b-9</b> and <b>4b-3</b> (5 and 10 µM) for 24 h and then were treated with H<sub>2</sub>O<sub>2</sub> for 3 h. The cell viability was determined by the SRB method. Values are expressed as mean ± SD of three independent experiments. * <span class="html-italic">p</span> &lt; 0.05, ** <span class="html-italic">p</span> &lt; 0.01, versus H<sub>2</sub>O<sub>2</sub> group.</p>
Full article ">Figure 3
<p><b>3b-9</b> and <b>4b-3</b> alleviated H<sub>2</sub>O<sub>2</sub>-induced HaCaT cell damage. (<b>a</b>) In the presence or absence of H<sub>2</sub>O<sub>2</sub>, the ratio of apoptosis and viability of HaCaT cells treated with <b>3b-9</b> (10 μM) were measured by flow cytometry. (<b>b</b>) The histogram depicted the proportion of living HaCaT cells after <b>3b-9</b> treatment. (<b>c</b>) In the presence or absence of H<sub>2</sub>O<sub>2</sub>, the ratio of apoptosis and viability of HaCaT cells treated with <b>4b-3</b> (10 μM) were measured by flow cytometry. (<b>d</b>) The histogram depicted the proportion of living HaCaT cells after <b>4b-3</b> treatment. <sup>##</sup> <span class="html-italic">p</span> &lt; 0.01, versus control group; ** <span class="html-italic">p</span> &lt; 0.01, versus H<sub>2</sub>O<sub>2</sub> group.</p>
Full article ">Figure 4
<p><b>3b-9</b> and <b>4b-3</b> reduces the ROS level in HaCaT cells. HaCaT cells were pretreated with <b>3b-9</b> (<b>a</b>) and <b>4b-3</b> (<b>b</b>) for 24 h and then were exposed to H<sub>2</sub>O<sub>2</sub> (500 μM) for 1 h. Cells were incubated with DCFH-DA (10 μM) for 20 min, and the ROS level were observed with fluorescence microscopy.</p>
Full article ">Figure 5
<p>The effect of <b>3b-9</b> and <b>4b-3</b> on the expression of Nrf2, Keap1, TrxR1 and HO-1. (<b>a</b>) HaCaT cells were treated with <b>3b-9</b> (2.5–10 µM) for 24 h. The expression of Nrf2 and Keap1 was detected by Western blotting assay. (<b>b</b>) HaCaT cells were treated with <b>4b-3</b> (2.5–10 µM) for 24 h. The expression of Nrf2 and Keap1 was detected by Western blotting assay. (<b>c</b>) HaCaT cells were treated with <b>3b-9</b> (2.5–10 µM) for 24 h. The expression of TrxR1 was detected by Western blotting assay. (<b>d</b>) HaCaT cells were treated with <b>4b-3</b> (2.5–10 µM) for 24 h. The expression of TrxR1 was detected by Western blotting assay. (<b>e</b>) HaCaT cells were treated with <b>3b-9</b> (2.5–10 µM) for 24 h. The expression of HO-1 was detected by Western blotting assay. (<b>f</b>) HaCaT cells were treated with <b>4b-3</b> (2.5–10 µM) for 24 h. The expression of HO-1 was detected by Western blotting assay. All the original images for the Western blotting assay are provided in <a href="#app1-antioxidants-11-00786" class="html-app">Supplementary Figures S41–S46</a>.</p>
Full article ">Figure 6
<p><b>4b-4</b> inhibits the viability of K562 cells. (<b>a</b>) K562 cells were incubated with different concentration of <b>4b-4</b> (2.5–10 µM) for 24, 48 and 72 h. Then, cell viability (%) was assessed by MTT assay. (<b>b</b>) IC<sub>50</sub> values of <b>4b-4</b> against K562 cells at 24, 48 and 72 h. Data are presented as mean ± SD for three independent experiments. ** <span class="html-italic">p</span> &lt; 0.01.</p>
Full article ">Figure 7
<p>Assessment of apoptosis and cell cycle arrest in K562 cells treated with <b>4b-4.</b> (<b>a</b>) K562 cells were treated with <b>4b-4</b> (2.5–20 µM) for 24 h, and then cell cycle was analyzed by flow cytometer. The histogram shows the proportion of each cell cycle phase. (<b>b</b>) K562 cells were treated with <b>4b-4</b> (2.5–20 µM) for 24 h, and then cell apoptosis was analyzed by flow cytometry. The histogram shows the percentage of apoptotic cells. Data are presented as mean ± SD for three independent experiments. ** <span class="html-italic">p</span> &lt; 0.01.</p>
Full article ">Scheme 1
<p>Synthesis of 2,3-dibromo-4-hydroxy-5-methoxybenzaldehyde (<b>1c</b>).</p>
Full article ">Scheme 2
<p>Synthesis of 2-bromo-3-hydroxy-4-methoxybenzaldehyde (<b>2b</b>). r.t., room temperature.</p>
Full article ">Scheme 3
<p>General procedure of methyl bromophenol derivatives.</p>
Full article ">Scheme 4
<p>General procedure of asymmetric methyl bromophenol derivatives.</p>
Full article ">Scheme 5
<p>Synthesis of 2,3-dibromo-6-methoxy-4-(methoxymethyl) phenol (<b>4b-6</b>).</p>
Full article ">
19 pages, 4100 KiB  
Article
In Silico Identification of Novel Inhibitors Targeting the Homodimeric Interface of Superoxide Dismutase from the Dental Pathogen Streptococcus mutans
by Carmen Cerchia, Emanuela Roscetto, Rosarita Nasso, Maria Rosaria Catania, Emmanuele De Vendittis, Antonio Lavecchia, Mariorosario Masullo and Rosario Rullo
Antioxidants 2022, 11(4), 785; https://doi.org/10.3390/antiox11040785 - 15 Apr 2022
Cited by 3 | Viewed by 2301
Abstract
The microaerophile Streptococcus mutans, the main microaerophile responsible for the development of dental plaque, has a single cambialistic superoxide dismutase (SmSOD) for its protection against reactive oxygen species. In order to discover novel inhibitors of SmSOD, possibly interfering with [...] Read more.
The microaerophile Streptococcus mutans, the main microaerophile responsible for the development of dental plaque, has a single cambialistic superoxide dismutase (SmSOD) for its protection against reactive oxygen species. In order to discover novel inhibitors of SmSOD, possibly interfering with the biofilm formation by this pathogen, a virtual screening study was realised using the available 3D-structure of SmSOD. Among the selected molecules, compound ALS-31 was capable of inhibiting SmSOD with an IC50 value of 159 µM. Its inhibition power was affected by the Fe/Mn ratio in the active site of SmSOD. Furthermore, ALS-31 also inhibited the activity of other SODs. Gel-filtration of SmSOD in the presence of ALS-31 showed that the compound provoked the dissociation of the SmSOD homodimer in two monomers, thus compromising the catalytic activity of the enzyme. A docking model, showing the binding mode of ALS-31 at the dimer interface of SmSOD, is presented. Cell viability of the fibroblast cell line BJ5-ta was not affected up to 100 µM ALS-31. A preliminary lead optimization program allowed the identification of one derivative, ALS-31-9, endowed with a 2.5-fold improved inhibition power. Interestingly, below this concentration, planktonic growth and biofilm formation of S. mutans cultures were inhibited by ALS-31, and even more by its derivative, thus opening the perspective of future drug design studies to fight against dental caries. Full article
(This article belongs to the Section Antioxidant Enzyme Systems)
Show Figures

Graphical abstract

Graphical abstract
Full article ">Figure 1
<p>Overview of <span class="html-italic">Sm</span>SOD architecture and residues at the dimer interface. The X-ray structure of <span class="html-italic">Sm</span>SOD (PDB 4YIP) is shown as a ribbon model, with the two monomers coloured in aquamarine and yellow. The active site residues (H26, H80, H166, D162) are shown as sticks; the metal ion and the coordinating water molecules are shown as orange and blue spheres, respectively. On the right side, a zoom-in of the residues composing the dimer interface in which H-bonds are depicted as black dashed lines and listed in the inserted table.</p>
Full article ">Figure 2
<p>Flow chart of Ligand-based (LBVS) and Structure-based (SBVS) virtual screening approaches.</p>
Full article ">Figure 3
<p>Effect of <b>ALS-31</b> or <b>ALS-19</b> on the activity of <span class="html-italic">Sm</span>SOD. The SOD activity was measured in triplicate, as indicated in the Materials and Methods, and reported as the mean ± SE. Values of residual activity were expressed as a percentage of the activity measured in the absence (<span class="html-graphic" id="antioxidants-11-00785-i005"><img alt="Antioxidants 11 00785 i005" src="/antioxidants/antioxidants-11-00785/article_deploy/html/images/antioxidants-11-00785-i005.png"/></span>) or in the presence of the indicated concentration of <b>ALS-31</b> (●) or <b>ALS-19</b> (∎).</p>
Full article ">Figure 4
<p>Effect of <b>ALS-31</b> on gel-filtration of <span class="html-italic">Sm</span>SOD. A protein sample of <span class="html-italic">Sm</span>SOD, 63 µM in 20 mM Tris•HCl buffer, pH 7.8, supplemented with 150 mM KCl and 1% (<span class="html-italic">v</span>/<span class="html-italic">v</span>) DMSO, was untreated or incubated at room temperature for 20 min with 200 µM <b>ALS-31</b>. The protein sample was then loaded on a Superdex 75 10/300 column and the elution profile was followed by a continuous absorbance monitoring at 280 nm. Untreated <span class="html-italic">Sm</span>SOD (black line); <span class="html-italic">Sm</span>SOD incubated with 200 µM <b>ALS-31</b> without (green line) or after the addition of 200 µM <b>ALS-31</b> in the elution buffer (red line). The elution volumes of bovine serum albumin (9.56 mL), egg albumin (10.44 mL), carbonic anhydrase (11.72 mL) and cytochrome <span class="html-italic">c</span> (13.51 mL), used as standard protein markers, are indicated by inverted triangles. Their position was unaffected by the addition of <b>ALS-31</b> in equilibration and elution buffer.</p>
Full article ">Figure 5
<p>Representative effect of <b>ALS-31</b> on the activity of different SODs. The activity of <span class="html-italic">St</span>SOD (<b>A</b>), Fe-SOD from <span class="html-italic">Escherichia coli</span> (<b>B</b>), Mn–SOD from rat mitochondria (<b>C</b>) or Cu/ZnSOD from bovine erythrocytes (<b>D</b>) was measured and expressed (●) as indicated in <a href="#antioxidants-11-00785-f003" class="html-fig">Figure 3</a>.</p>
Full article ">Figure 6
<p>Effect of <b>ALS-31</b> on the colony formation of fibroblast cell line BJ-5ta. Cells were treated with vehicle alone or the indicated concentration of <b>ALS-31</b>. After 10 days treatment, plates were photographed and images of representative experiments are shown. Other details are as indicated in the Materials and Methods section.</p>
Full article ">Figure 7
<p>(<b>A</b>) Predicted binding mode of compound <b>ALS-31</b> (displayed as pink sticks) at the dimer interface of <span class="html-italic">Sm</span>SOD (PDB 4YIP). The amino acid side chains important for ligand binding are represented as sticks and labelled. The metal ion is represented as an orange sphere. Hydrogen bonds are shown as black dashed lines. (<b>B</b>) 2D ligand interaction diagram of compound <b>ALS-31</b>. Positively charged amino acids are represented with dark blue drops, negatively charged amino acids are represented with red drops, polar amino acids are represented with light blue drops and hydrophobic amino acids are represented with green drops. H-bonds are depicted with purple arrows. Straight red lines represent cation-π interactions. (<b>C</b>) Superposition of <b>ALS-31</b> docked pose with monomer A residues E165 and S126 (displayed as yellow sticks).</p>
Full article ">Figure 8
<p>Effect of <b>ALS-31</b> and <b>ALS-31-9</b> on the planktonic growth of <span class="html-italic">Streptococcus mutans</span> cultures. The antimicrobial activity of <span class="html-italic">S. mutans</span> was investigated and evaluated, as indicated in Materials and Methods, in the absence (<span class="html-graphic" id="antioxidants-11-00785-i005"><img alt="Antioxidants 11 00785 i005" src="/antioxidants/antioxidants-11-00785/article_deploy/html/images/antioxidants-11-00785-i005.png"/></span>) or in the presence of the indicated concentration of <b>ALS-31</b> (●) or <b>ALS-31-9</b> (▲).</p>
Full article ">Figure 9
<p>Effect of <b>ALS-31</b> and <b>ALS-31-9</b> on the antibiofilm activity of <span class="html-italic">Streptococcus mutans</span> cultures. The inhibition of total biofilm biomass formation of <span class="html-italic">S. mutans</span> was investigated and evaluated, as indicated in Materials and Methods, in the absence (<span class="html-graphic" id="antioxidants-11-00785-i005"><img alt="Antioxidants 11 00785 i005" src="/antioxidants/antioxidants-11-00785/article_deploy/html/images/antioxidants-11-00785-i005.png"/></span>) or in the presence of the indicated concentration of <b>ALS-31</b> (●) or <b>ALS-31-9</b> (▲). (<b>∗</b>): <span class="html-italic">p</span> &lt; 0.0001 compared to control.</p>
Full article ">
19 pages, 1214 KiB  
Review
Role of Oxidative Stress in Diabetic Cardiomyopathy
by Bart De Geest and Mudit Mishra
Antioxidants 2022, 11(4), 784; https://doi.org/10.3390/antiox11040784 - 15 Apr 2022
Cited by 72 | Viewed by 6200
Abstract
Type 2 diabetes is a redox disease. Oxidative stress and chronic inflammation induce a switch of metabolic homeostatic set points, leading to glucose intolerance. Several diabetes-specific mechanisms contribute to prominent oxidative distress in the heart, resulting in the development of diabetic cardiomyopathy. Mitochondrial [...] Read more.
Type 2 diabetes is a redox disease. Oxidative stress and chronic inflammation induce a switch of metabolic homeostatic set points, leading to glucose intolerance. Several diabetes-specific mechanisms contribute to prominent oxidative distress in the heart, resulting in the development of diabetic cardiomyopathy. Mitochondrial overproduction of reactive oxygen species in diabetic subjects is not only caused by intracellular hyperglycemia in the microvasculature but is also the result of increased fatty oxidation and lipotoxicity in cardiomyocytes. Mitochondrial overproduction of superoxide anion radicals induces, via inhibition of glyceraldehyde 3-phosphate dehydrogenase, an increased polyol pathway flux, increased formation of advanced glycation end-products (AGE) and activation of the receptor for AGE (RAGE), activation of protein kinase C isoforms, and an increased hexosamine pathway flux. These pathways not only directly contribute to diabetic cardiomyopathy but are themselves a source of additional reactive oxygen species. Reactive oxygen species and oxidative distress lead to cell dysfunction and cellular injury not only via protein oxidation, lipid peroxidation, DNA damage, and oxidative changes in microRNAs but also via activation of stress-sensitive pathways and redox regulation. Investigations in animal models of diabetic cardiomyopathy have consistently demonstrated that increased expression of the primary antioxidant enzymes attenuates myocardial pathology and improves cardiac function. Full article
Show Figures

Figure 1

Figure 1
<p>Central role of reactive oxygen species and oxidative distress in the development of diabetic cardiomyopathy. Mitochondrial overproduction of superoxide anion radicals induces, via inhibition of glyceraldehyde 3-phosphate dehydrogenase, an increased polyol pathway flux, increased advanced glycation end-products (AGE) formation and activation of the receptor for AGE (RAGE), activation of protein kinase C isoforms, and an increased hexosamine pathway flux. These pathways not only directly contribute to diabetic cardiomyopathy (arrows not shown) but are themselves a source of additional reactive oxygen species and oxidative distress. Oxidative distress itself is also a cause of insulin resistance.</p>
Full article ">Figure 2
<p>Prevention and intervention studies directly supporting the role of oxidative stress in diabetic cardiomyopathy. Antioxidant strategies prevent the development of diabetic cardiomyopathy, supporting the central role of oxidative stress in the pathogenesis of this disorder. HDL-targeted therapies, increasing the anti-oxidative potential of HDL, not only prevent diabetic cardiomyopathy but also result in reverse remodeling and reversal of heart failure in pre-existing diabetic cardiomyopathy.</p>
Full article ">
16 pages, 1106 KiB  
Article
Effect of Dietary Phenolic Compounds on Incidence of Cardiovascular Disease in the SUN Project; 10 Years of Follow-Up
by Zenaida Vázquez-Ruiz, Estefanía Toledo, Facundo Vitelli-Storelli, Leticia Goni, Víctor de la O, Maira Bes-Rastrollo and Miguel Ángel Martínez-González
Antioxidants 2022, 11(4), 783; https://doi.org/10.3390/antiox11040783 - 14 Apr 2022
Cited by 17 | Viewed by 3163
Abstract
The health benefits of plant-based diets have been reported. Plant-based diets found in Spain and other Mediterranean countries differ from typical diets in other countries. In the Mediterranean diet, a high intake of phenolic compounds through olives, olive oil, and red wine may [...] Read more.
The health benefits of plant-based diets have been reported. Plant-based diets found in Spain and other Mediterranean countries differ from typical diets in other countries. In the Mediterranean diet, a high intake of phenolic compounds through olives, olive oil, and red wine may play an important role in cardiovascular prevention. Prospective studies carried out in Mediterranean countries may provide interesting insights. A relatively young Mediterranean cohort of 16,147 Spanish participants free of cardiovascular disease (CVD) was followed (61% women, mean (SD) age 37(12) years at baseline) for a median of 12.2 years. Dietary intake was repeatedly assessed using a 136-item validated food frequency questionnaire, and (poly)phenol intake was obtained using the Phenol-Explorer database. Participants were classified as incident cases of CVD if a medical diagnosis of myocardial infarction, stroke, or cardiovascular death was medically confirmed. Time-dependent Cox regression models were used to assess the relationship between (poly)phenol intake and the incidence of major CVD. A suboptimal intake of phenolic compounds was independently associated with a higher risk of CVD, multivariable-adjusted hazard ratio for the lowest versus top 4 quintiles: 1.85 (95% CI: 1.09–3.16). A moderate-to-high dietary intake of phenolic compounds, especially flavonoids, is likely to reduce CVD incidence in the context of a Mediterranean dietary pattern. Full article
Show Figures

Figure 1

Figure 1
<p>Flowchart of participants in the SUN (‘Seguimiento Universidad de Navarra’) included in analyses of (poly)phenol intake and incident cardiovascular diseases. Abbreviation: Food frequency questionnaire (FFQ).</p>
Full article ">Figure 2
<p>Nelson–Aalen cumulative hazard ratios estimates of cardiovascular disease according to low intake (Q1) vs. a medium-high (Q2–Q5) total PI. Multivariable adjusted model 1 using inverse probability weighting to adjust for sex, age, energy intake (kcal/day), smoking status (never smoker, current smoker or former smoker), lifetime tobacco exposure (packs-years), BMI (kg/m<sup>2</sup>) and the quadratic term, dyslipidemia(yes/no), hypertension(yes/no), diabetes, family history of CVD (yes/no), physical activity (metabolic equivalents-h/week), TV watching (hours/day), use of cardiovascular drugs (yes/no), health consciousness (quintiles), energy-adjusted alcohol intake (g/day), and energy-adjusted sodium intake (g/day).</p>
Full article ">
26 pages, 6123 KiB  
Article
HO-1 Upregulation by Kaempferol via ROS-Dependent Nrf2-ARE Cascade Attenuates Lipopolysaccharide-Mediated Intercellular Cell Adhesion Molecule-1 Expression in Human Pulmonary Alveolar Epithelial Cells
by Chien-Chung Yang, Li-Der Hsiao, Chen-Yu Wang, Wei-Ning Lin, Ya-Fang Shih, Yi-Wen Chen, Rou-Ling Cho, Hui-Ching Tseng and Chuen-Mao Yang
Antioxidants 2022, 11(4), 782; https://doi.org/10.3390/antiox11040782 - 14 Apr 2022
Cited by 14 | Viewed by 2947
Abstract
Lung inflammation is a pivotal event in the pathogenesis of acute lung injury. Heme oxygenase-1 (HO-1) is a key antioxidant enzyme that could be induced by kaempferol (KPR) and exerts anti-inflammatory effects. However, the molecular mechanisms of KPR-mediated HO-1 expression and its effects [...] Read more.
Lung inflammation is a pivotal event in the pathogenesis of acute lung injury. Heme oxygenase-1 (HO-1) is a key antioxidant enzyme that could be induced by kaempferol (KPR) and exerts anti-inflammatory effects. However, the molecular mechanisms of KPR-mediated HO-1 expression and its effects on inflammatory responses remain unknown in human pulmonary alveolar epithelial cells (HPAEpiCs). This study aimed to verify the relationship between HO-1 expression and KPR treatment in both in vitro and in vivo models. HO-1 expression was determined by real time-PCR, Western blotting, and promoter reporter analyses. The signaling components were investigated by using pharmacological inhibitors or specific siRNAs. Chromatin immunoprecipitation (ChIP) assay was performed to investigate the interaction between nuclear factor erythroid-2-related factor (Nrf2) and antioxidant response elements (ARE) binding site of HO-1 promoter. The effect of KPR on monocytes (THP-1) binding to HPAEpiCs challenged with lipopolysaccharides (LPS) was determined by adhesion assay. We found that KPR-induced HO-1 level attenuated the LPS-induced intercellular cell adhesion protein 1 (ICAM-1) expression in HPAEpiCs. KPR-induced HO-1 mRNA and protein expression also attenuated ICAM-1 expression in mice. Tin protoporphyrin (SnPP)IX reversed the inhibitory effects of KPR in HPAEpiCs. In addition, in HPAEpiCs, KPR-induced HO-1 expression was abolished by both pretreating with the inhibitor of NADPH oxidase (NOX, apocynin (APO)), reactive oxygen species (ROS) (N-acetyl-L-cysteine (NAC)), Src (Src kinase inhibitor II (Srci II)), Pyk2 (PF431396), protein kinase C (PKC)α (Gö6976), p38 mitogen-activated protein kinase (MAPK) inhibitor (p38i) VIII, or c-Jun N-terminal kinases (JNK)1/2 (SP600125) and transfection with their respective siRNAs. The transcription of the homx1 gene was enhanced by Nrf2 activated by JNK1/2 and p38α MAPK. The binding activity between Nrf2 and HO-1 promoter was attenuated by APO, NAC, Srci II, PF431396, or Gö6983. KPR-mediated NOX/ROS/c-Src/Pyk2/PKCα/p38α MAPK and JNK1/2 activate Nrf2 to bind with ARE on the HO-1 promoter and induce HO-1 expression, which further suppresses the LPS-mediated inflammation in HPAEpiCs. Thus, KPR exerts a potential strategy to protect against pulmonary inflammation via upregulation of the HO-1. Full article
(This article belongs to the Special Issue Pharmacological and Clinical Significance of Heme Oxygenase-1 2022)
Show Figures

Graphical abstract

Graphical abstract
Full article ">Figure 1
<p>KPR inhibits ICAM-1 expression induced by LPS via HO-1 upregulation in HPAEpiCs. (<b>A</b>) HPAEpiCs were pretreated with KPR (10 μM) for 1 h, and then incubated with LPS (20 µg/mL) for the indicated time intervals. The protein levels of ICAM-1 and HO-1 were determined by Western blot using GAPDH as a loading control. (<b>B</b>) Cells were pretreated with KPR (10 μM) for 1 h, and then incubated with LPS (20 μg/mL) for 4 h. The levels of ICAM-1 and HO-1 mRNA were determined by real-time PCR. (<b>C</b>) Cells were transfected with scrambled or HO-1 siRNA, treated with KPR (10 μM) for 1 or 8 h, and then incubated with LPS (20 μg/mL) for 16 h. The levels of ICAM-1 and HO-1 protein were determined by Western blot using GAPDH as a loading control. (<b>D</b>) Cells were pretreated KPR for 1 h, then incubated by ZnPPIX for 1 h, and finally stimulated with LPS for 16 h. In addition, cells were incubated with LPS for 16 h and treated with an anti-ICAM-1 neutralizing antibody (2 μg/mL) for 1 h. The adhesion of THP-1 cells (displayed in green) was measured. Data are expressed as mean ± SEM (<span class="html-italic">n</span> = 5), analyzed with one way ANOVA and Dunnett’s post hoc test. # <span class="html-italic">p</span> &lt; 0.01, as compared with the cells exposed to vehicle alone; or significantly different as indicated.</p>
Full article ">Figure 2
<p>Upregulation of HO-1 by KPR attenuates LPS-induced pulmonary inflammatory responses in vivo. (<b>A</b>) Mice were intra-peritoneally pretreated with KPR (0.1 mg kg<sup>−1</sup>) or vehicle for 1 h, and then intratracheally administered with or without LPS (3 mg kg<sup>−1</sup>) for 16 h. H&amp;E and immunohistochemical staining for ICAM-1 and HO-1 in serial sections of the lung tissues from Sham (0.1 mL of DMSO-PBS (1:100) with 0.1% (<span class="html-italic">w</span>/<span class="html-italic">v</span>) BSA treated mice), LPS (LPS-treated mice), and KPR + LPS (kaempferol plus LPS mice). The arrows indicate the ICAM-1 and HO-1 expression on pulmonary alveolar cells. All images are representative of five mice per group. (<b>B</b>,<b>C</b>) Lung tissues were homogenized to extract protein and mRNA. The levels of ICAM-1 and HO-1 protein (<b>B</b>) and mRNA (<b>C</b>) were determined by Western blot and real-time PCR. (<b>D</b>) Leukocyte count in the bronchoalveolar lavage fluid (BALF) of sham, LPS, and KPR + LPS groups. Data are expressed as mean ± SEM (<span class="html-italic">n</span> = 5), analyzed with one way ANOVA and Dunnett’s post hoc test. # <span class="html-italic">p</span> &lt; 0.01, as compared with the cells exposed to vehicle alone; or significantly different as indicated.</p>
Full article ">Figure 3
<p>KPR induces HO-1 expression in HPAEpiCs. (<b>A</b>) HPAEpiCs were treated with various concentrations of KPR for the indicated time intervals. The protein expression of HO-1 was determined by Western blot using GAPDH as a loading control. (<b>B</b>) Cells were treated with various concentrations of KPR for 24 h and the cell viability was examined by an XTT kit. (<b>C</b>) HPAEpiCs were treated with KPR (10 μM) for the indicated time intervals. The HO-1 mRNA expression and promoter activity were analyzed by real-time PCR and promoter activity assay kit, respectively. (<b>D</b>) HPAEpiCs were preincubated with various concentrations of either Act. D or CHI for 1 h and then incubated with vehicle or KPR (10 μM) for 16 h. The levels of HO-1 protein expression were determined by Western blot using GAPDH as a loading control. (<b>E</b>) Cells were pretreated with/without 100 nM Act. D or 10 μM CHI for 1 h, and then incubated with DMSO or KPR (10 μM) for 6 h. The level of HO-1 mRNA expression was analyzed by real-time PCR. Data are expressed as mean ± SEM (<span class="html-italic">n</span> = 5), analyzed with one way ANOVA and Dunnett’s post hoc test. # <span class="html-italic">p</span> &lt; 0.01, as compared with the cells exposed to vehicle alone; or significantly different as indicated.</p>
Full article ">Figure 4
<p>NADPH oxidase activation and ROS generation by KPR regulate HO-1 expression. (<b>A</b>) HPAEpiCs were pretreated with various concentrations of APO or NAC for 1 h and then incubated with vehicle or KPR (10 μM) for 16 h. The protein expression of HO-1 was determined by Western blot using GAPDH as a loading control. (<b>B</b>) Cells were pretreated with or without APO (100 μΜ) or NAC (1 mM) for 1 h, and then incubated with DMSO or KPR (10 μM) for 6 h or 8 h. The HO-1 mRNA expression and promoter activity were analyzed by real-time PCR (6 h) and promoter activity assay (8 h), respectively. (<b>C</b>,<b>D</b>) The chemiluminescence was measured for NADPH oxidase activation and ROS accumulation. Cells were treated with KPR (10 μM) at the indicated time intervals. (<b>D</b>) Cells were pretreated with APO (100 μM) or NAC (1 mM) for 1 h and then incubated with KPR (10 μM) for the indicated time intervals (30 min for NADPH oxidase activation; 2 h for ROS). (<b>E</b>) Cells were transfected with p47 or NOX2 siRNA, and then incubated with KPR (10 μM) for 16 h. The protein levels of HO-1, p47, NOX2, and GAPDH were determined by Western blot. (<b>F</b>) Cells were pretreated with p47 siRNA, and then incubated with KPR (10 μM) for the indicated time intervals. The levels of phospho-p47 and total p47 were determined by Western blot. Data are expressed as mean ± SEM (<span class="html-italic">n</span> = 5), analyzed with one way ANOVA and Dunnett’s post hoc test. # <span class="html-italic">p</span> &lt; 0.01, as compared with the cells exposed to vehicle alone; or significantly different as indicated.</p>
Full article ">Figure 5
<p>c-Src participates in KPR-induced HO-1 expression. (<b>A</b>) HPAEpiCs were pretreated with various concentrations of Srci Ⅱ for 1 h and then incubated with DMSO or KPR (10 μM) for 16 h. The protein expression of HO-1 was determined by Western blot using GAPDH as a loading control. (<b>B</b>) Cells were pretreated with or without Srci Ⅱ (10 μM) for 1 h and then incubated with DMSO or KPR (10 μM) for the indicated time intervals. The HO-1 mRNA expression and promoter activity were analyzed by real-time PCR (6 h) and promoter activity assay (8 h), respectively. (<b>C</b>) Cells were transfected with scrambled (scrb) or c-Src siRNA, and then incubated with KPR (10 μM) for 16 h. The protein levels of HO-1, c-Src, and GAPDH were determined by Western blot. (<b>D</b>) Cells were transfected with c-Src, p47, or NOX2 siRNA, and then incubated with KPR (10 μM) for the indicated time intervals. The levels of phospho-c-Src and total levels of c-Src, p47, and NOX2 were determined by Western blot. Data are expressed as mean ± SEM (<span class="html-italic">n</span> = 5), analyzed with one way ANOVA and Dunnett’s post hoc test. # <span class="html-italic">p</span> &lt; 0.01, as compared with the cells exposed to vehicle alone; or significantly different as indicated.</p>
Full article ">Figure 6
<p>Pyk2 involves in KPR-induced HO-1 expression. (<b>A</b>) HPAEpiCs were pretreated with various concentrations of PF431396 for 1 h and then incubated with DMSO or KPR (10 μM) for 16 h. The protein expression of HO-1 was determined by Western blot using GAPDH as a loading control. (<b>B</b>) Cells were pretreated with or without PF431396 (10 μM) for 1 h and then incubated with DMSO or KPR (10 μM) for the indicated time intervals. The HO-1 mRNA expression and promoter activity were analyzed by real-time PCR (6 h) and promoter activity assay (8 h), respectively. (<b>C</b>) Cells were transfected with scrambled (scrb) or Pyk2 siRNA, and then incubated with KPR (10 μM) for 16 h. The protein level of HO-1, Pyk2, and GAPDH was determined by Western blot. (<b>D</b>) Cells were transfected with c-Src or Pyk2 siRNA, and then incubated with KPR (10 μM) for the indicated time intervals. The levels of phospho-Pyk2, total c-Src, and total Pyk2 were determined by Western blot. Data are expressed as mean ± SEM (<span class="html-italic">n</span> = 5), analyzed with one way ANOVA and Dunnett’s post hoc test. # <span class="html-italic">p</span> &lt; 0.01, as compared with the cells exposed to vehicle alone; or significantly different as indicated.</p>
Full article ">Figure 7
<p>PKCα is required for KPR-induced HO-1 Expression. (<b>A</b>) HPAEpiCs were pretreated with various concentrations of Gő6976 for 1 h and then incubated with DMSO or KPR (10 μM) for 16 h. The protein expression of HO-1 was determined by Western blot using GAPDH as a loading control. (<b>B</b>) Cells were pretreated with or without Gő6976 (3 μM) for 1 h and then incubated with DMSO or KPR (10 μM) for the indicated time intervals. The HO-1 mRNA expression and promoter activity were analyzed by real-time PCR (6 h) and promoter activity assay (8 h), respectively. (<b>C</b>) Cells were transfected with scrambled (scrb) or PKCα siRNA, and then incubated with KPR (10 μM) for 16 h. The protein levels of HO-1, PKCα, and GAPDH were determined by Western blot. (<b>D</b>) Cells were transfected with PKCα or Pyk2 siRNA, and then incubated with KPR (10 μM) for the indicated time intervals. The levels of phospho-PKCα, total PKCα, and total Pyk2 were determined by Western blot. Data are expressed as mean ± SEM (<span class="html-italic">n</span> = 5), analyzed with one way ANOVA and Dunnett’s post hoc test. # <span class="html-italic">p</span> &lt; 0.01, as compared with the cells exposed to vehicle alone; or significantly different as indicated.</p>
Full article ">Figure 8
<p>KPR-induced HO-1 expression is mediated through p38 MAKP. (<b>A</b>) HPAEpiCs were pre-treated with various concentrations of p38i VIII for 1 h and then incubated with DMSO or KPR (10 μM) for 16 h. The protein expression of HO-1 was determined by Western blot using GAPDH as a loading control. (<b>B</b>) Cells were pretreated with or without p38i VIII (10 μM) for 1 h, and then incubated with DMSO or KPR (10 μM) for the indicated time intervals. The HO-1 mRNA expression and promoter activity were analyzed by real-time PCR (6 h) and promoter activity assay (8 h), respectively. (<b>C</b>) Cells were transfected with scrambled (scrb) or p38 siRNA, and then incubated with KPR (10 μM) for 16 h. The protein levels of HO-1, p38, and GAPDH were determined by Western blot. (<b>D</b>) Cells were transfected with p38 or PKCα siRNA, and then incubated with KPR (10 μM) for the indicated time intervals. The levels of phospho-p38, total p38, and total PKCα were determined by Western blot. Data are expressed as mean ± SEM (<span class="html-italic">n</span> = 5), analyzed with one way ANOVA and Dunnett’s post hoc test. # <span class="html-italic">p</span> &lt; 0.01, as compared with the cells exposed to vehicle alone; or significantly different as indicated.</p>
Full article ">Figure 9
<p>JNK1/2 is necessary for KPR-induced HO-1 expression. (<b>A</b>) HPAEpiCs were pretreated with various concentrations of SP600125 for 1 h and then incubated with DMSO or KPR (10 μM) for 16 h. The protein expression of HO-1 was determined by Western blot using GAPDH as a loading control. (<b>B</b>) Cells were pretreated with/without SP600125 (10 μM) for 1 h, and then incubated with DMSO or KPR (10 μM) for 6 h or 8 h. The HO-1 mRNA expression and promoter activity were analyzed by real-time PCR (6 h) and promoter activity assay (8 h), respectively. (<b>C</b>) Cells were transfected with scrambled (scrb), JNK1, or JNK2 siRNA, and then incubated with KPR (10 μM) for 16 h. The protein levels of HO-1, JNK1/2, and GAPDH were determined by Western blot. (<b>D</b>) Cells were transfected with PKCα, JNK1, or JNK2 siRNA, and then incubated with KPR (10 μM) for the indicated time intervals. The levels of phospho-JNK1/2, total JNK1/2, and total PKCα were determined by Western blot. Data are expressed as mean ± SEM (<span class="html-italic">n</span> = 5), analyzed with one way ANOVA and Dunnett’s post hoc test. # <span class="html-italic">p</span> &lt; 0.01, as compared with the cells exposed to vehicle alone; or significantly different as indicated.</p>
Full article ">Figure 10
<p>Nrf2 activated by protein kinases is involved in KPR-induced HO-1 expression. (<b>A</b>) HPAEpiCs were transfected with scrambled (scrb) or Nrf2 siRNA, and then incubated with DMSO or KPR (10 μM) for 16 h. The protein expression of HO-1 was determined by Western blot analysis using GAPDH as a loading control. (<b>B</b>) Cells were transfected with scrambled (scrb) or Nrf2 siRNA, and then incubated with DMSO or KPR (10 μM) for 6 h. The HO-1 mRNA expression was analyzed by real-time PCR. (<b>C</b>) HPAEpiCs were co-transfected with ARE promoter-Luc gene and β-galactosidase and then incubated with KPR (10 μM) for the indicated time intervals. The levels of Nrf2 binding with ARE were examined by a luciferase reporter assay kit. Cells were pretreated with APO (100 μM), NAC (1 mM), or Srci II (10 μM) for 1 h and then incubated with KPR (10 μM) for 6 h. ARE promoter activity was determined by a luciferase reporter assay kit. (<b>D</b>) Cells were incubated with KPR (10 μM) for the indicated time intervals (upper). The cells were pretreated with APO (100 μM), NAC (1 mM), Srci II (10 μM), PF431396 (10 μM), or Gő6976 (3 μM) for 1 h, and then incubated with KPR (10 μM) for 1 h (bottom). The DNA binding activity of Nrf2 on ARE1 was determined by chromatin immunoprecipitation assay. The immunoprecipitated DNA was analyzed by real-time qPCR with SYBR Green. (<b>E</b>) Cells were transfected with scrambled (scrb), p38, JNK2, or Nrf2 siRNA, and then incubated with KPR (10 μM) for the indicated time intervals. The levels of phospho-Nrf2, total Nrf2, p38, and JNK2 were determined by Western blot. (<b>F</b>) The cells were pretreated without or with APO (100 μM), NAC (1 mM), Srci II (10 μM), PF431396 (10 μM), Gő6976 (3 μM), SP600125 (10 μM), or p38i VIII (10 μM) for 1 h, and then incubated with KPR (10 μM) for 30 min. The localization and expression of Nrf2 were determined by immunofluorescent staining (green) and nuclei were stained with DAPI (blue). Scale bar: 50 µm. Data are expressed as mean ± SEM (<span class="html-italic">n</span> = 5), analyzed with one way ANOVA and Dunnett’s post hoc test. # <span class="html-italic">p</span> &lt; 0.01, as compared with the cells exposed to vehicle alone; or significantly different as indicated.</p>
Full article ">Figure 10 Cont.
<p>Nrf2 activated by protein kinases is involved in KPR-induced HO-1 expression. (<b>A</b>) HPAEpiCs were transfected with scrambled (scrb) or Nrf2 siRNA, and then incubated with DMSO or KPR (10 μM) for 16 h. The protein expression of HO-1 was determined by Western blot analysis using GAPDH as a loading control. (<b>B</b>) Cells were transfected with scrambled (scrb) or Nrf2 siRNA, and then incubated with DMSO or KPR (10 μM) for 6 h. The HO-1 mRNA expression was analyzed by real-time PCR. (<b>C</b>) HPAEpiCs were co-transfected with ARE promoter-Luc gene and β-galactosidase and then incubated with KPR (10 μM) for the indicated time intervals. The levels of Nrf2 binding with ARE were examined by a luciferase reporter assay kit. Cells were pretreated with APO (100 μM), NAC (1 mM), or Srci II (10 μM) for 1 h and then incubated with KPR (10 μM) for 6 h. ARE promoter activity was determined by a luciferase reporter assay kit. (<b>D</b>) Cells were incubated with KPR (10 μM) for the indicated time intervals (upper). The cells were pretreated with APO (100 μM), NAC (1 mM), Srci II (10 μM), PF431396 (10 μM), or Gő6976 (3 μM) for 1 h, and then incubated with KPR (10 μM) for 1 h (bottom). The DNA binding activity of Nrf2 on ARE1 was determined by chromatin immunoprecipitation assay. The immunoprecipitated DNA was analyzed by real-time qPCR with SYBR Green. (<b>E</b>) Cells were transfected with scrambled (scrb), p38, JNK2, or Nrf2 siRNA, and then incubated with KPR (10 μM) for the indicated time intervals. The levels of phospho-Nrf2, total Nrf2, p38, and JNK2 were determined by Western blot. (<b>F</b>) The cells were pretreated without or with APO (100 μM), NAC (1 mM), Srci II (10 μM), PF431396 (10 μM), Gő6976 (3 μM), SP600125 (10 μM), or p38i VIII (10 μM) for 1 h, and then incubated with KPR (10 μM) for 30 min. The localization and expression of Nrf2 were determined by immunofluorescent staining (green) and nuclei were stained with DAPI (blue). Scale bar: 50 µm. Data are expressed as mean ± SEM (<span class="html-italic">n</span> = 5), analyzed with one way ANOVA and Dunnett’s post hoc test. # <span class="html-italic">p</span> &lt; 0.01, as compared with the cells exposed to vehicle alone; or significantly different as indicated.</p>
Full article ">Figure 11
<p>A schematic pathway for KPR-induced HO-1 expression in HPAEpiCs. KPR attenuated LPS-induced ICAM-1 expression and lung monocyte/leukocyte accumulation through upregulation of HO-1 via enhanced p47<sup>phox</sup>/Nox2 activity, resulting in the accumulation of intracellular ROS. Imbalance in oxidative stress promoted the phosphorylation of c-Src/Pyk2/PKCα/p38α MAPK- and JNK1/2-dependent Nrf2 activation, which further binds with ARE on HO-1 promoter and suppresses the LPS-mediated inflammation in HPAEpiCs and in vivo. Thus, upregulation of the HO-1 by KPR exerts a potential strategy to protect against pulmonary inflammation.</p>
Full article ">
18 pages, 3454 KiB  
Article
Antioxidant Effects of Korean Propolis in HaCaT Keratinocytes Exposed to Particulate Matter 10
by In Ah Bae, Jae Won Ha, Joon Yong Choi and Yong Chool Boo
Antioxidants 2022, 11(4), 781; https://doi.org/10.3390/antiox11040781 - 14 Apr 2022
Cited by 9 | Viewed by 2938
Abstract
Air pollution causes oxidative stress that leads to inflammatory diseases and premature aging of the skin. The purpose of this study was to examine the antioxidant effect of Korean propolis on oxidative stress in human epidermal HaCaT keratinocytes exposed to particulate matter with [...] Read more.
Air pollution causes oxidative stress that leads to inflammatory diseases and premature aging of the skin. The purpose of this study was to examine the antioxidant effect of Korean propolis on oxidative stress in human epidermal HaCaT keratinocytes exposed to particulate matter with a diameter of less than 10 μm (PM10). The total ethanol extract of propolis was solvent-fractionated with water and methylene chloride to divide into a hydrophilic fraction and a lipophilic fraction. The lipophilic fraction of propolis was slightly more cytotoxic, and the hydrophilic fraction was much less cytotoxic than the total extract. The hydrophilic fraction did not affect the viability of cells exposed to PM10, but the total propolis extract and the lipophilic fraction aggravated the toxicity of PM10. The total extract and hydrophilic fraction inhibited PM10-induced ROS production and lipid peroxidation in a concentration-dependent manner, whereas the lipophilic fraction did not show such effects. High-performance liquid chromatography with photodiode array detection (HPLC-DAD) analysis showed that the hydrophilic fraction contained phenylpropanoids, such as caffeic acid, p-coumaric acid, and ferulic acid, whereas the lipophilic faction contained caffeic acid phenethyl ester (CAPE). The former three compounds inhibited PM10-induced ROS production, lipid peroxidation, and/or glutathione oxidation, and ferulic acid was the most effective among them, but CAPE exhibited cytotoxicity and aggravated the toxicity of PM10. This study suggests that Korean propolis, when properly purified, has the potential to be used as a cosmetic material that helps to alleviate the skin toxicity of air pollutants. Full article
(This article belongs to the Special Issue Antioxidant Activity of Honey Bee Products)
Show Figures

Graphical abstract

Graphical abstract
Full article ">Figure 1
<p>Effects of total propolis extract and its solvent fractions on the viability of human HaCaT keratinocytes exposed to PM<sub>10</sub>. In (<b>A</b>), the total ethanolic extract of Korean propolis was divided into a hydrophilic and a lipophilic fraction by solvent partition between water and methylene chloride. Cells were treated with the total extract (<b>B</b>), a lipophilic fraction (<b>C</b>), or a hydrophilic fraction (<b>D</b>) at the specified concentration alone or in combination with PM<sub>10</sub> (200 μg mL<sup>−1</sup>) for 48 h. Cell viability was determined by the 3-(4,5-dimethylthiazol-2-yl)-2,5-diphenyl tetrazolium bromide (MTT) assay. Data are presented as mean ± SD (<span class="html-italic">n</span> = 5). (<b>D</b>) Duncan’s multiple range test was performed to compare all group means to each other. Groups that share the same letters (a–e) do not have significantly different means at the <span class="html-italic">p</span> &lt; 0.05 level.</p>
Full article ">Figure 2
<p>Effects of total propolis extract and its fractions on the reactive oxygen species (ROS) production and lipid peroxidation in HaCaT keratinocytes exposed to PM<sub>10</sub>. Cells were treated with the total extract (<b>A</b>,<b>D</b>), a lipophilic fraction (<b>B</b>,<b>E</b>), or a hydrophilic fraction (<b>C</b>,<b>F</b>) at the specified concentration alone or in combination with PM<sub>10</sub> (200 μg mL<sup>−1</sup>) for 60 min for the determination of ROS production, or 48 h for the determination of lipid peroxidation. In (<b>A</b>–<b>C</b>), cells were pre-labeled with 10 μM 2’-7’dichlorofluorescin diacetate (DCFH-DA) for 30 min, and fluorescence of oxidized probe due to cellular ROS production was determined after treatments with the extracts and/or PM<sub>10</sub>. In (<b>D</b>–<b>F</b>), lipid peroxidation levels of cell lysates were determined by the thiobarbituric acid (TBA) assay. Data are presented as malondialdehyde (MDA) levels corrected for protein contents. Data are presented as mean ± SD (<span class="html-italic">n</span> = 4 for (<b>A</b>–<b>C</b>); <span class="html-italic">n</span> = 3 for (<b>D</b>–<b>F</b>)). Duncan’s multiple range test was performed to compare all group means to each other. Groups that share the same letters (a–d) do not have significantly different means at the <span class="html-italic">p</span> &lt; 0.05 level.</p>
Full article ">Figure 3
<p>Effects of a hydrophilic fraction of propolis on the ROS production and lipid peroxidation in HaCaT keratinocytes exposed to PM<sub>10</sub>. Cells were treated with a hydrophilic fraction at the specified concentration alone or in combination with PM<sub>10</sub> (200 μg mL<sup>−1</sup>) for 60 min for the determination of ROS production, or 48 h for the determination of lipid peroxidation. In (<b>A</b>), cells were pre-labeled with 10 μM (DCFH-DA) for 30 min and fluorescence of the oxidized probe due to cellular ROS production was determined after treatments with the extracts and/or PM<sub>10</sub>. In (<b>B</b>), lipid peroxidation levels of cell lysates were determined by TBA assay. Data are presented as MDA levels corrected for protein contents. Data are presented as mean ± SD (<span class="html-italic">n</span> = 4). Duncan’s multiple range test was performed to compare all group means to each other. Groups that share the same letters (a–f) do not have significantly different means at the <span class="html-italic">p</span> &lt; 0.05 level.</p>
Full article ">Figure 4
<p>High-performance liquid chromatography-photodiode array detection (HPLC-DAD) analysis of the total extract of propolis and its solvent fractions. Authentic caffeic acid phenethyl ester (CAPE), caffeic acid, <span class="html-italic">p-</span>coumaric acid, and ferulic acid were used to identify the major peaks by comparing retention times and absorption spectra. Chromatograms detected at 310 nm and the absorption spectra of the designated peaks are shown.</p>
Full article ">Figure 5
<p>Effects of caffeic acid, <span class="html-italic">p-</span>coumaric acid, ferulic acid, and CAPE on viability in HaCaT keratinocytes exposed to PM<sub>10</sub>. In (<b>A</b>,<b>B</b>), cells were exposed to PM<sub>10</sub> (200 μg mL<sup>−1</sup>) for 48 h in the absence and presence of each compound at the indicated concentrations. Cell viability was determined by the MTT assay. Data are presented as mean ± SD (<span class="html-italic">n</span> = 4 for (<b>A</b>); <span class="html-italic">n</span> = 5 for (<b>B</b>)). Duncan’s multiple range test was performed to compare all group means to each other. Groups that share the same letters (a–d) do not have significantly different means at the <span class="html-italic">p</span> &lt; 0.05 level. In (<b>C</b>), the chemical structure of caffeic acid, <span class="html-italic">p-</span>coumaric acid, ferulic acid, and CAPE are shown.</p>
Full article ">Figure 6
<p>Effects of caffeic acid, <span class="html-italic">p-</span>coumaric acid, and ferulic acid on the ROS production in HaCaT keratinocytes exposed to PM<sub>10</sub>. Cells were labeled with DCFH-DA, treated with each compound at the indicated concentrations, and exposed to PM<sub>10</sub> (200 μg mL<sup>−1</sup>) for 60 min or not. In (<b>A</b>,<b>B</b>), the fluorescence of the cell extracts was measured to quantitatively determine ROS levels. Data are presented as mean ± SD (<span class="html-italic">n</span> = 4). Duncan’s multiple range test was performed to compare all group means to each other. Groups that share the same letters (a–l) do not have significantly different means at the <span class="html-italic">p</span> &lt; 0.05 level. Typical images of cells fluorescing due to ROS production are shown in (<b>C</b>).</p>
Full article ">Figure 7
<p>Flow cytometry for the ROS production in HaCaT keratinocytes exposed to PM<sub>10</sub> in the absence and presence of caffeic acid (CA), <span class="html-italic">p-</span>coumaric acid (PCA), ferulic acid (FA), and ascorbic acid (AA). The adherent cells were labeled with DCFH-DA, treated with vehicle or each compound at 30 μM, and exposed to PM<sub>10</sub> (200 μg mL<sup>−1</sup>) for 60 min or not. Cells were washed, detached, centrifuged down, and suspended in PBS for flow cytometry. (<b>A</b>) The gate was set to exclude the PM<sub>10</sub> particles and cell aggregates. (<b>B</b>) The plots of the cell counts versus fluorescence intensity are shown with a mark to define fluorescing cells. (<b>C</b>) Typical effects of PM<sub>10</sub> in the absence and presence of FA on the distribution of cells with different fluorescence levels. (<b>D</b>) The ratios (%) of fluorescing cells to the total gated cells are presented. Data represent mean ± SD (<span class="html-italic">n</span> = 3). Duncan’s multiple range test was performed to compare all group means to each other. Groups that share the same letters (a–e) do not have significantly different means at the <span class="html-italic">p</span> &lt; 0.05 level.</p>
Full article ">Figure 8
<p>Effects of caffeic acid, <span class="html-italic">p-</span>coumaric acid, and ferulic acid on the lipid peroxidation in HaCaT keratinocytes exposed to PM<sub>10</sub>. Cells were treated with each compound at 3–10 μM (<b>A</b>) or 30–100 μM (<b>B</b>) alone or in combination with PM<sub>10</sub> (200 μg mL<sup>−1</sup>) for 48 h. Lipid peroxidation levels of cell lysates were determined by TBA assay and data are presented as MDA levels corrected for protein contents. Data are presented as mean ± SD (<span class="html-italic">n</span> = 4). Duncan’s multiple range test was performed to compare all group means to each other. Groups that share the same letters (a–e) do not have significantly different means at the <span class="html-italic">p</span> &lt; 0.05 level.</p>
Full article ">Figure 9
<p>Effects of caffeic acid (CA), <span class="html-italic">p-</span>coumaric acid (PCA), and ferulic acid (FA) on the contents and ratios of glutathione (GSH) and glutathione disulfide (GSSG) in HaCaT keratinocytes exposed to PM<sub>10</sub>. Cells were treated with each compound at 30 μM and cultured in the absence or presence of PM<sub>10</sub> (200 μg mL<sup>−1</sup>) for 24 h. The total contents of GSH plus GSSG (<b>A</b>) were subtracted by the GSSG contents (<b>B</b>) to calculate the GSH contents (<b>C</b>). The ratios of GSSG contents to the total contents were presented in (<b>D</b>). Data are presented as mean ± SD (<span class="html-italic">n</span> = 3). Duncan’s multiple range test was performed to compare all group means to each other. Groups that share the same letters (a–e) do not have significantly different means at the <span class="html-italic">p</span> &lt; 0.05 level.</p>
Full article ">Figure 10
<p>Effects of caffeic acid, <span class="html-italic">p-</span>coumaric acid, and ferulic acid on the lipid peroxidation of HaCaT cell lysate treated with PM10 in vitro, and their free radical scavenging activities against 2,2-diphenyl-1-picrylhydrazyl radical (DPPH<sup>•</sup>) and 2,2’-azinobis-(3-ethylbenzothiazoline-6-sulfonic acid) cation radical (ABTS<sup>•</sup><sup>+</sup>) in vitro. (<b>A</b>) HaCaT cell lysate was treated with PM<sub>10</sub> (200 μg mL<sup>−1</sup>) for 24 h in the absence or presence of a compound at the specified concentration. DPPH<sup>•</sup> (<b>B</b>) and ABTS<sup>•</sup><sup>+</sup> (<b>C</b>) were reacted with each compound at different concentrations, and their remaining levels were measured by absorbance at 517 nm and 734 nm respectively. Data are presented as mean ± SD (<span class="html-italic">n</span> = 3). Duncan’s multiple range test was performed to compare all group means to each other. Groups that share the same letters (a–d) do not have significantly different means at the <span class="html-italic">p</span> &lt; 0.05 level.</p>
Full article ">
17 pages, 1499 KiB  
Article
Creeping Wood Sorrel and Chromium Picolinate Effect on the Nutritional Composition and Lipid Oxidative Stability of Broiler Meat
by Mihaela Saracila, Arabela Elena Untea, Tatiana Dumitra Panaite, Iulia Varzaru, Alexandra Oancea, Raluca Paula Turcu and Petru Alexandru Vlaicu
Antioxidants 2022, 11(4), 780; https://doi.org/10.3390/antiox11040780 - 14 Apr 2022
Cited by 6 | Viewed by 2366
Abstract
The study investigates the efficacy of Cr in broilers, aiming to evaluate the effects of Chromium picolinate (CrPic) in association with creeping wood sorrel powder (CWS) on the proximate composition, fatty acids profile, bioactive nutrients and lipid oxidative stability of broiler meat. A [...] Read more.
The study investigates the efficacy of Cr in broilers, aiming to evaluate the effects of Chromium picolinate (CrPic) in association with creeping wood sorrel powder (CWS) on the proximate composition, fatty acids profile, bioactive nutrients and lipid oxidative stability of broiler meat. A total of 120 Cobb 500 chickens were assigned into three treatments: a control diet (C) and two test diets, including 200 µg/kg diet CrPic (E1), and 200 µg/kg diet CrPic +10 g CWS/kg diet (E2). Dietary supplementation with Cr + CWS significantly improved the concentration of n − 3 polyunsaturated fatty acids (PUFAs), while its n − 6/n − 3 ratio decreased in comparison to the group receiving Cr and the conventional diet. The concentration of docosahexaenoic acid (DHA) significantly increased in the breast meat collected from the E2 group than that from the C group. Dietary administration of Cr and CWS improved lutein and zeaxanthin content, decreased Fe and Zn levels of the breast, and increased Zn deposition in the thigh samples. Malondialdehyde (MDA) concentration decreased more in the thigh meat of the supplemental groups (E1, E2) than in that from the C group. In conclusion, the current study suggests that Cr together with CWS can be a viable option as antioxidant sources for broiler diets, promoting the nutritional quality of meat. Full article
(This article belongs to the Special Issue Antioxidants in Foods II)
Show Figures

Graphical abstract

Graphical abstract
Full article ">Figure 1
<p>Nutritional quality indices of the lipids in breast meat. Main effects of diet are presented in each graph (Prism Graph 9.02). Data are presented as mean SEM (<span class="html-italic">n</span> = 6 broilers/group). Asterisks denote statistical significance (<span class="html-italic">p</span> &gt; 0.1234 ns; * <span class="html-italic">p</span> ≤ 0.0332; ** <span class="html-italic">p</span> ≤ 0.0021); AI = atherogenic index; TI = thrombogenicity index; SI = saturation index; h/H = hypo/hypercholesterolemic index; HPI = health-promoting index; C—control diet; E1 = experimental diet supplemented with 200 µg/kg diet CrPic; E2 = experimental diet supplemented with 200 µg/kg diet CrPic + 10 g creeping wood sorrel powder (CWS)/kg diet.</p>
Full article ">Figure 2
<p>Nutritional quality indices of the lipids in thigh meat. Main effects of diet are presented in each graph (Prism Graph 9.02). Data are presented as mean SEM (<span class="html-italic">n</span> = 6 broilers/group); AI = atherogenic index; TI = thrombogenicity index; SI = saturation index; h/H = hypo/hypercholesterolemic index; HPI = health-promoting index; C—control diet; E1 = experimental diet supplemented with 200 µg/kg diet CrPic; E2 = experimental diet supplemented with 200 µg/kg diet CrPic + 10 g creeping wood sorrel powder (CWS)/kg diet.</p>
Full article ">Figure 3
<p>TBA reactive substances (TBARS) of broiler breast and thigh meat during seven days of storage. Main effects of diet are presented in each graph (Prism Graph 9.02). Data are presented as mean SEM (<span class="html-italic">n</span> = 6 broilers/group). Asterisks denote statistical significance (<span class="html-italic">p</span> &gt; 0.1234 ns, * <span class="html-italic">p</span> ≤ 0.0332; ** <span class="html-italic">p</span> ≤ 0.0021); C—control diet; E1 = experimental diet supplemented with 200 µg/kg diet CrPic; E2 = experimental diet supplemented with 200 µg/kg diet CrPic + 10 g creeping wood sorrel powder (CWS)/kg diet.</p>
Full article ">Figure 4
<p>Heat map showing Pearson’s correlations between bioactive nutrients content, TAC and TBARS in breast (<b>A</b>) and thigh meat (<b>B</b>). Abbreviations: TPC, total phenolic content; TAC, total antioxidant capacity; TBARS, thiobarbituric reactive substances. Blue colors correspond to positive correlation coefficients, red colors correspond to negative correlation coefficients. The saturation of colors reflects the absolute value of the correlation coefficient. Asterisks indicate a significant correlation between respective parameters: * <span class="html-italic">p</span> &lt; 0.05 if the correlation is significant at alpha = 0.05 level; ** <span class="html-italic">p</span> &lt; 0.01 if the correlation is significant at alpha = 0.01 level; <span class="html-italic">p</span> &lt; 0.001 if the correlation is significant at alpha = 0.001 level.</p>
Full article ">
13 pages, 2588 KiB  
Article
Natural Polyphenols May Normalize Hypochlorous Acid-Evoked Hemostatic Abnormalities in Human Blood
by Tomasz Misztal, Agata Golaszewska, Natalia Marcińczyk, Maria Tomasiak-Łozowska, Małgorzata Szymanowska, Ewa Chabielska and Tomasz Rusak
Antioxidants 2022, 11(4), 779; https://doi.org/10.3390/antiox11040779 - 14 Apr 2022
Cited by 1 | Viewed by 2018
Abstract
During pathogen invasion, activated neutrophils secrete myeloperoxidase (MPO), which generates high local concentrations of hypochlorous acid (HOCl), a strong antimicrobial agent. Prolonged or uncontrolled HOCl production may, however, affect hemostasis, manifesting in inhibition of platelet aggregation and thrombus formation and in elevated fibrin [...] Read more.
During pathogen invasion, activated neutrophils secrete myeloperoxidase (MPO), which generates high local concentrations of hypochlorous acid (HOCl), a strong antimicrobial agent. Prolonged or uncontrolled HOCl production may, however, affect hemostasis, manifesting in inhibition of platelet aggregation and thrombus formation and in elevated fibrin density and attenuated fibrinolysis. In this report, we investigated whether three plant-derived polyphenols with well-known antioxidant properties, i.e., quercetin (Que), epigallocatechin gallate (EGCG), and resveratrol (Resv), at concentrations not affecting platelet responses per se, may normalize particular aspects of hemostasis disturbed by HOCl. Specifically, Que (5–25 μM) and EGCG (10–25 μM) abolished HOCl-evoked inhibition of platelet aggregation (assessed by an optical method), while the simultaneous incubation of platelet-rich plasma with Resv (10–25 μM) enhanced the inhibitory effect of HOCl. A similar effect was observed in the case of thrombus formation under flow conditions, evaluated in whole blood by confocal microscope. When plasma samples were incubated with HOCl, a notably higher density of fibrin (recorded by confocal microscope) was detected, an effect that was efficiently normalized by Que (5–25 μM), EGCG (10–25 μM), and Resv (5–25 μM) and which corresponded with the normalization of the HOCl-evoked prolongation of fibrinolysis, measured in plasma by a turbidimetric method. In conclusion, this report indicates that supplementation with Que and EGCG may be helpful in the normalization of hemostatic abnormalities during inflammatory states associated with elevated HOCl production, while the presence of Resv enhances the inhibitory action of HOCl towards platelets. Full article
Show Figures

Figure 1

Figure 1
<p>Effects of quercetin, epigallocatechin gallate, and resveratrol on platelet aggregation and on HOCl-evoked inhibition of aggregation. Samples of PRP were incubated with quercetin (Que), epigallocatechin gallate (EGCG), or resveratrol (Resv) for 5 min (<b>A</b>) followed by the addition of collagen (arrow, 5 μg/mL), and platelet aggregation, measured as light transmittance through platelet suspension, was recorded. (<b>B</b>) PRP samples were supplemented with HOCl (200 μM, for 5 min) or with indicated concentrations of Que, EGCG, or Resv added 1 min before HOCl. Next, aggregation was triggered by the addition of collagen (arrow, 5 μg/mL). Control samples contained an appropriate volume of vehiculum: ethanol (used as a control for Que and Resv) or water (used as a control for EGCG). Representative aggregation curves from one experiment (out of six) and extent of aggregation are presented. Aggregation obtained in the presence of only collagen was considered as maximal aggregation. Data are means ± S.D. from n = 6 experiments. * <span class="html-italic">p</span> &lt; 0.05; ** <span class="html-italic">p</span> &lt; 0.01; *** <span class="html-italic">p</span> &lt; 0.001 vs. control (sample supplemented with collagen, (<b>A</b>,<b>B</b>)). # <span class="html-italic">p</span> &lt; 0.05; ## <span class="html-italic">p</span> &lt; 0.01 vs. sample supplemented with HOCl 200 μM (<b>B</b>).</p>
Full article ">Figure 2
<p>Effects of quercetin, epigallocatechin gallate, and resveratrol on thrombus formation under flow and on HOCl-mediated reduction of thrombus formation. PPACK-anticoagulated whole blood samples (supplemented with DiO to visualize platelets) were incubated with appropriate vehiculum (ethanol or water) or with indicated concentrations of Que, EGCG, or Resv (for 5 min, <b>upper panel</b>). Next, samples were perfused over collagen-coated surfaces at a shear rate of 1000 s<sup>−1</sup> to form thrombi. Surface coverage area was calculated from end-stage confocal pictures. <b>Lower panel</b>: samples were incubated with HOCl (500 μM, for 5 min) or with Que, EGCG, or Resv added 1 min before HOCl and thrombus formation was performed under conditions as in <b>upper panel</b>. Representative thrombi obtained in the presence of HOCl or combinations of HOCl with selected concentrations of Que, EGCG, or Resv are presented in <b>lower panel</b>. Data are means ± S.D. from n = 3 experiments. * <span class="html-italic">p</span> &lt; 0.05; ** <span class="html-italic">p</span> &lt; 0.01 vs. control. Distance bar is 10 μm. Flow direction was from left to right.</p>
Full article ">Figure 3
<p>Effects of quercetin, epigallocatechin gallate, and resveratrol on HOCl-related increase in fibrin clot density. Plasma samples were incubated with appropriate vehiculum (ethanol or water) or with HOCl (250 μM for 5 min) or with indicated concentrations of Que, EGCG, or Resv, added 1 min before HOCl. Afterward, samples were supplemented with AF488-fibrinogen (to visualize fibrin formation) and clotting was triggered by recalcification (20 mM CaCl<sub>2</sub>, final conc.). Result fibrin clots were analyzed under confocal microscope toward fibrin density. Structures representative of six independent experiments are presented. Bars are means ± S.D. from six experiments. * <span class="html-italic">p</span> &lt; 0.05 vs. control. Distance bar is 30 μm.</p>
Full article ">Figure 4
<p>Effects of quercetin, epigallocatechin gallate, and resveratrol on HOCl-evoked attenuation of fibrinolysis. Plasma samples were incubated with appropriate vehiculum (ethanol or water) or with HOCl (125 μM for 5 min) or with indicated concentrations of Que, EGCG, or Resv, added 1 min before HOCl. Coagulation was triggered by the addition of CaCl<sub>2</sub> (to 20 mM final concentration). The time to 50% and 100% of lysis was determined as the time required for a decrease in absorbance (of 50% or 100%, respectively) after reaching the maximal turbidity, measured in the presence of tissue plasminogen activator (200 ng/mL final concentration). Representative lysis profiles from six experiments are presented. * <span class="html-italic">p</span> &lt; 0.05 vs. control.</p>
Full article ">Figure 5
<p>Effects of quercetin, epigallocatechin gallate and resveratrol on HOCl-produced decrease in free sulfhydryl groups in plasma. Samples of plasma were incubated for 10 min at 37 °C with HOCl (125 μM) without (control) or with, preincubated or not with studied antioxidants (for 1 min) at indicated concentrations. The content of reduced thiol (-SH) groups in plasma was measured using the DTNB assay. The total free-SH group content in plasma was about 533.5 ± 83 μM. Data are mean values ± S.D. from three independent experiments (each in triplicate). * <span class="html-italic">p</span> &lt; 0.05.</p>
Full article ">
20 pages, 5367 KiB  
Article
P2X7 Receptor Augments LPS-Induced Nitrosative Stress by Regulating Nrf2 and GSH Levels in the Mouse Hippocampus
by Duk-Shin Lee and Ji-Eun Kim
Antioxidants 2022, 11(4), 778; https://doi.org/10.3390/antiox11040778 - 13 Apr 2022
Cited by 2 | Viewed by 2427
Abstract
P2X7 receptor (P2X7R) regulates inducible nitric oxide synthase (iNOS) expression/activity in response to various harmful insults. Since P2X7R deletion paradoxically decreases the basal glutathione (GSH) level in the mouse hippocampus, it is likely that P2X7R may increase the demand for GSH for the [...] Read more.
P2X7 receptor (P2X7R) regulates inducible nitric oxide synthase (iNOS) expression/activity in response to various harmful insults. Since P2X7R deletion paradoxically decreases the basal glutathione (GSH) level in the mouse hippocampus, it is likely that P2X7R may increase the demand for GSH for the maintenance of the intracellular redox state or affect other antioxidant defense systems. Therefore, the present study was designed to elucidate whether P2X7R affects nuclear factor-erythroid 2-related factor 2 (Nrf2) activity/expression and GSH synthesis under nitrosative stress in response to lipopolysaccharide (LPS)-induced neuroinflammation. In the present study, P2X7R deletion attenuated iNOS upregulation and Nrf2 degradation induced by LPS. Compatible with iNOS induction, P2X7R deletion decreased S-nitrosylated (SNO)-cysteine production under physiological and post-LPS treated conditions. P2X7R deletion also ameliorated the decreases in GSH, glutathione synthetase, GS and ASCT2 levels concomitant with the reduced S-nitrosylations of GS and ASCT2 following LPS treatment. Furthermore, LPS upregulated cystine:glutamate transporter (xCT) and glutaminase in P2X7R+/+ mice, which were abrogated by P2X7R deletion. LPS did not affect GCLC level in both P2X7R+/+ and P2X7R−/− mice. Therefore, our findings indicate that P2X7R may augment LPS-induced neuroinflammation by leading to Nrf2 degradation, aberrant glutamate-glutamine cycle and impaired cystine/cysteine uptake, which would inhibit GSH biosynthesis. Therefore, we suggest that the targeting of P2X7R, which would exert nitrosative stress with iNOS in a positive feedback manner, may be one of the important therapeutic strategies of nitrosative stress under pathophysiological conditions. Full article
Show Figures

Graphical abstract

Graphical abstract
Full article ">Figure 1
<p>Effects of P2X7R deletion on microglial and astroglial responses to LPS. P2X7R deletion attenuates microglial activation, but not reactive astrogliosis induced by LPS. (<b>A</b>) Representative images for GFAP (an astroglial marker) and Iba-1 (a microglial marker) positive cells. Low panels are high magnification photos of boxes in upper panels. (<b>B</b>,<b>C</b>) Quantification of effects of P2X7R on GFAP and Iba-1 intensities following LPS treatment. Error bars indicate S.E.M. (*,<sup>#</sup> <span class="html-italic">p</span> &lt; 0.05 vs. control and WT mice, <span class="html-italic">n</span> = 7, respectively).</p>
Full article ">Figure 2
<p>Effects of P2X7R deletion on LPS-induced iNOS induction in microglia and astrocytes. P2X7R deletion ameliorates iNOS induction in microglia rather than astrocytes following LPS injection. (<b>A</b>) Representative Western blot of iNOS in the whole hippocampus. (<b>B</b>) Quantification of iNOS protein level based on Western blot data. Error bars indicate S.E.M. (*,<sup>#</sup> <span class="html-italic">p</span> &lt; 0.05 vs. control and WT mice, <span class="html-italic">n</span> = 7, respectively). (<b>C</b>) Representative photos of iNOS expression, intensity and the degree of colocalization in IB4 (a microglial marker) and GFAP (an astroglial marker) positive cells. (<b>D</b>) Quantification of iNOS induction in microglia and astrocytes. Error bars indicate S.E.M. (*,<sup>#</sup> <span class="html-italic">p</span> &lt; 0.05 vs. control and WT mice, <span class="html-italic">n</span> = 7, respectively). Full-length gel images of Western blot data in (<b>A</b>) could be found in <a href="#app1-antioxidants-11-00778" class="html-app">Supplementary Figure S1</a>.</p>
Full article ">Figure 3
<p>Effects of P2X7R deletion on LPS-induced SNO-cysteine production in microglia and astrocytes. Under physiological conditions, SNO-cysteine level in the hippocampus is higher in <span class="html-italic">P2X7R<sup>+/+</sup></span> mice than that in <span class="html-italic">P2X7R<sup>−/−</sup></span> mice. LPS increases SNO-cysteine production in microglia and astrocytes within the hippocampus of <span class="html-italic">P2X7R<sup>+/+</sup></span> more than <span class="html-italic">P2X7R<sup>−/−</sup></span> mice. In <span class="html-italic">P2X7R<sup>−/−</sup></span> mice, SNO-cysteine level is lower in microglia than that in astrocytes. (<b>A</b>) Representative images for SNO-cysteine in the hippocampus. (<b>B</b>) Representative photos of SO-cysteine production in IB4 (a microglial marker) and GFAP (an astroglial marker) positive cells. (<b>C</b>) Quantification of SNO-cysteine production in the hippocampus. Error bars indicate S.E.M. (*,<sup>#</sup> <span class="html-italic">p</span> &lt; 0.05 vs. control and WT mice, <span class="html-italic">n</span> = 7, respectively).</p>
Full article ">Figure 4
<p>Effects of P2X7R deletion on LPS-induced Nrf2 downregulation in microglia. LPS decreases Nrf2 protein level in the hippocampus of <span class="html-italic">P2X7R<sup>+/+</sup></span> mice, but not <span class="html-italic">P2X7R<sup>−/−</sup></span> mice, since total Nrf2 level and its nuclear accumulation are reduced in microglia. (<b>A</b>) Representative Western blot of Nrf2 in the whole hippocampus. (<b>B</b>) Quantification of iNOS protein level based on Western blot data. Open circles indicate each individual value. Horizontal and error bars indicate the mean value and S.E.M., respectively (*,<sup>#</sup> <span class="html-italic">p</span> &lt; 0.05 vs. control and WT mice, <span class="html-italic">n</span> = 7, respectively). (<b>C</b>) Representative photos of Nrf2 expression, intensity and the degree of colocalization in IB4 (a microglial marker) positive cells and DAPI (a nuclear marker). (<b>D</b>,<b>E</b>) Quantification of total and nuclear Nrf2 intensity in microglial. Error bars indicate S.E.M. (* <span class="html-italic">p</span> &lt; 0.05 vs. control and WT mice, <span class="html-italic">n</span> = 7, respectively). Full-length gel images of Western blot data in this figure could be found in <a href="#app1-antioxidants-11-00778" class="html-app">Supplementary Figure S2</a>.</p>
Full article ">Figure 5
<p>Effects of P2X7R deletion on LPS-induced Nrf2 downregulation in astrocytes. LPS decreases total Nrf2 protein level in astrocytes of <span class="html-italic">P2X7R<sup>+/+</sup></span> mice, while it does not in astrocytes of <span class="html-italic">P2X7R<sup>−/−</sup></span> mice. LPS also diminishes nuclear Nrf2 protein level in astrocytes of <span class="html-italic">P2X7R<sup>+/+</sup></span> mice. LPS-induced Nrf2 downregulation in astrocytes is attenuated in <span class="html-italic">P2X7R<sup>−/−</sup></span> mice. (<b>A</b>) Representative photos of Nrf2 expression, intensity and the degree of colocalization in GFAP (an astroglial marker) positive cells and DAPI (a nuclear marker). (<b>B</b>,<b>C</b>) Quantification of total and nuclear Nrf2 intensity in astrocytes. Error bars indicate S.E.M. (*,<sup>#</sup> <span class="html-italic">p</span> &lt; 0.05 vs. control and WT mice, <span class="html-italic">n</span> = 7, respectively).</p>
Full article ">Figure 6
<p>Effects of P2X7R deletion on GSH concentration and expressions of GCLC, GSHS, GS, GLS, ASCT2 and xCT following LPS injection. Under physiological condition, P2X7R deletion reduces GSH level in the hippocampus. However, P2X7R deletion increases GS and ASCT2 levels. LPS declines GSH concentration in <span class="html-italic">P2X7R<sup>+/+</sup></span> mice more than in <span class="html-italic">P2X7R<sup>−/−</sup></span> mice. LPS decreases GSHS, GS and ASCT2 levels, but increases GLS and xCT levels only in the <span class="html-italic">P2X7R<sup>+/+</sup></span> mice. (<b>A</b>) Total GSH level in the hippocampus under physiological and post-LPS treated conditions. (<b>B</b>) Representative Western blot of GCLC, GSHS, GS, GLS, ASCT2 and xCT in the whole hippocampi of that <span class="html-italic">P2X7R<sup>+/+</sup></span> and <span class="html-italic">P2X7R<sup>−/−</sup></span> mice. (<b>C</b>–<b>G</b>) Quantification of GSHS, GS, GLS, ASCT2 and xCT levels based on Western blot data. Open circles indicate each individual value. Horizontal and error bars indicate the mean value and S.E.M., respectively (*,<sup>#</sup> <span class="html-italic">p</span> &lt; 0.05 vs. control and WT mice, <span class="html-italic">n</span> = 7, respectively). Full-length gel images of Western blot data in (<b>B</b>) could be found in <a href="#app1-antioxidants-11-00778" class="html-app">Supplementary Figure S3</a>.</p>
Full article ">Figure 7
<p>Effects of P2X7R deletion on S-nitrosylation of GS following LPS injection. Under physiological conditions, total GS level in <span class="html-italic">P2X7R<sup>−/−</sup></span> mice is higher than that of <span class="html-italic">P2X7R<sup>+/+</sup></span> mice. However, the SNO-GS level in <span class="html-italic">P2X7R<sup>−/−</sup></span> mice is lower than that of <span class="html-italic">P2X7R<sup>+/+</sup></span> mice. LPS decreases total GS level but increases SNO-GS level in <span class="html-italic">P2X7R<sup>+/+</sup></span> mice. LPS does not affect them in <span class="html-italic">P2X7R<sup>−/−</sup></span> mice. (<b>A</b>) Representative Western blot of total- and SNO-GS in the whole hippocampi of that <span class="html-italic">P2X7R<sup>+/+</sup></span> and <span class="html-italic">P2X7R<sup>−/−</sup></span> mice. (<b>B</b>) Quantification of the total- and SNO-GS level based on Western blot data. Open circles indicate each individual value. Horizontal and error bars indicate the mean value and S.E.M., respectively (* <span class="html-italic">p</span> &lt; 0.05 vs. WT mice, <span class="html-italic">n</span> = 7, respectively). (<b>C</b>) Representative Western blot of total- and SNO-GS in the whole hippocampi of that <span class="html-italic">P2X7R<sup>+/+</sup></span> mice following LPS treatment. (<b>D</b>) Quantification of total- and SNO-GS level based on Western blot data (* <span class="html-italic">p</span> &lt; 0.05 vs. control mice, <span class="html-italic">n</span> = 7, respectively). (<b>E</b>) Representative Western blot of total- and SNO-GS in the whole hippocampi of that <span class="html-italic">P2X7R<sup>−/−</sup></span> mice following LPS treatment. (<b>F</b>) Quantification of total- and SNO-GS level based on Western blot data. Horizontal and error bars indicate the mean value and S.E.M., respectively (<span class="html-italic">n</span> = 7, respectively). Full-length gel images of Western blot data in this figure could be found in <a href="#app1-antioxidants-11-00778" class="html-app">Supplementary Figure S4</a>.</p>
Full article ">Figure 8
<p>Effects of P2X7R deletion on ASCT2 expression and its S-nitrosylation following LPS injection. Under physiological conditions, total ASCT2 level in <span class="html-italic">P2X7R<sup>−/−</sup></span> mice is higher than that of <span class="html-italic">P2X7R<sup>+/+</sup></span> mice. However, SNO-ASCT2 level in <span class="html-italic">P2X7R<sup>−/−</sup></span> mice is lower than that of <span class="html-italic">P2X7R<sup>+/+</sup></span> mice. LPS decreases total ASCT2 level but increases SNO-ASCT2 level in <span class="html-italic">P2X7R<sup>+/+</sup></span> mice. LPS also increases SNO-ASCT2 level in <span class="html-italic">P2X7R<sup>−/−</sup></span> mice without affecting total ASCT2 level. Total- and SNO-ASCT2 levels show a direct proportional relationship with Total- and SNO-GS levels in <span class="html-italic">P2X7R<sup>+/+</sup></span> and <span class="html-italic">P2X7R<sup>−/−</sup></span> mice, respectively. (<b>A</b>) Representative Western blot of total- and SNO- ASCT2 in the whole hippocampi of that <span class="html-italic">P2X7R<sup>+/+</sup></span> and <span class="html-italic">P2X7R<sup>−/−</sup></span> mice. (<b>B</b>) Quantification of total- and SNO-ASCT2 level based on Western blot data. Open circles indicate each individual value. Horizontal and error bars indicate the mean value and S.E.M., respectively (* <span class="html-italic">p</span> &lt; 0.05 vs. WT mice, <span class="html-italic">n</span> = 7, respectively). (<b>C</b>) Representative Western blot of total- and SNO-ASCT2 in the whole hippocampi of that <span class="html-italic">P2X7R<sup>+/+</sup></span> mice following LPS treatment. (<b>D</b>) Quantification of total- and SNO-ASCT2 level based on Western blot data (* <span class="html-italic">p</span> &lt; 0.05 vs. control mice, <span class="html-italic">n</span> = 7, respectively). (<b>E</b>) Representative Western blot of total- and SNO-ASCT2 in the whole hippocampi of that <span class="html-italic">P2X7R<sup>−/−</sup></span> mice following LPS treatment. (<b>F</b>) Quantification of total- and SNO-ASCT2 level based on Western blot data (* <span class="html-italic">p</span> &lt; 0.05 vs. control mice, <span class="html-italic">n</span> = 7, respectively). (<b>G</b>) Linear regression analyses of total- and SNO proteins between ASCT2 and GS in <span class="html-italic">P2X7R<sup>+/+</sup></span> and <span class="html-italic">P2X7R<sup>−/−</sup></span> mice. Full-length gel images of Western blot data in this figure could be found in <a href="#app1-antioxidants-11-00778" class="html-app">Supplementary Figure S5</a>.</p>
Full article ">
18 pages, 1766 KiB  
Article
Nutraceutical Profile of “Carosello” (Cucumis melo L.) Grown in an Out-of-Season Cycle under LEDs
by Onofrio Davide Palmitessa, Miriana Durante, Annalisa Somma, Giovanni Mita, Massimiliano D’Imperio, Francesco Serio and Pietro Santamaria
Antioxidants 2022, 11(4), 777; https://doi.org/10.3390/antiox11040777 - 13 Apr 2022
Cited by 2 | Viewed by 2626
Abstract
The world population is projected to increase to 9.9 billion by 2050 and, to ensure food security and quality, agriculture must sustainably multiply production, increase the nutritional value of fruit and vegetables, and preserve genetic variability. In this work, an Apulian landrace of [...] Read more.
The world population is projected to increase to 9.9 billion by 2050 and, to ensure food security and quality, agriculture must sustainably multiply production, increase the nutritional value of fruit and vegetables, and preserve genetic variability. In this work, an Apulian landrace of Cucumis melo L. called “Carosello leccese” was grown in a greenhouse with a soilless technique under light-emitting diodes (LEDs) used as supplementary light system. The obtained results showed that “Carosello leccese” contains up to 71.0 mg·g−1 dried weight (DW) of potassium and several bioactive compounds important for human health such as methyl gallate (35.58 µg·g−1 DW), α-tocopherol (10.12 µg·g−1 DW), and β-carotene (up to 9.29 µg·g−1 DW under LEDs). In fact, methyl gallate has antioxidative and antiviral effects in vitro and in vivo, tocopherols are well recognized for their effective inhibition of lipid oxidation in foods and biological systems and carotenoids are known to be very efficient physical and chemical quenchers of singlet oxygen. Finally, it was demonstrated that the LEDs’ supplementary light did not negatively influence the biochemical profile of the peponids, confirming that it can be considered a valid technique to enhance horticultural production without reducing the content of the bioactive compounds of the fruits. Full article
Show Figures

Figure 1

Figure 1
<p>Relative spectral power of LEDs fixtures R + B (<b>A</b>) and R + B + FR (<b>B</b>). Light spectra were measured with spectrophotometer LI-180 (LI-COR, Lincoln, NE, USA).</p>
Full article ">Figure 2
<p>Bar charts showing the average daily light integral supplied by sun (DLI NL) and from LEDs (DLI SL) in 9-day intervals. Line graph represents the average daily light integral supplied from sun and LEDs DLI NL + SL in 9-day intervals.</p>
Full article ">Figure 3
<p>Gallic acid content of “Carosello leccese” (<span class="html-italic">Cucumis melo</span> L.) fruits grown under solar light (NL, no supplementary lighting) and two light spectra (see <a href="#antioxidants-11-00777-f001" class="html-fig">Figure 1</a>). Values are the average of three replications. Vertical bars represent mean values ± standard error. R + B represents supplementary light with red + blue spectra; R + B + FR represents supplementary light with red + blue + far red spectra; NL represents solar light (control) treatment.</p>
Full article ">Figure 4
<p>β-carotene content of “Carosello leccese” (<span class="html-italic">Cucumis melo</span> L.) fruits from plants grown under solar light (NL, no supplementary lighting) and two light spectra (see <a href="#antioxidants-11-00777-f001" class="html-fig">Figure 1</a>). Values are an average of three replications. Bars represent mean values ± standard error. R + B represents supplementary light with red + blue spectra; R + B + FR represents supplementary light with red + blue + far red spectra; NL represents solar light (control) treatment.</p>
Full article ">Figure 5
<p>Sweetness index of “Carosello leccese” (<span class="html-italic">Cucumis melo</span> L.) fruits grown under solar light (NL, no supplementary lighting) and two light spectra (see <a href="#antioxidants-11-00777-f001" class="html-fig">Figure 1</a>) 32 and 50 DAT. Values are an average of three replications. Vertical bars represent mean values ± standard error. R + B represents supplementary light with red + blue spectra; R + B + FR represents supplementary light with red + blue + far red spectra; NL represents solar light (control) treatment.</p>
Full article ">Figure 6
<p>Iron (Fe) content, expressed as mg·kg<sup>−1</sup> D.W. of “Carosello leccese” (<span class="html-italic">Cucumis melo</span> L.) fruits grown under solar light (NL, no supplementary lighting) and two light spectra (see <a href="#antioxidants-11-00777-f001" class="html-fig">Figure 1</a>). Values are an average of three replications. Vertical bars represent mean values ± standard error. R + B represents supplementary light with red + blue spectra; R + B + FR represents supplementary light with red + blue + far red spectra; NL represents solar light (control) treatment.</p>
Full article ">
20 pages, 2626 KiB  
Article
Effect of Exogenous Melatonin Application on the Grain Yield and Antioxidant Capacity in Aromatic Rice under Combined Lead–Cadmium Stress
by Ye Jiang, Suihua Huang, Lin Ma, Leilei Kong, Shenggang Pan, Xiangru Tang, Hua Tian, Meiyang Duan and Zhaowen Mo
Antioxidants 2022, 11(4), 776; https://doi.org/10.3390/antiox11040776 - 13 Apr 2022
Cited by 23 | Viewed by 4229
Abstract
This study aimed to determine the mechanism of exogenous melatonin application in alleviating the combined Pb and Cd (Pb-Cd) toxicity on aromatic rice (Oryza sativa L.). In this study, a pot experiment was conducted; two aromatic rice varieties, Yuxiangyouzhan and Xiangyaxiangzhan, were [...] Read more.
This study aimed to determine the mechanism of exogenous melatonin application in alleviating the combined Pb and Cd (Pb-Cd) toxicity on aromatic rice (Oryza sativa L.). In this study, a pot experiment was conducted; two aromatic rice varieties, Yuxiangyouzhan and Xiangyaxiangzhan, were selected, and sprays using 50, 100, 200, and 400 μmol L−1 melatonin (denoted as S50, S100, S200, and S400) and irrigation using 100, 300, and 500 μmol L−1 melatonin (denoted as R100, R300, and R500) were also selected. The results showed that, under the S50, S100, and S200 treatments, the Pb content of aromatic rice grain decreased, and the grain yield increased significantly. Moreover, the application of exogenous melatonin significantly reduced the accumulation of H2O2 in rice leaves at maturity under Cd–Pb stress and reduced the MDA content in Xiangyaxiangzhan leaves. In addition, the microbial community structure changed significantly under S50 and R300 treatments. Some pathways, such as the synthesis of various amino acids and alanine, aspartate, and glutamate metabolism, were regulated by S50 treatment. Overall, melatonin application improved aromatic rice grain yield while reducing heavy metal accumulation by regulating the antioxidant capacity and metabolites in aromatic rice plants and altering the physicochemical properties and microbial community structures of the soil. Full article
Show Figures

Graphical abstract

Graphical abstract
Full article ">Figure 1
<p>The average monthly temperature, humidity, and sunshine hours during the experiment period in 2019.</p>
Full article ">Figure 2
<p>Effects of exogenous melatonin application on GSH content in Yuxiangyouzhan (<b>a</b>) and Xiangyaxiangzhan (<b>b</b>); ASA content in Yuxiangyouzhan (<b>c</b>) and Xiangyaxiangzhan (<b>d</b>); MTs content in Yuxiangyouzhan (<b>e</b>) and Xiangyaxiangzhan (<b>f</b>) at the heading stage (HS), 15 day after HS, and the maturity stage (MS). Means sharing similar letters indicate no significant difference at <span class="html-italic">p</span> &lt; 0.05 according to the LSD test.</p>
Full article ">Figure 3
<p>Effects of exogenous melatonin application on SOD activity in Yuxiangyouzhanand (<b>a</b>) and Xiangyaxiangzhan (<b>b</b>); POD activity in Yuxiangyouzhan (<b>c</b>) and Xiangyaxiangzhan (<b>d</b>); CAT activity in Yuxiangyouzhan (<b>e</b>) and Xiangyaxiangzhan (<b>f</b>); MDA content in Yuxiangyouzhan (<b>g</b>) and Xiangyaxiangzhan (<b>h</b>); and H<sub>2</sub>O<sub>2</sub> content in Yuxiangyouzhan (<b>i</b>) and Xiangyaxiangzhan (<b>j</b>) at the heading stage (HS), 15 day after HS, and the MS. Means sharing similar letters indicate no significant difference at <span class="html-italic">p</span> &lt; 0.05 according to the LSD test.</p>
Full article ">Figure 3 Cont.
<p>Effects of exogenous melatonin application on SOD activity in Yuxiangyouzhanand (<b>a</b>) and Xiangyaxiangzhan (<b>b</b>); POD activity in Yuxiangyouzhan (<b>c</b>) and Xiangyaxiangzhan (<b>d</b>); CAT activity in Yuxiangyouzhan (<b>e</b>) and Xiangyaxiangzhan (<b>f</b>); MDA content in Yuxiangyouzhan (<b>g</b>) and Xiangyaxiangzhan (<b>h</b>); and H<sub>2</sub>O<sub>2</sub> content in Yuxiangyouzhan (<b>i</b>) and Xiangyaxiangzhan (<b>j</b>) at the heading stage (HS), 15 day after HS, and the MS. Means sharing similar letters indicate no significant difference at <span class="html-italic">p</span> &lt; 0.05 according to the LSD test.</p>
Full article ">Figure 4
<p>Rarefaction curve (<b>a</b>); histogram of species distribution (<b>b</b>); PCA plot of fungal communities in 18 soil samples under the XCK, XS50, YCK, YR300 treatments (<b>c</b>); RDA considering the fungal relative abundance at the operational taxonomic unit (OTU) level; SOM, soil total N, P, and K contents, Cd and Pb concentrations, and pH (<b>d</b>). XCK: Xiangyaxiangzhan growing under Cd–Pb stress without melatonin treatment; XR300: Xiangyaxiangzhan growing under Cd–Pb stress and irrigated with 300 μmol L<sup>−1</sup> exogenous melatonin; XS50: Xiangyaxiangzhan growing under Cd–Pb stress and sprayed with 50 μmol L<sup>−1</sup> exogenous melatonin; YCK: Yuxiangyouzhan growing under Cd–Pb stress without melatonin treatment; YR300: Yuxiangyouzhan growing under Cd–Pb stress and irrigated with 300 μmol L<sup>−1</sup> exogenous melatonin; YS50: Yuxiangyouzhan growing under Cd–Pb stress and sprayed with 50 μmol L<sup>−1</sup> exogenous melatonin.</p>
Full article ">Figure 5
<p>Overview of the enriched KEGG pathways. 1: Alanine, aspartate, and glutamate metabolism; 2: Arginine biosynthesis; 3: Aminoacyl-tRNA biosynthesis; 4: Nicotinate and nicotinamide metabolism; 5: Phenylpropanoid biosynthesis; 6: Citrate cycle (TCA cycle); 7: Butanoate metabolism; 8: Arginine and proline metabolism; 9: C5-Branched dibasic acid metabolism; 10: Valine, leucine, and isoleucine biosynthesis; 11: Pantothenate and CoA biosynthesis; 12: Glyoxylate and dicarboxylate metabolism; 13: Carbon fixation in photosynthetic organisms; 14: Pyrimidine metabolism; 15: Isoquinoline alkaloid biosynthesis; 16: Starch and sucrose metabolism; 17: beta-Alanine metabolism; 18: Glycine, serine, and threonine metabolism; 19: Vitamin B6 metabolism; 20: Betalain biosynthesis.</p>
Full article ">Figure 6
<p>Multivariate pattern recognition analysis of metabolomics. (<b>a</b>) PCA plot of metabolites under XCK, XS50, YCK, and YS50 treatments; (<b>b</b>) PLS-DA plot of metabolites under XCK, XS50, YCK, and YS50 treatments; (<b>c</b>) VIP score of metabolites under XCK, XS50, YCK, and YS50 treatments; (<b>d</b>) PCA plot of metabolites under XCK and XS50 treatments; (<b>e</b>) PLS-DA plot of metabolites under XCK and XS50 treatments; (<b>f</b>) VIP score of metabolites under XCK and XS50 treatments; (<b>g</b>) PCA plot of metabolites under YCK and YS50 treatments; (<b>h</b>) PLS-DA plot of metabolites under YCK and YS50 treatments; and (<b>i</b>) VIP score of metabolites under YCK and YS50 treatments.</p>
Full article ">Figure 7
<p>(<b>a</b>) Venn diagram showing the numbers of differential metabolites in XCK vs. XS50, XCK vs. YCK, XS50 vs. YS50, and YCK vs. YS50 comparisons. (<b>b</b>) Significant differential metabolites in XCK vs. XS50, XCK vs. YCK, XS50 vs. YS50, and YCK vs. YS50.</p>
Full article ">
17 pages, 2734 KiB  
Article
Protective Effects against the Development of Alzheimer’s Disease in an Animal Model through Active Immunization with Methionine-Sulfoxide Rich Protein Antigen
by Adam S. Smith, Kyle R. Gossman, Benjamin Dykstra, Fei Philip Gao and Jackob Moskovitz
Antioxidants 2022, 11(4), 775; https://doi.org/10.3390/antiox11040775 - 13 Apr 2022
Cited by 1 | Viewed by 6137
Abstract
The brain during Alzheimer’s disease (AD) is under severe oxidative attack by reactive oxygen species that may lead to methionine oxidation. Oxidation of the sole methionine (Met35) of beta-amyloid (Aβ), and possibly methionine residues of other extracellular proteins, may be one [...] Read more.
The brain during Alzheimer’s disease (AD) is under severe oxidative attack by reactive oxygen species that may lead to methionine oxidation. Oxidation of the sole methionine (Met35) of beta-amyloid (Aβ), and possibly methionine residues of other extracellular proteins, may be one of the earliest events contributing to the toxicity of Aβ and other proteins in vivo. In the current study, we immunized transgenic AD (APP/PS1) mice at 4 months of age with a recombinant methionine sulfoxide (MetO)-rich protein from Zea mays (antigen). This treatment induced the production of anti-MetO antibody in blood-plasma that exhibits a significant titer up to at least 10 months of age. Compared to the control mice, the antigen-injected mice exhibited the following significant phenotypes at 10 months of age: better short and long memory capabilities; reduced Aβ levels in both blood-plasma and brain; reduced Aβ burden and MetO accumulations in astrocytes in hippocampal and cortical regions; reduced levels of activated microglia; and elevated antioxidant capabilities (through enhanced nuclear localization of the transcription factor Nrf2) in the same brain regions. These data collected in a preclinical AD model are likely translational, showing that active immunization could give a possibility of delaying or preventing AD onset. This study represents a first step toward the complex way of starting clinical trials in humans and conducting the further confirmations that are needed to go in this direction. Full article
(This article belongs to the Topic Redox Metabolism)
Show Figures

Graphical abstract

Graphical abstract
Full article ">Figure 1
<p>A graphical summary of the proposed events leading to MetO-A<span class="html-italic">β</span> and MetO-protein mediated toxicity in Alzheimer’s disease brain.</p>
Full article ">Figure 2
<p>Antigen-injected mice produce antibody against MetO-rich protein in blood-plasma. (<b>A</b>). The MetO-rich protein (Antigen) was produced and purified according to the procedures described under the “Materials and Methods” section. The purified antigen was separated on SDS-gel-electrophoresis that was stained with Coomassie brilliant blue (the limited protein staining level is due to the relatively low presence of basic amino acids in the Met-rich protein sequence). M, molecular mass markers; kDa, molecular mass numbers. (<b>B</b>). A dot-blot analysis using the MetO-rich protein as the loaded protein (Antigen) and rabbit anti-MetO antibody (1:1000 dilution) as the primary antibody. (<b>C</b>). A dot-blot analysis using the MetO-rich protein, as the loaded protein (Antigen), probed with plasma moiety (used as the primary antibody, 1:100 dilution, 1 h incubation time) from 10-month-old mice. Only the antigen-injected mice showed positive reactions with the antigen (a round black reaction in the middle of the blot), while the controls were all negative. Numbers 5 and 9 of the control blots had almost no background reactions.</p>
Full article ">Figure 3
<p>Vaccinated APP/PS1 mice have improved short- and long-term spatial memory. (<b>A</b>) Antigen-immunized APP/PS1 mice have a novel arm preference in a forced Y-maze test but control APP/PS1 do not, displaying improved short-term memory after vaccination. The details of the experimental procedures are listed under “Materials and Methods”. (<b>B</b>) Arm crossing is not affected by vaccination, indicating age-typical locomotion. (<b>C</b>) Morris Water Maze (MWM) analyses (the details of the experimental procedures are listed under the <a href="#sec2-antioxidants-11-00775" class="html-sec">Section 2</a>). These are representative schematics of swimming patterns performed by mice over the 5-day training period of the MWM. These swimming patterns illustrate that antigen-immunized APP/PS1 mice improve their escape latency after a single day of training, while control mice require repeated training days to improve in this task (as reflected in Day 2). (<b>D</b>) This is a statistical presentation of the significant effect on the antigen-immunized mice’s reduced escape latency during the second day of training, while the control mice do not improve in this task until day 3. This demonstrates an improved learning for this long-term spatial memory task in antigen-immunized mice (<b>E</b>) Antigen-immunized mice also spend more time swimming in the target quadrant (after the platform is removed from the pool) compared to controls, who are only performing at chance. Standard deviation is shown for each group of mice. Data were acquired from all tested mice (<span class="html-italic">n</span> = 9 per each group of mice). Statistical significances were assessed for the acquired data using one-way analysis of variance (ANOVA) with post hoc Tukey’s test: # <span class="html-italic">p</span> &lt; 0.05 familiar vs. novel arm within condition; * <span class="html-italic">p</span> &lt; 0.05, ** <span class="html-italic">p</span> &lt; 0.01 vs. control; <sup>vvvv</sup> <span class="html-italic">p</span> &lt; 0.0001 vs. day 1 training for antigen-immunized mice; <sup>++++</sup> <span class="html-italic">p</span> &lt; 0.0001 vs. day 1 training for control mice.</p>
Full article ">Figure 4
<p>Reduction of A<span class="html-italic">β</span><sub>42</sub> in blood-plasma and brain, and reduction of amyloid plaque burden in brains of antigen-injected mice. (<b>A</b>). Hemisphere brains of post-mortem mice (control and antigen-immunized) were dissected, and immunohistochemistry analyses were performed to detect A<span class="html-italic">β</span><sub>42</sub>, according to the procedure described under the <a href="#sec2-antioxidants-11-00775" class="html-sec">Section 2</a>. The data shows a decline in the levels of A<span class="html-italic">β</span><sub>42</sub> in the three brain regions (HPC, hippocampus; RSC, retrosplenial cortex, and EC, entorhinal cortex) of the antigen-immunized as compared with the control mice. (<b>B</b>). Quantification of the data presented in Panel A using NIH-Image J program. Quantification of A<span class="html-italic">β</span><sub>42</sub> in blood-plasma (<b>C</b>) and post-mortem brain extracts (<b>D</b>) of antigen-injected and control mice using ELISA kit according to the procedure described under the <a href="#sec2-antioxidants-11-00775" class="html-sec">Section 2</a>. (<b>E</b>). Thioflavin-S staining of the post-mortem mouse brains according to the procedure described under the “Materials and Methods” section. Lower plaque-burden was observed in the antigen-injected versus control mice. (<b>F</b>). Quantification of the data depicted in panel E using NIH Image-J program. In all of the graphs, black and white bars represent control and antigen-injected mice, respectively. Standard deviation is shown for each averaged bar. Data were acquired from all tested mice for panels C and D (<span class="html-italic">n</span> = 9 per each group of mice) and five mice per each tested group of mice for panels B and F. Statistical analyses were performed using two-tailed student <span class="html-italic">t</span>-test with the following <span class="html-italic">p</span> values: *, <span class="html-italic">p</span> &lt; 0.05; **, <span class="html-italic">p</span> &lt; 0.01, and ***, <span class="html-italic">p</span> &lt; 0.001.</p>
Full article ">Figure 5
<p>Reduction of MetO-protein levels in brain astrocytes in antigen-injected mice (<b>A</b>). Hemisphere brains of post-mortem mice (control and antigen-immunized) were dissected, and immunohistochemistry analyses were performed to detect MetO-proteins according to the procedure described under the <a href="#sec2-antioxidants-11-00775" class="html-sec">Section 2</a>. The data shows a decline in the levels of MetO-proteins in the three brain regions (HPC, hippocampus; RSC, retrosplenial cortex, and EC, entorhinal cortex) of the antigen-immunized compared with control mice. (<b>B</b>). Quantification of the data presented in Panel A using NIH-Image J program. Black and white bars represent control and antigen-injected mice, respectively. Standard deviation is shown for each averaged bar. Data were acquired for five mice per tested group of mice. Statistical analyses were performed using two-tailed student <span class="html-italic">t</span>-test with the following <span class="html-italic">p</span> values: *, <span class="html-italic">p</span> &lt; 0.05, and **, <span class="html-italic">p</span> &lt; 0.01.</p>
Full article ">Figure 6
<p>Reduced activation of microglia in antigen-injected mice. (<b>A</b>). Hemisphere brains of post-mortem mice (control and antigen-immunized) were dissected, and immunohistochemistry analyses were performed to detect Iba1 according to the procedure described under the <a href="#sec2-antioxidants-11-00775" class="html-sec">Section 2</a>. The data show a decline in the levels of Iba1 of neuronal cells in the three brain regions (HPC, hippocampus; RSC, retrosplenial cortex, and EC, entorhinal cortex) of the antigen-immunized compared with control mice. (<b>B</b>). Quantification of the data presented in Panel A using NIH-Image J program. Black and white bars represent control and antigen-injected mice, respectively. Standard deviation is shown for each averaged bar. Data were acquired from five mice per tested group of mice. Statistical analyses were performed using two-tailed student <span class="html-italic">t</span>-test with the following <span class="html-italic">p</span> values: *, <span class="html-italic">p</span> &lt; 0.05; ***, <span class="html-italic">p</span> &lt; 0.001.</p>
Full article ">Figure 7
<p>Increased nuclear localization of Nrf2 in antigen-injected mice. (<b>A</b>). Hemisphere brains of post-mortem mice (control and antigen-immunized) were dissected, and immunohistochemistry analyses were performed to detect Nrf2 according to the procedure described under the <a href="#sec2-antioxidants-11-00775" class="html-sec">Section 2</a>. The data shows an increased nuclear localization within astrocytes of Nrf2 in a representative image of the EC region of the antigen-immunized compared to the control mice. A similar pattern of Nrf2 localization ratio between the two mouse groups was observed for the HPC and RSC regions (images are not shown). The white triangle symbols point to cells harboring nuclear Nrf2 and the black-filled triangle symbols point to cells harboring cytosolic Nrf2 (<b>B</b>). Quantification of the data presented in Panel (<b>A</b>) by manually counting the nuclear Nrf2 signal per same-size area in the three selected brain regions. Black and white bars represent control and antigen-injected mice, respectively. Standard deviation is shown for each averaged bar. Data were acquired from five mice per tested group of mice. Statistical analyses were performed using two-tailed student <span class="html-italic">t</span>-test with the following <span class="html-italic">p</span> values: ***, <span class="html-italic">p</span> &lt; 0.001 and **, <span class="html-italic">p</span> &lt; 0.01.</p>
Full article ">
13 pages, 300 KiB  
Article
Pre-Operative Assessment of Micronutrients, Amino Acids, Phospholipids and Oxidative Stress in Bariatric Surgery Candidates
by Thorsten Henning, Bastian Kochlik, Paula Kusch, Matthias Strauss, Viktorija Jurić, Marc Pignitter, Frank Marusch, Tilman Grune and Daniela Weber
Antioxidants 2022, 11(4), 774; https://doi.org/10.3390/antiox11040774 - 13 Apr 2022
Cited by 3 | Viewed by 2709
Abstract
Obesity has been linked to lower concentrations of fat-soluble micronutrients and higher concentrations of oxidative stress markers as well as an altered metabolism of branched chain amino acids and phospholipids. In the context of morbid obesity, the aim of this study was to [...] Read more.
Obesity has been linked to lower concentrations of fat-soluble micronutrients and higher concentrations of oxidative stress markers as well as an altered metabolism of branched chain amino acids and phospholipids. In the context of morbid obesity, the aim of this study was to investigate whether and to which extent plasma status of micronutrients, amino acids, phospholipids and oxidative stress differs between morbidly obese (n = 23) and non-obese patients (n = 13). In addition to plasma, malondialdehyde, retinol, cholesterol and triglycerides were assessed in visceral and subcutaneous adipose tissue in both groups. Plasma γ-tocopherol was significantly lower (p < 0.011) in the obese group while other fat-soluble micronutrients showed no statistically significant differences between both groups. Branched-chain amino acids (all p < 0.008) and lysine (p < 0.006) were significantly higher in morbidly obese patients compared to the control group. Malondialdehyde concentrations in both visceral (p < 0.016) and subcutaneous (p < 0.002) adipose tissue were significantly higher in the morbidly obese group while plasma markers of oxidative stress showed no significant differences between both groups. Significantly lower plasma concentrations of phosphatidylcholine, phosphatidylethanolamine, lyso-phosphatidylethanolamine (all p < 0.05) and their corresponding ether-linked analogs were observed, which were all reduced in obese participants compared to the control group. Pre-operative assessment of micronutrients in patients undergoing bariatric surgery is recommended for early identification of patients who might be at higher risk to develop a severe micronutrient deficiency post-surgery. Assessment of plasma BCAAs and phospholipids in obese patients might help to differentiate between metabolic healthy patients and those with metabolic disorders. Full article
(This article belongs to the Special Issue The 10th Anniversary of Antioxidants: Past, Present and Future)
8 pages, 1349 KiB  
Communication
Verification of the Relationship between Redox Regulation of Thioredoxin Target Proteins and Their Proximity to Thylakoid Membranes
by Yuka Fukushi, Yuichi Yokochi, Ken-ichi Wakabayashi, Keisuke Yoshida and Toru Hisabori
Antioxidants 2022, 11(4), 773; https://doi.org/10.3390/antiox11040773 - 13 Apr 2022
Cited by 1 | Viewed by 1804
Abstract
Thioredoxin (Trx) is a key protein of the redox regulation system in chloroplasts, where it modulates various enzyme activities. Upon light irradiation, Trx reduces the disulfide bonds of Trx target proteins (thereby turning on their activities) using reducing equivalents obtained from the photosynthetic [...] Read more.
Thioredoxin (Trx) is a key protein of the redox regulation system in chloroplasts, where it modulates various enzyme activities. Upon light irradiation, Trx reduces the disulfide bonds of Trx target proteins (thereby turning on their activities) using reducing equivalents obtained from the photosynthetic electron transport chain. This reduction process involves a differential response, i.e., some Trx target proteins in the stroma respond slowly to the change in redox condition caused by light/dark changes, while the ATP synthase γ subunit (CF1-γ) located on the surface of thylakoid membrane responds with high sensitivity. The factors that determine this difference in redox kinetics are not yet known, although here, we hypothesize that it is due to each protein’s localization in the chloroplast, i.e., the reducing equivalents generated under light conditions can be transferred more efficiently to the proteins on thylakoid membrane than to stromal proteins. To explore this possibility, we anchored SBPase, one of the stromal Trx target proteins, to the thylakoid membrane in Arabidopsis thaliana. Analyses of the redox behaviors of the anchored and unanchored proteins showed no significant difference in their reduction kinetics, implying that protein sensitivity to redox regulation is determined by other factors. Full article
(This article belongs to the Special Issue Thioredoxin and Glutaredoxin Systems II)
Show Figures

Figure 1

Figure 1
<p>Generation of <span class="html-italic">A. thaliana</span> mutants expressing membrane-anchored SBPase. (<b>A</b>) Construction of SBPase-TM<sub>APX</sub>. The blue ovals represent SBPase and the magenta cylinder represents TM<sub>APX</sub>. The gray chain represents the Hexa-His-tag linker connecting SBPase to TM<sub>APX</sub>. (<b>B</b>) SBPase-TM<sub>APX</sub> expression in two independent lines was confirmed by Western blotting. (<b>C</b>) The relative expression level of SBPase-TM<sub>APX</sub> in OE-SBPase-TM<sub>APX</sub> plant was calculated from the signal intensities shown in (<b>B</b>). The expression level of endogenous SBPase in an OE-SBPase-TM<sub>APX</sub> plant was defined to 100%. Each value represents the mean ± SD (<span class="html-italic">n</span> = 3).</p>
Full article ">Figure 2
<p>Phenotypes of mutant plants expressing membrane-anchored SBPase. (<b>A</b>) Four-week-old OE-SBPase-TM<sub>APX</sub> plants. (<b>B</b>) Fresh weight (FW) and chlorophyll content of OE-SBPase-TM<sub>APX</sub> plant. Each value represents the mean ± SD (<span class="html-italic">n</span> = 4). Different letters indicate significant differences among plant lines (<span class="html-italic">p</span> &lt; 0.05; one-way ANOVA and Tukey’s honestly significant difference).</p>
Full article ">Figure 3
<p>Localization of the membrane-anchored SBPase in chloroplasts. Proteins from stroma and thylakoid membrane fractions of leaves in OE-SBPase-TM<sub>APX</sub> plants were prepared for immunoblot analysis. The same amounts of proteins were loaded into each lane as shown in an SDS-PAGE gel in the right panel (silver-stained). Antibodies against SBPase was used to detect the endogenous SBPase and SBPase-TM<sub>APX</sub>. FBPase and light-harvesting complex protein LHCA1 were detected as markers of stroma and thylakoid membrane fractions, respectively, using their specific antibodies.</p>
Full article ">Figure 4
<p>In vivo redox responses of membrane-anchored SBPase. Dark-adapted plants were placed under light conditions (650–750 µmol photons m<sup>−2</sup> s<sup>−1</sup>) for the specified time period and then leaves were frozen in liquid nitrogen. The redox states of endogenous SBPase, SBPase-TM<sub>APX</sub> and CF<sub>1</sub>-γ were determined by the method previously described in [<a href="#B12-antioxidants-11-00773" class="html-bibr">12</a>]. Antibodies against SBPase and CF<sub>1</sub>-γ were used to detect the endogenous proteins, while the Penta·His-tag antibody was used to detect SBPase-TM<sub>APX</sub>, thus providing a clear distinction between the reduced band of endogenous SBPase and the oxidized band of SBPase-TM<sub>APX</sub> in OE-SBPase-TM<sub>APX</sub> plants. (<b>A</b>) The redox state of endogenous SBPase and CF<sub>1</sub>-γ in WT plants. (<b>B</b>) The redox state of SBPase-TM<sub>APX</sub> and CF<sub>1</sub>-γ in OE-SBPase-TM<sub>APX</sub> plants. (<b>C</b>) The reduction level of SBPase and CF<sub>1</sub>-γ is based on the signal intensities shown in (<b>A</b>,<b>B</b>). The reduction level was calculated as the ratio of the reduced form to the total amount of reduced and oxidized forms. Each value represents the mean ± SD (<span class="html-italic">n</span> = 3). Red, reduced form; Ox, oxidized form.</p>
Full article ">
15 pages, 2382 KiB  
Article
Hop Tannins as Multifunctional Tyrosinase Inhibitor: Structure Characterization, Inhibition Activity, and Mechanism
by Jiaman Liu, Yanbiao Chen, Xinxin Zhang, Jie Zheng, Weiying Hu and Bo Teng
Antioxidants 2022, 11(4), 772; https://doi.org/10.3390/antiox11040772 - 13 Apr 2022
Cited by 7 | Viewed by 2699
Abstract
The application of hops could be extended to obtain higher commercial values. Tannins from hops were assessed for their tyrosinase inhibition ability, and the associated mechanisms were explored. Nuclear magnetic resonance (NMR) and high-performance liquid chromatography–electrospray ionization–tandem mass spectrometry (HPLC–ESI–MS/MS) revealed that the [...] Read more.
The application of hops could be extended to obtain higher commercial values. Tannins from hops were assessed for their tyrosinase inhibition ability, and the associated mechanisms were explored. Nuclear magnetic resonance (NMR) and high-performance liquid chromatography–electrospray ionization–tandem mass spectrometry (HPLC–ESI–MS/MS) revealed that the hop tannins were characterized as condensed tannins with (epi)catechin and (epi)gallocatechin as subunits and an average polymerization degree of 10.32. Tyrosinase inhibition assay indicated that hop tannins had an IC50 = 76.52 ± 6.56 μM. Kinetic studies of the inhibition processes indicated the tannins provided inhibition through competitive–uncompetitive mixed reactions. In silico molecule docking showed that tannins were bound to the active site of tyrosinase via hydrogen and electrovalent bonds. Circular dichroism (CD) observed the structural variation in the tyrosinase after reacting with the tannins. Fluorescence quenching analysis and free radical scavenging assays indicated that the tannins had copper ion chelating and antioxidant activities, which may also contribute to inhibition. The intracellular inhibition assay revealed that the melanin was reduced by 34.50% in B16F10 cells. These results indicate that these tannins can be applied as whitening agents in the cosmetics industry. Full article
(This article belongs to the Special Issue Antioxidants in Food and Cosmetics)
Show Figures

Figure 1

Figure 1
<p>Schematic diagram of sample preparation and analyses in the study.</p>
Full article ">Figure 2
<p>Structure and numbering scheme of the flavanol-3-ol subunit.</p>
Full article ">Figure 3
<p>The proposed structure of the (epi)catechin (<b>A</b>), (epi)catechin–cysteamine (<b>B</b>), and (epi)gallocatechin (<b>C</b>) released from hop tannins (<b>D</b>) after acid–cleavage reaction. The fragmentation pathways are illustrated: blue lines = RDA reaction; brick-red lines = rearrangement of B-ring; yellow lines = HRF reaction; green lines = loss of water; black lines = loss of cysteamine adduct.</p>
Full article ">Figure 4
<p>Tyrosinase concentration–reaction rate plots (<b>A</b>) and Lineweaver–Burk plots (<b>B</b>) of hop tannins of different concentrations (from 1 to 5, tannin concentration: 0, 0.041, 0.027, 0.041, and 0.068 mM); the plot of slope (<b>C</b>) or intercept (<b>D</b>) versus hop tannin concentration for determining inhibition constants K<sub>I</sub> and K<sub>IS</sub>.</p>
Full article ">Figure 5
<p>Molecular docking of catechin (<b>A</b>), gallocatechin (<b>B</b>), epicatechin (<b>C</b>), and epigallocatechin (<b>D</b>) on active site of tyrosinase.</p>
Full article ">Figure 6
<p>Fluorescence emission spectra of hop tannin solutions with different Cu<sup>2+</sup> concentrations.</p>
Full article ">Figure 7
<p>Intracellular tyrosinase inhibition rate (<b>A</b>) and intracellular melanin inhibition rate (<b>B</b>) of hop tannins.</p>
Full article ">
10 pages, 15584 KiB  
Article
Apoptotic p53 Gene Expression in the Regulation of Persistent Organic Pollutant (POP)-Induced Oxidative Stress in the Intertidal Crab Macrophthalmusjaponicus
by Kiyun Park and Ihn-Sil Kwak
Antioxidants 2022, 11(4), 771; https://doi.org/10.3390/antiox11040771 - 13 Apr 2022
Cited by 6 | Viewed by 1801
Abstract
Persistent organic pollutants (POPs), some of the most dangerous chemicals released into the aquatic environment, are distributed worldwide due to their environmental persistence and bioaccumulation. In the study, we investigated p53-related apoptotic responses to POPs such as hexabromocyclododecanes (HBCDs) or 2,2′,4,4′-tetrabromodiphenyl ether [...] Read more.
Persistent organic pollutants (POPs), some of the most dangerous chemicals released into the aquatic environment, are distributed worldwide due to their environmental persistence and bioaccumulation. In the study, we investigated p53-related apoptotic responses to POPs such as hexabromocyclododecanes (HBCDs) or 2,2′,4,4′-tetrabromodiphenyl ether (BDE-47) in the mud crab Macrophthalmus japonicus. To do so, we characterized M. japonicus p53 and evaluated basal levels of p53 expression in different tissues. M. japonicus p53 has conserved amino acid residues involving sites for protein dimerization and DNA and zinc binding. In phylogenetic analysis, the homology of the deduced p53 amino acid sequence was not high (67–70%) among crabs, although M. japonicus p53 formed a cluster with one clade with p53 homologs from other crabs. Tissue distribution patterns revealed that the highest expression of p53 mRNA transcripts was in the hepatopancreas of M. japonicus crabs. Exposure to POPs induced antioxidant defenses to modulate oxidative stress through the upregulation of catalase expression. Furthermore, p53 expression was generally upregulated in the hepatopancreas and gills of M. japonicus after exposure to most concentrations of HBCD or BDE-47 for all exposure periods. In hepatopancreas tissue, significant increases in p53 transcript levels were observed as long-lasting apoptotic responses involving cellular defenses until day 7 of relative long-term exposure. The findings in this study suggest that exposure to POPs such as HBCD or BDE-47 may trigger the induction of cellular defense processes against oxidative stress, including DNA repair, cell cycle arrest, and apoptosis through the transcriptional upregulation of p53 expression in M. japonicus. Full article
(This article belongs to the Special Issue Environmental Stress and Antioxidant Defences)
Show Figures

Figure 1

Figure 1
<p>Characterization of <span class="html-italic">Macrophthalmus japonicus p53</span> gene. (<b>A</b>) ClustalW multiple-sequence alignment of the deduced <span class="html-italic">Mjp53</span> gene sequence with homologous <span class="html-italic">p53</span> genes of various crabs. Shaded marks in black indicated completely conserved residues in all species. Dimerization site (polypeptide-binding site) and zinc-binding site (ion-binding site) are indicated by black asterisk mark and blue asterisk mark, respectively. DNA-binding site (nucleic-acid-binding site) is presented as a red rectangular box. (<b>B</b>) Phylogenetic circle tree of <span class="html-italic">Mjp53</span> gene with other <span class="html-italic">p53s</span>. Neighbor-joining analysis showed a circle tree for phylogenetic relationships in <span class="html-italic">p53</span> amino acid sequences using the MEGA v.4.0 software. Bootstrap values represent 1000 replicates.</p>
Full article ">Figure 2
<p>Basal transcriptional levels of <span class="html-italic">M. japonicus p53</span> genes in various tissues (Gi, gills; Hp, hepatopancreas; Ht, heart; Gn, gonad; Ms, muscle; and St, stomach). All data are indicated as means ± standard deviation. Expression level of <span class="html-italic">GAPDH</span> transcripts was used for normalization of the relative transcriptional levels in each tissue from 10 crabs. The experiment was repeated three times.</p>
Full article ">Figure 3
<p>Relative transcriptional levels of <span class="html-italic">catalase</span> gene in <span class="html-italic">M. japonicus</span> gills (<b>A</b>,<b>C</b>) and hepatopancreas (<b>B</b>,<b>D</b>) after exposures to 1, 10, and 100 μg L<sup>−1</sup> HBCD (<b>A</b>,<b>B</b>) and 0.1, 1, and 10 μg L<sup>−1</sup> BDE-47 (<b>C</b>,<b>D</b>). Exposure periods were days 1, 4, and 7. <span class="html-italic">GAPDH</span> levels were used for normalization of the values. All values are indicated as mean ± SD. Statistically significant differences are presented by an asterisk mark (* <span class="html-italic">p</span> &lt; 0.05 and ** <span class="html-italic">p</span> &lt; 0.01) compared with the relative control value (<span class="html-italic">catalase</span> = 1).</p>
Full article ">Figure 4
<p>Relative transcriptional levels of <span class="html-italic">p53</span> gene in <span class="html-italic">M. japonicus</span> gills (<b>A</b>,<b>C</b>) and hepatopancreas (<b>B</b>,<b>D</b>) after exposures to 1, 10, and 100 μg L<sup>−1</sup> HBCD (<b>A</b>,<b>B</b>) and 0.1, 1, and 10 μg L<sup>−1</sup> BDE-47 (<b>C</b>,<b>D</b>). Exposure periods were days 1, 4, and 7. <span class="html-italic">GAPDH</span> levels were used for normalization of the values. All values are indicated as mean ± SD. Statistically significant differences are presented by an asterisk mark (* <span class="html-italic">p</span> &lt; 0.05 and ** <span class="html-italic">p</span> &lt; 0.01) compared with the relative control value (<span class="html-italic">p53</span> = 1).</p>
Full article ">Figure 5
<p>Schematic summary of the suggested molecular process involving antioxidation and <span class="html-italic">p53</span>-mediated apoptosis in <span class="html-italic">M. japonicus</span> animals exposed to POPs (HBCD and BDE-47). SOD: Superoxide dismutase, ROS: Reactive oxygen species.</p>
Full article ">
12 pages, 18548 KiB  
Article
Marker-Free Rice (Oryza sativa L. cv. IR 64) Overexpressing PDH45 Gene Confers Salinity Tolerance by Maintaining Photosynthesis and Antioxidant Machinery
by Ranjan Kumar Sahoo, Renu Tuteja, Ritu Gill, Juan Francisco Jiménez Bremont, Sarvajeet Singh Gill and Narendra Tuteja
Antioxidants 2022, 11(4), 770; https://doi.org/10.3390/antiox11040770 - 12 Apr 2022
Cited by 3 | Viewed by 2422
Abstract
Helicases function as key enzymes in salinity stress tolerance, and the role and function of PDH45 (pea DNA helicase 45) in stress tolerance have been reported in different crops with selectable markers, raising public and regulatory concerns. In the present study, we developed [...] Read more.
Helicases function as key enzymes in salinity stress tolerance, and the role and function of PDH45 (pea DNA helicase 45) in stress tolerance have been reported in different crops with selectable markers, raising public and regulatory concerns. In the present study, we developed five lines of marker-free PDH45-overexpressing transgenic lines of rice (Oryza sativa L. cv. IR64). The overexpression of PDH45 driven by CaMV35S promoter in transgenic rice conferred high salinity (200 mM NaCl) tolerance in the T1 generation. Molecular attributes such as PCR, RT-PCR, and Southern and Western blot analyses confirmed stable integration and expression of the PDH45 gene in the PDH45-overexpressing lines. We observed higher endogenous levels of sugars (glucose and fructose) and hormones (GA, zeatin, and IAA) in the transgenic lines in comparison to control plants (empty vector (VC) and wild type (WT)) under salt treatments. Furthermore, photosynthetic characteristics such as net photosynthetic rate (Pn), stomatal conductance (gs), intercellular CO2 (Ci), and chlorophyll (Chl) content were significantly higher in transgenic lines under salinity stress as compared to control plants. However, the maximum primary photochemical efficiency of PSII, as an estimated from variable to maximum chlorophyll a fluorescence (Fv/Fm), was identical in the transgenics to that in the control plants. The activities of antioxidant enzymes, such as catalase (CAT), ascorbate peroxidase (APX), glutathione reductase (GR), and guaiacol peroxidase (GPX), were significantly higher in transgenic lines in comparison to control plants, which helped in keeping the oxidative stress burden (MDA and H2O2) lesser on transgenic lines, thus protecting the growth and photosynthetic efficiency of the plants. Overall, the present research reports the development of marker-free PDH45-overexpressing transgenic lines for salt tolerance that can potentially avoid public and biosafety concerns and facilitate the commercialization of genetically engineered crop plants. Full article
Show Figures

Figure 1

Figure 1
<p>Screening and analysis of <span class="html-italic">PDH45</span> marker-free transgenic lines. (<b>a</b>) T-DNA construct of pCAMBIA 1300-<span class="html-italic">PDH45.</span> (<b>b</b>) Transgenic lines (L4, L7, L8, L11, L13, VC, and WT). (<b>c</b>) PCR conformation of the <span class="html-italic">PDH45</span>-overexpressing transgenic (T<sub>1</sub>) lines showed the amplification of 1.2 Kb fragment. (<b>d</b>) Southern blot analysis showing the integration and copy number of the <span class="html-italic">PDH45</span> gene. (<b>e</b>) Relative gene expression of <span class="html-italic">PDH45</span> transgenic lines. (<b>f</b>) Western blot analysis showing the <span class="html-italic">PDH45</span> protein (≈45 kDa).</p>
Full article ">Figure 2
<p>Salinity tolerance of <span class="html-italic">PDH45</span>-overexpressing transgenic T<sub>1</sub> IR64 rice lines. (<b>a</b>) Leaf disk senescence assay under 100 and 200 mM NaCl treatment. (<b>b</b>) Chlorophyll content (mg/g fw) in <span class="html-italic">PDH45</span> transgenic lines after salt treatment. (<b>c</b>) Third day in 200 mM NaCl treatment. (<b>d</b>) After 15 days of NaCl treatment.</p>
Full article ">Figure 3
<p>Measurement of photosynthetic characteristics and chlorophyll a fluorescence of WT, VC, and <span class="html-italic">PDH45</span> marker-free transgenic lines (L4, L7, L8, L11, and L13) under 200 mM NaCl treatment. (<b>a</b>) Photosynthetic rate. (<b>b</b>) Stomatal conductance. (<b>c</b>) Intracellular CO<sub>2</sub>. (<b>d</b>) CO<sub>2</sub> release. (<b>e</b>) Transpiration rate. (<b>f</b>) Photosynthetic yield (Fv/Fm). Values are mean ± SE (<span class="html-italic">n</span> = 3). Different letters on the top of bars indicate significant differences at <span class="html-italic">p</span> ≤ 0.05 level as determined by Duncan’s multiple range test (DMRT).</p>
Full article ">Figure 4
<p>Biochemical analysis of <span class="html-italic">PDH45</span>-overexpressing T<sub>1</sub> transgenic lines (L4, L7, L8, L11, L13, VC) and WT plants exposed to 24 h at 200 mM NaCl treatment. (<b>a</b>) Ion leakage. (<b>b</b>) Hydrogen peroxide (H<sub>2</sub>O<sub>2</sub>) content. (<b>c</b>) Lipid peroxidation expressed in terms of MDA content. (<b>d</b>) Level of proline accumulation. (<b>e</b>) Catalase (CAT) activity; one unit of enzyme activity defined as 1 μmol H<sub>2</sub>O<sub>2</sub> oxidized min<sup>−1</sup>. (<b>f</b>) Ascorbate peroxidase (APX) activity; one unit of enzyme activity defined as 1 μmol of ascorbate oxidized min<sup>−1</sup>. (<b>g</b>) Guaiacol peroxidase (GPX) activity. (<b>h</b>) Glutathione reductase (GR) activity; one unit of enzyme activity is defined as 1 μmol of GS-TNB formed min<sup>−1</sup> due to reduction of DTNB. (<b>i</b>) Percent relative water content (RWC). Values are mean ± SE (<span class="html-italic">n</span> = 3). Different letters on the top of bars indicate significant differences at <span class="html-italic">p</span> ≤ 0.05 level as determined by Duncan’s multiple range test (DMRT).</p>
Full article ">Figure 5
<p>Soluble sugar, hormones, and K<sup>+</sup> and Na<sup>+</sup> content in the roots and shoots of <span class="html-italic">PDH45</span>-overexpressing marker-free transgenic lines (L4, L7, L8, L11, L13) as compared to WT and VC plants exposed to 24 h at 200 mM NaCl treatment. (<b>a</b>) Glucose content. (<b>b</b>) Fructose content. (<b>c</b>) Endogenous GA content. (<b>d</b>) Endogenous zeatin content. (<b>e</b>) Endogenous IAA content. (<b>f</b>) Endogenous potassium and sodium content. Values are mean ± SE (<span class="html-italic">n</span> = 3). Different letters on the top of bars indicate significant differences at <span class="html-italic">p</span> ≤ 0.05 level as determined by Duncan’s multiple range test (DMRT).</p>
Full article ">
17 pages, 1383 KiB  
Review
Oxidative Stress and Ischemia/Reperfusion Injury in Kidney Transplantation: Focus on Ferroptosis, Mitophagy and New Antioxidants
by Simona Granata, Valentina Votrico, Federica Spadaccino, Valeria Catalano, Giuseppe Stefano Netti, Elena Ranieri, Giovanni Stallone and Gianluigi Zaza
Antioxidants 2022, 11(4), 769; https://doi.org/10.3390/antiox11040769 - 12 Apr 2022
Cited by 60 | Viewed by 6519
Abstract
Although there has been technical and pharmacological progress in kidney transplant medicine, some patients may experience acute post-transplant complications. Among the mechanisms involved in these conditions, ischemia/reperfusion (I/R) injury may have a primary pathophysiological role since it is one of the leading causes [...] Read more.
Although there has been technical and pharmacological progress in kidney transplant medicine, some patients may experience acute post-transplant complications. Among the mechanisms involved in these conditions, ischemia/reperfusion (I/R) injury may have a primary pathophysiological role since it is one of the leading causes of delayed graft function (DGF), a slow recovery of the renal function with the need for dialysis (generally during the first week after transplantation). DGF has a significant social and economic impact as it is associated with prolonged hospitalization and the development of severe complications (including acute rejection). During I/R injury, oxidative stress plays a major role activating several pathways including ferroptosis, an iron-driven cell death characterized by iron accumulation and excessive lipid peroxidation, and mitophagy, a selective degradation of damaged mitochondria by autophagy. Ferroptosis may contribute to the renal damage, while mitophagy can have a protective role by reducing the release of reactive oxygen species from dysfunctional mitochondria. Deep comprehension of both pathways may offer the possibility of identifying new early diagnostic noninvasive biomarkers of DGF and introducing new clinically employable pharmacological strategies. In this review we summarize all relevant knowledge in this field and discuss current antioxidant pharmacological strategies that could represent, in the next future, potential treatments for I/R injury. Full article
Show Figures

Figure 1

Figure 1
<p>Schematic representation of the mechanisms of ferroptosis and mitophagy in renal ischemia/reperfusion (I/R) injury. During I/R several pathways contribute to ferroptosis: (i) the overproduction of ROS by NADPH oxidase (NOX), nitric oxide synthase (NOS), xanthine oxidoreductase (XOR) and mitochondria promotes lipid peroxidation and plasmatic membrane rupture; (ii) the reduction in glutathione (GSH) content inhibits glutathione peroxidase 4 (GPX4) activity and its protective action against membrane lipid peroxidation; (iii) I/R can indirectly induce ferritinophagy which causes the degradation of intracellular ferritin, and the increment of intracellular labile iron pool. Mitophagy is activated in I/R through both ubiquitin-dependent and ubiquitin-independent mechanisms and seems to have a protective role in I/R injury by reducing the release of reactive oxygen species from dysfunctional mitochondria. In physiological conditions, PINK1 is imported into mitochondria where it is cleaved by the intramembrane serine protease presenilin associated rhomboid-like (PARL) and ultimately degraded. When mitochondria are damaged, and lose their membrane potential, PINK1 accumulates on the mitochondrial outer membrane (MOM) and recruits Parkin. Parkin ubiquitinates several mitochondrial substrates such as voltage-dependent anion-selective channel protein (VDAC) and dynamin-1-like protein (DRP1). These ubiquitinated proteins can recruit mitophagy receptors (such as optineurin, p62) that link mitochondria to autophagosomes through interacting with LC3. This causes an autophagic engulfment of the organelle necessary for its degradation. The ubiquitin-independent mechanism is regulated by mitophagy receptors that localize on MOM, such as BCL2 interacting protein 3 (BNIP3), BNIP3-like (BNIP3L/NIX), and FUN14 domain containing 1 (FUNDC1). These proteins bridge mitochondria to autophagosome by directly interacting with LC3.</p>
Full article ">Figure 2
<p>Mechanism of Nrf2 regulation in the treatment of renal I/R. In physiological condition Nrf2 binds to Kelch-like ECH-associated protein-1 (Keap1) in the cytoplasm and is degraded by ubiquitin-proteasome pathway. During renal I/R the hyperactivation of Nrf2 by CDDO, H<sub>2</sub>S, water-soluble H<sub>2</sub>S donor (such as GYY4137) leads to nuclear traslocation of Nrf2 that binds to antioxidant response elements and activates transcription of the genes encoding proteins involved in antioxidants mechanisms and iron metabolism thereby preventing the ROS-mediated tubular damage and the ferroptotic cascade.</p>
Full article ">
18 pages, 1209 KiB  
Article
Chemical, Antioxidant, and Antimicrobial Properties of the Peel and Male Flower By-Products of Four Varieties of Punica granatum L. Cultivated in the Marche Region for Their Use in Cosmetic Products
by Maria Rosa Gigliobianco, Manuela Cortese, Samanta Nannini, Lucrezia Di Nicolantonio, Dolores Vargas Peregrina, Giulio Lupidi, Luca Agostino Vitali, Elena Bocchietto, Piera Di Martino and Roberta Censi
Antioxidants 2022, 11(4), 768; https://doi.org/10.3390/antiox11040768 - 12 Apr 2022
Cited by 15 | Viewed by 3259
Abstract
We are now seeing an increase in the production of agri-food waste, which is an essential resource for the recovery of bioactive compounds that may be employed as innovative natural ingredients in cosmetics. To date, the approach to cosmetics preservation has seen a [...] Read more.
We are now seeing an increase in the production of agri-food waste, which is an essential resource for the recovery of bioactive compounds that may be employed as innovative natural ingredients in cosmetics. To date, the approach to cosmetics preservation has seen a significant shift in the search for biological components that give healthier alternatives for customers and help businesses operate in an environmentally friendly manner. To achieve this goal, we studied pomegranate extracts using the peel and, for the first time, extracts from the male flowers of a wide pomegranate variety cultivated in the Marche region, specifically, the Wonderful, Mollar de Elche, Parfianka, and less-studied G1 varieties. We studied the phenol compounds profile, antioxidant capacity, antimicrobial activity, and cell viability of the obtained pomegranate extracts. The identification and quantification of phenol compounds belonging to different classes, such as hydrolysable tannins, hydroxybenzoic acid, hydroxycinnamic acid, dihydroflavonol, gallocatechin, and anthocyanins, were performed using UPLC-ESI-MS/MS. Punicalagin isomers and punicalin resulted in the most abundant polyphenols found in the peel and male flower extracts. Mollar de Elche 2020 peel extract revealed a high concentration of punicalagin A and B (7206.4 mg/kg and 5812.9), while the content of gallic acid revealed high results in the G1 and Parfianka varieties. All extracts were spectrophotometrically analysed to determine their total phenol content (TPC) using the Folin–Ciocalteu method and their antioxidant capacity (AC). In terms of the total phenol obtained by the Folin–Ciocalteu colorimetric method, Mollar de Elche 2020 extracts reported the highest TPC content of 12.341 µmol GAE/g. Results revealed that the Mollar de Elche and Wonderful 2020 peel extracts demonstrated the highest TPC and AC. Furthermore, AC results indicated that the peel extracts displayed higher AC than the male flower extract due to the high punicalagin content detected by UPLC analysis. The antimicrobial activity testing revealed that the Wonderful and G1 2020 peel extracts resulted active against Escherichia coli, while all extracts exhibited promising anticandidal activity. Additionally, the cytocompatibility was evaluated in keratinocytes HaCaT cells by testing concentrations of pomegranate extracts ranging from 0.15 to 5.00 mg/mL. Extracts were non-toxic for the cells in the tested concentration range. The acquired results may help exploit pomegranate agri-food waste products provided by the Marche region’s short supply chain for their use as an antimicrobial and antioxidant booster in the formulation of cosmetic products. Full article
(This article belongs to the Special Issue Dietary Antioxidants and Cosmetics)
Show Figures

Figure 1

Figure 1
<p>HPLC chromatographic profile of the phenol compounds (<b>a</b>), and quantified anthocyanins (<b>b</b>) (A4 in brown, A2 in green, A3 in orange, A1 in fuchsia), present in pomegranate peel extracts (variety G1). For peaks identification see <a href="#app1-antioxidants-11-00768" class="html-app">Tables S1 and S2</a>.</p>
Full article ">Figure 2
<p>Cytotoxicity of the pomegranate peel extracts G1 and Wonderful 2019 and 2020 in HaCaT cells evaluated by MTT assay. For 24 h, cells were treated with an extract at different concentrations (0.15–5.00 mg/mL). The data are shown as a percentage of control cells and as the mean ± SEM of four separate experiments. (* <span class="html-italic">p</span> &lt; 0.01 vs. untreated cells; one-way ANOVA with Dunnett post hoc test).</p>
Full article ">
17 pages, 4976 KiB  
Article
TLR4 Signaling and Heme Oxygenase-1/Carbon Monoxide Pathway Crosstalk Induces Resiliency of Myeloma Plasma Cells to Bortezomib Treatment
by Grazia Scandura, Cesarina Giallongo, Fabrizio Puglisi, Alessandra Romano, Nunziatina Laura Parrinello, Tatiana Zuppelli, Lucia Longhitano, Sebastiano Giallongo, Michelino Di Rosa, Giuseppe Musumeci, Roberto Motterlini, Roberta Foresti, Giuseppe Alberto Palumbo, Giovanni Li Volti, Francesco Di Raimondo and Daniele Tibullo
Antioxidants 2022, 11(4), 767; https://doi.org/10.3390/antiox11040767 - 12 Apr 2022
Cited by 11 | Viewed by 2678
Abstract
Relapse in multiple myeloma (MM) decreases therapy efficiency through unclear mechanisms of chemoresistance. Since our group previously demonstrated that heme oxygenase-1 (HO-1) and Toll-like receptor 4 (TLR4) are two signaling pathways protecting MM cells from the proteasome inhibitor bortezomib (BTZ), we here evaluated [...] Read more.
Relapse in multiple myeloma (MM) decreases therapy efficiency through unclear mechanisms of chemoresistance. Since our group previously demonstrated that heme oxygenase-1 (HO-1) and Toll-like receptor 4 (TLR4) are two signaling pathways protecting MM cells from the proteasome inhibitor bortezomib (BTZ), we here evaluated their cross-regulation by a pharmacological approach. We found that cell toxicity and mitochondrial depolarization by BTZ were increased upon inhibition of HO-1 and TLR4 by using tin protoporphyrin IX (SnPP) and TAK-242, respectively. Furthermore, the combination of TAK-242 and BTZ activated mitophagy and decreased the unfolded protein response (UPR) survival pathway in association with a downregulation in HO-1 expression. Notably, BTZ in combination with SnPP induced effects mirroring the treatment with TAK-242/BTZ, resulting in a blockade of TLR4 upregulation. Interestingly, treatment of cells with either hemin, an HO-1 inducer, or supplementation with carbon monoxide (CO), a by-product of HO-1 enzymatic activity, increased TLR4 expression. In conclusion, we showed that treatment of MM cells with BTZ triggers the TLR4/HO-1/CO axis, serving as a stress-responsive signal that leads to increased cell survival while protecting mitochondria against BTZ and ultimately promoting drug resistance. Full article
Show Figures

Graphical abstract

Graphical abstract
Full article ">Figure 1
<p>TLR4 inhibition increased BTZ cytotoxicity by promoting oxidative stress coupled with mitophagy. (<b>A</b>) Representative dot plots of the effect of TAK-242, BTZ, and TAK-242/BTZ treatment on the viability of U266 and NCI-H929 cells are shown. The graphs (right panels) show the mean values of the percentage of apoptotic cells after annexin V–FITC and PI staining. (<b>B</b>) Reactive oxygen species production during drug treatment was measured in MM cell lines by the oxidation of 2′,7′-dichlorofluorescein (DCF-DA) using flow cytometry. (<b>C</b>) Mitochondrial membrane potential was assessed by using DiOC2(3) staining. Representative histograms of a flow cytometry analysis are shown (left panels). (<b>D</b>) Flow cytometric analysis of mitochondrial mass 24 h post-treatment was determined by using MitoTracker Red fluorescence. Representative histograms (left panels) are shown. Data are expressed as mean MFI ± SEM of <span class="html-italic">n</span> ≥ 4 biological replicates; * <span class="html-italic">p</span> &lt; 0.05; ** <span class="html-italic">p</span> &lt; 0.01; *** <span class="html-italic">p</span> &lt; 0.001, **** <span class="html-italic">p</span> &lt; 0.0001.</p>
Full article ">Figure 2
<p>TLR4 inhibition increased BTZ-induced mitophagy activation. (<b>A</b>) Immunofluorescence for the colocalization of LC3 (green) and mitochondria (stained by using MitoTracker red) after drug treatments in myeloma cells. (<b>B</b>) Analysis of PINK1 expression after drug treatments for 24 h. GAPDH protein was used as total protein loading reference. For analysis, the optical density of the bands was measured using Scion Image software. Data are expressed as mean MFI ± SEM of <span class="html-italic">n</span> ≥ 4 biological replicates; * <span class="html-italic">p</span> &lt; 0.05; ** <span class="html-italic">p</span> &lt; 0.01; *** <span class="html-italic">p</span> &lt; 0.001, **** <span class="html-italic">p</span> &lt; 0.0001.</p>
Full article ">Figure 3
<p>TLR4 modulated HO-1 expression. (<b>A</b>) Western blot analysis of HO-1 expression in myeloma cell lines after LPS treatment. β-actin protein was used as total protein loading reference. (<b>B</b>) Immunofluorescence of Nrf2 (green) nuclear translocation after LPS treatment in myeloma cell lines. (<b>C</b>) Western blot analysis of HO-1 expression in myeloma cell lines 24 h after drug treatments. GAPDH protein was used as total protein loading reference. For Western blot analysis, the optical density of the bands was measured using Scion Image software. Data are expressed as mean MFI ± SEM of <span class="html-italic">n</span> ≥ 4 biological replicates; * <span class="html-italic">p</span> &lt; 0.05; ** <span class="html-italic">p</span> &lt; 0.01; *** <span class="html-italic">p</span> &lt; 0.001, **** <span class="html-italic">p</span> &lt; 0.0001.</p>
Full article ">Figure 4
<p>TLR4 inhibition decreased BTZ-induced ER stress. (<b>A</b>) Western blot analysis of expression of ER stress protein markers (PERK, IRE1α, GPR78) in myeloma cell lines after drug treatments. GAPDH protein was used as total protein loading reference. For analysis, the optical density of the bands was measured using Scion Image software. (<b>B</b>) Relative mRNA expression of CHOP after drug treatments. Calculated value of 2<sup>−∆∆Ct</sup> in untreated cells was 1. Data are expressed as mean MFI ± SEM of <span class="html-italic">n</span> ≥ 4 biological replicates; * <span class="html-italic">p</span> &lt; 0.05; ** <span class="html-italic">p</span> &lt; 0.01; *** <span class="html-italic">p</span> &lt; 0.001, **** <span class="html-italic">p</span> &lt; 0.0001.</p>
Full article ">Figure 5
<p>HO-1 enzymatic inhibition increased BTZ cytotoxicity by rising mitochondrial depolarization. (<b>A</b>) Representative dot plots of the effect of SnPP, BTZ, and SnPP/BTZ treatment on the viability of U266 and NCI-H929 cells are shown. The graphs (right panels) show the mean values of the percentage of apoptotic cells after annexin V–FITC and PI staining. (<b>B</b>) Mitochondrial membrane potential was evaluated after drug treatment. Representative histograms of a flow cytometric analysis are shown (left panels). (<b>C</b>) Flow cytometry analysis of mitochondrial mass 24 h post-treatment. Representative histograms (left panels) are shown. Data are expressed as mean MFI ± SEM of <span class="html-italic">n</span> ≥ 4 biological replicates; * <span class="html-italic">p</span> &lt; 0.05; ** <span class="html-italic">p</span> &lt; 0.01; *** <span class="html-italic">p</span> &lt; 0.001; **** <span class="html-italic">p</span> &lt; 0.0001.</p>
Full article ">Figure 6
<p>HO-1 enzymatic inhibition decreased BTZ-induced ER stress. (<b>A</b>,<b>B</b>) Analysis of expression of ER stress protein markers (PERK, IRE1α, GPR78) and TLR4 after SnPP treatment alone or in combination with BTZ. GAPDH protein was used as total protein loading reference. For analysis, the optical density of the bands was measured using Scion Image software. Data are expressed as mean MFI ± SEM of <span class="html-italic">n</span> ≥ 4 biological replicates; * <span class="html-italic">p</span> &lt; 0.05; ** <span class="html-italic">p</span> &lt; 0.01; *** <span class="html-italic">p</span> &lt; 0.001; **** <span class="html-italic">p</span> &lt; 0.0001.</p>
Full article ">Figure 7
<p>Hemin treatment increased TLR4 expression in myeloma cells. (<b>A</b>–<b>C</b>) Western blot analysis of TLR4 and MAP kinase P-38 and ERK1/2 expression after hemin treatment. GAPDH or β-actin proteins were used as total protein loading reference. For analysis, the optical density of the bands was measured using Scion Image software. (<b>D</b>) Immunofluorescence of Nrf2 (green) nuclear translocation after hemin treatment. Data are expressed as mean MFI ± SEM of <span class="html-italic">n</span> ≥ 4 biological replicates; * <span class="html-italic">p</span> &lt; 0.05; ** <span class="html-italic">p</span> &lt; 0.01; *** <span class="html-italic">p</span> &lt; 0.001.</p>
Full article ">Figure 8
<p>Carbon monoxide exposure induced TLR4 expression. (<b>A</b>) Western blot analysis of TLR4 expression after CORM-3 and CORM-A1 treatment in myeloma cells. GAPDH protein was used as total protein loading reference. For analysis, the optical density of the bands was measured using Scion Image software. (<b>B</b>) Immunofluorescence of Nrf2 (green) nuclear translocation after CORM-3 or CORM-A1 treatment. Data are expressed as mean MFI ± SEM of <span class="html-italic">n</span> ≥ 4 biological replicates; * <span class="html-italic">p</span> &lt; 0.05; ** <span class="html-italic">p</span> &lt; 0.01.</p>
Full article ">
Previous Issue
Next Issue
Back to TopTop