[go: up one dir, main page]

Next Issue
Volume 13, October-1
Previous Issue
Volume 13, September-1
 
 
applsci-logo

Journal Browser

Journal Browser

Appl. Sci., Volume 13, Issue 18 (September-2 2023) – 561 articles

Cover Story (view full-size image): 
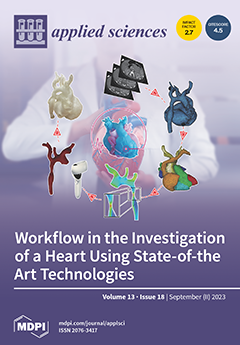
In this paper, an innovative approach concerning the investigation of the human heart is introduced, employing state-of-the-art technologies. In particular, sophisticated algorithms were developed to automatically reconstruct a 3D model of a human heart based on DICOM data and to segment the main parts that constitute it. Regarding the reconstructed 3D model, a diagnosis of the examined patient can be derived, whereas in the present study, a clinical case involving the coarctation of the aorta was inspected. The outcomes of the computation analysis coupled with the segmented patient-specific 3D model were inserted into a virtual reality environment, where clinicians can visualize the blood flow at the vessel walls and train on real-life medical scenarios, enhancing their procedural understanding prior to the actual operation. View this paper
  • Issues are regarded as officially published after their release is announced to the table of contents alert mailing list.
  • You may sign up for e-mail alerts to receive table of contents of newly released issues.
  • PDF is the official format for papers published in both, html and pdf forms. To view the papers in pdf format, click on the "PDF Full-text" link, and use the free Adobe Reader to open them.
Order results
Result details
Section
Select all
Export citation of selected articles as:
12 pages, 892 KiB  
Communication
Automatic Needle Route Proposal in Preoperative Neck CT for Injection Laryngoplasty
by Walid Abdullah Al, Wonjae Cha and Il Dong Yun
Appl. Sci. 2023, 13(18), 10554; https://doi.org/10.3390/app131810554 - 21 Sep 2023
Viewed by 1133
Abstract
Transcutaneous injection laryngoplasty (TIL) is a commonly used method to treat vocal fold paresis, where the affected vocal folds are augmented through injection. Determining the injection site and route is a major step during the preprocedural planning of TIL. In this communication, we [...] Read more.
Transcutaneous injection laryngoplasty (TIL) is a commonly used method to treat vocal fold paresis, where the affected vocal folds are augmented through injection. Determining the injection site and route is a major step during the preprocedural planning of TIL. In this communication, we propose and investigate an automatic method for needle route computation in preoperative neck CT. Recently, deep reinforcement learning (RL) agents showed noteworthy results for localizing the vocal folds. In this work, we focus on finding the optimal needle trajectory from the neck skin to the vocal folds localized by such RL agents. Identifying critical structures and constraints in the medical routine, we propose a minimal cost-based search to find the optimal path. Furthermore, we evaluate the proposed method with neck CT volumes from 136 patients, where it is shown that our computed needle paths have high accuracy. Full article
(This article belongs to the Special Issue Latest Approaches for Medical Image Analysis)
Show Figures

Figure 1

Figure 1
<p>Automatic needle route planning for TIL. Based on the vocal fold locations and the segmented critical regions, the search space is defined by covering all possible trajectories from the anterior neck skin to the vocal folds. The optimal needle routes (one for each vocal fold) are then determined based on a minimal cost search. The first three figures (from left) are presented in axial view, whereas the last figure presents a volumetric render of the result. The blue and orange lines indicate the needle routes for the right and left folds, respectively.</p>
Full article ">Figure 2
<p>Critical region segmentation. Initial air mask is obtained by HU thresholding. Outer air is then segmented based on the geodesic distance with respect to the outer air seed. The airway mask is obtained by subtracting the outer air from the initial air mask.</p>
Full article ">Figure 3
<p>The search space for needle route. The initial search space is obtained by spanning 10 mm to the right (<math display="inline"><semantics> <msub> <mi mathvariant="bold-italic">e</mi> <mi>r</mi> </msub> </semantics></math>) and left (<math display="inline"><semantics> <msub> <mi mathvariant="bold-italic">e</mi> <mi>l</mi> </msub> </semantics></math>) from the midpoint <math display="inline"><semantics> <msub> <mi mathvariant="bold-italic">p</mi> <mi>m</mi> </msub> </semantics></math> on the skin w.r.t. and the vocal fold line. The final search space is obtained excluding the trajectories that pass through the airway.</p>
Full article ">Figure 4
<p>Two examples (in top and bottom) of improved segmentation based on the proposed geodesic distance. Yellow region indicates the intersection of the resultant mask and the ground truth (i.e., true positive region). Green region refers to the over-segmented region (i.e., false positive region). Red region indicates the under-segmented region (i.e., false negative region).</p>
Full article ">Figure 5
<p>Optimal needle routes by the proposed automatic method. The orange and blue lines in the render represent the route to the right and left vocal folds, respectively. The needle insertion lines are extended by 40 voxels beyond the skin for visualization purposes.</p>
Full article ">Figure 6
<p>Needle routes in a noisy case. The critical regions (i.e., air and cartilage) are still clear under the noise because of their large intensity difference. (<b>Left</b>) axial view of the vocal folds. (<b>Right</b>) volumetric render of the resultant needle routes.</p>
Full article ">
14 pages, 10323 KiB  
Article
Research on the RVE of the Calculated Strength of River Ice at the Mesoscale in the Freezing Period of the Yellow River
by Yu Deng, Juan Wang and Jiao Zhou
Appl. Sci. 2023, 13(18), 10553; https://doi.org/10.3390/app131810553 - 21 Sep 2023
Viewed by 1006
Abstract
Microscopic fabric changes are the main reason for the complex physical and material properties of Yellow River ice at the macroscale. To study the physical and material properties of Yellow River ice, Yellow River ice was taken as the research object, and definition [...] Read more.
Microscopic fabric changes are the main reason for the complex physical and material properties of Yellow River ice at the macroscale. To study the physical and material properties of Yellow River ice, Yellow River ice was taken as the research object, and definition and determination methods for the representative volume element (RVE) of the Yellow River ice based on its computed strength at the microscale were proposed. A micromechanical numerical model for Yellow River ice was built, the corresponding macromechanical properties were simulated, and the RVE size of the macromechanical strength of the Yellow River ice was determined to be 250 mm. The uniaxial compressive strength of river ice in different working conditions was simulated and analyzed, and the accuracy and effectiveness of the RVE of the calculated strength of river ice were verified. The research results provide a reference for analyzing the damage process of Yellow River ice at the microscopic level, providing a theoretical basis for studying the mechanism of Yellow River ice. Full article
(This article belongs to the Special Issue Deformation and Fracture Mechanics Analysis of Composite Materials)
Show Figures

Figure 1

Figure 1
<p>Schematic diagram of the random sample model of Yellow River ice: (<b>a</b>) the overall sample model of random river ice crystals; and (<b>b</b>) detailed figure of river ice grain boundaries.</p>
Full article ">Figure 2
<p>Schematic diagram of uniaxial compression loading of Yellow River ice.</p>
Full article ">Figure 3
<p>Schematic diagrams of the microstructures of the calculation samples: (<b>a</b>) 100 mm × 100 mm; (<b>b</b>) 168 mm × 168 mm; (<b>c</b>) 200 mm × 200 mm; and (<b>d</b>) 250 mm × 250 mm.</p>
Full article ">Figure 4
<p>Schematic of the coefficient of variation of the elastic modulus of river ice with the variation in calculation sample size.</p>
Full article ">Figure 5
<p>Schematic of the coefficient of variation of the compressive strength of river ice with the variation in sample size.</p>
Full article ">Figure 6
<p>Schematic of the relative error of elastic modulus between the calculation samples and the overall sample.</p>
Full article ">Figure 7
<p>Schematic of the relative error of compressive strength between the calculated samples and the overall sample.</p>
Full article ">Figure 8
<p>Schematic diagram of mesh size changes of RVE of Yellow River ice.</p>
Full article ">Figure 9
<p>Failure results of the Yellow River ice RVE under uniaxial compression.</p>
Full article ">Figure 10
<p>The crack propagation process of the Yellow River ice RVE in uniaxial compression. (<b>a</b>) Starting to crack; (<b>b</b>) crack development; (<b>c</b>) gradual destruction; and (<b>d</b>) final destruction.</p>
Full article ">Figure 11
<p>Stress–strain curve of RVE of Yellow River ice under uniaxial compression.</p>
Full article ">Figure 12
<p>Failure diagram of the RVE of the calculated strength of river ice in different average particle sizes. (<b>a</b>) The average particle size of the RVE is 5 mm; (<b>b</b>) the average particle size of the RVE is 7 mm; (<b>c</b>) the average particle size of the RVE is 10 mm; (<b>d</b>) the average particle size of the RVE is 15 mm; and (<b>e</b>) the average particle size of the RVE is 20 mm.</p>
Full article ">Figure 13
<p>Relationship curve between compressive strength and particle size.</p>
Full article ">Figure 14
<p>Relationship curve between compressive strength and reciprocal square root of particle size of RVE of Yellow River ice.</p>
Full article ">
12 pages, 4956 KiB  
Article
A Three-Dimensional Mesoscale Computational Simulation Method for Soil–Rock Mixtures Considering Grain Crushing
by Zhengsheng Li, Haiyang Yi, Yiming Xu, Gangqiang Li and Zhuang Zhuo
Appl. Sci. 2023, 13(18), 10552; https://doi.org/10.3390/app131810552 - 21 Sep 2023
Viewed by 903
Abstract
A new 3D mesoscale computational approach to simulate the mechanical behavior of soil–rock mixtures (SRMs) with the consideration of the grain-crushing process is proposed in this study. The proposed approach adopts a random SRM mesostructure generation algorithm to create a random SRM structure. [...] Read more.
A new 3D mesoscale computational approach to simulate the mechanical behavior of soil–rock mixtures (SRMs) with the consideration of the grain-crushing process is proposed in this study. The proposed approach adopts a random SRM mesostructure generation algorithm to create a random SRM structure. Based on the generated mesostructure, the whole simulation area is divided into discrete cubic numbers, and the mesostructure is transformed into a material distribution matrix as an input for the computational approach. The computational approach is achieved by the coupling calculation of Matlab and COMSOL. Theimulations are presented alongside experimental data to validate the efficiency of the proposed approach. The simulation results indicate that the proposed computational approach can accurately capture the mechanical behavior of SRMs under loadings. This method helps to predict the physical properties of SRMs and has promising applications in engineering. Full article
(This article belongs to the Section Earth Sciences)
Show Figures

Figure 1

Figure 1
<p>Flowchart of the mesostructure generation algorithm.</p>
Full article ">Figure 2
<p>Example of generating a rounded rock particle. (<b>a</b>) generating sphere boundary and random tangential sections; (<b>b</b>) selecting random vertices in the tangential section; (<b>c</b>) connecting generated vertices.</p>
Full article ">Figure 3
<p>Example of generating an angular rock particle. (<b>a</b>) generating sphere boundary and the first tetrahedron; (<b>b</b>) randomly generating anther vertex on the surface with the largest area; (<b>c</b>) connecting generated vertices.</p>
Full article ">Figure 4
<p>Example of the area discretization.</p>
Full article ">Figure 5
<p>Examples of SRM geometries with different rock content before and after discretization.</p>
Full article ">Figure 6
<p>Flowchart of the mesoscale computational approach.</p>
Full article ">Figure 7
<p>Evolution of the material distribution, von Mises stress, and accumulated damage of the uniaxial compressive strength.</p>
Full article ">Figure 8
<p>Comparison between the numerical simulation and experimental data of the triaxial compressive tests under different confining loadings.</p>
Full article ">
14 pages, 2626 KiB  
Article
Nitrogen Dioxide Gas Levels in TBM Tunnel Construction with Diesel Locomotives Based on Directive 2017/164/EU
by Hector Garcia-Gonzalez, Rafael Rodriguez and Marc Bascompta
Appl. Sci. 2023, 13(18), 10551; https://doi.org/10.3390/app131810551 - 21 Sep 2023
Cited by 1 | Viewed by 1095
Abstract
Directive 2017/164/EU proposed a drastic reduction of nitrogen monoxide (NO) and nitrogen dioxide (NO2) levels, thereby fortifying the health protection framework within the mining industry. Despite the commendable record of non-road emissions standards (Stage IV and V) in continuing to reduce [...] Read more.
Directive 2017/164/EU proposed a drastic reduction of nitrogen monoxide (NO) and nitrogen dioxide (NO2) levels, thereby fortifying the health protection framework within the mining industry. Despite the commendable record of non-road emissions standards (Stage IV and V) in continuing to reduce NOx emissions, concerns remain about compliance with the directive’s strict limits, particularly in demanding tunnels and mining fields. To illustrate this problem, this study undertakes a comprehensive assessment of the practical feasibility surrounding the implementation of these proposed limits in a 6.2 internal diameter tunnel-boring machine (TBM) tunnel constructed with Stage III emission locomotives. The results cast light upon the formidable challenges entailed in achieving strict compliance with the envisioned limits, with a substantial number of measurements notably surpassing these thresholds, primarily concerning NO2 emissions from Stage III engines. To address these challenges, this study highlights the key role of moving to Stage IV-V locomotives or introducing electric locomotives to effectively reduce NOx emissions, ensure compliance with the directive, and avoid delays in tunnel construction. Full article
(This article belongs to the Special Issue Urban Underground Engineering: Excavation, Monitoring, and Control)
Show Figures

Figure 1

Figure 1
<p>Trolex fixed gas monitoring station.</p>
Full article ">Figure 2
<p>Daily NO<sub>2</sub> averages and daily TBM ring production.</p>
Full article ">Figure 3
<p>Relation between number of rings installed and NO<sub>2</sub> (<b>A</b>). NO<sub>2</sub> emitted inside the tunnel vs. total rings installed (<b>B</b>).</p>
Full article ">Figure 4
<p>Percentage of the days with different NO<sub>2</sub> average concentrations.</p>
Full article ">Figure 5
<p>TBM performance (<b>A</b>), and NO<sub>2</sub> concentration under actual conditions (<b>B</b>).</p>
Full article ">Figure 6
<p>TBM performance (<b>A</b>) and NO<sub>2</sub> concentration to meet Directive 217/164’s requirements (<b>B</b>).</p>
Full article ">Figure 7
<p>TBM performance (<b>A</b>) and NO<sub>2</sub> concentration to meet Directive 217/164’s requirements (increasing locomotive speed and ventilation) (<b>B</b>).</p>
Full article ">Figure 8
<p>TBM performance (<b>A</b>) and NO<sub>2</sub> concentration with Stage IV or V locomotives (<b>B</b>).</p>
Full article ">
10 pages, 1248 KiB  
Article
Enhancing the Strength of Mine Residue Soil by Bioremediation Combined with Biopolymers
by António A. S. Correia, Joana B. Caldeira, Rita Branco and Paula V. Morais
Appl. Sci. 2023, 13(18), 10550; https://doi.org/10.3390/app131810550 - 21 Sep 2023
Cited by 4 | Viewed by 1080
Abstract
Traditional soil stabilization methods are usually associated with high energy consumption, carbon emissions, and long-term environmental impact. Recent developments have shown the potential use of bio-based techniques as eco-friendly alternatives for soil stabilization. The present work studies the effects of the addition of [...] Read more.
Traditional soil stabilization methods are usually associated with high energy consumption, carbon emissions, and long-term environmental impact. Recent developments have shown the potential use of bio-based techniques as eco-friendly alternatives for soil stabilization. The present work studies the effects of the addition of the biopolymers xanthan gum (XG) or carboxymethyl cellulose (CMC) to a mine residue soil, combined or not with biostimulation and bioaugmentation techniques, in terms of compressive stress–strain behavior. Unconfined compressive strength (UCS) tests were performed on previously disturbed samples (two cycles of percolation, extraction and homogenization) to evaluate if the biostimulation and bioremediation remain active in a real adverse scenario. The results allowed for us to conclude that both biopolymers, when applied individually (with a content of 1%), are effective stabilizers (CMC allows for unconfined compressive strength increases of up to 109%), showing better results for CMC than Portland cement. The biostimulation of the autochthonous community of the mine residue soil was revealed to be a non-effective technique, even when combined with the biopolymers. However, good results were observed when the bioaugmentation was combined with xanthan gum, with unconfined compressive strength improvements of up to 27%. The study revealed that these bio-based techniques are promising soil engineering techniques, offering environmentally friendly alternatives for sustainable soil stabilization and contributing to a greener and more sustainable future. Full article
(This article belongs to the Special Issue Sustainability in Geotechnics)
Show Figures

Figure 1

Figure 1
<p>UCS results—effect of the stabilizers applied individually (CMC = carboxymethyl cellulose; XG = xanthan gum).</p>
Full article ">Figure 2
<p>UCS results—effect of two different bio-techniques: (<b>a</b>) biostimulation (BS); (<b>b</b>) bioaugmentation (BA). (CMC = carboxymethyl cellulose; XG = xanthan gum).</p>
Full article ">Figure 3
<p>UCS results—the impact of the bio-techniques in terms of: (<b>a</b>) q<sub>u max</sub>; (<b>b</b>) E<sub>u 50</sub>. (CMC = carboxymethyl cellulose; XG = xanthan gum; BS = biostimulation; BA = bioaugmentation).</p>
Full article ">
17 pages, 2123 KiB  
Article
Evaluation of Antibacterial and Antiviral Compounds from Commiphora myrrha (T.Nees) Engl. Resin and Their Promising Application with Biochar
by Jin Woo Kim, Saerom Park, Young Whan Sung, Hak Jin Song, Sung Woo Yang, Jiwoo Han, Jeong Wook Jo, Im-Soon Lee, Sang Hyun Lee, Yong-Keun Choi and Hyung Joo Kim
Appl. Sci. 2023, 13(18), 10549; https://doi.org/10.3390/app131810549 - 21 Sep 2023
Viewed by 1824
Abstract
Commiphora myrrha (T.Nees) Engl. resin extracts were prepared via immersion in extraction solvents (hot water, DMSO, hexane, ethanol, and methanol) which have various physical properties, such as different polarity and dielectric constant values. Methanolic C. myrrha (T.Nees) Engl. resin extracts showed broad antibacterial [...] Read more.
Commiphora myrrha (T.Nees) Engl. resin extracts were prepared via immersion in extraction solvents (hot water, DMSO, hexane, ethanol, and methanol) which have various physical properties, such as different polarity and dielectric constant values. Methanolic C. myrrha (T.Nees) Engl. resin extracts showed broad antibacterial activity against isolated airborne bacteria. All methanolic C. myrrha (T.Nees) Engl. resin extracts were analyzed using GC-MS and Furanoeudesma-1,3-diene and curzerene were found as the main terpenoids. In addition, the methanolic C. myrrha (T.Nees) Engl. resin extracts were found to have antiviral activity (81.2% viral RNA inhibition) against the H1N1 influenza virus. Biochars (wood powder- and rice husk-derived) coated with C. myrrha (T.Nees) Engl. resin extracts also showed antiviral activity (22.6% and 24.3% viral RNA inhibition) due to the adsorption of terpenoids onto biochar. C. myrrha (T.Nees) Engl. resin extract using methanol as the extraction solvent is a promising agent with antibacterial and antiviral efficacy that can be utilized as a novel material via adsorption onto biochar for air filtration processes, cosmetics, fertilizers, drug delivery, and corrosion inhibition. Full article
Show Figures

Figure 1

Figure 1
<p>Polyphenol concentrations in <span class="html-italic">C. myrrha</span> (T.Nees) Engl. resin extracts analyzed using HPLC. Conditions: 254 nm; YMC-Triart C18 column; under gradient condition. The experiment was conducted in triplicate and the error bars represent the 95% confidence interval. A, B, C, D, E, F, and G indicate group classified from Tukey’s test. The same letter means that there is no significant difference between the data.</p>
Full article ">Figure 2
<p>Cytotoxic (<b>A</b>) and anti-inflammatory (<b>B</b>) effects of <span class="html-italic">C. myrrha</span> (T.Nees) Engl. resin extracts in methanol (<span class="html-italic">w</span>/<span class="html-italic">o</span> LPS: no lipopolysaccharide and control: 0% of <span class="html-italic">C. myrrha</span> resin extracts). Conditions: RAW 264.7 cell with <span class="html-italic">C. myrrha</span> (T.Nees) Engl. extract at a concentration of 0.08–10% (<span class="html-italic">v</span>/<span class="html-italic">v</span>) for 48 h at 37 °C in a CO<sub>2</sub> incubator; NR assay (<b>A</b>); and NO production (<b>B</b>). The experiment was conducted in triplicate and the error bars represent the 95% confidence interval. AB, A, B, C, and D in (<b>A</b>) and A, B, C, D, E, F, and G in (<b>B</b>) indicate group classified from Tukey’s test. The same letter means that there is no significant difference between the data.</p>
Full article ">Figure 3
<p>Antiviral activity of methanol as a control, <span class="html-italic">A. bidentata</span> Blume root extract as a positive control, and <span class="html-italic">C. myrrha</span> (T.Nees) Engl. resin extract using methanol against the H1N1 influenza virus. Conditions: H1N1 influenza virus (0.1 of MOI) in 1.5 mL of aqueous solution with 100 µL of methanol and <span class="html-italic">C. myrrha</span> (T.Nees) Engl. resin extracts in methanol; qRT-PCR. The experiment was conducted in triplicate and the error bars represent the 95% confidence interval. A, B, and C indicate group classified from Tukey’s test. The same letter means that there is no significant difference between the data.</p>
Full article ">Figure 4
<p>Concentration of terpenoids (i.e., furanoeudesma-1,3-diene and curzerene) in solution before and after adsorption of <span class="html-italic">C. myrrha</span> (T.Nees) Engl. resin extracts onto RH-BC. Conditions: 50 mg of biochar was mixed with 1 mL of the extract solution in a shaking incubator at 25 °C for 24 h at 120 rpm and dried at 60 °C for 24 h. The experiment was conducted in triplicate and the error bars represent the 95% confidence interval. A, B, C and D indicate group classified from Tukey’s test. The same letter means that there is no significant difference between the data.</p>
Full article ">Figure 5
<p>Antiviral activity of concentration dependence of terpenoids (furanoeudesma-1,3-diene and curzerene) against the H1N1 influenza virus. Conditions: H1N1 influenza virus (0.1 of MOI) in 1.5 mL of aqueous solution ranging from 10–90 µL/mL. The experiment was conducted in triplicate and the error bars represent the 95% confidence interval. AB, A, B, C, and D and a, b, c, and d indicate group classified from Tukey’s test. The same letter means that there is no significant difference between the data.</p>
Full article ">Figure 6
<p>FTIR spectra of the RH-BCs before and after <span class="html-italic">C. myrrha</span> (T.Nees) Engl. resin extract adsorption. The arrow means the changes (i.e., increase or decrease) of peaks after adsorption.</p>
Full article ">Figure 7
<p>XPS spectra of raw RH-BC (not coated) and <span class="html-italic">C. myrrha</span> (T.Nees) Engl. resin extract-coated RH-BC (coated) at various temperatures (25 °C, 50 °C, 100 °C, and 200 °C) for adsorption stability evaluation.</p>
Full article ">
17 pages, 7430 KiB  
Article
Temporal Resolution of Acoustic Process Emissions for Monitoring Joint Gap Formation in Laser Beam Butt Welding
by Sayako Kodera, Leander Schmidt, Florian Römer, Klaus Schricker, Saichand Gourishetti, David Böttger, Tanja Krüger, András Kátai, Benjamin Straß, Bernd Wolter and Jean Pierre Bergmann
Appl. Sci. 2023, 13(18), 10548; https://doi.org/10.3390/app131810548 - 21 Sep 2023
Viewed by 1274
Abstract
With the increasing power and speed of laser welding, in-process monitoring has become even more crucial to ensure process stability and weld quality. Due to its low cost and installation flexibility, acoustic process monitoring is a promising method and has demonstrated its effectiveness. [...] Read more.
With the increasing power and speed of laser welding, in-process monitoring has become even more crucial to ensure process stability and weld quality. Due to its low cost and installation flexibility, acoustic process monitoring is a promising method and has demonstrated its effectiveness. Although its feasibility has been the focus of existing studies, the temporal resolution of acoustic emissions (AE) has not yet been addressed despite its utmost importance for realizing real-time systems. Aiming to provide a benchmark for further development, this study investigates the relationship between duration and informativeness of AE signals during high-power (3.5 kW) and high-speed (12 m/min) laser beam butt welding. Specifically, the informativeness of AE signals is evaluated based on the accuracy of detecting and quantifying joint gaps for various time windows of signals, yielding numerical comparison. The obtained results show that signals can be shortened up to a certain point without sacrificing their informativeness, encouraging the optimization of the signal duration. Our results also suggest that large gaps (>0.3mm) induce unique signal characteristics in AE, which are clearly identifiable from 1 ms signal segments, equivalent to 0.2mm weld seam. Full article
(This article belongs to the Special Issue Advanced Laser Machining Technology)
Show Figures

Figure 1

Figure 1
<p>Specimen configuration including patch segmentation according to [<a href="#B14-applsci-13-10548" class="html-bibr">14</a>]: (<b>a</b>) schematic illustration, (<b>b</b>) the photograph of an exemplary pre-welding sample, (<b>c</b>) the photograph of an exemplary post-welding sample. The gap size of (<b>b</b>,<b>c</b>) is <math display="inline"><semantics> <mrow> <mn>0.2</mn> </mrow> </semantics></math> <math display="inline"><semantics> <mi mathvariant="normal">m</mi> </semantics></math><math display="inline"><semantics> <mi mathvariant="normal">m</mi> </semantics></math>.</p>
Full article ">Figure 2
<p>Experimental setup: (<b>a</b>) schematic illustration and (<b>b</b>) actual photograph of the set up.</p>
Full article ">Figure 3
<p>Exemplary measurement results of a specimen with <math display="inline"><semantics> <mrow> <mn>0.3</mn> </mrow> </semantics></math> <math display="inline"><semantics> <mi mathvariant="normal">m</mi> </semantics></math><math display="inline"><semantics> <mi mathvariant="normal">m</mi> </semantics></math> gaps. Top row (<b>a</b>,<b>b</b>): the spectrograms of the structure-borne sensor signal placed at the beginning of the specimen (SB1), bottom row (<b>c</b>,<b>d</b>): the spectrograms of the airborne sensor signal (AB). For both rows, the entire frequency range (approximately <math display="inline"><semantics> <mrow> <mn>3.125</mn> </mrow> </semantics></math> <math display="inline"><semantics> <mi mathvariant="normal">M</mi> </semantics></math><math display="inline"><semantics> <mi>Hz</mi> </semantics></math>) is shown in the left column, whereas the lower frequency range (&lt;760<math display="inline"><semantics> <mi mathvariant="normal">k</mi> </semantics></math><math display="inline"><semantics> <mi>Hz</mi> </semantics></math>) is presented in the right column. Here, the measurement data up to <math display="inline"><semantics> <mrow> <mn>1.3</mn> </mrow> </semantics></math> <math display="inline"><semantics> <mi mathvariant="normal">s</mi> </semantics></math> are shown for the sake of presentation.</p>
Full article ">Figure 4
<p>Illustration of the validation procedure. (1) Signals are segmented with the given duration <span class="html-italic">T</span> in the time domain. (2) The segments are preprocessed in the frequency domain. (3) The preprocessed segments are clustered via NCA. (4) The test segments are classified via kNN.</p>
Full article ">Figure 5
<p>Illustration of how the gap detection accuracy changes depending on the segment duration <span class="html-italic">T</span>. The equivalent weld seam length is provided on top (in purple), which indicates that the weld seam is progressed for <math display="inline"><semantics> <mrow> <mn>0.2</mn> </mrow> </semantics></math> <math display="inline"><semantics> <mi mathvariant="normal">m</mi> </semantics></math><math display="inline"><semantics> <mi mathvariant="normal">m</mi> </semantics></math> in 1 <math display="inline"><semantics> <mi mathvariant="normal">m</mi> </semantics></math><math display="inline"><semantics> <mi mathvariant="normal">s</mi> </semantics></math>. The results are obtained by conducting repeated learning-testing validations for 50 iterations based on Scenario I, where the segments are classified into three classes (Zero Gap, Gap, and Noise). Top row (<b>a</b>): average accuracy with error bars (standard deviation) and bottom row (<b>b</b>): average confusion matrices for selected segment duration. The channels mentioned in the results are the structure-borne ultrasound sensor at the beginning (SB1) and the airborne ultrasound sensor (AB).</p>
Full article ">Figure 6
<p>Exemplary illustration of segments separability for different segment durations <span class="html-italic">T</span>. Since the dimension of the input vectors <math display="inline"><semantics> <mi mathvariant="bold">x</mi> </semantics></math> <math display="inline"><semantics> <mrow> <mo>∈</mo> <msup> <mrow> <mi mathvariant="double-struck">R</mi> </mrow> <mn>2048</mn> </msup> </mrow> </semantics></math> is reduced to 2 (=number of classes minus one) after NCA clustering, the results shown here are the output vectors <math display="inline"><semantics> <mrow> <mi mathvariant="bold">y</mi> <mo>=</mo> <msup> <mfenced separators="" open="[" close="]"> <msub> <mi>c</mi> <mn>1</mn> </msub> <mo>,</mo> <msub> <mi>c</mi> <mn>2</mn> </msub> </mfenced> <mo form="prefix">T</mo> </msup> </mrow> </semantics></math><math display="inline"><semantics> <mrow> <mo>∈</mo> <msup> <mrow> <mi mathvariant="double-struck">R</mi> </mrow> <mn>2</mn> </msup> </mrow> </semantics></math> in two dimensional images. The cluster regions are represented by different colors (purple for Zero Gap, blue for Gap and yellow for Noise). For exemplary purpose, these results are obtained by running a single training-test split for each duration. The channels mentioned in the results are the structure-borne ultrasound sensor at the beginning (SB1) and the airborne ultrasound sensor (AB).</p>
Full article ">Figure 7
<p>Illustration of how the classification accuracy of gap size changes depending on the segment duration <span class="html-italic">T</span>. The equivalent weld seam length is provided on top (in purple), which indicates that weld seam is progressed for <math display="inline"><semantics> <mrow> <mn>0.2</mn> </mrow> </semantics></math> <math display="inline"><semantics> <mi mathvariant="normal">m</mi> </semantics></math><math display="inline"><semantics> <mi mathvariant="normal">m</mi> </semantics></math> in 1 <math display="inline"><semantics> <mi mathvariant="normal">m</mi> </semantics></math><math display="inline"><semantics> <mi mathvariant="normal">s</mi> </semantics></math>. The results are obtained by conducting repeated learning-testing validations for 50 iterations based on Scenario II, where the segments are classified into five classes (Zero Gap, Gap 0.1, Gap 0.2, Gap 0.3 and Noise). Top row (<b>a</b>): average accuracy with error bars (standard deviation) and bottom row (<b>b</b>): average confusion matrices for selected segment duration. The channels mentioned in the results are the structure-borne ultrasound sensor at the beginning (SB1) and the airborne ultrasound sensor (AB).</p>
Full article ">Figure 8
<p>Average relative recall with regard to the Zero Gap class (top row (<b>a</b>)) and the Noise class (bottom row (<b>b</b>)) over varying duration <span class="html-italic">T</span> after 50 realizations. The results show how easy (high recall) or difficult (low recall) it is to distinguish between the reference class and another class. This serves as an indicator of how separable the cluster of the reference class is from that of another class. The results show how the relative recall changes depending on the segment duration for each channel: SB1 is a structure-borne sensor at the start of a specimen, and AB is an airborne sensor.</p>
Full article ">
14 pages, 3399 KiB  
Article
State of Charge Estimation for Power Battery Using Improved Extended Kalman Filter Method Based on Neural Network
by Xiaoyu Liu and Xiang Zhang
Appl. Sci. 2023, 13(18), 10547; https://doi.org/10.3390/app131810547 - 21 Sep 2023
Cited by 1 | Viewed by 1026
Abstract
In order to enhance the accuracy of the traditional extended Kalman filter (EKF) algorithm in the estimation of the state of charge (SoC) of power batteries, we first derived the state space equation and measurement equation of lithium power batteries based on the [...] Read more.
In order to enhance the accuracy of the traditional extended Kalman filter (EKF) algorithm in the estimation of the state of charge (SoC) of power batteries, we first derived the state space equation and measurement equation of lithium power batteries based on the Thevenin battery model and the modified Ampere-Hour integral algorithm. Then, the basic principles of EKF, backpropagation neural networks (BPNNs), and a biogeography-based optimization (BBO) algorithm were analyzed, and the arc curve mobility model was used to improve the global search ability of the BBO algorithm. By combining these three algorithms, this paper proposes a BP neural network method based on the BBO algorithm. This method uses the BBO algorithm to optimize the incipient weight and threshold of the BP neural network and uses this improved neural network to modify the estimated value of the extended Kalman filter algorithm (BBOBP-EKF). Finally, the BBOBP-EKF algorithm, the extended Kalman filter algorithm based on the BP neural network (BP-EKF), and the EKF algorithm are used to estimate the error value of the SOC of a power battery, and according to the experimental data, it was confirmed that the proposed BBOBP-EKF algorithm has been improved compared to other algorithms with respect to each error index term, in which the maximum error is 1% less than that of the BP-EKF algorithm and 2.4% less than that of the EKF algorithm, the minimum error is also the smallest, and the estimation accuracy is improved compared to the traditional algorithms. Full article
Show Figures

Figure 1

Figure 1
<p>Thevenin battery model.</p>
Full article ">Figure 2
<p>OCV-SoC fitting curve of battery.</p>
Full article ">Figure 3
<p>EKF algorithm flowchart.</p>
Full article ">Figure 4
<p>Specific structure and parameter diagram of BP neural network.</p>
Full article ">Figure 5
<p>Linear/Arc curve mobility model diagram.</p>
Full article ">Figure 6
<p>Species migration map for habitats and maximum species count of 50.</p>
Full article ">Figure 7
<p>BBOBP-EKF algorithm estimation of battery SoC flowchart.</p>
Full article ">Figure 8
<p>Comparison of SoC accuracy.</p>
Full article ">Figure 9
<p>Comparison of different algorithms’ errors.</p>
Full article ">Figure 10
<p>Comparison of absolute values of errors for different algorithms.</p>
Full article ">
13 pages, 1990 KiB  
Article
The Association between BMI, Days Spent in Hospital, Blood Loss, Surgery Time and Polytrauma Pelvic Fracture—A Retrospective Analysis of 76 Patients
by Tomasz Pielak, Rafał Wójcicki, Piotr Walus, Adam Jabłoński, Michał Wiciński, Przemysław Jasiewicz, Bartłomiej Małkowski, Szymon Nowak and Jan Zabrzyński
Appl. Sci. 2023, 13(18), 10546; https://doi.org/10.3390/app131810546 - 21 Sep 2023
Viewed by 1079
Abstract
Objective: The objective of this study was to investigate the association between BMI, days spent in hospital, blood loss, and surgery time in patients who suffered from isolated pelvic fractures and pelvic fractures with concomitant injuries (polytrauma patients). Methods: This study included 76 [...] Read more.
Objective: The objective of this study was to investigate the association between BMI, days spent in hospital, blood loss, and surgery time in patients who suffered from isolated pelvic fractures and pelvic fractures with concomitant injuries (polytrauma patients). Methods: This study included 76 consecutive patients who were admitted for pelvic ring fracture surgery between 2017 and 2022. The inclusion criteria were pelvic fractures and indications for operative treatment (LC II and III, APC II and III, and VS). The exclusion criteria were non-operative treatment for pelvic ring fractures, acetabular fractures and fractures requiring primary total hip arthroplasty (THA), and periprosthetic acetabular fractures. Demographic data were collected, including age (in years), sex, type of fracture according to Young–Burgess, date of injury and surgery, surgical approach and stabilization methods, mechanism of trauma, concomitant trauma in other regions, body mass index (BMI), blood transfusions, number of days spent in the hospital, and surgery duration. Results: Patients who suffered from a pelvic ring injury with concomitant injuries had a significantly greater amount of blood units transferred (1.02 units vs. 0.55 units), and the length of hospital stay was also longer compared to the mean results (5.84 days vs. 3.58 days), p = 0.01 and p = 0.001, respectively. Moreover, patients with a higher BMI had more frequent APC II and APC III fractures (p = 0.012). Conclusions: This study demonstrates that polytrauma patients who suffered from pelvic ring injury are, indeed, at risk of blood transfusion in terms of greater units of blood and a longer duration of hospital stay. Moreover, BMI has an impact on pelvic ring fracture morphology. However, there is no doubt that there is an absolute need for further studies and investigations to provide better overall management of polytrauma patients with pelvic fractures. Full article
Show Figures

Figure 1

Figure 1
<p>(<b>A</b>) Comparison of BMI between male and female subgroups. (<b>B</b>) Comparison of surgery duration between male and female subgroups. (<b>C</b>) Comparison of blood transfusion between male and female subgroups. (<b>D</b>) Comparison of length of hospital stay between male and female subgroups. * <span class="html-italic">p</span>-value &lt; 0.005.</p>
Full article ">Figure 2
<p>(<b>A</b>) Comparison of BMI according to Y–B subdivisions. (<b>B</b>) Comparison of surgery duration according to Y–B subdivisions. (<b>C</b>) Comparison of length of hospital stay according to Y–B subdivisions. (<b>D</b>) Comparison of blood transfusion according to Y–B subdivisions. * <span class="html-italic">p</span>-value &lt; 0.005.</p>
Full article ">Figure 3
<p>(<b>A</b>) Correlation between surgery duration and BMI. (<b>B</b>) Correlation between blood transfusion and BMI. (<b>C</b>) Correlation between length of hospital stay and BMI.</p>
Full article ">Figure 4
<p>(<b>A</b>) Comparison of BMI in various mechanism of injury subgroups. (<b>B</b>) Comparison of length of hospital stay in various mechanism of injury subgroups. (<b>C</b>) Comparison of surgery duration in various mechanism of injury subgroups. (<b>D</b>) Comparison of blood transfusion in various mechanism of injury subgroups.</p>
Full article ">Figure 5
<p>(<b>A</b>) Comparison of BMI in pelvic fractures with or without polytrauma. (<b>B</b>) Comparison of length of hospital stay in pelvic fractures with or without polytrauma. (<b>C</b>) Comparison of blood transfusion in pelvic fractures with or without polytrauma. (<b>D</b>) Comparison of surgery duration in pelvic fractures with or without polytrauma. * <span class="html-italic">p</span>-value &lt; 0.005.</p>
Full article ">Chart 1
<p>A flow diagram of patients included in the study and interventions.</p>
Full article ">
24 pages, 2192 KiB  
Article
Multi-Scale Concurrent Topology Optimization Based on BESO, Implemented in MATLAB
by Georgios Kazakis and Nikos D. Lagaros
Appl. Sci. 2023, 13(18), 10545; https://doi.org/10.3390/app131810545 - 21 Sep 2023
Cited by 1 | Viewed by 1346
Abstract
In multi-scale topology optimization methods, the analysis encompasses two distinct scales: the macro-scale and the micro-scale. The macro-scale refers to the overall size and dimensions of the structural domain being studied, while the micro-scale pertains to the periodic unit cell that constitutes the [...] Read more.
In multi-scale topology optimization methods, the analysis encompasses two distinct scales: the macro-scale and the micro-scale. The macro-scale refers to the overall size and dimensions of the structural domain being studied, while the micro-scale pertains to the periodic unit cell that constitutes the macro-scale. This unit cell represents the entire structure or component targeted for optimization. The primary objective of this research is to present a simplified MATLAB code that addresses the multi-scale concurrent topology optimization challenge. This involves simultaneously optimizing both the macro-scale and micro-scale aspects, taking into account their interactions and interdependencies. To achieve this goal, the proposed approach leverages the Bi-directional Evolutionary Structural Optimization (BESO) method. The formulation introduced in this study accommodates both cellular and composite materials, dealing with both separate volume constraints and the utilization of a single volume constraint. By offering this simplified formulation and harnessing the capabilities of the multi-scale approach, the research aims to provide valuable insights into the concurrent optimization of macro- and micro-scales. This advancement contributes to the field of topology optimization and enhances its applications across various engineering disciplines. Full article
(This article belongs to the Section Mechanical Engineering)
Show Figures

Figure 1

Figure 1
<p>Initial geometries of the periodic unit cell. (<b>a</b>) Initial geometry of 2D periodic unit cell. (<b>b</b>) Initial geometry of 3D periodic unit cell.</p>
Full article ">Figure 2
<p>The 2D test cases. (<b>a</b>) Cantilever beam with fixed hole. (<b>b</b>) L-Shape. (<b>c</b>) Long cantilever beam.</p>
Full article ">Figure 3
<p>The 2D test cases—Resulting geometries for both structural (macro-scale) and periodic unit cell (micro-scale).</p>
Full article ">Figure 4
<p>3D test cases.</p>
Full article ">Figure 4 Cont.
<p>3D test cases.</p>
Full article ">Figure 5
<p>The 3D test cases—Resulting geometries for both structural (macro-scale) and periodic unit cell (micro-scale).</p>
Full article ">Figure 5 Cont.
<p>The 3D test cases—Resulting geometries for both structural (macro-scale) and periodic unit cell (micro-scale).</p>
Full article ">Figure 6
<p>Cantilever beam test case.</p>
Full article ">Figure 7
<p>Resulting optimal geometries and homogenized elasticity tensor for all three formulations.</p>
Full article ">Figure 8
<p>Evolution histories of the mean compliance and total volume fraction for the three formulations.</p>
Full article ">Figure 9
<p>3D MBB beam test case.</p>
Full article ">Figure 10
<p>Resulting optimal geometries for all three formulations.</p>
Full article ">
20 pages, 5424 KiB  
Article
A Multivariate Model of Drinking Water Quality Based on Regular Monitoring of Radioactivity and Chemical Composition
by Cecilia Ionela Tăban, Ana Maria Benedek, Mihaela Stoia, Maria Denisa Cocîrlea and Simona Oancea
Appl. Sci. 2023, 13(18), 10544; https://doi.org/10.3390/app131810544 - 21 Sep 2023
Cited by 2 | Viewed by 1137
Abstract
From a public health perspective, the monitoring of water quality intended for human consumption belongs to the operational and audit management of the supply zones. Our study explores the spatial and temporal patterns of the parameters of drinking water in Sibiu County, Romania. [...] Read more.
From a public health perspective, the monitoring of water quality intended for human consumption belongs to the operational and audit management of the supply zones. Our study explores the spatial and temporal patterns of the parameters of drinking water in Sibiu County, Romania. We related the relevant physical-chemical parameters (ammonia, chlorine, nitrates, Al, Fe, Pb, Cd, Mn, pH, conductivity, turbidity, and oxidizability) and radioactivity (gross alpha activity, gross beta activity, and radon-222 content) from a 5-year survey to the water source (surface water and groundwater, which may be of subsurface or deep origin), space (sampling locality) and time (sampling month and year). We conducted a combined evaluation using the generalized linear mixed models (GLMMs), Pearson correlation analysis of the physical-chemical parameter, multivariate linear redundancy analysis (RDA), t-value biplots construction, and co-inertia analysis. The obtained regional model shows that the source, locality, and month of sampling are significant factors in physical-chemical parameters’ variation. Fe and turbidity have significantly higher values in surface water, and nitrates and conductivity in groundwater. The highest values are recorded in January (nitrates), March (Cl, ammonia, pH) and August (Fe, turbidity). The RDA ordination diagram illustrates the localities with particular or similar characteristics of drinking water, two of which (rural sources) being of concern. The water source is the best predictor for radioactivity, which increases from surface to ground. The gross alpha and beta activities are significantly and positively correlated, and are both correlated with conductivity. In addition, the gross alpha activity is positively correlated with nitrates and negatively with pH, while the gross beta activity is positively correlated with Mn and negatively with Fe; these relationships are also revealed by the co-inertia analysis. In conclusion, our model using multilevel statistical techniques illustrates a potential approach to short-term dynamics of water quality which will be useful to local authorities. Full article
(This article belongs to the Special Issue Sustainable Environment and Water Resource Management)
Show Figures

Figure 1

Figure 1
<p>Location of sample collection points and water sources.</p>
Full article ">Figure 2
<p>Box-and-whisker plots of gross alpha activity (<b>a</b>) and gross beta activity (<b>b</b>) as a function of water source (Surf—surface water, Ground—groundwater), within the 2017–2021 interval. The circles represent outlier observations.</p>
Full article ">Figure 3
<p>The biplot of redundancy analysis (RDA) relating the three radioactivity parameters (radon-222, gross alpha and beta activity) to the water sources. Deep—deep water source, SSurf—subsurface water source, Surf—surface water source. The first two constrained axes are illustrated, but the second axis is not significant.</p>
Full article ">Figure 4
<p>The t-value biplots for the radioactivity parameters (radon-222, gross alpha and beta activities) of surface water (Surf) in relation to deep water Deep (<b>a</b>) and subsurface water SSurf (<b>b</b>). The pink circle delimits the ordination space for significant positive response to the considered variable, while the blue circle marks the negative response.</p>
Full article ">Figure 5
<p>The biplot of redundancy analysis (RDA) relating the gross alpha and beta activity parameters to the localities and the surface (Surf) and groundwater (Ground) sources. The names of localities are written in full. The first two constrained axes are illustrated, but the second axis is not significant.</p>
Full article ">Figure 6
<p>The biplot of redundancy analysis (RDA) relating the physical and chemical parameters to surface (Surf) and groundwater (Ground) sources and sampling month. Months are abbreviated by the first three letters. The first two constrained axes are illustrated, but the second axis is not significant.</p>
Full article ">Figure 7
<p>The t-value biplots for the physical and chemical parameters in relation to surface (Surf) and groundwater (Ground). The pink circle delimits the ordination space for significant positive response to the considered variable, while the blue circle marks the negative response.</p>
Full article ">Figure 8
<p>The biplot of redundancy analysis (RDA) relating the physical and chemical parameters to the localities. The names of localities are written in full. The first two constrained axes are illustrated, both being significant.</p>
Full article ">Figure 9
<p>Biplot of the co-inertia analysis between radioactivity (gross alpha and gross beta activities) and physical-chemical parameters.</p>
Full article ">
15 pages, 5590 KiB  
Article
The Change in the Shape Characteristics of the Plastic Zone in the Surrounding Rock of an Auxiliary Retracement Channel and a Reasonable Channel Spacing Determination Method
by Xu Gao, Chenyi Liu, Hongkai Zhang, Kunlin Yang, Yingjie Hu and Xiaofei Guo
Appl. Sci. 2023, 13(18), 10543; https://doi.org/10.3390/app131810543 - 21 Sep 2023
Viewed by 834
Abstract
In underground coal mines, the stability of the retracement channel in the surrounding rock is crucial for the safe and efficient retracement of the equipment and to guarantee the continuity of the retracement work. To reveal the deformation and damage mechanism of the [...] Read more.
In underground coal mines, the stability of the retracement channel in the surrounding rock is crucial for the safe and efficient retracement of the equipment and to guarantee the continuity of the retracement work. To reveal the deformation and damage mechanism of the surrounding rock of an auxiliary retracement channel (ARC) and the determination method for the reasonable spacing of two retracement channels during the end of the mining period, the deviatoric stress field in front of the working face and the change in the shape characteristics of the plastic zone in the ARC are investigated in this paper. The formation of ultimate stress equilibrium, high deviatoric stress, decreasing deviatoric stress, and low deviatoric stress environments in front of the working face during the end of mining occur successively, and the different deviatoric stress environments are the main reasons for the different shape characteristics of the plastic zone in the surrounding rock. The changes in the shape characteristics of the plastic zone correspond to the changes in the shape characteristics in the zone with deviatoric stress and exhibit the following order: full plastic deformation zone, butterfly-shaped zone, elliptical zone, and circular plastic zone. A reasonable spacing determination method for the two retracement channels is proposed: the ARC is arranged in the decreasing deviatoric stress environment, where the surrounding rock plastic zone shape is elliptical, and the ARC is relatively stable. Based on this research result, the spacing of the double retracement channels at the Lijiahao 22-116 working face was determined to be 25 m, which achieved a positive application effect and allowed the safe and efficient retracement of the working face equipment. Full article
(This article belongs to the Special Issue Advanced Methodology and Analysis in Coal Mine Gas Control)
Show Figures

Figure 1

Figure 1
<p>Schematic diagram of the 22-116 working face layout.</p>
Full article ">Figure 2
<p>Stratigraphic column of the 22-116 working face.</p>
Full article ">Figure 3
<p>Computational model of the surrounding rock plastic zone in a bidirectional, nonuniform stress circular roadway.</p>
Full article ">Figure 4
<p>Evolution of the plastic zone calculated by simulation.</p>
Full article ">Figure 5
<p>Deflection of the butterfly-shaped plastic zone in the roadway surrounding rock.</p>
Full article ">Figure 6
<p>Migration law of the mining stress field in front of the working face.</p>
Full article ">Figure 7
<p>Morphological characteristics of the plastic zone in the auxiliary retracement channel with different spacings.</p>
Full article ">Figure 8
<p>Numerical simulation model and mechanical parameters of each coal and rock stratum.</p>
Full article ">Figure 9
<p>Distribution of the 0~70 m mining stress field in front of the working face.</p>
Full article ">Figure 10
<p>Shape characteristics of the plastic zone in the auxiliary retracement channel with different protective coal pillar widths.</p>
Full article ">Figure 11
<p>Reasonable spacing determination method.</p>
Full article ">Figure 12
<p>Surface displacement changes at 17 monitoring points in the auxiliary retracement channel.</p>
Full article ">
37 pages, 12290 KiB  
Article
Evaluating the Time-Dependent Behavior of Deeply Buried Tunnels in Soft Rock Environments and Relevant Measures Guaranteeing Their Long-Term Stability
by Wadslin Frenelus and Hui Peng
Appl. Sci. 2023, 13(18), 10542; https://doi.org/10.3390/app131810542 - 21 Sep 2023
Cited by 3 | Viewed by 1787
Abstract
The time-dependent behavior and long-term stability of deep-buried tunnels in soft rocks have received lots of considerations in tunnel engineering and allied sciences. To better explore and deepen the engineering application of rock creep, extensive research studies are still needed, although fruitful outcomes [...] Read more.
The time-dependent behavior and long-term stability of deep-buried tunnels in soft rocks have received lots of considerations in tunnel engineering and allied sciences. To better explore and deepen the engineering application of rock creep, extensive research studies are still needed, although fruitful outcomes have already been obtained in many related investigations. In this article, the Weilai Tunnel in China’s Guangxi province is studied, taking its host rocks as the main research object. In fact, aiming at forecasting the time-varying deformation of this tunnel, a novel elasto-visco-plastic creep constitutive model with two variants is proposed, by exploiting the typical complex load–unload process of rock excavation. The model is well validated, and good agreements are found with the relevant experimental data. Moreover, the time-dependent deformation rules are properly established for the surrounding rocks, by designing two new closed-form solutions based on the proposed creep model and the Hoek–Brown criterion. To investigate the effects of the major creep parameters and the geological strength index (GSI) of the surrounding rocks on the time-dependent trend of the tunnel, an in-depth parametric study is carried out. It is shown that the convergence deformation of the surrounding rocks is remarkably influenced by the GSI and creep parameters. The convergence deformations calculated from the closed-form solutions conform well to the on-site monitoring data. In only 27 days after excavation, the creep deformation of the Weilai tunnel overtakes 400 mm, which is enormous. To guarantee the long-term stability of this tunnel, a robust support scheme and its long-term monitoring with appropriate remote sensors are strongly suggested. Full article
(This article belongs to the Special Issue High-Reliability Structures and Materials in Civil Engineering)
Show Figures

Figure 1

Figure 1
<p>Location map of the Weilai Tunnel.</p>
Full article ">Figure 2
<p>The main lithology along the tunnel route.</p>
Full article ">Figure 3
<p>Details of excavation: (<b>a</b>) excavated section; (<b>b</b>) a view of the tunnel portal.</p>
Full article ">Figure 4
<p>Staged load–unload of sandstone samples under a confining pressure of 4 MPa.</p>
Full article ">Figure 5
<p>Creep curve of rocks subjected to cyclic load–unload.</p>
Full article ">Figure 6
<p>Mechanical diagram of the proposed visco-elasto-plastic creep model.</p>
Full article ">Figure 7
<p>Model curve compared to experimental data for sandstone under a deviatoric stress of 11.99 MPa.</p>
Full article ">Figure 8
<p>Model curve compared to experimental data for sandstone under a deviatoric stress of 14.99 MPa.</p>
Full article ">Figure 9
<p>Model curve compared to experimental data for sandstone under a deviatoric stress of 17.99 MPa.</p>
Full article ">Figure 10
<p>Model curve compared to experimental data for sandstone under a deviatoric stress of 20.97 MPa.</p>
Full article ">Figure 11
<p>Model curve compared to experimental data for sandstone under a deviatoric stress of 23.98 MPa.</p>
Full article ">Figure 12
<p>Viscoplastic strain of the model considering different damage index values in dry states.</p>
Full article ">Figure 13
<p>Influence of damage index on the surrounding rocks in dry states.</p>
Full article ">Figure 14
<p>Mechanical model influenced by pore water pressure.</p>
Full article ">Figure 15
<p>Creep strain of sandstone affected by pore water pressure (the deviatoric stress is 11.99 MPa).</p>
Full article ">Figure 16
<p>Creep strain of sandstone affected by pore water pressure (the deviatoric stress is 17.99 MPa).</p>
Full article ">Figure 17
<p>Creep strain of sandstone affected by pore water pressure (the deviatoric stress is 23.98 MPa).</p>
Full article ">Figure 18
<p>Viscoplastic strain of the model considering different damage index values in wet states.</p>
Full article ">Figure 19
<p>Influence of damage index on the surrounding rocks in wet states.</p>
Full article ">Figure 20
<p>Adopted mechanical model of the studied tunnel.</p>
Full article ">Figure 21
<p>Time-dependent deformation of the tunnel considering different values of G<sub>1</sub> and GSI.</p>
Full article ">Figure 22
<p>Time-dependent deformation of the tunnel considering different values of G<sub>2</sub> and GSI.</p>
Full article ">Figure 23
<p>Time-dependent deformation of the tunnel considering different values of <math display="inline"><semantics> <mrow> <msub> <mrow> <mi>G</mi> </mrow> <mrow> <mi>p</mi> </mrow> </msub> </mrow> </semantics></math> and GSI.</p>
Full article ">Figure 24
<p>Time-dependent deformation of the tunnel considering different values of <math display="inline"><semantics> <mrow> <msub> <mrow> <mi>η</mi> </mrow> <mrow> <mn>3</mn> </mrow> </msub> </mrow> </semantics></math> and GSI.</p>
Full article ">Figure 25
<p>Visco-deformation of the tunnel host rocks with depth, considering <math display="inline"><semantics> <mrow> <msub> <mrow> <mi>G</mi> </mrow> <mrow> <mn>1</mn> </mrow> </msub> </mrow> </semantics></math>.</p>
Full article ">Figure 26
<p>Visco-deformation of the tunnel host rocks with depth, considering <math display="inline"><semantics> <mrow> <msub> <mrow> <mi>G</mi> </mrow> <mrow> <mn>2</mn> </mrow> </msub> </mrow> </semantics></math>.</p>
Full article ">Figure 27
<p>Visco-deformation of the tunnel host rocks with depth, considering <math display="inline"><semantics> <mrow> <msub> <mrow> <mi>G</mi> </mrow> <mrow> <mi>p</mi> </mrow> </msub> </mrow> </semantics></math>.</p>
Full article ">Figure 28
<p>Visco-deformation of the tunnel host rocks with depth, considering <math display="inline"><semantics> <mrow> <msub> <mrow> <mi>η</mi> </mrow> <mrow> <mn>3</mn> </mrow> </msub> </mrow> </semantics></math>.</p>
Full article ">Figure 29
<p>Illustration of tunnel cross-sectional size and arrangement of monitoring points.</p>
Full article ">Figure 30
<p>Calculated convergence deformation compared with on-site monitoring data.</p>
Full article ">
44 pages, 14805 KiB  
Review
Geodynamic Aspects of Magnetic Data Analysis and Tectonic–Paleomagnetic Mapping in the Easternmost Mediterranean: A Review
by Lev V. Eppelbaum, Youri I. Katz and Zvi Ben-Avraham
Appl. Sci. 2023, 13(18), 10541; https://doi.org/10.3390/app131810541 - 21 Sep 2023
Cited by 1 | Viewed by 1176
Abstract
The Easternmost Mediterranean is a transition region from the ocean to the continent where the spreading and collision zones of the lithospheric plates join. The methodology of paleomagnetic mapping of the transition zones is based on combining geological and geophysical techniques for continental [...] Read more.
The Easternmost Mediterranean is a transition region from the ocean to the continent where the spreading and collision zones of the lithospheric plates join. The methodology of paleomagnetic mapping of the transition zones is based on combining geological and geophysical techniques for continental and oceanic platforms: magnetic data interpretation, paleomagnetic reconstructions, results of magnetized rock radiometric dating, satellite data analysis, tectonic–structural reconstructions, biogeographical studies, and utilization of different geophysical survey results. The satellite-derived gravity map reflects practically all significant tectonic units in the region, which assists us in the supposed paleomagnetic mapping. The satellite-derived and aeromagnetic maps with the tectonic features and the map of Curie discontinuity of Israel indicate the complexity of this region. Advanced magnetic data analysis supported by paleomagnetic data attraction and other geological–geophysical methods allowed the revealing of the block of oceanic crust with the Kiama paleomagnetic zone relating to the Early Permian age. A narrow reversely magnetized Earth crust block was revealed in the Lower Galilee. Some examples of advanced magnetic anomaly analysis are presented for several areas where the magnetization vector inclination is other than the modern direction: the Sea of Galilee, Carmel, Rosh-Ha-Ayin, Malqishon, and Hebron. In Israeli land, for the combined paleomagnetic mapping, the well-studied using paleomagnetic and radiometric methods (as well as tectonic–structural) areas were selected: (1) Makhtesh Ramon, (2) the Sea of Galilee with the adjoining zones, (3) Carmel, (4) Hula, and (5) Hermon. It is shown that the regional analysis of paleomagnetic data distribution played an essential role in detecting the influence of the recently recognized counterclockwise rotating mantle structure on the near-surface layers. Full article
Show Figures

Figure 1

Figure 1
<p>Satellite-derived gravity map of the area under study with the main tectonic features (isoline density is 10 mGals). (1) Intraplate faults, (2) interplate faults, (3) the southern boundary of the Mediterranean accretionary belt. DST, Dead Sea Transform; SF, Sinai Fault.</p>
Full article ">Figure 2
<p>(<b>A</b>) Magnetic–thermal geodynamic map of the studied region (modified after [<a href="#B23-applsci-13-10541" class="html-bibr">23</a>]). (<b>B</b>) Curie discontinuity map of Israel (modified and supplemented after [<a href="#B29-applsci-13-10541" class="html-bibr">29</a>]). (1) Main faults, (2) intraplate faults, (3) southern boundary of the Mediterranean accretionary belt, (4) areas with no data, (5) contour of the delineated Kiama paleomagnetic zone [<a href="#B22-applsci-13-10541" class="html-bibr">22</a>], (6) thermal flow values observed at sea bottom (after [<a href="#B30-applsci-13-10541" class="html-bibr">30</a>] with corrections for the sedimentation velocity, in mW/m<sup>2</sup> (❶ 13.9 ± 2.9, ❷ 44.9 ± 12.1, ❸ 46.4 ± 14.2, ❹ 36.3 ± 3.9, ❺ 32.5 ± 7.0, ❻ 20.5 ± 7.3, ❼ 56.9 ± 8.2, ❽ 26.8 ± 10.0, ❾ 32.2 ± 9.9, ❿ 49.5 ± 10.8, ⓫ 26.5 ± 6.9). Key magnetic anomalies: An, Antalya; B, Beirut [<a href="#B6-applsci-13-10541" class="html-bibr">6</a>]; Ba, Banyas [<a href="#B31-applsci-13-10541" class="html-bibr">31</a>]; C, Carmel [<a href="#B6-applsci-13-10541" class="html-bibr">6</a>]; E, Eratosthenes [<a href="#B23-applsci-13-10541" class="html-bibr">23</a>]; H, Hebron [<a href="#B6-applsci-13-10541" class="html-bibr">6</a>]; HAE, Hasandag and Erciyes Mts. [<a href="#B32-applsci-13-10541" class="html-bibr">32</a>]; Hm, HaMeishar [<a href="#B26-applsci-13-10541" class="html-bibr">26</a>]; Ka, Karaman and Karsanti [<a href="#B18-applsci-13-10541" class="html-bibr">18</a>]; Kd, Kur Dag [<a href="#B18-applsci-13-10541" class="html-bibr">18</a>]; P, Palmyrides [<a href="#B31-applsci-13-10541" class="html-bibr">31</a>]; T, Troodos.</p>
Full article ">Figure 3
<p>Areal–tectonic map of the examined magnetic anomalies and paleomagnetic areas in Israel. Paleomagnetic areas: MR—Makhtesh Ramon, Pa—Paran area, CA—Carmel, SG—Sea of Galilee, HE—Hermon, HU—Hula. The blue circles with numbers designate the location of interpreted magnetic anomalies: (1) Carmel, (2) Sea of Galilee, (3) Rosh Ha-Ain, (4) Hebron, (5) Malqishon. DST, Dead Sea Transform; SF, Sinai Fault.</p>
Full article ">Figure 4
<p>Sea of Galilee: Quantitative analysis of magnetic anomalies A, B, and C.</p>
Full article ">Figure 5
<p>Quantitative examination of the Carmel magnetic anomaly (see its location in <a href="#applsci-13-10541-f003" class="html-fig">Figure 3</a>), Profile II. (1) Excess magnetization of the anomalous body, (2) position of the magnetization vector.</p>
Full article ">Figure 6
<p>Quantitative analysis of the Malqishon magnetic anomaly (see its location in <a href="#applsci-13-10541-f003" class="html-fig">Figure 3</a>). Symbol + designates the location of the middle of the upper edge of the anomalous body, the red arrow shows the position of the magnetization vector, and the value <span class="html-italic">x</span><sub>0</sub> indicates the distortion of the maximum magnetic anomaly from the middle of the upper edge due to oblique magnetization.</p>
Full article ">Figure 7
<p>Quantitative examination of the Rosh-Ha-Ain magnetic anomaly (see its location in <a href="#applsci-13-10541-f003" class="html-fig">Figure 3</a>). (1) Magnetization of the anomalous body and surrounding medium, (2) position of the magnetization vector.</p>
Full article ">Figure 8
<p>Quantitative analysis of the Hebron magnetic anomaly (see its location in <a href="#applsci-13-10541-f003" class="html-fig">Figure 3</a>). (1) Excess magnetization of the anomalous body, (2) position of the magnetization vector. Since the constructed Curie discontinuity map [<a href="#B29-applsci-13-10541" class="html-bibr">29</a>] indicates a depth of 40–40.5 km in this area, below this depth, the magnetization Δ<span class="html-italic">J</span> = 0. In some intermediate zone (at 40.5–39.5 km), Δ<span class="html-italic">J</span>~100 mA/m, and over this zone (39.5–28 km), this anomalous body has the determined magnetization: Δ<span class="html-italic">J</span> = 2500 mA/m.</p>
Full article ">Figure 9
<p>Results of 3D combined gravity–magnetic modeling along Profile II in the Carmel area. (1) Physical properties (numerator = density, kg/cm<sup>3</sup>, denominator = magnetization, mA/m), (2) direction of magnetization vector, other than the geomagnetic field inclination for the region. “obser”, observed; “comp”, computed.</p>
Full article ">Figure 10
<p>Maps of the basement uplift of the Carmel anomaly: conventional (<b>A</b>) and relief (<b>B</b>) variants.</p>
Full article ">Figure 11
<p>(<b>A</b>) The generalized magnetic map of the junction zone (Paran area) between the Sinai massif and Negev terrane. (1) Faults observed at the day surface, (2) faults reconstructed by integrated geological–geophysical analysis, (3) wells, (4) location of the magnetic profile. (1) and (2) are according to [<a href="#B51-applsci-13-10541" class="html-bibr">51</a>], with modifications and the authors’ data. (<b>B</b>) Results of 3D magnetic field modeling of the anomaly along Profile A–B (see <a href="#applsci-13-10541-f011" class="html-fig">Figure 11</a>A). An airborne magnetic map [<a href="#B50-applsci-13-10541" class="html-bibr">50</a>] was used to construct the observed magnetic field. The arrows display the position of the magnetization vector (modified after [<a href="#B21-applsci-13-10541" class="html-bibr">21</a>]).</p>
Full article ">Figure 11 Cont.
<p>(<b>A</b>) The generalized magnetic map of the junction zone (Paran area) between the Sinai massif and Negev terrane. (1) Faults observed at the day surface, (2) faults reconstructed by integrated geological–geophysical analysis, (3) wells, (4) location of the magnetic profile. (1) and (2) are according to [<a href="#B51-applsci-13-10541" class="html-bibr">51</a>], with modifications and the authors’ data. (<b>B</b>) Results of 3D magnetic field modeling of the anomaly along Profile A–B (see <a href="#applsci-13-10541-f011" class="html-fig">Figure 11</a>A). An airborne magnetic map [<a href="#B50-applsci-13-10541" class="html-bibr">50</a>] was used to construct the observed magnetic field. The arrows display the position of the magnetization vector (modified after [<a href="#B21-applsci-13-10541" class="html-bibr">21</a>]).</p>
Full article ">Figure 12
<p>Location of profiles I, II, III, and IV superimposed on the geodynamic–bathymetric map of the Easternmost Mediterranean (modified after [<a href="#B19-applsci-13-10541" class="html-bibr">19</a>,<a href="#B28-applsci-13-10541" class="html-bibr">28</a>]). (1) Interplate faults, (2) intraplate faults, (3) deep fault separating the Alpine belt and oceanic depression, (4) bathymetry.</p>
Full article ">Figure 13
<p>Results of 3D magnetic–gravity modeling along Profile I (see the location of this profile in <a href="#applsci-13-10541-f012" class="html-fig">Figure 12</a>) (modified after [<a href="#B19-applsci-13-10541" class="html-bibr">19</a>,<a href="#B28-applsci-13-10541" class="html-bibr">28</a>]).</p>
Full article ">Figure 14
<p>Results of 3D magnetic–gravity modeling along Profile II (see the location of this profile in <a href="#applsci-13-10541-f012" class="html-fig">Figure 12</a>) (modified after [<a href="#B19-applsci-13-10541" class="html-bibr">19</a>,<a href="#B28-applsci-13-10541" class="html-bibr">28</a>]).</p>
Full article ">Figure 15
<p>Results of 3D magnetic–gravity modeling along Profile III (see the location of this profile in <a href="#applsci-13-10541-f012" class="html-fig">Figure 12</a>) (modified after [<a href="#B19-applsci-13-10541" class="html-bibr">19</a>,<a href="#B28-applsci-13-10541" class="html-bibr">28</a>]).</p>
Full article ">Figure 16
<p>Results of 3D combined magnetic–gravity modeling along profile IV (see the location of this profile in <a href="#applsci-13-10541-f012" class="html-fig">Figure 12</a>). DST, Dead Sea Transform.</p>
Full article ">Figure 17
<p>Final generalization of the 3D combined magnetic–gravity modeling results. (1) Intraplate faults, (2) intraplate faults, (3) deep fault separating the Alpine belt and oceanic depression, (4) contour of the block of oceanic crust with the Kiama paleomagnetic hyperzone, (5) block of the reversely magnetized Earth’s crust. DST, Dead Sea Transform; SF, Sinai Fault; An, Antilebanon; JS, Judea–Samaria.</p>
Full article ">Figure 18
<p>Generalized chronostratigraphic and magnetostratigraphic scales of Late Cenozoic basaltic formations for the Sea of Galilee and Hula Basin (modified after [<a href="#B16-applsci-13-10541" class="html-bibr">16</a>,<a href="#B49-applsci-13-10541" class="html-bibr">49</a>,<a href="#B72-applsci-13-10541" class="html-bibr">72</a>]). (1) General stratigraphic scale, (2) paleomagnetic chrons and subchrons, (3) paleomagnetic scale and its radiometric limits, (4) sequence of basaltic formations.</p>
Full article ">Figure 19
<p>(<b>A</b>) Combined paleomagnetic–magnetic–radiometric scheme of the Sea of Galilee (modified and supplemented after [<a href="#B49-applsci-13-10541" class="html-bibr">49</a>]). (1) Outcropped Cenozoic basalts, (2) points with the radiometric age of basalts (in m.y.), (3) wells, (4) faults, (5) general direction of the discovered buried basaltic plate dipping in the southern part of the Sea of Galilee, (6) counterclockwise (a) and clockwise (b) rotation of faults and tectonic blocks, (7) pull-apart basin of the Sea of Galilee, (8) suggested boundaries of the paleomagnetic zones in the sea, data of land paleomagnetic measurements: (9 and 10) (9) reverse magnetization, (10) normal magnetization; (11 and 12) results of magnetic anomalies analysis: (11) normal magnetization, (12) reverse magnetization; (13) reversely magnetized basalts; (14) normal magnetized basalts; (15) Miocene basalts and sediments with the complicated paleomagnetic characteristics; (16) Pliocene–Pleistocene basalts and sediments with the complicated paleomagnetic characteristics; (17) index of paleomagnetic zonation. The tectonic setting is derived from [<a href="#B54-applsci-13-10541" class="html-bibr">54</a>,<a href="#B78-applsci-13-10541" class="html-bibr">78</a>,<a href="#B79-applsci-13-10541" class="html-bibr">79</a>,<a href="#B80-applsci-13-10541" class="html-bibr">80</a>]. The indicators 1n, 2n, 3n, 1Ar, 2Ar, and 3Ar are the indexes of paleomagnetic subchrons (see <a href="#applsci-13-10541-f018" class="html-fig">Figure 18</a>). Radiometric data (K-Ar and Ar-Ar) are compiled from [<a href="#B43-applsci-13-10541" class="html-bibr">43</a>,<a href="#B78-applsci-13-10541" class="html-bibr">78</a>,<a href="#B81-applsci-13-10541" class="html-bibr">81</a>,<a href="#B82-applsci-13-10541" class="html-bibr">82</a>,<a href="#B83-applsci-13-10541" class="html-bibr">83</a>]. Paleomagnetic data are generalized after [<a href="#B43-applsci-13-10541" class="html-bibr">43</a>,<a href="#B76-applsci-13-10541" class="html-bibr">76</a>,<a href="#B78-applsci-13-10541" class="html-bibr">78</a>,<a href="#B81-applsci-13-10541" class="html-bibr">81</a>,<a href="#B82-applsci-13-10541" class="html-bibr">82</a>,<a href="#B84-applsci-13-10541" class="html-bibr">84</a>,<a href="#B85-applsci-13-10541" class="html-bibr">85</a>,<a href="#B86-applsci-13-10541" class="html-bibr">86</a>,<a href="#B87-applsci-13-10541" class="html-bibr">87</a>,<a href="#B88-applsci-13-10541" class="html-bibr">88</a>]. H<sub>TB</sub> and H<sub>HCC</sub> designate the calculated depths of the basaltic bodies in the basin: H<sub>TB</sub> is the upper edge for the model of the thin bed, H<sub>THP</sub> is the upper edge for the model of the thin horizontal plate, and H<sub>HCC</sub> is the center for the model of the horizontal circular cylinder. (<b>B</b>) Paleomagnetic scale for the integrated paleomagnetic scheme for the Sea of Galilee.</p>
Full article ">Figure 19 Cont.
<p>(<b>A</b>) Combined paleomagnetic–magnetic–radiometric scheme of the Sea of Galilee (modified and supplemented after [<a href="#B49-applsci-13-10541" class="html-bibr">49</a>]). (1) Outcropped Cenozoic basalts, (2) points with the radiometric age of basalts (in m.y.), (3) wells, (4) faults, (5) general direction of the discovered buried basaltic plate dipping in the southern part of the Sea of Galilee, (6) counterclockwise (a) and clockwise (b) rotation of faults and tectonic blocks, (7) pull-apart basin of the Sea of Galilee, (8) suggested boundaries of the paleomagnetic zones in the sea, data of land paleomagnetic measurements: (9 and 10) (9) reverse magnetization, (10) normal magnetization; (11 and 12) results of magnetic anomalies analysis: (11) normal magnetization, (12) reverse magnetization; (13) reversely magnetized basalts; (14) normal magnetized basalts; (15) Miocene basalts and sediments with the complicated paleomagnetic characteristics; (16) Pliocene–Pleistocene basalts and sediments with the complicated paleomagnetic characteristics; (17) index of paleomagnetic zonation. The tectonic setting is derived from [<a href="#B54-applsci-13-10541" class="html-bibr">54</a>,<a href="#B78-applsci-13-10541" class="html-bibr">78</a>,<a href="#B79-applsci-13-10541" class="html-bibr">79</a>,<a href="#B80-applsci-13-10541" class="html-bibr">80</a>]. The indicators 1n, 2n, 3n, 1Ar, 2Ar, and 3Ar are the indexes of paleomagnetic subchrons (see <a href="#applsci-13-10541-f018" class="html-fig">Figure 18</a>). Radiometric data (K-Ar and Ar-Ar) are compiled from [<a href="#B43-applsci-13-10541" class="html-bibr">43</a>,<a href="#B78-applsci-13-10541" class="html-bibr">78</a>,<a href="#B81-applsci-13-10541" class="html-bibr">81</a>,<a href="#B82-applsci-13-10541" class="html-bibr">82</a>,<a href="#B83-applsci-13-10541" class="html-bibr">83</a>]. Paleomagnetic data are generalized after [<a href="#B43-applsci-13-10541" class="html-bibr">43</a>,<a href="#B76-applsci-13-10541" class="html-bibr">76</a>,<a href="#B78-applsci-13-10541" class="html-bibr">78</a>,<a href="#B81-applsci-13-10541" class="html-bibr">81</a>,<a href="#B82-applsci-13-10541" class="html-bibr">82</a>,<a href="#B84-applsci-13-10541" class="html-bibr">84</a>,<a href="#B85-applsci-13-10541" class="html-bibr">85</a>,<a href="#B86-applsci-13-10541" class="html-bibr">86</a>,<a href="#B87-applsci-13-10541" class="html-bibr">87</a>,<a href="#B88-applsci-13-10541" class="html-bibr">88</a>]. H<sub>TB</sub> and H<sub>HCC</sub> designate the calculated depths of the basaltic bodies in the basin: H<sub>TB</sub> is the upper edge for the model of the thin bed, H<sub>THP</sub> is the upper edge for the model of the thin horizontal plate, and H<sub>HCC</sub> is the center for the model of the horizontal circular cylinder. (<b>B</b>) Paleomagnetic scale for the integrated paleomagnetic scheme for the Sea of Galilee.</p>
Full article ">Figure 20
<p>Paleomagnetic–geodynamic map of the Hula Basin (see its location in <a href="#applsci-13-10541-f003" class="html-fig">Figure 3</a>) and adjacent areas of the Golan Plateau, Hermon Mt., and Galilea uplift (modified after [<a href="#B57-applsci-13-10541" class="html-bibr">57</a>]). (1) Volcanic cones, (2) Cretaceous traps, (3) outcrops with the radiometric ages of basalts (in Ma), (4) boreholes, (5) faults: (a) observed, (b) reconstructed, (6) pull-apart basin, (7) tectonic blocks rotations: (a) counterclockwise, (b) clockwise, (8) outcrops with the determined reversely magnetized basalts, (9) outcrops with the determined normally magnetized basalts, (10) chrons of the Geomagnetic Polarity Timescale, (11) areas of the reversely magnetized basalts, (12) areas of the normally magnetized basalts, (13) Gissar superzone, (14) Jalal superzone, (15) Tuarkyr–Khorezm superzone, (16) Sogdiana superzone. The paleomagnetic scale for this area is presented in <a href="#applsci-13-10541-f019" class="html-fig">Figure 19</a>B.</p>
Full article ">Figure 21
<p>Mt. Hermon geodynamic–paleomagnetic map (see the location of this area in <a href="#applsci-13-10541-f003" class="html-fig">Figure 3</a>). (<b>A</b>) Tectono-paleomagnetic indicators. (1) Lower Cretaceous basalt–basanite dikes, (2) Lower Cretaceous alkaline basalt flows and tuffs, (3) Jurassic–Lower Cretaceous diabase dikes, (4) Lower–Upper Cretaceous alkaline basalt flows, (5) Lower Cretaceous diatreme pipes, (6) Upper Cretaceous alkaline basalt cone, (7) faults, (8) axis of the Hermon anticline, (9) counterclockwise (a) and clockwise (b) rotation of faults and magmatic bodies, (10) radiometric age of magmatic rocks, (11) points of Mesozoic magmatism studied by different methods: (a) by K-Ar, Ar-Ar data, (b) Nd-Sr-Pb isotopic data, (12) paleomagnetic measurements of the Pleistocene magmatic rocks: (a) reverse polarity, (b) normal polarity; ((1–8) and (10–12) from [<a href="#B88-applsci-13-10541" class="html-bibr">88</a>,<a href="#B90-applsci-13-10541" class="html-bibr">90</a>,<a href="#B91-applsci-13-10541" class="html-bibr">91</a>,<a href="#B92-applsci-13-10541" class="html-bibr">92</a>,<a href="#B93-applsci-13-10541" class="html-bibr">93</a>,<a href="#B94-applsci-13-10541" class="html-bibr">94</a>,<a href="#B95-applsci-13-10541" class="html-bibr">95</a>,<a href="#B96-applsci-13-10541" class="html-bibr">96</a>,<a href="#B97-applsci-13-10541" class="html-bibr">97</a>,<a href="#B98-applsci-13-10541" class="html-bibr">98</a>,<a href="#B99-applsci-13-10541" class="html-bibr">99</a>], paleomagnetic zones (13–16): (13) Gissar, (14) Jalal-1, (15) Jalal-2, (16) Sogdiana-2 (Matuyama and Brunhes Chrons). (<b>B</b>) Geodynamic changes of Antilebanon terrane displacement in the Middle Mesozoic–Cenozoic. (<b>C</b>) Paleomagnetic scale.</p>
Full article ">Figure 22
<p>(<b>A</b>) Geodynamic–paleomagnetic map of the Mt. Carmel–Galilee region (see its location in <a href="#applsci-13-10541-f003" class="html-fig">Figure 3</a>) (modified and supplemented after [<a href="#B57-applsci-13-10541" class="html-bibr">57</a>]). (1) Cretaceous–Miocene basalts, (2) Miocene gabbroid intrusive, (3) Pliocene Cover basalts, (4) outcrops (a) and boreholes (b) with the Mesozoic–Cenozoic magmatic complexes, (5) radiometric age of magmatic rocks and minerals from K-Ar, Ar-Ar methods (a) and zircon geochronology (b), (6) thickness of the Lower Cretaceous traps (in m), (7) isolines of the Lower Cretaceous traps thicknesses (in m), (8) faults, (9) boundaries of terranes, (10) counterclockwise (a) and clockwise (b) rotation derived from tectonic and paleomagnetic data, (11) data of paleomagnetic measurements of magmatic rocks with normal (<span class="html-italic">N</span>) and reverse (<span class="html-italic">R</span>) polarities, (12–15) paleomagnetic zones: (12) Gissar, (13) Jalal-1, (14) Jalal-2, (15) Tuarkyr, (16) Sogdiana-2. (<b>B</b>) Paleomagnetic scale for the integrated paleomagnetic scheme for the Mt. Carmel–Galilee region.</p>
Full article ">Figure 22 Cont.
<p>(<b>A</b>) Geodynamic–paleomagnetic map of the Mt. Carmel–Galilee region (see its location in <a href="#applsci-13-10541-f003" class="html-fig">Figure 3</a>) (modified and supplemented after [<a href="#B57-applsci-13-10541" class="html-bibr">57</a>]). (1) Cretaceous–Miocene basalts, (2) Miocene gabbroid intrusive, (3) Pliocene Cover basalts, (4) outcrops (a) and boreholes (b) with the Mesozoic–Cenozoic magmatic complexes, (5) radiometric age of magmatic rocks and minerals from K-Ar, Ar-Ar methods (a) and zircon geochronology (b), (6) thickness of the Lower Cretaceous traps (in m), (7) isolines of the Lower Cretaceous traps thicknesses (in m), (8) faults, (9) boundaries of terranes, (10) counterclockwise (a) and clockwise (b) rotation derived from tectonic and paleomagnetic data, (11) data of paleomagnetic measurements of magmatic rocks with normal (<span class="html-italic">N</span>) and reverse (<span class="html-italic">R</span>) polarities, (12–15) paleomagnetic zones: (12) Gissar, (13) Jalal-1, (14) Jalal-2, (15) Tuarkyr, (16) Sogdiana-2. (<b>B</b>) Paleomagnetic scale for the integrated paleomagnetic scheme for the Mt. Carmel–Galilee region.</p>
Full article ">Figure 23
<p>Makhtesh Ramon geodynamic–paleomagnetic map (see its location in <a href="#applsci-13-10541-f003" class="html-fig">Figure 3</a>) (modified and supplemented after [<a href="#B23-applsci-13-10541" class="html-bibr">23</a>]). (<b>A</b>) Geodynamic–paleomagnetic indicators. (<b>B</b>) Geodynamic changes in Makhtesh Ramon subterrane displacement in the Middle Mesozoic. (<b>C</b>) Paleomagnetic scale. (1) Pre-collisional–collisional basalt dikes, (2) post-collisional alkalic olivine basalt flows and volcanoclastic rocks, (3) pre-collisional association of alkalic olivine gabbro, monzogabbro, and syenites, (4) post-collisional association of basanites and nefelinites, (5) quartzitic hexagonal prisms, (6) faults, (7) hypsometric isolines within the Makhtesh Ramon plateau (1–7 from [<a href="#B21-applsci-13-10541" class="html-bibr">21</a>,<a href="#B79-applsci-13-10541" class="html-bibr">79</a>,<a href="#B119-applsci-13-10541" class="html-bibr">119</a>,<a href="#B120-applsci-13-10541" class="html-bibr">120</a>,<a href="#B123-applsci-13-10541" class="html-bibr">123</a>,<a href="#B124-applsci-13-10541" class="html-bibr">124</a>,<a href="#B125-applsci-13-10541" class="html-bibr">125</a>,<a href="#B126-applsci-13-10541" class="html-bibr">126</a>,<a href="#B127-applsci-13-10541" class="html-bibr">127</a>,<a href="#B128-applsci-13-10541" class="html-bibr">128</a>,<a href="#B129-applsci-13-10541" class="html-bibr">129</a>,<a href="#B130-applsci-13-10541" class="html-bibr">130</a>,<a href="#B131-applsci-13-10541" class="html-bibr">131</a>,<a href="#B132-applsci-13-10541" class="html-bibr">132</a>,<a href="#B133-applsci-13-10541" class="html-bibr">133</a>], (8) radiometric age of the magmatic rocks (from [<a href="#B115-applsci-13-10541" class="html-bibr">115</a>,<a href="#B117-applsci-13-10541" class="html-bibr">117</a>,<a href="#B134-applsci-13-10541" class="html-bibr">134</a>], (9) counterclockwise (a) and clockwise (b) rotation of the linear structures (faults, dikes, and volcanic ridges), (10)–(11) magmatic rocks with normal (10), and reversal (11) paleomagnetic polarity (from [<a href="#B118-applsci-13-10541" class="html-bibr">118</a>,<a href="#B135-applsci-13-10541" class="html-bibr">135</a>,<a href="#B136-applsci-13-10541" class="html-bibr">136</a>], (12)–(15) paleomagnetic zonation inside the magmatic complexes: (12) Illawarra, (13) Omolon, (14) Gissar, (15) Jalal.</p>
Full article ">Figure 24
<p>Geodynamic schemes of Cyprus rotation (Cretaceous–Late Cenozoic). (<b>A</b>) Counterclockwise rotation of Cyprus from Late Cretaceous to Late Miocene according to paleomagnetic data [<a href="#B139-applsci-13-10541" class="html-bibr">139</a>], (<b>B</b>) change in the relative position of Cyprus and the African–Arabian Plate of Gondwana paleocontinent in Late Cretaceous according to paleomagnetic data [<a href="#B137-applsci-13-10541" class="html-bibr">137</a>], (<b>C</b>) structural–paleogeodynamic reconstruction of Cyprus’ paleostructures within the Late Cretaceous Tethys Paleo Ocean and its frame (after [<a href="#B13-applsci-13-10541" class="html-bibr">13</a>]). I, subducting oceanic plate of the southern side of Neotethys; II, ophiolite complex of the Early Mesozoic crust of the Mammonia basin; III, area of spreading zone of Late Cretaceous part of middle Troodos ridge; IV, zone of terranes of the Aegean–Anatolian belt with continental crust.</p>
Full article ">Figure 25
<p>The tectonic–geophysical sketch map of the African–Arabian junction superimposed on the gravity residual anomaly (modified after [<a href="#B14-applsci-13-10541" class="html-bibr">14</a>]). (1) Archean cratons, (2–4) fold belts: (2) Paleo–Middle Proterozoic, (3) Neoproterozoic, (4) Late Paleozoic (Hercynian), (5) Mesozoic terrane belt, (6) Alpine–Himalayan orogenic belt, (7) African–Arabian Late Cenozoic traps, (8) main fault systems, (9) Kiama paleomagnetic hyperzone of inverse polarity [<a href="#B22-applsci-13-10541" class="html-bibr">22</a>], (10) isolines of the obtained polynomial regional gravity trend, (11) rotational geodynamic elements derived from the paleomagnetic data; (a) counterclockwise, (b) clockwise, (12) global counterclockwise rotation by the GPS data (modified after [<a href="#B138-applsci-13-10541" class="html-bibr">138</a>]).</p>
Full article ">
26 pages, 1461 KiB  
Review
An Overview of the Relevance of Human Gut and Skin Microbiome in Disease: The Influence on Atopic Dermatitis
by Maria Pia Ferraz
Appl. Sci. 2023, 13(18), 10540; https://doi.org/10.3390/app131810540 - 21 Sep 2023
Cited by 2 | Viewed by 1409
Abstract
It is acknowledged that humans have a diverse and abundant microbial community known as the human microbiome. Nevertheless, our comprehension of the numerous functions these microorganisms have in human health is still in its early stages. Microorganisms belonging to the human microbiome typically [...] Read more.
It is acknowledged that humans have a diverse and abundant microbial community known as the human microbiome. Nevertheless, our comprehension of the numerous functions these microorganisms have in human health is still in its early stages. Microorganisms belonging to the human microbiome typically coexist with their host, but in certain situations, they can lead to diseases. They are found in several areas of the human body in healthy individuals. The microbiome is highly diverse, and its composition varies depending on the body site. It primarily comprises bacteria that are crucial for upholding a state of well-being and equilibrium. The microbiome’s influence on atopic dermatitis development was, therefore, analyzed. The importance of maintaining a balanced and functional commensal microbiota, as well as the use of prebiotics and probiotics in the prevention and treatment of atopic dermatitis were also explored. The skin microbiome’s association with atopic dermatitis will allow for a better understanding of pathogenesis and also exploring new therapeutic approaches, making the skin microbiome an increasingly relevant therapeutic target. Full article
Show Figures

Figure 1

Figure 1
<p>Factors contributing to skin microbiome variation.</p>
Full article ">Figure 2
<p>Mechanisms of skin microbiota’s influence on AD pathogenesis.</p>
Full article ">Figure 3
<p>AD pathogenesis regulation by the gut microbiota.</p>
Full article ">
15 pages, 6443 KiB  
Article
Runway Pavement Structural Analysis Using Remote Laser Doppler Vibrometers
by Ge Yang, Xindong Zhao, Yu Tian and Lingjie Li
Appl. Sci. 2023, 13(18), 10539; https://doi.org/10.3390/app131810539 - 21 Sep 2023
Cited by 1 | Viewed by 1134
Abstract
Structural analysis is crucial for airfield pavement evaluation and plays a critical role in ensuring airfield operation safety and efficiency. Traditionally, the evaluation has relied on the Heavy Weight Deflectometer (HWD) test. This method encounters challenges, including interruptions in airfield operations, limited coverage [...] Read more.
Structural analysis is crucial for airfield pavement evaluation and plays a critical role in ensuring airfield operation safety and efficiency. Traditionally, the evaluation has relied on the Heavy Weight Deflectometer (HWD) test. This method encounters challenges, including interruptions in airfield operations, limited coverage of inspection locations, and extensive time required for data collection and analysis. In the presented research, a remote method for the measurement and analysis of runway pavement structural deflection induced by transiting aircraft was introduced, employing a Remote Laser Doppler Vibrometer (RLDV). First, a test system was developed to acquire deflection measurements of airport pavements using RLDV. To address inaccuracies arising from minor angle measurements and fixed-end beam vibrations, vibration correction methods were developed and validated. Thereafter, a linear regression model was constructed using data from both RLDV and HWD measurements, yielding a correlation coefficient of 0.94. This correlation highlights the reliable utility of RLDV in analyzing pavement structural response. The objective of this research is to present a novel approach for the evaluation of pavement structural performance. Full article
(This article belongs to the Special Issue Structural Health Monitoring of Civil Structures and Infrastructures)
Show Figures

Figure 1

Figure 1
<p>Remote Laser Doppler Vibrometer and testing principle.</p>
Full article ">Figure 2
<p>Runway deflection detection scheme based on RLDV.</p>
Full article ">Figure 3
<p>Angle compensation verification experiment.</p>
Full article ">Figure 4
<p>Vibration experiment data collection results. (<b>a</b>) Condition 1: the distance between the RLDV and the observation point is 15 m; (<b>b</b>) Condition 2: the distance between the RLDV and the observation point is 25 m; (<b>c</b>) Condition 3: the distance between the RLDV and the observation point is 35 m; (<b>d</b>) Condition 4: the distance between RLDV and the observation point is 35 m and with reflector.</p>
Full article ">Figure 4 Cont.
<p>Vibration experiment data collection results. (<b>a</b>) Condition 1: the distance between the RLDV and the observation point is 15 m; (<b>b</b>) Condition 2: the distance between the RLDV and the observation point is 25 m; (<b>c</b>) Condition 3: the distance between the RLDV and the observation point is 35 m; (<b>d</b>) Condition 4: the distance between RLDV and the observation point is 35 m and with reflector.</p>
Full article ">Figure 5
<p>Compensation algorithm experimental validation.</p>
Full article ">Figure 6
<p>Fixed-end Beam Vibration Displacement (100 kN). (<b>a</b>) Vibration acceleration of fixed-end beam; (<b>b</b>) Vibration displacement of fixed-end beam after quadratic integration.</p>
Full article ">Figure 7
<p>Flowchart for vibration compensation of RLDV test data.</p>
Full article ">Figure 8
<p>RLDV data and Fourier transform (100 kN). (<b>a</b>) Vibration measurement data and Fourier transform of the experimental group; (<b>b</b>) Vibration measurement data and Fourier transform of the control group.</p>
Full article ">Figure 9
<p>Accelerometer data and Fourier transform (100 kN). (<b>a</b>) Vibration measurement data and Fourier transform of the accelerometer; (<b>b</b>) Intercept vibration measurement data and Fourier transform of the accelerometer.</p>
Full article ">Figure 10
<p>Filtering of vibration data (100 kN). (<b>a</b>) Vibration data before filtering from RLDV; (<b>b</b>) Vibration data after filtering via the Butterworth filter.</p>
Full article ">Figure 11
<p>Displacement of concrete slab (100 kN). (<b>a</b>) Displacement vibration of the experimental group; (<b>b</b>) Displacement vibration of the control group.</p>
Full article ">Figure 12
<p>Correlation analysis of RLDV and HWD.</p>
Full article ">
18 pages, 2299 KiB  
Article
ER-LAC: Span-Based Joint Entity and Relation Extraction Model with Multi-Level Lexical and Attention on Context Features
by Yaqin Zhu, Xuhang Li, Zijian Wang, Jiayong Li, Cairong Yan and Yanting Zhang
Appl. Sci. 2023, 13(18), 10538; https://doi.org/10.3390/app131810538 - 21 Sep 2023
Cited by 1 | Viewed by 1464
Abstract
In recent years, joint entity–relation extraction (ERE) models have become a hot research topic in natural language processing (NLP). Several studies have proposed a span-based ERE framework, which utilizes simple span embeddings for entity and relation classification. This framework addresses the issues of [...] Read more.
In recent years, joint entity–relation extraction (ERE) models have become a hot research topic in natural language processing (NLP). Several studies have proposed a span-based ERE framework, which utilizes simple span embeddings for entity and relation classification. This framework addresses the issues of overlap and error propagation that were present in previous entity–relation extraction models. However, span-based models overlook the influence of lexical information on the semantic representation of the span and fail to consider relations with a strong intrinsic connection between span pairs. To tackle these aforementioned issues, we present a new ERE model called ER-LAC (Span-based Joint Entity and Relation Extraction Model with Multi-level Lexical and Attention on Context Features). This model is designed with multi-granularity lexical features to enhance the semantic representation of spans, and a transformer classifier is employed to capture the internal connections between span pairs, thereby improving the performance of relational classification. To demonstrate the effectiveness of the proposed model, ablation experiments were conducted on the CoNLL04 dataset. The proposed model was also compared with other models on three datasets, showcasing its computational efficiency. The results indicate that the introduced lexical features and classifier enhance the F1 score for entity extraction by 0.84% to 2.04% and improve the F1 score for relationship classification by 0.96% to 2.26% when compared to the previous state-of-the-art (SOTA) model and the baseline SpERT model, respectively. Full article
Show Figures

Figure 1

Figure 1
<p>The BERT pre-trained model obtained token embeddings and a sentence embedding C. Two types of POS embeddings were proposed to enhance the span embeddings. The enhanced span embeddings were used in the entity classification stage. The embeddings of span pairs and a center embedding with local information were used in the multi-label relation classification stage. The relation classifier used a transformer encoder to extract internal connections between spans.</p>
Full article ">Figure 2
<p>An example of lexical properties. The line above the sentence shows the POS annotations of each word in the sentence. In the sentence, the entities were highlighted in blue. The relation was highlighted in green. As can be seen, the POS tags of words in most entities were NNP or NN.</p>
Full article ">Figure 3
<p>The span for entity classification mainly consists of five parts: first, the basic span embedding obtained through maximum pooling (blue), then the width feature of the span (deep purple), sentence vector C as the classification vector for entity classification (light purple), fine-grained part of speech embedding obtained by calculating the part of speech feature of the word vector within the span (orange), and coarse-grained part of speech embedding (brown) obtained by calculating the part of speech features of the span.</p>
Full article ">Figure 4
<p>Structure of the Multi-head Self-Attention encoder and the self-attention encoder. The colors in the left part of the image correspond to the elements in <a href="#applsci-13-10538-f001" class="html-fig">Figure 1</a>.</p>
Full article ">Figure 5
<p>The confusion matrix of the models tested on dataset CoNLL04, where (<b>a</b>) is the entity classification result of the baseline model, (<b>b</b>) is the relation classification result of the baseline model, (<b>c</b>) is the entity classification result of our proposed model, and (<b>d</b>) is the relation classification result of our proposed model.</p>
Full article ">
18 pages, 12281 KiB  
Article
Lane Line Type Recognition Based on Improved YOLOv5
by Boyu Liu, Hao Wang, Yongqiang Wang, Congling Zhou and Lei Cai
Appl. Sci. 2023, 13(18), 10537; https://doi.org/10.3390/app131810537 - 21 Sep 2023
Cited by 1 | Viewed by 1780
Abstract
The recognition of lane line type plays an important role in the perception of advanced driver assistance systems (ADAS). In actual vehicle driving on roads, there are a variety of lane line type and complex road conditions which present significant challenges to ADAS. [...] Read more.
The recognition of lane line type plays an important role in the perception of advanced driver assistance systems (ADAS). In actual vehicle driving on roads, there are a variety of lane line type and complex road conditions which present significant challenges to ADAS. To address this problem, this paper proposes an improved YOLOv5 method for recognising lane line type. This method can accurately and quickly identify the types of lane lines and can show good recognition results in harsh environments. The main strategy of this method includes the following steps: first, the FasterNet lightweight network is introduced into all the concentrated-comprehensive convolution (C3) modules in the network to accelerate the inference speed and reduce the number of parameters. Then, the efficient channel attention (ECA) mechanism is integrated into the backbone network to extract image feature information and improve the model’s detection accuracy. Finally, the sigmoid intersection over union (SIoU) loss function is used to replace the original generalised intersection over union (GIoU) loss function to further enhance the robustness of the model. Through experiments, the improved YOLOv5s algorithm achieves 95.1% of [email protected] and 95.2 frame·s−1 of FPS, which can satisfy the demand of ADAS for accuracy and real-time performance. And the number of model parameters are only 6M, and the volume is only 11.7 MB, which will be easily embedded into ADAS and does not require huge computing power to support it. Meanwhile, the improved algorithms increase the accuracy and speed of YOLOv5m, YOLOv5l, and YOLOv5x models to different degrees. The appropriate model can be selected according to the actual situation. This plays a practical role in improving the safety of ADAS. Full article
Show Figures

Figure 1

Figure 1
<p>YOLOv5s network structure.</p>
Full article ">Figure 2
<p>Improved YOLOv5s network structure.</p>
Full article ">Figure 3
<p>C3_Faster module.</p>
Full article ">Figure 4
<p>ECA mechanism.</p>
Full article ">Figure 5
<p>SIoU loss function calculation scheme diagram.</p>
Full article ">Figure 6
<p>Inverse perspective transformation: (<b>a</b>) original image; (<b>b</b>) after perspective transformation.</p>
Full article ">Figure 7
<p>Sample size of all types of lane lines.</p>
Full article ">Figure 8
<p>Confusion matrix.</p>
Full article ">Figure 9
<p>Results of different YOLO algorithms: (<b>a</b>) YOLOv5s; (<b>b</b>) Ours-YOLOv5s; (<b>c</b>) YOLOv5x; (<b>d</b>) Ours-YOLOv5x; (<b>e</b>)YOLOv4-tiny.</p>
Full article ">Figure 10
<p>Comparison of models mAP@0.5: (<b>a</b>) YOLOv5s; (<b>b</b>) Ours-YOLOv5s.</p>
Full article ">Figure 11
<p>Comparison of the algorithm before and after improvement under different light intensities.</p>
Full article ">Figure 12
<p>Comparison of the algorithm before and after improvement under different levels of noise.</p>
Full article ">
38 pages, 6704 KiB  
Article
Performance Improvement of Melanoma Detection Using a Multi-Network System Based on Decision Fusion
by Hassan El-khatib, Ana-Maria Ștefan and Dan Popescu
Appl. Sci. 2023, 13(18), 10536; https://doi.org/10.3390/app131810536 - 21 Sep 2023
Cited by 3 | Viewed by 1941
Abstract
The incidence of melanoma cases continues to rise, underscoring the critical need for early detection and treatment. Recent studies highlight the significance of deep learning in melanoma detection, leading to improved accuracy. The field of computer-assisted detection is extensively explored along all lines, [...] Read more.
The incidence of melanoma cases continues to rise, underscoring the critical need for early detection and treatment. Recent studies highlight the significance of deep learning in melanoma detection, leading to improved accuracy. The field of computer-assisted detection is extensively explored along all lines, especially in the medical industry, as the benefit in this field is to save hu-man lives. In this domain, this direction must be maximally exploited and introduced into routine controls to improve patient prognosis, disease prevention, reduce treatment costs, improve population management, and improve patient empowerment. All these new aspects were taken into consideration to implement an EHR system with an automated melanoma detection system. The first step, as presented in this paper, is to build a system based on the fusion of decisions from multiple neural networks, such as DarkNet-53, DenseNet-201, GoogLeNet, Inception-V3, InceptionResNet-V2, ResNet-50, ResNet-101, and compare this classifier with four other applications: Google Teachable Machine, Microsoft Azure Machine Learning, Google Vertex AI, and SalesForce Einstein Vision based on the F1 score for further integration into an EHR platform. We trained all models on two databases, ISIC 2020 and DermIS, to also test their adaptability to a wide range of images. Comparisons with state-of-the-art research and existing applications confirm the promising performance of the proposed system. Full article
Show Figures

Figure 1

Figure 1
<p>Architecture for the proposed method for the study.</p>
Full article ">Figure 2
<p>Non-Melanoma images extracted from the ISIC 2020 database.</p>
Full article ">Figure 3
<p>Melanoma images extracted from the ISIC 2020 database.</p>
Full article ">Figure 4
<p>Non-melanoma images extracted from the DermIS database.</p>
Full article ">Figure 5
<p>Melanoma images extracted from the ISIC database.</p>
Full article ">Figure 6
<p>Results obtained after applying the DullRazor algorithm to the DermIS skin lesion images database.</p>
Full article ">Figure 7
<p>Results obtained after applying the DullRazor algorithm to the ISIC 2020 skin lesion images database.</p>
Full article ">Figure 8
<p>DarkNet-53 architecture.</p>
Full article ">Figure 9
<p>DenseNet-201 architecture.</p>
Full article ">Figure 10
<p>GoogLeNet architecture.</p>
Full article ">Figure 11
<p>Inception module.</p>
Full article ">Figure 12
<p>Inception V3 architecture.</p>
Full article ">Figure 13
<p>(<b>a</b>) Residual Learning: Building Block; (<b>b</b>) ResNet Architecture.</p>
Full article ">Figure 14
<p>Xception Architecture.</p>
Full article ">Figure 15
<p>Inception-ResNet-V2.</p>
Full article ">Figure 16
<p>Training Dataset.</p>
Full article ">Figure 17
<p>Proposed system architecture.</p>
Full article ">Figure 18
<p>Confusion matrices for considered CNNs. (<b>A</b>–<b>H</b>): DermIS database, (<b>I</b>–<b>P</b>): ISIC database.</p>
Full article ">Figure 19
<p>Confusion matrices for considered automated applications. (<b>A</b>–<b>D</b>): DermIS database, (<b>E</b>–<b>H</b>): ISIC database.</p>
Full article ">Figure 20
<p>Confusion Matrix for Decision Fusion Classifier.</p>
Full article ">
13 pages, 3006 KiB  
Review
Desquamative Gingivitis, Oral Hygiene, and Autoimmune Oral Diseases: A Scoping Review
by Andrea Scribante, Matteo Pellegrini, Giacomo Li Vigni, Federica Pulicari and Francesco Spadari
Appl. Sci. 2023, 13(18), 10535; https://doi.org/10.3390/app131810535 - 21 Sep 2023
Cited by 1 | Viewed by 2141
Abstract
Desquamative gingivitis is a clinical condition with a chronic course, not specific to a particular disease, characterized by intense erythema, scaling, vesicles, and/or blisters that may involve both the marginal free gingiva (MG) and the neighboring adherent gingiva (AG). This scoping review aimed [...] Read more.
Desquamative gingivitis is a clinical condition with a chronic course, not specific to a particular disease, characterized by intense erythema, scaling, vesicles, and/or blisters that may involve both the marginal free gingiva (MG) and the neighboring adherent gingiva (AG). This scoping review aimed to investigate whether there is a correlation between oral hygiene and gingival lesions induced by autoimmune diseases of the oral cavity and whether periodontal disease can negatively influence a clinical picture of desquamative gingivitis due to an immune disorder of the oral cavity. Case series studies and randomized controlled trials were considered for this scoping review; studies that did not comply with the inclusion criteria were excluded. A total of seven studies were selected for this review. The PRISMA-ScR (preferred reporting items for scoping reviews) consensus has been followed. Based on the included studies, it is possible to state that improvement in disease and patient-reported outcomes may be the result of appropriate oral hygiene education when patients are found to have autoimmune diseases with gingival manifestations. Full article
Show Figures

Figure 1

Figure 1
<p>Flow chart of the review process.</p>
Full article ">
17 pages, 2341 KiB  
Article
The Influence of Circular Physical Human–Machine Interfaces of Three Shoulder Exoskeletons on Tissue Oxygenation
by Christine Linnenberg, Benjamin Reimeir, Robert Eberle and Robert Weidner
Appl. Sci. 2023, 13(18), 10534; https://doi.org/10.3390/app131810534 - 21 Sep 2023
Cited by 2 | Viewed by 1385
Abstract
Occupational shoulder exoskeletons need to provide meaningful torques to achieve the desired support, thereby high pressures can occur within the physical human–machine interface (pHMI) of exoskeletons that may lead to discomfort, pain, or soft tissue injuries. This pilot study investigates the effects of [...] Read more.
Occupational shoulder exoskeletons need to provide meaningful torques to achieve the desired support, thereby high pressures can occur within the physical human–machine interface (pHMI) of exoskeletons that may lead to discomfort, pain, or soft tissue injuries. This pilot study investigates the effects of occurring circumferential pressures within the pHMI in three different shoulder exoskeletons on the tissue oxygenation underneath the interfaces in resting position and dynamic use of the exoskeletons in 12 healthy subjects using near-infrared spectroscopy. Similar to standard Vascular Occlusion Tests, the tissue oxygen decreases while wearing the exoskeletons at rest (−2.1 (1.4) %/min). Dynamic use of the exoskeleton enhances the decrease in tissue oxygen (−7.3 (4.1) %/min) significantly and leads to greater resaturation after reopening the interface compared to resting position. This can be a sign of restricted blood supply to the upper extremity while wearing the exoskeleton. The shape and width of the circular interfaces showed no effect on the tissue oxygenation during use. Tissue oxygenation can be established as an additional safety criterion of exoskeletal pHMIs. The design of pHMI of shoulder exoskeletons should be reconsidered, e.g., in terms of open structures or the elasticity of closure straps to avoid occlusion effects. Full article
Show Figures

Figure 1

Figure 1
<p>Custom-made pressure sensor.</p>
Full article ">Figure 2
<p>Exoskeletons and their pHMIs: (<b>a</b>) Skelex 360, (<b>b</b>) Lucy, and (<b>c</b>) Paexo Shoulder.</p>
Full article ">Figure 3
<p>Response of tissue saturation index (TSI) to occlusion.</p>
Full article ">Figure 4
<p>Schematic diagram of the testing protocol.</p>
Full article ">Figure 5
<p>Sequence of the dynamic task.</p>
Full article ">Figure 6
<p>Illustration for the calculation of NIRS key outcome parameters.</p>
Full article ">Figure 7
<p>Mean TSI curves of VOTs and resting posture conditions (<b>A</b>) and dynamic conditions (<b>B</b>).</p>
Full article ">
16 pages, 6939 KiB  
Article
Susceptibility Modeling of a Rubber Track for Lightweight Mobile Robots
by Daniela Szpaczyńska, Marian Janusz Łopatka and Piotr Krogul
Appl. Sci. 2023, 13(18), 10533; https://doi.org/10.3390/app131810533 - 21 Sep 2023
Cited by 1 | Viewed by 1243
Abstract
The elastic-damping properties of the rubber track structure can have a significant impact on the running gear performance of lightweight mobile robots. Taking these properties into account is particularly important for modeling obstacle negotiation and estimating the robot’s driving force. The article presents [...] Read more.
The elastic-damping properties of the rubber track structure can have a significant impact on the running gear performance of lightweight mobile robots. Taking these properties into account is particularly important for modeling obstacle negotiation and estimating the robot’s driving force. The article presents track susceptibility identification using both static and dynamic tests. The experimental results were used to validate the multi-body dynamics model of the rubber track for three modeling methods and for three track link number model variants. The methods and variants were compared by the accuracy of the susceptibility parameters obtained using them. The impact of the modeling methods on the track bending resistance simulations was also checked. Full article
(This article belongs to the Section Mechanical Engineering)
Show Figures

Figure 1

Figure 1
<p>Rubber track links constraint scheme.</p>
Full article ">Figure 2
<p>Rubber tracks of the DTV Shredder platform.</p>
Full article ">Figure 3
<p>The rubber track measurement recorded in the optical system during: (<b>a</b>) static test and (<b>b</b>) dynamic test.</p>
Full article ">Figure 4
<p>Track belt measurements scheme in: (<b>a</b>) static test; (<b>b</b>) dynamic test.</p>
Full article ">Figure 5
<p>The three exemplary track oscillation plots, recorded in dynamic test of track 1.</p>
Full article ">Figure 6
<p>Track links constraint scheme (<b>a</b>), and the constraint torque-links of angular stiffness definition methods: (<b>b</b>) Method I; (<b>c</b>) Method II; (<b>d</b>) Method III.</p>
Full article ">Figure 7
<p>The track oscillations plots comparison: experimental measurement and simulation results from constant stiffness constraint model in variants E38, E56 and E76.</p>
Full article ">Figure 8
<p>The track oscillations plots comparison: experimental measurement and simulation results from bivalent stiffness constraint model in variants E38, E56 and E76.</p>
Full article ">Figure 9
<p>The constraint torque-links rotation angle characteristics determined for E38 (III) track simulation variant.</p>
Full article ">Figure 10
<p>Comparison of constraint torque in the segment rotation angle function plots assumed for variants E38, E56 and E76.</p>
Full article ">Figure 11
<p>The track oscillations plots comparison: experimental measurement and simulation results from variable stiffness constraint model in variants E38, E56 and E76.</p>
Full article ">Figure 12
<p>Track belt bending resistance simulations: (<b>a</b>) simulation model; (<b>b</b>) simulation results driving torque plots for three modeling methods.</p>
Full article ">
15 pages, 11185 KiB  
Article
Simulation Study on Fire Product Movement Law and Evacuation in a University High-Rise Teaching Building
by Yan Cui, Hao Wang, Bo You, Chuan Cheng and Ming Li
Appl. Sci. 2023, 13(18), 10532; https://doi.org/10.3390/app131810532 - 21 Sep 2023
Cited by 2 | Viewed by 1188
Abstract
High-rise teaching buildings are complex public buildings that combine the evacuation risks of school buildings and high-rise buildings. In this regard, studying fire product transport patterns and personnel evacuation characteristics of high-rise school buildings is crucial for safe and rapid evacuation. In this [...] Read more.
High-rise teaching buildings are complex public buildings that combine the evacuation risks of school buildings and high-rise buildings. In this regard, studying fire product transport patterns and personnel evacuation characteristics of high-rise school buildings is crucial for safe and rapid evacuation. In this paper, we applied Pyrosim2018 software to build a model of a teaching building and performed numerical fire simulation to analyze temperature, CO gas, and visibility to determine the available evacuation time ASET; meanwhile, we performed evacuation simulation by Pathfinder 2019 to determine the required evacuation time and analyze the congestion problem during evacuation. By improving the evacuation route, secondary simulations were conducted and compared with the previous results. The results show that visibility is the main factor affecting evacuation in of the event of a fire in this school building. Based on the visibility analysis, it is recommended that personnel evacuate from floors four and above within 709.2 S when the fire location is at a specific position on the third floor. While the original safety exits of the school building can avoid a large number of casualties, they cannot guarantee the safe evacuation of all people, and planning a reasonable evacuation route can obviously relieve the evacuation pressure in the high-rise corridor. Full article
Show Figures

Figure 1

Figure 1
<p>Model of the teaching building: (<b>a</b>) exterior view of the school building and (<b>b</b>) perspective view of the building.</p>
Full article ">Figure 2
<p>Structures of the first and second floors: (<b>a</b>) structure of the first floor and (<b>b</b>) structure of the second floor.</p>
Full article ">Figure 3
<p>Structure of the third floor (same structure from three to six floors).</p>
Full article ">Figure 4
<p>Location of the fire source and measurement point.</p>
Full article ">Figure 5
<p>Temperature distributions of four points with time: (<b>a</b>) temperature distribution of point A with time; (<b>b</b>) temperature distribution of point B with time; (<b>c</b>) temperature distribution of point C with time; and (<b>d</b>) temperature distribution of point D with time.</p>
Full article ">Figure 6
<p>CO concentration variation: (<b>a</b>) CO concentration variation of point A; (<b>b</b>) CO concentration variation of point B; (<b>c</b>) CO concentration variation of point C; and (<b>d</b>) CO concentration variation of point D.</p>
Full article ">Figure 7
<p>Changes in visibility: (<b>a</b>) visibility slice (20.4 s); (<b>b</b>) visibility slice (30.0 s); (<b>c</b>) visibility slice (100.8 s); and (<b>d</b>) visibility slice (709.2 s).</p>
Full article ">Figure 8
<p>Evacuation model of teaching building.</p>
Full article ">Figure 9
<p>Personnel distribution in the teaching building.</p>
Full article ">Figure 10
<p>Distribution of people at different evacuation simulation times (disordered): (<b>a</b>) 20.4 s; (<b>b</b>) 200.1 s; (<b>c</b>) 300 s; and (<b>d</b>) 619.5 s.</p>
Full article ">Figure 10 Cont.
<p>Distribution of people at different evacuation simulation times (disordered): (<b>a</b>) 20.4 s; (<b>b</b>) 200.1 s; (<b>c</b>) 300 s; and (<b>d</b>) 619.5 s.</p>
Full article ">Figure 11
<p>Relationship between evacuation time and the number of evacuees.</p>
Full article ">Figure 12
<p>Relationship between flow rates for selected doors and time in cases of disorderly evacuation.</p>
Full article ">Figure 13
<p>Roadmap for orderly evacuation of each floor: (<b>a</b>) first floor; (<b>b</b>) second floor; (<b>c</b>) third floor; (<b>d</b>) fourth floor; (<b>e</b>) fifth floor; and (<b>f</b>) sixth floor.</p>
Full article ">Figure 14
<p>Relationship between flow rates for selected doors and time in case of orderly evacuation.</p>
Full article ">
10 pages, 1522 KiB  
Article
Nutritional Value, Physical Properties, and Sensory Quality of Sugar-Free Cereal Bars Fortified with Grape and Apple Pomace
by Agata Blicharz-Kania, Kostiantyn Vasiukov, Agnieszka Sagan, Dariusz Andrejko, Weronika Fifowska and Marek Domin
Appl. Sci. 2023, 13(18), 10531; https://doi.org/10.3390/app131810531 - 21 Sep 2023
Cited by 5 | Viewed by 1456
Abstract
Cereal bars are so-called convenience foods. Consumers value these products as a healthier alternative to traditional chocolate bars. Since these snacks usually contain added dried fruit, they have high potential for the utilisation of waste materials from the fruit industry. The study aimed [...] Read more.
Cereal bars are so-called convenience foods. Consumers value these products as a healthier alternative to traditional chocolate bars. Since these snacks usually contain added dried fruit, they have high potential for the utilisation of waste materials from the fruit industry. The study aimed to determine the effect of fortification of cereal bars with grape and apple pomace on their nutritional value, physical properties, and sensory quality. The control recipe was modified by replacing 10 or 20 g of sultanas with apple or grape pomace. The fortification with these food by-products resulted in a significant increase in the moisture content of the products, an increase in soluble fibre content, and a decrease in the level of antioxidant compounds. The strength of the cereal bars supplemented with grape and apple pomace increased. In addition, the panellists noticed a colour difference compared to the unmodified product (2 < ΔE < 5). A positive effect of the addition of the fruit pomace on the visual characteristics of the cereal bars was also observed. No changes were observed in the tastiness of the product. On the other hand, the aroma of the modified products and the texture of the bars containing the apple residue were less acceptable. In conclusion, cereal bars containing grape pomace and up to 10 g of apple pomace are characterised by high soluble dietary fibre content and desirable sensory and mechanical properties and are therefore recommended for industrial production. Full article
Show Figures

Figure 1

Figure 1
<p>Pictures of the experimental products: CB—control bars; G1—bars with 10 g grape pomace addition; G2—bars with 20 g grape pomace addition; A1—bars with 10 g apple pomace addition; A2—bars with 20 g apple pomace addition.</p>
Full article ">Figure 2
<p>Strength of cereal bars fortified with grape and apple pomace: CB—control bars; G1—bars with 10 g grape pomace addition; G2—bars with 20 g grape pomace addition; A1—bars with 10 g apple pomace addition; A2—bars with 20 g apple pomace addition. Data are presented as mean (<span class="html-italic">n</span> = 5). Error bars indicate standard deviations; values of each parameter with different superscript letters in the rows are significantly different (Tukey test <span class="html-italic">p</span> ≤ 0.05).</p>
Full article ">Figure 3
<p>Sensory evaluation of cereal bars fortified with grape and apple pomace: CB—control bars; G1—bars with 10 g grape pomace addition; G2—bars with 20 g grape pomace addition; A1—bars with 10 g apple pomace addition; A2—bars with 20 g apple pomace addition.</p>
Full article ">
12 pages, 1026 KiB  
Article
Skeletal and Dentoalveolar Effects of Maxillary Protraction Using Tooth- and Miniscrew-Anchored Devices in Patients with Class III Malocclusion with Maxillary Deficiency: A Retrospective Follow-Up Study
by Jong-Chan Baik, Youn-Kyung Choi, Hyeran Helen Jeon, Sung-Hun Kim, Seong-Sik Kim, Soo-Byung Park and Yong-Il Kim
Appl. Sci. 2023, 13(18), 10530; https://doi.org/10.3390/app131810530 - 21 Sep 2023
Viewed by 1746
Abstract
Introduction: This retrospective study aimed to determine skeletal and dental changes after a growth spurt and shortly after treatment using a facemask in skeletal Class III malocclusion with maxillary deficiency. Methods: We retrospectively studied 50 patients (25 patients per group) with skeletal Class [...] Read more.
Introduction: This retrospective study aimed to determine skeletal and dental changes after a growth spurt and shortly after treatment using a facemask in skeletal Class III malocclusion with maxillary deficiency. Methods: We retrospectively studied 50 patients (25 patients per group) with skeletal Class III malocclusion who underwent facemask treatment with tooth-anchored (T-A, mean age 7.92) and miniscrew-anchored (M-A, mean age 9.84) intraoral appliances. In both groups, the facemask applied a traction force of 350–400 g to each side, such that the traction was directed 30° forward and downward. Lateral cephalometric radiographs were obtained from all patients before (T1), immediately after (T2), and at an average of 37.11 months after maxillary protraction (T3). A total of 13 cephalometric measurements were analyzed to determine the skeletal and dental changes. A paired t-test was used to verify the effects before, after, and during follow-up periods in each group. Results: An anteroposterior relationship, the values of SNA and ANB, evident in both groups at T2, was significantly improved in the M-A group (p < 0.05). However, the values of ANB and MP–SN, which indicate the relapse of anteroposterior and vertical relation of maxilla and mandible, were significantly higher in the T-A group compared with the M-A group during follow-up period. The maxillary first molars were significantly more extruded and maxillary incisors were more protruded in the T-A group than the M-A group, and this persisted at T3 (p < 0.05). Conclusions: Miniscrew-anchored maxillary protraction increased the skeletal improvement of anteroposterior relationship and reduced the dental and skeletal relapses compared with tooth-anchored maxillary protraction in growing patients with a hyperdivergent patterns and skeletal Class III malocclusion. Full article
(This article belongs to the Special Issue Clinical Applications of Orthodontic TSADs and CBCT)
Show Figures

Figure 1

Figure 1
<p>(<b>a</b>) Conventional rapid palatal expansion (RPE) with traction hook. (<b>b</b>) Miniscrew-assisted rapid palatal expansion (MARPE) with traction hook. Two miniscrews were inserted on anterior palate. (<b>c</b>) Petit-type facemask.</p>
Full article ">Figure 2
<p>Reference points and planes.</p>
Full article ">
24 pages, 9475 KiB  
Article
A Hybrid Human Activity Recognition Method Using an MLP Neural Network and Euler Angle Extraction Based on IMU Sensors
by Yaxin Mao, Lamei Yan, Hongyu Guo, Yujie Hong, Xiaocheng Huang and Youwei Yuan
Appl. Sci. 2023, 13(18), 10529; https://doi.org/10.3390/app131810529 - 21 Sep 2023
Cited by 1 | Viewed by 1327
Abstract
Inertial measurement unit (IMU) technology has gained popularity in human activity recognition (HAR) due to its ability to identify human activity by measuring acceleration, angular velocity, and magnetic flux in key body areas like the wrist and knee. It has propelled the extensive [...] Read more.
Inertial measurement unit (IMU) technology has gained popularity in human activity recognition (HAR) due to its ability to identify human activity by measuring acceleration, angular velocity, and magnetic flux in key body areas like the wrist and knee. It has propelled the extensive application of HAR across various domains. In the healthcare sector, HAR finds utility in monitoring and assessing movements during rehabilitation processes, while in the sports science field, it contributes to enhancing training outcomes and preventing exercise-related injuries. However, traditional sensor fusion algorithms often require intricate mathematical and statistical processing, resulting in higher algorithmic complexity. Additionally, in dynamic environments, sensor states may undergo changes, posing challenges for real-time adjustments within conventional fusion algorithms to cater to the requirements of prolonged observations. To address these limitations, we propose a novel hybrid human pose recognition method based on IMU sensors. The proposed method initially calculates Euler angles and subsequently refines them using magnetometer and gyroscope data to obtain the accurate attitude angle. Furthermore, the application of FFT (Fast Fourier Transform) feature extraction facilitates the transition of the signal from its time-based representation to its frequency-based representation, enhancing the practical significance of the data. To optimize feature fusion and information exchange, a group attention module is introduced, leveraging the capabilities of a Multi-Layer Perceptron which is called the Feature Fusion Enrichment Multi-Layer Perceptron (GAM-MLP) to effectively combine features and generate precise classification results. Experimental results demonstrated the superior performance of the proposed method, achieving an impressive accuracy rate of 96.13% across 19 different human pose recognition tasks. The proposed hybrid human pose recognition method is capable of meeting the demands of real-world motion monitoring and health assessment. Full article
(This article belongs to the Special Issue Novel Approaches for Human Activity Recognition)
Show Figures

Figure 1

Figure 1
<p>Identification process of hybrid human activity recognition method using MLP neural network and Euler angle extraction based on IMU sensors.</p>
Full article ">Figure 2
<p>Right hand coordinate transformation, gyroscope, and accelerometer schematic for the human body model.</p>
Full article ">Figure 3
<p>The processing graph for FFT feature extraction.</p>
Full article ">Figure 4
<p>The model architecture of GAM-MLP and the process of action classification.</p>
Full article ">Figure 5
<p>Different activity features of FFT feature extraction.</p>
Full article ">Figure 5 Cont.
<p>Different activity features of FFT feature extraction.</p>
Full article ">Figure 6
<p>Flow chart of action classification and recognition with group attention module.</p>
Full article ">Figure 7
<p>Flow chart depicting the classification and recognition in the MLP of layer plus SoftMax layer.</p>
Full article ">Figure 8
<p>MultiportGAM dataset for sensors-based tester.</p>
Full article ">Figure 9
<p>Exercising within a sample 5 s on a stepper acceleration time-domain diagram; (<b>a</b>) description of the original data before sliding window denoising processing; (<b>b</b>) description of the data after sliding window denoising processing.</p>
Full article ">Figure 10
<p>Accuracy scores obtained with different sliding window sizes, sampling frequencies, and machine learning algorithms.</p>
Full article ">Figure 10 Cont.
<p>Accuracy scores obtained with different sliding window sizes, sampling frequencies, and machine learning algorithms.</p>
Full article ">Figure 11
<p>Accuracy and Loss of GAM-MLP on both training and test sets.</p>
Full article ">Figure 12
<p>Classification performance of six commonly used actions on the MultiportGAM dataset.</p>
Full article ">Figure 13
<p>Classification performance of six commonly used actions on the PAMAP2 dataset.</p>
Full article ">Figure 14
<p>(<b>a</b>) Comparison of ablation experiments with preservation and removal of GAM on the MultiportGAM dataset. (<b>b</b>) Comparison of ablation experiments with preservation and removal of GAM on the PAMAP2 dataset.</p>
Full article ">Figure 15
<p>The confusion matrix for 19 types of action recognition on the MultiportGAM dataset.</p>
Full article ">
19 pages, 2395 KiB  
Article
Improving Collaborative Filtering Recommendations with Tag and Time Integration in Virtual Online Communities
by Hyeon Jo, Jong-hyun Hong and Joon Yeon Choeh
Appl. Sci. 2023, 13(18), 10528; https://doi.org/10.3390/app131810528 - 21 Sep 2023
Viewed by 1013
Abstract
In recent years, virtual online communities have experienced rapid growth. These communities enable individuals to share and manage images or websites by employing tags. A collaborative tagging system (CTS) facilitates the process by which internet users collectively organize resources. CTS offers a plethora [...] Read more.
In recent years, virtual online communities have experienced rapid growth. These communities enable individuals to share and manage images or websites by employing tags. A collaborative tagging system (CTS) facilitates the process by which internet users collectively organize resources. CTS offers a plethora of useful information, including tags and timestamps, which can be utilized for recommendations. A tag represents an implicit evaluation of the user’s preference for a particular resource, while timestamps indicate changes in the user’s interests over time. As the amount of information increases, it is feasible to integrate more detailed data, such as tags and timestamps, to improve the quality of personalized recommendations. The current study employs collaborative filtering (CF), which incorporates both tag and time information to enhance recommendation precision. A computational recommender system is established to generate weights and calculate similarities by incorporating tag data and time. The effectiveness of our recommendation model was evaluated by linearly merging tag and time data. In addition, the proposed CF method was validated by applying it to big data sets in the real world. To assess its performance, the size of the neighborhood was adjusted in accordance with the standard CF procedure. The experimental results indicate that our proposed method significantly improves the quality of recommendations compared to the basic CF approach. Full article
(This article belongs to the Special Issue High-Performance Computing, Networking and Artificial Intelligence)
Show Figures

Figure 1

Figure 1
<p>Precision comparisons for different neighborhood sizes using the Margarin dataset.</p>
Full article ">Figure 2
<p>Recall comparisons for different neighborhood sizes using Margarin dataset.</p>
Full article ">Figure 3
<p>F-measure comparisons for different neighborhood sizes using Margarin dataset.</p>
Full article ">Figure 4
<p>Precision comparisons for different neighborhood sizes using the Delicious dataset.</p>
Full article ">Figure 5
<p>Recall comparisons for different neighborhood sizes using Delicious dataset.</p>
Full article ">Figure 6
<p>F-measure comparisons for different neighborhood sizes using the Delicious dataset.</p>
Full article ">
16 pages, 2975 KiB  
Article
Lateral Vibration Control Strategy of High-Speed Elevator Car Based on Sparrow Search Optimization Algorithm
by Wanbin Su, Yefeng Jiang, Cancan Yi and Shuhang Li
Appl. Sci. 2023, 13(18), 10527; https://doi.org/10.3390/app131810527 - 21 Sep 2023
Cited by 2 | Viewed by 990
Abstract
Aiming at the problems of inefficient mitigation of the lateral vibration of high-speed elevator cars, which results in low riding comfort, this paper introduces the electromagnetic active rolling guide shoes and incorporates the sky-hook damping control strategy into the high-speed elevator structure. On [...] Read more.
Aiming at the problems of inefficient mitigation of the lateral vibration of high-speed elevator cars, which results in low riding comfort, this paper introduces the electromagnetic active rolling guide shoes and incorporates the sky-hook damping control strategy into the high-speed elevator structure. On this basis, it adopts an optimization algorithm based on Sparrow Search Algorithm (SSA) to adjust the parameters of the lateral vibration controller, thereby reducing the amplitude of the lateral vibration and controlling it within the human comfort range. Specifically, this paper first incorporates electromagnetic active rolling guide shoes into the vibration reduction device of the high-speed elevator car. Based on the motion characteristics of lateral vibration, a mathematical model is established in which the sky-hook damping control strategy is introduced. Then, a simulation model is built, and the damping parameters of the controller are optimized using the SSA, resulting in effective control of the lateral vibration amplitude of the high-speed elevator car. Simulations demonstrate that the lateral vibration control model of the high-speed elevator car, optimized by SSA, achieves lower amplitudes within the frequency range of 1–2 Hz compared to the results obtained by the Genetic Algorithm (GA), demonstrating the effectiveness of SSA in optimizing the damping parameters of the car controller. Finally, the simulation results are compared with the measured data, and the research findings indicate that the proposed method for lateral vibration control of the car can effectively suppress the lateral vibration amplitude. Full article
Show Figures

Figure 1

Figure 1
<p>Structure diagram of electromagnetic active rolling guide shoes.</p>
Full article ">Figure 2
<p>Structure diagram of the high-speed elevator car and guide system (<b>a</b>) Translational motion (<b>b</b>) Pitching motion (<b>c</b>) Roll motion.</p>
Full article ">Figure 3
<p>The flow chart of lateral vibration control model of high-speed elevator.</p>
Full article ">Figure 4
<p>Simulink simulation model.</p>
Full article ">Figure 5
<p>Elevator car rolling model.</p>
Full article ">Figure 6
<p>Elevator car pitching model.</p>
Full article ">Figure 7
<p>Elevator car horizontal model.</p>
Full article ">Figure 8
<p>Fitness curve of two algorithms.</p>
Full article ">Figure 9
<p>Vibration spectrum chart (simulation) (<b>a</b>) Vibration-free control spectrum chart (<b>b</b>) Optimized vibration control spectrum chart.</p>
Full article ">Figure 10
<p>Field test picture.</p>
Full article ">Figure 11
<p>Tester analysis report.</p>
Full article ">Figure 12
<p>Vibration spectrum in X and Y axes (<b>a</b>) X-axis direction; (<b>b</b>) Y-axis direction.</p>
Full article ">
16 pages, 876 KiB  
Article
QZRAM: A Transparent Kernel Memory Compression System Design for Memory-Intensive Applications with QAT Accelerator Integration
by Chi Gao, Xiaofei Xu, Zhizou Yang, Liwei Lin and Jian Li
Appl. Sci. 2023, 13(18), 10526; https://doi.org/10.3390/app131810526 - 21 Sep 2023
Cited by 1 | Viewed by 2087
Abstract
In recent decades, memory-intensive applications have experienced a boom, e.g., machine learning, natural language processing (NLP), and big data analytics. Such applications often experience out-of-memory (OOM) errors, which cause unexpected processes to exit without warning, resulting in negative effects on a system’s performance [...] Read more.
In recent decades, memory-intensive applications have experienced a boom, e.g., machine learning, natural language processing (NLP), and big data analytics. Such applications often experience out-of-memory (OOM) errors, which cause unexpected processes to exit without warning, resulting in negative effects on a system’s performance and stability. To mitigate OOM errors, many operating systems implement memory compression (e.g., Linux’s ZRAM) to provide flexible and larger memory space. However, these schemes incur two problems: (1) high-compression algorithms consume significant CPU resources, which inevitably degrades application performance; and (2) compromised compression algorithms with low latency and low compression ratios result in insignificant increases in memory space. In this paper, we propose QZRAM, which achieves a high-compression-ratio algorithm without high computing consumption through the integration of QAT (an ASIC accelerator) into ZRAM. To enhance hardware and software collaboration, a page-based parallel write module is introduced to serve as a more efficient request processing flow. More importantly, a QAT offloading module is introduced to asynchronously offload compression to the QAT accelerator, reducing CPU computing resource consumption and addressing two challenges: long CPU idle time and low usage of the QAT unit. The comprehensive evaluation validates that QZRAM can reduce CPU resources by up to 49.2% for the FIO micro-benchmark, increase memory space (1.66×) compared to ZRAM, and alleviate the memory overflow phenomenon of the Redis benchmark. Full article
(This article belongs to the Special Issue Cross-Applications of Natural Language Processing and Text Mining)
Show Figures

Figure 1

Figure 1
<p>ZRAM module.</p>
Full article ">Figure 2
<p>ZRAM processing flow.</p>
Full article ">Figure 3
<p>Direct offloading mode.</p>
Full article ">Figure 4
<p>Overall architecture of QZRAM.</p>
Full article ">Figure 5
<p>Page-based parallel write module.</p>
Full article ">Figure 6
<p>QAT asynchronous offloading design.</p>
Full article ">Figure 7
<p>Write throughput and latency with different block sizes.</p>
Full article ">Figure 8
<p>Performance of different IO patterns.</p>
Full article ">Figure 9
<p>Performance of different workloads.</p>
Full article ">Figure 10
<p>Performance of different workloads.</p>
Full article ">Figure 11
<p>Performance in Redis benchmark testing.</p>
Full article ">
18 pages, 3181 KiB  
Article
Investigation of the Thermodynamics for the Removal of As(III) and As(V) from Water Using Synthesized ZnO Nanoparticles and the Effects of pH, Temperature, and Time
by Helia Magali Morales, Grecia Torreblanca, Arnulfo Mar, Mataz Alcoutlabi, Thomas Mark Eubanks, Erik Plata and Jason George Parsons
Appl. Sci. 2023, 13(18), 10525; https://doi.org/10.3390/app131810525 - 21 Sep 2023
Cited by 3 | Viewed by 1075
Abstract
In the present study, the removal of both As(III) and As(V) from aqueous solutions using synthesized ZnO nanomaterials was achieved. The ZnO nanomaterial was synthesized using a precipitation technique and characterized using XRD, SEM, and Raman spectroscopy. XRD confirmed the ZnO nanoparticles were [...] Read more.
In the present study, the removal of both As(III) and As(V) from aqueous solutions using synthesized ZnO nanomaterials was achieved. The ZnO nanomaterial was synthesized using a precipitation technique and characterized using XRD, SEM, and Raman spectroscopy. XRD confirmed the ZnO nanoparticles were present in the hexagonal wurtzite structure. SEM of the particles showed they were aggregates of triangular and spherical particles. The average nanoparticle size was determined to be 62.03 ± 4.06 nm using Scherrer’s analysis of the three largest diffraction peaks. Raman spectroscopy of the ZnO nanoparticles showed only ZnO peaks, whereas the after-reaction samples indicated that As(V) was present in both As(V)- and As(III)-reacted samples. The adsorption of the ions was determined to be pH-independent, and a binding pH of 4 was selected as the pH for reaction. Batch isotherm studies showed the highest binding capacities occurred at 4 °C with 5.83 mg/g and 14.68 mg/g for As(III) and As(V), respectively. Thermodynamic studies indicated an exothermic reaction occurred and the binding of both As(III) and As(VI) took place through chemisorption, which was determined by the ΔH values of −47.29 and −63.4 kJ/mol for As(V) and As(III), respectively. In addition, the change in Gibbs free energy, ΔG, for the reaction confirmed the exothermic nature of the reaction; the spontaneity of the reaction decreased with increasing temperature. Results from batch time dependency studies showed the reaction occurred within the first 60 min of contact time. Full article
(This article belongs to the Section Nanotechnology and Applied Nanosciences)
Show Figures

Figure 1

Figure 1
<p>Powder XRD and Le Bail fitting of the synthesized ZnO nanomaterial.</p>
Full article ">Figure 2
<p>SEM of as synthesized ZnO nanoparticles from 30 mM ZnNO<sub>3</sub> solution.</p>
Full article ">Figure 3
<p>Effect of pH on the binding of both As(III) and As(V) to the synthesized ZnO nanomaterials.</p>
Full article ">Figure 4
<p>Zeta potential of synthesized ZnO nanoparticles measured at pH 2 through pH 6.</p>
Full article ">Figure 5
<p>Powder X-ray diffraction patterns of ZnO after reaction with As(III) (<b>A</b>) and As(V) (<b>B</b>).</p>
Full article ">Figure 6
<p>RAMAN spectra of ZnO reacted with As(III), ZnO reacted with As(V), and pure ZnO nanoparticles.</p>
Full article ">Figure 7
<p>(<b>A</b>) Langmuir isotherm plot of the binding of As(III) to the ZnO synthesized nanomaterials. (<b>B</b>) Langmuir isotherm plot of the binding of As(V) to the ZnO synthesized nanomaterials.</p>
Full article ">Figure 8
<p>(<b>A</b>) Thermodynamics plot for the binding of As(III) to the ZnO synthesized nanomaterials. (<b>B</b>) Thermodynamics plot for the binding of As(V) to the ZnO synthesized nanomaterials.</p>
Full article ">Figure 9
<p>(<b>A</b>) Time dependency for the binding of As(III) to the ZnO synthesized nanomaterials. (<b>B</b>) Time dependency for the binding of As(V) to the ZnO synthesized nanomaterials.</p>
Full article ">
Previous Issue
Back to TopTop