[go: up one dir, main page]

Next Issue
Volume 8, April
Previous Issue
Volume 8, February


Atmosphere, Volume 8, Issue 3 (March 2017) – 20 articles

Cover Story (view full-size image): 
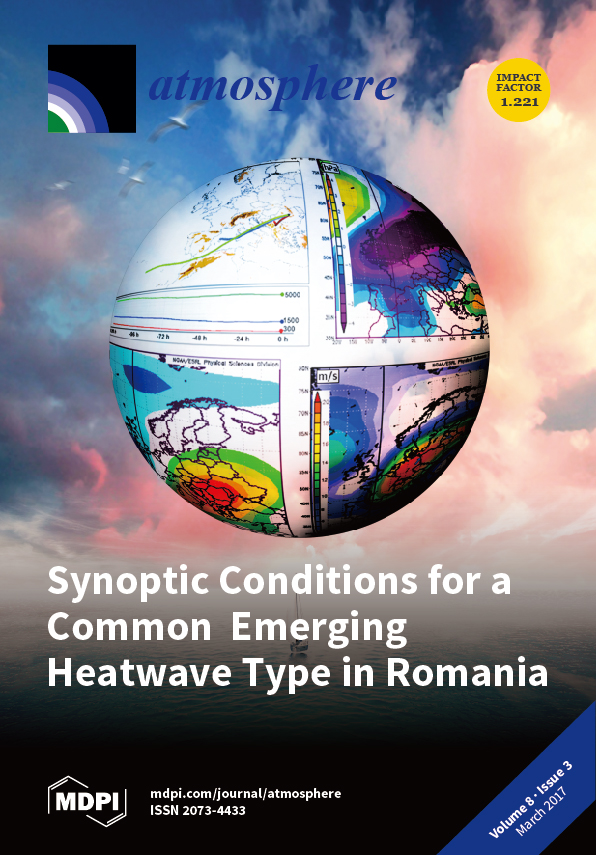
Heatwaves with synoptic background presenting a cyclonic curvature has become more common over the last two decades in Romania, especially during the warm season. They are related mainly to radiative conditions enhanced by warm ridges in the middle troposphere, while in the lower troposphere a low advection intensity from Southwestern Europe and important positive temperature anomalies prevail. By Lucian Sfîca and Adina-Eliza Croitoru. View this paper
  • Issues are regarded as officially published after their release is announced to the table of contents alert mailing list.
  • You may sign up for e-mail alerts to receive table of contents of newly released issues.
  • PDF is the official format for papers published in both, html and pdf forms. To view the papers in pdf format, click on the "PDF Full-text" link, and use the free Adobe Reader to open them.
Order results
Result details
Section
Select all
Export citation of selected articles as:
2451 KiB  
Article
Characteristics and Formation Mechanisms of Fine Particulate Nitrate in Typical Urban Areas in China
by Xinlei Ge, Yanan He, Yele Sun, Jianzhong Xu, Junfeng Wang, Yafei Shen and Mindong Chen
Atmosphere 2017, 8(3), 62; https://doi.org/10.3390/atmos8030062 - 22 Mar 2017
Cited by 55 | Viewed by 8416
Abstract
Nitrate is a very important aerosol component, thus elucidation of its characteristics and formation mechanisms is essential and important for effective reduction of aerosol pollution. In this work, highly time-resolved submicron aerosol (PM1) data measured by Aerodyne aerosol mass spectrometers (AMS) [...] Read more.
Nitrate is a very important aerosol component, thus elucidation of its characteristics and formation mechanisms is essential and important for effective reduction of aerosol pollution. In this work, highly time-resolved submicron aerosol (PM1) data measured by Aerodyne aerosol mass spectrometers (AMS) in Nanjing, Beijing and Lanzhou during both summer and winter were integrated to investigate the nitrate behaviors in urban China air. Results showed that nitrate occupied 1/8–1/4 of PM1 mass, typically higher than those observed in rural/remote regions. Relative mass fractions of nitrate also varied significantly at different pollution levels. Nitrate mass fractions generally increased with the increase of PM1 loadings during summer, while the contributions during winter increased first and then decreased with the increase of pollution levels. We further propose that there are at least three mechanisms that likely govern the urban nitrate behaviors: Type I—thermodynamics driven, Type II—photochemistry driven, and Type III—planetary boundary layer (PBL) dynamics driven. Analyses of the ammonium-sulfate-nitrate data revealed that ammonium nitrate was able to form before sulfuric acid was fully neutralized in some urban areas. Our findings provide useful insights into the characterization and reduction of fine particulate nitrate pollution. Full article
(This article belongs to the Section Air Quality)
Show Figures

Figure 1

Figure 1
<p>Sampling periods, locations, and aerosol mass spectrometers (AMS) versions of the datasets used in this work.</p>
Full article ">Figure 2
<p>Average fine aerosol particulate matter (PM<sub>1</sub>) mass loadings, chemical compositions and diurnal variations of the mass concentrations of nitrate: (<b>a</b>,<b>b</b>) Nanjing summer, (<b>c</b>,<b>d</b>) Nanjing winter, (<b>e</b>,<b>f</b>) Beijing summer, (<b>g</b>,<b>h</b>) Beijing winter, (<b>i</b>,<b>j</b>) Lanzhou summer, and (<b>k</b>,<b>l</b>) Lanzhou winter (Beijing datasets did not include refractory black carbon (<span class="html-italic">r</span>BC); the whiskers above and below the boxes are the 90th and 10th percentiles, the upper and lower boundaries of the boxes are the 75th and 25th percentiles, and the lines in the boxes indicate the median values and the dots indicate the mean values; note <a href="#atmosphere-08-00062-f002" class="html-fig">Figure 2</a>e–l are reproduced and modified from previous studies [<a href="#B28-atmosphere-08-00062" class="html-bibr">28</a>,<a href="#B29-atmosphere-08-00062" class="html-bibr">29</a>,<a href="#B31-atmosphere-08-00062" class="html-bibr">31</a>,<a href="#B32-atmosphere-08-00062" class="html-bibr">32</a>]).</p>
Full article ">Figure 3
<p>Diurnal patterns of temperature (top panel, left <span class="html-italic">y</span> axis), relative humidity (RH) (top panel, right <span class="html-italic">y</span> axis), nitrate concentration (bottom panel, left <span class="html-italic">y</span> axis), solar radiation and equilibrium constant (<span class="html-italic">K</span><sub>p</sub>) of ammonium nitrate (bottom panel, right <span class="html-italic">y</span> axis) (<math display="inline"> <semantics> <mrow> <msub> <mi mathvariant="normal">K</mi> <mi mathvariant="normal">p</mi> </msub> <mo>=</mo> <msub> <mi mathvariant="normal">K</mi> <mi mathvariant="normal">p</mi> </msub> <mrow> <mo>(</mo> <mrow> <mn>298</mn> </mrow> <mo>)</mo> </mrow> <mi>exp</mi> <mrow> <mo>{</mo> <mrow> <mi mathvariant="normal">a</mi> <mrow> <mo>(</mo> <mrow> <mfrac> <mrow> <mn>298</mn> </mrow> <mi mathvariant="normal">T</mi> </mfrac> <mo>−</mo> <mn>1</mn> </mrow> <mo>)</mo> </mrow> <mo>+</mo> <mi mathvariant="normal">b</mi> <mrow> <mo>[</mo> <mrow> <mn>1</mn> <mo>+</mo> <mi>ln</mi> <mrow> <mo>(</mo> <mrow> <mfrac> <mrow> <mn>298</mn> </mrow> <mi mathvariant="normal">T</mi> </mfrac> </mrow> <mo>)</mo> </mrow> <mo>−</mo> <mfrac> <mrow> <mn>298</mn> </mrow> <mi mathvariant="normal">T</mi> </mfrac> </mrow> <mo>]</mo> </mrow> </mrow> <mo>}</mo> </mrow> </mrow> </semantics> </math>, for reaction NH<sub>4</sub>NO<sub>3</sub>(p) ↔ NH<sub>3</sub>(g) + HNO<sub>3</sub>(g). <span class="html-italic">K</span><sub>p</sub>(298) is the equilibrium constant at 298 K (3.36 × 10<sup>16</sup> atm<sup>−2</sup>), a = 75.11 and b = −13.5 [<a href="#B16-atmosphere-08-00062" class="html-bibr">16</a>]): (<b>a</b>) Nanjing summer, (<b>b</b>) Nanjing winter, (<b>c</b>) Beijing summer, (<b>d</b>) Beijing winter, (<b>e</b>) Lanzhou summer, and (<b>f</b>) Lanzhou winter. (Type I—thermodynamics driven; Type II—photochemistry driven; Type III—PBL dynamics driven. Please refer to the main text for more details).</p>
Full article ">Figure 4
<p>Variations of the mass percentages of nitrate as a function of the total non-refractory PM<sub>1</sub> (NR-PM<sub>1</sub>)concentrations (left <span class="html-italic">y</span> axis, note the NR-PM<sub>1</sub> did not include <span class="html-italic">r</span>BC for all datasets in this figure), and the percentage of data points in each bin (right <span class="html-italic">y</span> axis): (<b>a</b>) Nanjing summer, (<b>b</b>) Nanjing winter, (<b>c</b>) Beijing summer, (<b>d</b>) Beijing winter, (<b>e</b>) Lanzhou summer, and (<b>f</b>) Lanzhou winter (the box plot symbols are the same as those described in <a href="#atmosphere-08-00062-f001" class="html-fig">Figure 1</a>; note <a href="#atmosphere-08-00062-f004" class="html-fig">Figure 4</a>c–f are reproduced and modified from previous studies [<a href="#B28-atmosphere-08-00062" class="html-bibr">28</a>,<a href="#B29-atmosphere-08-00062" class="html-bibr">29</a>,<a href="#B31-atmosphere-08-00062" class="html-bibr">31</a>,<a href="#B32-atmosphere-08-00062" class="html-bibr">32</a>]).</p>
Full article ">Figure 5
<p>Scatter plots of the molar concentrations of excess NH<sub>4</sub><sup>+</sup> relative to (NH<sub>4</sub>)<sub>2</sub>SO<sub>4</sub> versus NO<sub>3</sub><sup>−</sup> (the NH<sub>4</sub><sup>+</sup> molar concentrations were the measured NH<sub>4</sub><sup>+</sup> molar concentrations minus the amounts used to neutralize HCl): (<b>a</b>) Nanjing summer, (<b>b</b>) Nanjing winter, (<b>c</b>) Beijing summer, (<b>d</b>) Beijing winter, (<b>e</b>) Lanzhou summer, and (<b>f</b>) Lanzhou winter (data pointes were colored by time).</p>
Full article ">
30236 KiB  
Article
Atmospheric Volatile Organic Compounds in a Typical Urban Area of Beijing: Pollution Characterization, Health Risk Assessment and Source Apportionment
by Hao Zhang, Hong Li, Qingzhu Zhang, Yujie Zhang, Weiqi Zhang, Xuezhong Wang, Fang Bi, Fahe Chai, Jian Gao, Lingshuo Meng, Ting Yang, Yizhen Chen, Qi Cheng and Fenmei Xia
Atmosphere 2017, 8(3), 61; https://doi.org/10.3390/atmos8030061 - 21 Mar 2017
Cited by 100 | Viewed by 9292
Abstract
Atmospheric volatile organic compounds (VOCs) measurement was carried out using gas chromatography-flame ionization detector (GC-FID) technique (Airmo VOCs online analyzer) in a typical urban area in Beijing from April 2014 to January 2015. Ambient levels, variation characteristics and influential factors contributing to the [...] Read more.
Atmospheric volatile organic compounds (VOCs) measurement was carried out using gas chromatography-flame ionization detector (GC-FID) technique (Airmo VOCs online analyzer) in a typical urban area in Beijing from April 2014 to January 2015. Ambient levels, variation characteristics and influential factors contributing to the formation of near-ground-ozone and secondary organic aerosols as well as health risk assessment of VOCs were analyzed. Based on these analyses, the important VOC species that should be given more attention for pollution control were identified and the source apportionment of VOCs was made. Suggestions for VOCs pollution control countermeasures were put forward. The annual average concentration of 84 VOCs was 119 μg·m−3 and the hourly mean concentration was 9.11–567 μg·m−3. Ambient level of VOCs in Beijing has been alleviated in recent years, but is still severe compared to some other cities. VOCs with the largest proportion were alkanes in spring and halogenated hydrocarbons in summer, autumn and winter. The variation of 84 VOCs concentrations was consistent with that of the ambient air quality index, indicating that VOCs had a strong influence on ambient air quality. Influenced by the concentration and activity of VOCs, the largest contribution to ozone formation potential and secondary organic aerosol formation potential came from alkenes and aromatic hydrocarbons, respectively. Five VOCs species such as benzene pose carcinogenic risk to exposed populations. Contrary to some previous studies, benzene was found to have potential cancer risk in some urban areas in China. The main sources of VOCs in the study area were vehicle exhaust, solvent usage, and industrial processes. In order to improve air quality in Beijing and reduce the infection rate of air pollutant related diseases, it is necessary to strengthen the control the emission of VOCs from those three sources. Full article
(This article belongs to the Section Air Quality)
Show Figures

Figure 1

Figure 1
<p>Location of monitoring site and surroundings. (① VOCs monitoring and conventional pollutants sampling sites; and ② meteorological data observation sites).</p>
Full article ">Figure 2
<p>Time series of ambient VOCs mass concentration.</p>
Full article ">Figure 3
<p>The seasonal and annual variations of 84 VOCs.</p>
Full article ">Figure 4
<p>The average of mass concentration of 14 VOCs in ambient air in Beijing and other cities.</p>
Full article ">Figure 5
<p>Daily average variation of mass concentration of 84 VOCs and AQI.</p>
Full article ">Figure 5 Cont.
<p>Daily average variation of mass concentration of 84 VOCs and AQI.</p>
Full article ">Figure 6
<p>Diurnal variation of 84 VOCs.</p>
Full article ">Figure 7
<p>Diurnal variation of mass concentration of 84 VOCs.</p>
Full article ">Figure 8
<p>Variation of mass concentration of 84 VOCs, conventional pollutants, and meteorological factors in summer.</p>
Full article ">Figure 9
<p>Variation of mass concentration of 84 VOCs, conventional pollutants, and meteorological factors in winter.</p>
Full article ">Figure 10
<p>OFP contribution of various VOCs in each season.</p>
Full article ">Figure 11
<p>Ozone concentration and OFP contribution of 51 VOCs.</p>
Full article ">Figure 12
<p>SOAFP contribution of various VOCs in each season.</p>
Full article ">Figure 13
<p>Daily variation of PM<sub>2.5</sub>, SOAs and SOAFP of 30 VOCs (daily averaged).</p>
Full article ">Figure 14
<p>Main sources of VOCs in ambient air during spring and their contributions.</p>
Full article ">Figure 15
<p>Contribution of each emission source in the four seasons.</p>
Full article ">
6598 KiB  
Article
The Generation and Propagation of Atmospheric Internal Waves Caused by Volcanic Eruptions
by Peter G. Baines and Selwyn Sacks
Atmosphere 2017, 8(3), 60; https://doi.org/10.3390/atmos8030060 - 21 Mar 2017
Cited by 5 | Viewed by 5166
Abstract
Observations from the island of Montserrat in the Caribbean have shown that volcanic eruptions (particularly explosive ones) can generate internal waves in the atmosphere that can be observed by microbarographs at ground level. It is possible that observations of such waves may give [...] Read more.
Observations from the island of Montserrat in the Caribbean have shown that volcanic eruptions (particularly explosive ones) can generate internal waves in the atmosphere that can be observed by microbarographs at ground level. It is possible that observations of such waves may give early information about volcanic eruptions when other methods are unavailable (because of bad weather, nocturnal eruptions, and poor visibility or remoteness), if it is possible to interpret them. This paper describes a dynamical model of the forcing of internal waves in which the eruption is modelled as a turbulent plume, forced by a source of buoyancy at ground level that specifies the total height and relevant properties of the eruption. Specifically, the rising plume entrains environmental air from ground level to 70% of its maximum height zM, and above 0.7zM the rising fluid spreads radially. During the eruption, this flow forces horizontal motion in the surrounding fluid that generates internal waves, which may be computed by assuming that this is due to a linear dynamical process. Properties of the resulting waves are described for a variety of parameters that include the strength and height of the eruption, the effect of the tropopause, generation in the stratosphere for large eruptions, and the differing effects of the duration of the eruption. Implications for characterising eruptions from observations of these properties are discussed. Full article
(This article belongs to the Special Issue Atmospheric Gravity Waves)
Show Figures

Figure 1

Figure 1
<p>Schematic model of the horizontal velocity field on a circular cylinder surrounding a turbulent plume, as the model for an eruption. The flow consists of an upper level spreading zone centred on the level <span class="html-italic">z<sub>final</sub></span>, with entrained inflow below.</p>
Full article ">Figure 2
<p>Vertical profile and annual cycle of the buoyancy frequency <span class="html-italic">N</span> in the vicinity of the Caribbean island of Montserrat. The individual coloured lines show the annual cycle of <span class="html-italic">N</span>-values at their respective levels. Other locations at mid-latitudes show similar behaviour—the dominant feature for present purposes is the large change in <span class="html-italic">N</span> across the tropopause, here taken at a height of 14 km, throughout the annual cycle.</p>
Full article ">Figure 3
<p>Schematic diagram of a wave packet with a dominant frequency <span class="html-italic">ω</span>, incident from below on the tropopause (represented as a discontinuity in <span class="html-italic">N</span>). The thick arrow denotes the direction of the group velocity and motion of the wave packet, and the dashed arrow denotes the direction of the phase velocity. The impact of the wave packet on the tropopause results in a reflected wave of smaller amplitude, and a transmitted wave, also of smaller amplitude, with overall energy conserved.</p>
Full article ">Figure 4
<p>The time series of surface pressure signals in mb, forced at radius <span class="html-italic">a</span> = 1 km, at distances <span class="html-italic">R = r</span>/<span class="html-italic">a</span> = 1, 3, 5 and 10, for eruptions of short duration that reach maximum heights <span class="html-italic">z<sub>M</sub></span> where (<b>a</b>) <span class="html-italic">z<sub>M</sub></span>/<span class="html-italic">z<sub>T</sub></span> = 0.24, (<b>b</b>) 0.5, (<b>c</b>) 0.76 and (<b>d</b>) 1. Here, <span class="html-italic">z<sub>T</sub></span> <span class="html-italic">=</span> 14 km, and <span class="html-italic">H</span><sub>s</sub> = 9 km, and <span class="html-italic">h<sub>n</sub></span> coefficients are given in <a href="#atmosphere-08-00060-f012" class="html-fig">Figure A1</a>. The eruption grows linearly for a period of 2 min, and then decays rapidly with an exponential time scale of 10 s. Note the increasing amplitude with <span class="html-italic">z<sub>M</sub></span>, and the general similarity between the various figures.</p>
Full article ">Figure 4 Cont.
<p>The time series of surface pressure signals in mb, forced at radius <span class="html-italic">a</span> = 1 km, at distances <span class="html-italic">R = r</span>/<span class="html-italic">a</span> = 1, 3, 5 and 10, for eruptions of short duration that reach maximum heights <span class="html-italic">z<sub>M</sub></span> where (<b>a</b>) <span class="html-italic">z<sub>M</sub></span>/<span class="html-italic">z<sub>T</sub></span> = 0.24, (<b>b</b>) 0.5, (<b>c</b>) 0.76 and (<b>d</b>) 1. Here, <span class="html-italic">z<sub>T</sub></span> <span class="html-italic">=</span> 14 km, and <span class="html-italic">H</span><sub>s</sub> = 9 km, and <span class="html-italic">h<sub>n</sub></span> coefficients are given in <a href="#atmosphere-08-00060-f012" class="html-fig">Figure A1</a>. The eruption grows linearly for a period of 2 min, and then decays rapidly with an exponential time scale of 10 s. Note the increasing amplitude with <span class="html-italic">z<sub>M</sub></span>, and the general similarity between the various figures.</p>
Full article ">Figure 5
<p>As for <a href="#atmosphere-08-00060-f004" class="html-fig">Figure 4</a>, but with increasing duration of eruptions at a constant rate after a 2-min. buildup. The total time of the eruption is: (<b>a</b>) 4 min; (<b>b</b>) 12 min; and (<b>c</b>) 28 min. The initial decrease in pressure is present in all cases, but the subsequent maximum is increasingly delayed, and could be regarded as a long period wave, from observations.</p>
Full article ">Figure 6
<p>The time series of surface pressure signals in mb, forced at radius <span class="html-italic">a</span> = 1 km within the troposphere at distances <span class="html-italic">R = r</span>/<span class="html-italic">a</span> = 1, 3, 5, and 10 for eruptions that reach maximum heights <span class="html-italic">z<sub>M</sub></span> where <span class="html-italic">z<sub>M</sub></span>/<span class="html-italic">z<sub>T</sub></span> equals: (<b>a</b>) 1.2; (<b>b</b>) 1.6; (<b>c</b>) 1.8; and (<b>d</b>) 2. Here, <span class="html-italic">z<sub>T</sub> =</span> 14 km, <span class="html-italic">H</span><sub>s</sub> = 9 km, and <span class="html-italic">h</span>(<span class="html-italic">n</span>) coefficients are given in <a href="#atmosphere-08-00060-f013" class="html-fig">Figure A2</a>. Note the decreasing amplitude with increasing <span class="html-italic">z<sub>M</sub></span>, and the general similarity that holds between <span class="html-italic">z<sub>M</sub></span> = <span class="html-italic">z<sub>T</sub></span> and <span class="html-italic">z<sub>M</sub></span> = 1.6<span class="html-italic">z<sub>T</sub></span>.</p>
Full article ">Figure 6 Cont.
<p>The time series of surface pressure signals in mb, forced at radius <span class="html-italic">a</span> = 1 km within the troposphere at distances <span class="html-italic">R = r</span>/<span class="html-italic">a</span> = 1, 3, 5, and 10 for eruptions that reach maximum heights <span class="html-italic">z<sub>M</sub></span> where <span class="html-italic">z<sub>M</sub></span>/<span class="html-italic">z<sub>T</sub></span> equals: (<b>a</b>) 1.2; (<b>b</b>) 1.6; (<b>c</b>) 1.8; and (<b>d</b>) 2. Here, <span class="html-italic">z<sub>T</sub> =</span> 14 km, <span class="html-italic">H</span><sub>s</sub> = 9 km, and <span class="html-italic">h</span>(<span class="html-italic">n</span>) coefficients are given in <a href="#atmosphere-08-00060-f013" class="html-fig">Figure A2</a>. Note the decreasing amplitude with increasing <span class="html-italic">z<sub>M</sub></span>, and the general similarity that holds between <span class="html-italic">z<sub>M</sub></span> = <span class="html-italic">z<sub>T</sub></span> and <span class="html-italic">z<sub>M</sub></span> = 1.6<span class="html-italic">z<sub>T</sub></span>.</p>
Full article ">Figure 7
<p>The time series of surface pressure signals in mb, forced at radius <span class="html-italic">a</span> = 1 km within the stratosphere at distances <span class="html-italic">R = r</span>/<span class="html-italic">a</span> = 1, 3, 5, 10, 15 and 20 for eruptions that reach maximum heights <span class="html-italic">z<sub>M</sub></span> where <span class="html-italic">z<sub>M</sub></span>/<span class="html-italic">z<sub>T</sub></span> = (<b>a</b>) 1.2, (<b>b</b>) 1.6, and (<b>c</b>) 2. Here, <span class="html-italic">z<sub>T</sub> =</span> 14 km, <span class="html-italic">H</span><sub>s</sub> = 9 km, and <span class="html-italic">B</span>(<span class="html-italic">n</span>) coefficients are given in <a href="#atmosphere-08-00060-f014" class="html-fig">Figure A3</a>. There is an increasing amplitude and progressive change in sign of the response with increasing <span class="html-italic">z<sub>M</sub></span> for <span class="html-italic">z<sub>M</sub></span> &gt; 1.4.</p>
Full article ">Figure 7 Cont.
<p>The time series of surface pressure signals in mb, forced at radius <span class="html-italic">a</span> = 1 km within the stratosphere at distances <span class="html-italic">R = r</span>/<span class="html-italic">a</span> = 1, 3, 5, 10, 15 and 20 for eruptions that reach maximum heights <span class="html-italic">z<sub>M</sub></span> where <span class="html-italic">z<sub>M</sub></span>/<span class="html-italic">z<sub>T</sub></span> = (<b>a</b>) 1.2, (<b>b</b>) 1.6, and (<b>c</b>) 2. Here, <span class="html-italic">z<sub>T</sub> =</span> 14 km, <span class="html-italic">H</span><sub>s</sub> = 9 km, and <span class="html-italic">B</span>(<span class="html-italic">n</span>) coefficients are given in <a href="#atmosphere-08-00060-f014" class="html-fig">Figure A3</a>. There is an increasing amplitude and progressive change in sign of the response with increasing <span class="html-italic">z<sub>M</sub></span> for <span class="html-italic">z<sub>M</sub></span> &gt; 1.4.</p>
Full article ">Figure 8
<p>Total surface pressure signals from eruptions that extend into the stratosphere: (<b>a</b>) <span class="html-italic">z<sub>M</sub></span> = 1.2<span class="html-italic">z<sub>T</sub></span>; (<b>b</b>) <span class="html-italic">z<sub>M</sub></span> = 1.6<span class="html-italic">z<sub>T</sub></span>; and (<b>c</b>) <span class="html-italic">z</span><sub>M</sub> = 2<span class="html-italic">z</span><sub>T</sub>. Parameter values are mostly similar to preceding figures: <span class="html-italic">a</span> = 1 km, <span class="html-italic">N</span><sub>1</sub> = 0.012 s<sup>−1</sup>, <span class="html-italic">N</span><sub>2</sub> = 0.024 s<sup>−1</sup>, and the forcing grows at a uniform rate for 2 min (<span class="html-italic">t</span><sub>1</sub> = 120 s), and then rapidly decays (<span class="html-italic">t</span><sub>3</sub> = 10 s). The signal at <span class="html-italic">R</span> = 1 comes from the troposphere, but otherwise as <span class="html-italic">z<sub>M</sub></span> increases the signal is increasingly dominated by the forcing from the stratosphere.</p>
Full article ">Figure 8 Cont.
<p>Total surface pressure signals from eruptions that extend into the stratosphere: (<b>a</b>) <span class="html-italic">z<sub>M</sub></span> = 1.2<span class="html-italic">z<sub>T</sub></span>; (<b>b</b>) <span class="html-italic">z<sub>M</sub></span> = 1.6<span class="html-italic">z<sub>T</sub></span>; and (<b>c</b>) <span class="html-italic">z</span><sub>M</sub> = 2<span class="html-italic">z</span><sub>T</sub>. Parameter values are mostly similar to preceding figures: <span class="html-italic">a</span> = 1 km, <span class="html-italic">N</span><sub>1</sub> = 0.012 s<sup>−1</sup>, <span class="html-italic">N</span><sub>2</sub> = 0.024 s<sup>−1</sup>, and the forcing grows at a uniform rate for 2 min (<span class="html-italic">t</span><sub>1</sub> = 120 s), and then rapidly decays (<span class="html-italic">t</span><sub>3</sub> = 10 s). The signal at <span class="html-italic">R</span> = 1 comes from the troposphere, but otherwise as <span class="html-italic">z<sub>M</sub></span> increases the signal is increasingly dominated by the forcing from the stratosphere.</p>
Full article ">Figure 9
<p>Surface pressure observations from microbarographs at station AIRS (approximately 5 km from the source) on Montserrat on the days shown, showing the surface pressure signal (in Pascal, 1 mbar = 100 Pascal) for four eruptions. Each eruption occurs shortly before the downward motion after time 1000 s (from Baines and Sacks [<a href="#B2-atmosphere-08-00060" class="html-bibr">2</a>]).</p>
Full article ">Figure 10
<p>A comparison between observations of surface pressure variations from the eruption on Montserrat on 3 January 2009 at: (<b>a</b>) station AIRS (5 km from the source); and (<b>b</b>) station GRLD (10 km from source), and a model simulation for these distances. The curves chosen have <span class="html-italic">z<sub>M</sub></span>/<span class="html-italic">z<sub>T</sub></span> = 0.4, <span class="html-italic">t</span><sub>1</sub> = 120 s, and <span class="html-italic">t</span><sub>2</sub> − <span class="html-italic">t</span><sub>1</sub> = 120 s. This implies an eruption that reached height of 5.6 km, and lasted for 4 min.</p>
Full article ">Figure 10 Cont.
<p>A comparison between observations of surface pressure variations from the eruption on Montserrat on 3 January 2009 at: (<b>a</b>) station AIRS (5 km from the source); and (<b>b</b>) station GRLD (10 km from source), and a model simulation for these distances. The curves chosen have <span class="html-italic">z<sub>M</sub></span>/<span class="html-italic">z<sub>T</sub></span> = 0.4, <span class="html-italic">t</span><sub>1</sub> = 120 s, and <span class="html-italic">t</span><sub>2</sub> − <span class="html-italic">t</span><sub>1</sub> = 120 s. This implies an eruption that reached height of 5.6 km, and lasted for 4 min.</p>
Full article ">Figure 11
<p>A comparison between observations of surface pressure variations from the eruption on Montserrat on 8 December 2008 at station AIRS (5 km from the source) and a model simulation for these distance. The curves chosen have <span class="html-italic">z<sub>M</sub></span>/<span class="html-italic">z<sub>T</sub></span> = 0.3, <span class="html-italic">t</span><sub>1</sub> = 120 s, and <span class="html-italic">t</span><sub>2</sub> − <span class="html-italic">t</span><sub>1</sub> = 240 s. This is consistent with an eruption that reached height of 4.2 km, and lasted for 6 min.</p>
Full article ">Figure 12
<p>Values of the first six Fourier coefficients <span class="html-italic">h<sub>n</sub></span> for eruptions that are contained within the troposphere, for a scale height <span class="html-italic">H</span><sub>s</sub> = 9 km. Note the dominance of modes 1 and 2, and the increasing values as <span class="html-italic">z<sub>M</sub></span> approaches <span class="html-italic">z<sub>T</sub></span>.</p>
Full article ">Figure 13
<p>Values of the first six Fourier coefficients <span class="html-italic">h<sub>n</sub></span> for forcing within the troposphere, but for eruptions that reach into the stratosphere up to levels of 2<span class="html-italic">z<sub>T</sub></span>. <span class="html-italic">H</span><sub>s</sub> = 9 km. Note that modes 1 and 2 have similar magnitudes to those for <span class="html-italic">z<sub>M</sub></span> = <span class="html-italic">z<sub>T</sub></span> up to about <span class="html-italic">z<sub>M</sub></span>/<span class="html-italic">z<sub>T</sub></span> = 1.4.</p>
Full article ">Figure 14
<p>Complex Fourier coefficients <span class="html-italic">B</span>(<span class="html-italic">n</span>) from Equation (A3) for forcing from within the stratosphere of wave motion that may impact on the troposphere. Only modes <span class="html-italic">n</span> = 1–3 are shown, the solid curves denoting real parts and the dashed curves imaginary parts. <span class="html-italic">H<sub>s</sub></span> = 9 km. Note the relatively small and almost indeterminate values in the range 1 &lt; <span class="html-italic">z<sub>M</sub></span>/<span class="html-italic">z<sub>T</sub></span> &lt; 1.4. For forcing from within the stratosphere of waves that enter the troposphere and impact on surface pressure, the corresponding Fourier coefficients are the <span class="html-italic">B</span>(<span class="html-italic">n</span>) defined by Equation (A3). These have complex values that are shown in <a href="#atmosphere-08-00060-f014" class="html-fig">Figure A3</a>.</p>
Full article ">
2273 KiB  
Article
Inverse Relations of PM2.5 and O3 in Air Compound Pollution between Cold and Hot Seasons over an Urban Area of East China
by Mengwei Jia, Tianliang Zhao, Xinghong Cheng, Sunling Gong, Xiangzhi Zhang, Lili Tang, Duanyang Liu, Xianghua Wu, Liming Wang and Yusheng Chen
Atmosphere 2017, 8(3), 59; https://doi.org/10.3390/atmos8030059 - 20 Mar 2017
Cited by 142 | Viewed by 9228
Abstract
Abstract: By analyzing the data of urban air pollutant measurements from 2013 to 2015 in Nanjing, East China, we found that the correlation coefficients between major atmospheric compound pollutants PM2.5 and O3 were respectively 0.40 in hot season (June, July [...] Read more.
Abstract: By analyzing the data of urban air pollutant measurements from 2013 to 2015 in Nanjing, East China, we found that the correlation coefficients between major atmospheric compound pollutants PM2.5 and O3 were respectively 0.40 in hot season (June, July and August) and −0.16 in cold season (December, January and February) with both passing the confidence level of 99%. This provides evidence for the inverse relations of ambient PM2.5 and O3 between cold and hot seasons in an urban area of East China. To understand the interaction of PM2.5 and O3 in air compound pollution, the underlying mechanisms on the inversion relations between cold and hot seasons were investigated from the seasonal variations in atmospheric oxidation and radiative forcing of PM2.5 based on three-year environmental and meteorological data. The analyses showed that the augmentation of atmospheric oxidation could strengthen the production of secondary particles with the contribution up to 26.76% to ambient PM2.5 levels. High O3 concentrations in a strong oxidative air condition during hot season promoted the formation of secondary particles, which could result in a positive correlation between PM2.5 and O3 in hot season. In cold season with weak atmospheric oxidation, the enhanced PM2.5 levels suppressed surface solar radiation, which could weaken O3 production for decreasing ambient O3 level with the low diurnal peaks. Under the high PM2.5 level exceeding 115 μg·m−3, the surface O3 concentration dropped to 12.7 μg·m−3 at noon with a significant inhibitory effect, leading to a negative correlation between PM2.5 and O3 in cold season. This observational study revealed the interaction of PM2.5 and O3 in air compound pollution for understanding the seasonal change of atmospheric environment. Full article
(This article belongs to the Special Issue Urban Air Pollution)
Show Figures

Figure 1

Figure 1
<p>The geographic locations of 9 state controlling air sampling sites in the urban area of Nanjing in East China (<b>left panel</b>) with the correlation coefficients between ambient fine particles (PM<sub>2.5</sub>) and ozone (O<sub>3</sub>) in hot and cold seasons in the urban area of Nanjing over 2013–2015 (<b>right panel</b>).</p>
Full article ">Figure 2
<p>Diurnal changes of surface air temperature (°C) and total radiation (MJ·m<sup>−2</sup>) in the local time in Nanjing averaged in cold and hot seasons over 2013–2015.</p>
Full article ">Figure 3
<p>The contributions of secondary PM<sub>2.5</sub> particles to ambient PM<sub>2.5</sub> concentrations under photochemical activities ranged with 100 μg·m<sup>−3</sup> &lt; O<sub>3-max</sub> ≤ 160 μg·m<sup>−3</sup>, 160 μg·m<sup>−3</sup> &lt; O<sub>3-max</sub> ≤ 200 μg·m<sup>−3</sup>, and O<sub>3-max</sub> &gt; 200 μg·m<sup>−3</sup> estimated from the three-year environmental observation in the urban area of Nanjing.</p>
Full article ">Figure 4
<p>Diurnal changes of total radiation in local time under three PM<sub>2.5</sub> levels over 35–75 μg·m<sup>−3</sup> and 75–115 μg·m<sup>−3</sup> as well as exceeding 115 μg·m<sup>−3</sup> during 2013–2015 in Nanjing.</p>
Full article ">Figure 5
<p>Diurnal distribution in local time of O<sub>3</sub> change rates under three PM<sub>2.5</sub> levels over 35−75 μg·m<sup>−3</sup> and 75–115 μg·m<sup>−3</sup> as well as exceeding 115 μg·m<sup>−3</sup> during 2013–2015 in Nanjing.</p>
Full article ">Figure 6
<p>A diagram on the underlying mechanisms of inversion relations between ambient PM<sub>2.5</sub> and O<sub>3</sub> in the cold and hot seasons with (<b>+</b>) enhancing and (<b>−</b>) suppressing effects dominating (wide red and blue arrows) the interaction of PM<sub>2.5</sub> and O<sub>3</sub> in air compound pollution.</p>
Full article ">
2475 KiB  
Article
The Influence of an Increase of the Mediterranean Sea Surface Temperature on Two Nocturnal Offshore Rainbands: A Numerical Experiment
by Jordi Mazon and David Pino
Atmosphere 2017, 8(3), 58; https://doi.org/10.3390/atmos8030058 - 18 Mar 2017
Cited by 3 | Viewed by 5156
Abstract
Using the Weather Research and Forecasting (WRF) – Advanced Research WRF (ARW) mesoscale model (WRF–ARW), we investigate how two nocturnal offshore rainbands occurring in the Mediterranean basin are modified in a warmer sea surface temperature (SST). After sunset, the thermal difference between land [...] Read more.
Using the Weather Research and Forecasting (WRF) – Advanced Research WRF (ARW) mesoscale model (WRF–ARW), we investigate how two nocturnal offshore rainbands occurring in the Mediterranean basin are modified in a warmer sea surface temperature (SST). After sunset, the thermal difference between land and sea air increases. Driven by drainage winds or land breeze, the inland cold air interacts with the relatively warmer and moister air over the sea. Vertical movement of sea air over the boundary between the two air masses may induce cloud and rain bands offshore. When an increase of SST is prescribed in the WRF simulations, a change in the precipitation pattern is simulated. The numerical experiments show an increase both in the extension and location of the rainbands and in the precipitation rate. These changes, induced by the modified SST, are analyzed by estimating and comparing several parameters such as the location of level of free convection (LFC), Convective Available Potential Energy (CAPE), or the triggering, deceleration and blockage terms of simplified conceptual models. Full article
(This article belongs to the Special Issue WRF Simulations at the Mesoscale: From the Microscale to Macroscale)
Show Figures

Figure 1

Figure 1
<p>Scheme of cold air (having a deep <span class="html-italic">H</span>, characterized by potential temperature <math display="inline"> <semantics> <msub> <mi>θ</mi> <mi>c</mi> </msub> </semantics> </math> and drive by wind velocity <math display="inline"> <semantics> <msub> <mi>V</mi> <mi>c</mi> </msub> </semantics> </math>) flowing offshore and interacting with warmer air over the sea (with potential temperature <math display="inline"> <semantics> <msub> <mi>θ</mi> <mi>w</mi> </msub> </semantics> </math> and lead by wind velocity <math display="inline"> <semantics> <msub> <mi>V</mi> <mi>w</mi> </msub> </semantics> </math>). The Lifted Condensation Level is indicated as LCL, the Level of Free Convection as LFC, and the Limit of Convection as LOC.</p>
Full article ">Figure 2
<p>The Mediterranean basin. The squares mark the location where the influence of surface sea temperature (SST) on two coastal rainbands are analyzed.</p>
Full article ">Figure 3
<p>Domains defined in the WRF simulations. The panel (<b>a</b>) shows the domains for the episode occurring on 6 January, 2011 in the eastern Mediterranean basin (RB1). Panel (<b>b</b>) shows the domains for the episode occurring in the western basin on 5 September, 2011 (RB2).</p>
Full article ">Figure 4
<p>(<b>a</b>) 3-h accumulated precipitation estimated by TRMM at 03:00 UTC on 6 January 2011 and (<b>b</b>) Infrared (IR) Meteosat satellite image at 03:00 UTC on 6 January 2011. The square indicates the location of domain 3 used in the simulation.</p>
Full article ">Figure 5
<p>Simulated 10-h accumulated precipitation (color contours) and surface wind field (arrows) at the smallest domain on 6 January 2011 at 08:00 UTC, obtained by (<b>a</b>) CR and (<b>b</b>) SSTR (ΔSST=2.2 K).</p>
Full article ">Figure 6
<p>Simulated surface wind speed difference between CR and SSTR at 04:00 UTC on January 6, 2011 in the smallest domain. Negative values (warm colors) indicate intensification of the wind velocity for SSTR.</p>
Full article ">Figure 7
<p>Temporal evolution on 6 January 2011 of the estimated triggering, <span class="html-italic">H</span>/LFC (circles), blockage, <span class="html-italic">NH</span>/<span class="html-italic">U</span> (asterisks) and deceleration, <span class="html-italic">N</span>LFC/<span class="html-italic">U</span> (squares) parameters in the SSTR simulation (dashed lines) and the CR (closed lines) simulations.</p>
Full article ">Figure 8
<p>Reflectivity radar images recorded by the Spanish Weather Agency (AEMET) radar network on 4 September 2011 at (<b>a</b>) 22:00 UTC , and on 5 September 2011 at (<b>b</b>) 01:00 UTC, (<b>c</b>) 03:00 UTC and (<b>d</b>) 08:00 UTC. The red square indicates the location of the rainband associated with the coastal fronts analyzed in this section.</p>
Full article ">Figure 9
<p>(<b>a</b>) Thermal IR channel of the Meteosat satellite and (<b>b</b>) the 3-h accumulated precipitation estimated by TRMM on 6 September 2011 at 03:00 UTC. The square indicates the location of domain 3 used in the corresponding simulation.</p>
Full article ">Figure 10
<p>Simulated 10-h accumulated precipitation (color contours) and surface wind field (arrows) in the smallest domain at 08:00 UTC on 6 September 2011, simulated by (<b>a</b>) CR and (<b>b</b>) SSTR (ΔSST = 2.5 K).</p>
Full article ">Figure 11
<p>Simulated wind speed difference between CR and SSTR in the smallest domain on 6 September 2011 at 01:00 UTC. Negative values (warm colors) indicate intensification of the wind velocity for SSTR.</p>
Full article ">Figure 12
<p>Temporal evolution on 6 September 2011 of the triggering, <span class="html-italic">H</span>/LFC (circles), blockage, <span class="html-italic">NH</span>/<span class="html-italic">U</span> (asterisks) and deceleration, <span class="html-italic">N</span>LFC/<span class="html-italic">U</span> (squares) parameters in the SSTR simulation (dashed lines) and the CR (lines) simulations.</p>
Full article ">
3252 KiB  
Article
Recent Enhanced Seasonal Temperature Contrast in Japan from Large Ensemble High-Resolution Climate Simulations
by Yukiko Imada, Shuhei Maeda, Masahiro Watanabe, Hideo Shiogama, Ryo Mizuta, Masayoshi Ishii and Masahide Kimoto
Atmosphere 2017, 8(3), 57; https://doi.org/10.3390/atmos8030057 - 17 Mar 2017
Cited by 28 | Viewed by 9408
Abstract
Since the late 1990s, land surface temperatures over Japan have increased during the summer and autumn, while global mean temperatures have not risen in this duration (i.e., the global warming hiatus). In contrast, winter and spring temperatures in Japan have decreased. To assess [...] Read more.
Since the late 1990s, land surface temperatures over Japan have increased during the summer and autumn, while global mean temperatures have not risen in this duration (i.e., the global warming hiatus). In contrast, winter and spring temperatures in Japan have decreased. To assess the impact of both global warming and global-scale decadal variability on this enhanced seasonal temperature contrast, we analyzed the outputs of 100 ensemble simulations of historical and counterfactual non-warming climate simulations conducted using a high-resolution atmospheric general circulation model (AGCM). Our simulations showed that atmospheric fields impacted by the La Nina-like conditions associated with Interdecadal Pacific Oscillation (IPO) have predominantly contributed to the seasonal temperature contrast over Japan. Compared with the impact of negative IPO, the influence of global warming on seasonal temperature contrasts in Japan was small. In addition, atmospheric variability has also had a large impact on temperatures in Japan over a decadal timescale. The results of this study suggest a future increase in heatwave risk during the summer and autumn when La Nina-like decadal phenomena and atmospheric perturbations coincide over a background of global warming. Full article
(This article belongs to the Special Issue Temperature Extremes and Heat/Cold Waves)
Show Figures

Figure 1

Figure 1
<p>Time series of 6-month mean Japanese land surface temperature anomalies (K) for June–November (JJASON; dashed line) and December–May (DJFMAM; solid line) from the Japan Meteorological Agency (JMA) in-situ observations (red) and 100-member mean of the large ensemble simulations of the ALL (“all forcing”) run (black). A five-year running mean is applied for each time series. Shading shows the range of the ensemble members.</p>
Full article ">Figure 2
<p>Observed anomalies averaged from 1999 to 2010 for DJFMAM (left) and JJASON (right). (<b>a</b>,<b>b</b>) sea surface temperature (SST) (K), (<b>c</b>,<b>d</b>) outgoing longwave radiation (OLR) (W/m<sup>2</sup>), (<b>e</b>,<b>f</b>) Z500 (m, zonal mean is removed), (<b>g</b>,<b>h</b>) surface air temperature (shading, K), sea level pressure (SLP; contours, hPa), and 200 hPa wind velocity (arrows, m/s). Red contours in (<b>g</b>,<b>h</b>) show 50, 60, and 70 m/s of climatological westerly as a reference of a mean position of the Asian Jet. Sea surface temperature (SST) is based on COBE-SST, and atmospheric variables are from JRA-55 reanalysis.</p>
Full article ">Figure 3
<p>One hundred-member ensemble-mean anomalies of the all-forcing (ALL) run averaged from 1999 to 2010 for JJASON (left) and DJFMAM (right). (<b>a</b>,<b>b</b>) OLR (W/m<sup>2</sup>), (<b>c</b>,<b>d</b>) Z500 (m, zonal mean is removed), (<b>e</b>,<b>f</b>) surface air temperature (shading, K), SLP (contours, hPa), and 200 hPa wind velocity (arrows, m/s). In (<b>a</b>–<b>d</b>), dotted areas show values exceeding the 99% confidence level. In (<b>e</b>,<b>f</b>), red contours show 50, 60, and 70 m/s of climatological westerly as a reference of a mean position of the Asian Jet, and gray contours show the 99% confidence level of SLP. Values exceeding the 99% confidence level are shown for surface air temperature and 200 hPa wind anomalies.</p>
Full article ">Figure 4
<p>Z500 anomalies of the ALL run (m, zonal mean is removed) averaged from 1999 to 2010 for JJASON (left) and DJFMAM (right). Ensemble average is calculated for randomly-chosen 5 members (<b>a</b>,<b>b</b>), 10 members (<b>c</b>,<b>d</b>), and 20 members (<b>e</b>,<b>f</b>). Dotted areas show values exceeding the 99% confidence level.</p>
Full article ">Figure 5
<p>Histograms of 12-year-mean Japanese land surface temperature anomalies of JJASON (<b>a</b>,<b>c</b>,<b>e</b>) and DJFMAM (<b>b</b>,<b>d</b>,<b>f</b>). The histograms are normalized by each sample number. Open columns are for each 12 year window from 1981 to 2010, and filled columns are averaged from 1999 to 2010. Red (blue) is results from the ALL (non-warming; NW) run. (<b>a</b> and <b>b</b>) comparison of 1999–2010 with 1981–2010 based on the ALL run, (<b>c</b> and <b>d</b>) comparison of ALL with NW, (<b>e</b> and <b>f</b>) comparison of 1999-2010 with 1981–2010 based on the NW run.</p>
Full article ">Figure 6
<p>Same as <a href="#atmosphere-08-00057-f005" class="html-fig">Figure 5</a>, but for the difference of temperature anomalies between JJASON and DJFMAM (JJASON minus DJFMAM). (<b>a</b>) comparison of 1999–2010 with 1981–2010 based on the ALL run, (<b>b</b>) comparison of ALL with NW, (<b>c</b>) comparison of 1999-2010 with 1981–2010 based on the NW run.</p>
Full article ">Figure 7
<p>One hundred-member ensemble-mean anomalies of the NW run averaged from 1999 to 2010 for JJASON (left) and DJFMAM (right). (<b>a</b>,<b>b</b>) OLR (W/m<sup>2</sup>), (<b>c</b>,<b>d</b>) Z500 (m, zonal mean is removed), (<b>e</b>,<b>f</b>) surface air temperature (shading, K), SLP (contours, hPa), and 200 hPa wind velocity (arrows, m/s). Red contours in (<b>e</b>,<b>f</b>) show 50, 60, and 70 m/s of climatological westerly as a reference of a mean position of the Asian Jet. In (<b>c</b>–<b>f</b>), dotted areas show values exceeding the 99% confidence level. In (<b>g</b>,<b>h</b>), red contours show 50, 60, and 70 m/s of climatological westerly as a reference of a mean position of the Asian Jet, and gray contours show the 99% confidence level of SLP. Values exceeding the 99% confidence level are shown for surface air temperature and 200 hPa wind anomalies.</p>
Full article ">Figure 8
<p>Differences between the ALL and NW run averaged from 1981 to 2010 (ALL minus NW). (<b>a</b>) Annual SST (K); (<b>b</b>) Z500 [m] for JJASON; (<b>c</b>) Z500 (m) for DJFMAM. A 100-member mean is used.</p>
Full article ">
3321 KiB  
Article
Evaluation of Five Grid Datasets against Radiosonde Data over the Eastern and Downstream Regions of the Tibetan Plateau in Summer
by Yuanchang Dong, Guoping Li, Meng Yuan and Xiaolin Xie
Atmosphere 2017, 8(3), 56; https://doi.org/10.3390/atmos8030056 - 15 Mar 2017
Cited by 13 | Viewed by 4502
Abstract
In this study, horizontal wind (U and V), air temperature (T), and relative humidity (RH) modelled by the European Centre for Medium-Range Weather Forecasts Reanalysis Interim (ERA-Interim), the National Aeronautics and Space Administration (NASA) Modern Era Retrospective [...] Read more.
In this study, horizontal wind (U and V), air temperature (T), and relative humidity (RH) modelled by the European Centre for Medium-Range Weather Forecasts Reanalysis Interim (ERA-Interim), the National Aeronautics and Space Administration (NASA) Modern Era Retrospective Analysis for Research and Applications (MERRA), the Japanese 55-year Reanalysis (JRA-55), the National Centers for Environmental Prediction (NCEP) Climate Forecast System Version 2 (CFSv2), and the NCEP Final Operational Global Analysis data and the NCEP Final Operational Global Analysis data (NCEP-FNL) products have been compared with observations at 11 radiosonde stations over the eastern and downstream regions of the Tibetan Plateau (TP) from late June until the end of July during 2011 to 2015. The mean bias of all variables for the five gridded datasets (GDs) in the Sichuan Basin (SCB) is larger than that for the TP. The mean values of U, V, and T from each grid dataset are generally consistent with the radiosonde values, whereas considerable bias in the mean RH exists at upper levels. The diurnal variation of the mean bias and root-mean-square (RMS) error in the basin are stronger than those in the TP and the negative/positive peak usually occurs at 06:00 UTC and 18:00 UTC in the basin or at 12:00 UTC in the TP. The inter-annual variations in the basin are significantly stronger, and the maximum values of the variations usually occur at upper levels or near the surface, except for V. The weather conditions have a crucial influence on the performance of the gridded datasets. The mean bias and RMS error of T in the TP on cloudy days are obviously larger than those during sunny conditions. Considerable but unsteady differences occur in the mean bias and RMS error of U and V in different weather conditions. On average, the four variables in the TP are more sensible to the weather conditions. Full article
Show Figures

Figure 1

Figure 1
<p>Map plot of terrain elevations over the East and downstream of the Tibetan Plateau, and locations of the radiosonde sites. Heights are in meters above mean sea level (MSL).</p>
Full article ">Figure 2
<p>(Top row) Vertical profiles of mean difference (mean bias, color line) between radiosonde data (<span class="html-italic">U</span>ra, <span class="html-italic">V</span>ra, <span class="html-italic">T</span>ra, <span class="html-italic">RH</span>ra; black dotted line) and gridded datasets (GDs) (<span class="html-italic">U</span>gd, <span class="html-italic">V</span>gd, <span class="html-italic">T</span>gd, <span class="html-italic">RH</span>gd) in the basin (<b>a1</b>) <span class="html-italic">U</span> (m/s), (<b>b1</b>) <span class="html-italic">V</span> (m/s), (<b>c1</b>) <span class="html-italic">T</span> (°C), (<b>d1</b>) <span class="html-italic">RH</span> (%), all the data ae averaged over five independent radiosonde sites in the basin during late June to the end of July (2011–2015); (second row) Vertical profiles of difference between mean standard deviation (STD) between radiosonde data and GD (<b>a2</b>) <span class="html-italic">U</span>, (<b>b2</b>) <span class="html-italic">V</span>, (<b>c2</b>) <span class="html-italic">T</span>, (<b>d2</b>) <span class="html-italic">RH</span> for radiosonde and five GDs products; (bottom) Vertical profiles of the root-mean-square (RMS) errors for each of GDs verifying against the radiosonde data (radiosonde data) for (<b>a3</b>) <span class="html-italic">U</span>, (<b>b3</b>) <span class="html-italic">V</span>, (<b>c3</b>) <span class="html-italic">T</span>, and (<b>d3</b>) <span class="html-italic">RH</span>. CFSv2, Climate Forecast System Version 2; Interim, European Centre for Medium-Range Weather Forecasts Reanalysis Interim; FNL, NCEP Final Operational Global Analysis; MERRA, Modern Era Retrospective Analysis for Research and Applications; JRA-55, the Japanese <span class="html-italic">55</span>-year Reanalysis.</p>
Full article ">Figure 3
<p>(Top row) Vertical profiles of mean difference (mean bias, color line) between radiosonde data (<span class="html-italic">U</span>ra, <span class="html-italic">V</span>ra, <span class="html-italic">T</span>ra, <span class="html-italic">RH</span>ra; black dotted line) and gridded datasets (GDs) (<span class="html-italic">U</span>gd, <span class="html-italic">V</span>gd, <span class="html-italic">T</span>gd, <span class="html-italic">RH</span>gd) in the TP (<b>a1</b>) <span class="html-italic">U</span> (m/s), (<b>b1</b>) <span class="html-italic">V</span> (m/s), (<b>c1</b>) <span class="html-italic">T</span> (°C), (<b>d1</b>) <span class="html-italic">RH</span> (%), all the data ae averaged over six independent radiosonde sites in the TP during late June to the end of July (2011–2015); (second row) Vertical profiles of difference between mean standard deviation (STD) between radiosonde data and GD (<b>a2</b>) <span class="html-italic">U</span>, (<b>b2</b>) <span class="html-italic">V</span>, (<b>c2</b>) <span class="html-italic">T</span>, (<b>d2</b>) <span class="html-italic">RH</span> for radiosonde and five GDs products; (bottom) Vertical profiles of the root-mean-square (RMS) errors for each of GDs verifying against the radiosonde data (radiosonde data) for (<b>a3</b>) <span class="html-italic">U</span>, (<b>b3</b>) <span class="html-italic">V</span>, (<b>c3</b>) <span class="html-italic">T</span>, and (<b>d3</b>) <span class="html-italic">RH</span>.</p>
Full article ">Figure 4
<p>The diurnal variations of the mean bias of <span class="html-italic">U</span> (<b>a1</b>–<b>a5</b>), <span class="html-italic">V</span> (<b>b1</b>–<b>b5</b>), <span class="html-italic">T</span> (<b>c1</b>–<b>c5</b>), and <span class="html-italic">RH</span> (<b>d1</b>–<b>d5</b>) in the five GDs against the radiosonde data, averaged over sounding five sites in the basin (shaded) and six sites in the TP (contour) during late June–early August (2011–2015).</p>
Full article ">Figure 5
<p>The diurnal variations of the RMS error of <span class="html-italic">U</span> (<b>a1</b>–<b>a5</b>), <span class="html-italic">V</span> (<b>b1</b>–<b>b5</b>), <span class="html-italic">T</span> (<b>c1</b>–<b>c5</b>), and <span class="html-italic">RH</span> (<b>d1</b>–<b>d5</b>) in the five GDs against the radiosonde data, averaged over sounding five sites in the basin (shaded) and six sites in the TP (contour) during late June–early August (2011–2015).</p>
Full article ">Figure 6
<p>The difference of absolute values of the mean bias of <span class="html-italic">U</span> (<b>a1</b>–<b>a4</b>), <span class="html-italic">V</span> (<b>b1</b>–<b>b4</b>), <span class="html-italic">T</span> (<b>c1</b>–<b>c4</b>), and <span class="html-italic">RH</span> (<b>d1</b>–<b>d4</b>) between those occurring on cloudy days and on sunny days in the GDs against the radiosonde data, averaged over sounding five sites in the basin.</p>
Full article ">Figure 7
<p>The difference of absolute values of the mean bias of <span class="html-italic">U</span> (<b>a1</b>–<b>a4</b>), <span class="html-italic">V</span> (<b>b1</b>–<b>b4</b>), <span class="html-italic">T</span> (<b>c1</b>–<b>c4</b>), and <span class="html-italic">RH</span> (<b>d1</b>–<b>d4</b>) between those occurring on cloudy days and on sunny days in the GDs against the radiosonde data, averaged over sounding six sites in the TP.</p>
Full article ">Figure 8
<p>The difference of the RMS errors of <span class="html-italic">U</span> (<b>a1</b>–<b>a4</b>), <span class="html-italic">V</span> (<b>b1</b>–<b>b4</b>), <span class="html-italic">T</span> (<b>c1</b>–<b>c4</b>), and <span class="html-italic">RH</span> (<b>d1</b>–<b>d4</b>) between those occurring on cloudy days and on sunny days in the GDs against the radiosonde data, averaged over sounding five sites in the basin.</p>
Full article ">Figure 9
<p>The difference of the RMS errors of <span class="html-italic">U</span> (<b>a1</b>–<b>a4</b>), <span class="html-italic">V</span> (<b>b1</b>–<b>b4</b>), <span class="html-italic">T</span> (<b>c1</b>–<b>c4</b>), and <span class="html-italic">RH</span> (<b>d1</b>–<b>d4</b>) between those on cloudy days and on sunny days in the GDs against the radiosonde data, averaged over sounding six sites in the TP.</p>
Full article ">
32148 KiB  
Article
A Case Study of Assimilating Lightning-Proxy Relative Humidity with WRF-3DVAR
by Ying Wang, Yi Yang, Dongxia Liu, Dongbin Zhang, Wen Yao and Chenghai Wang
Atmosphere 2017, 8(3), 55; https://doi.org/10.3390/atmos8030055 - 14 Mar 2017
Cited by 22 | Viewed by 6278
Abstract
Lightning network data, considered as a useful supplement to radar observations, are a good indicator of severe convection, and has high temporal and spatial resolution. In Numerical Weather Prediction (NWP) models, lightning data are a new source of data to improve the forecasting [...] Read more.
Lightning network data, considered as a useful supplement to radar observations, are a good indicator of severe convection, and has high temporal and spatial resolution. In Numerical Weather Prediction (NWP) models, lightning data are a new source of data to improve the forecasting of convective systems. In this case study, lightning data assimilation is conducted by converting lightning data to water vapor mixing ratio via a simple smooth continuous function, with input variables of total flash rate and simulated graupel mixing ratio at 9 km gridded resolution. Relative humidity converted from the retrieved water vapor mixing ratio is assimilated into the background field utilizing the three-dimensional variational (3DVAR) method in WRFDA (the Weather Research and Forecasting model Data Assimilation system). The benefits of assimilating lightning data are demonstrated in a series of experiments using data from a strong convection event that affected Beijing, Tianjin, Hebei and Shandong Province, on 31 July 2007. A nested domain with resolutions of 9 km and 3 km is implemented. For this case, assimilating lightning data shows some improvements in predictions of both reflectivity and neighboring precipitation, and in the temperature, dew-point temperature and relative humidity profile after seven hours. Full article
(This article belongs to the Section Meteorology)
Show Figures

Figure 1

Figure 1
<p>Horizontal extent of the two nested domains and model terrain height distribution (unit: m). The resolutions of these two domains are 9 km and 3 km. Major Provinces and mountains are labeled and locations of three SAFIR (Surveillance et Alerte Foudre par Interferometrie Radiometrique) 3000 observation sites are marked with white dots.</p>
Full article ">Figure 2
<p>Assimilated observation data at 0300 UTC (Universal Time Coordinated) showing (<b>a</b>) location of observed total lightning from 0250 to 0300 UTC; (<b>b</b>) radar reflectivity at 1.5° elevation; and (<b>c</b>) radar radial velocity at 1.5° elevation. The Beijing Doppler radar location is marked with a black dot in (<b>b</b>,<b>c</b>). Five other Doppler radar locations are marked with red dots in (<b>c</b>).</p>
Full article ">Figure 3
<p>Background (xb) and analyzed (Exp. radar, Exp. lightn and Exp. li_ra) fields for (<b>a</b>) wind (m·s<sup>−1</sup>); (<b>b</b>) perturbation potential temperature (K); and (<b>c</b>) water vapor mixing ratio (g·kg<sup>−1</sup>) (at level = 14, about 4 km) at 0300 UTC.</p>
Full article ">Figure 4
<p>Background (xb) (<b>a</b>); and analyzed fields for (<b>b</b>) Exp. Radar;(<b>c</b>) Exp. Lightn; and (<b>d</b>) Exp. li_ra for wind (m·s<sup>−1</sup>) (at level = 8, about 1.5 km) at 0300 UTC.</p>
Full article ">Figure 5
<p>Observed surface temperature (<b>a</b>); and the surface temperature filed in Exp. CTL (<b>b</b>); Exp. radar (<b>c</b>); Exp. lightn (<b>d</b>); and Exp. li_ra (<b>e</b>) at 0300 UTC(unit: °C).</p>
Full article ">Figure 6
<p>Ten minute forecast maximum reflectivity (dBZ) of the four experiments from 0300 UTC to 0500 UTC. Panels (<b>a1</b>–<b>a3</b>) show observed maximum reflectivity from the six Doppler radars at Beijing, Tianjin, Shijiazhuang, Qinghuangdao, Jinan and Qingdao, and panels (<b>b</b>–<b>e</b>) show the maximum reflectivity of Exp. CTL, Exp. radar, Exp. lightn and Exp. li_raat each of these 3 h, respectively (unit: dBZ).</p>
Full article ">Figure 7
<p>Forecast composite maximum reflectivity (dBZ) of the four experiments from 0600 UTC to 1000 UTC. Panels (<b>a1</b>–<b>a5</b>) show observed maximum reflectivity; and panel (<b>b</b>–<b>e</b>) show the maximum reflectivity of Exp. CTL, Exp. radar, Exp. lightn and Exp. li_ra at each of these 5 h, respectively (unit: dBZ).</p>
Full article ">Figure 8
<p>Forecast 6 h accumulated precipitation for: (<b>a</b>) observation; (<b>b</b>) Exp. CTL; (<b>c</b>) Exp. Radar; (<b>d</b>) Exp. Lightn; and (<b>e</b>) Exp. li_ra (unit: mm).</p>
Full article ">Figure 9
<p>Water vapor flux (g·s<sup>−1</sup>·hPa·cm<sup>−1</sup>) andwater vapor flux divergence (g·s<sup>−1</sup>·hPa·cm<sup>−2</sup>) in: (<b>a</b>) Exp. CTL; (<b>b</b>) Exp. Radar; (<b>c</b>) Exp. Lightn; and (<b>d</b>) Exp. li_ra at 850 hPa, 1030 UTC. The vector represents water vapor flux and the contour represents divergence of water vapor flux.</p>
Full article ">Figure 10
<p>Fractions Skill Score (FSS) for different thresholds of 6 h accumulated precipitation ((<b>a</b>) 1 mm; (<b>b</b>) 5 mm; (<b>c</b>) 10 mm; (<b>d</b>) 15 mm; and (<b>e</b>) 20 mm) in Exp. CTL, Exp. radar, Exp. lightn and Exp. li_ra. The perfect value of FSS is 1.00.</p>
Full article ">Figure 11
<p>Skew-T diagram for (<b>a</b>) observations; (<b>b</b>) Exp. CTL; (<b>c</b>) Exp. radar; (<b>d</b>) Exp. lightn; and (<b>e</b>) Exp. li_ra at Beijing, 1200 UTC. The blue line is the dew-point temperature profile and the black line is the temperature profile. The area between the black and red dashed lines indicates the convective available potential energy, which is calculated as 2018 J, 2278 J, 252 J, 93 J and 8 J for panels in (<b>a</b>–<b>e</b>), respectively.</p>
Full article ">Figure 12
<p>Relative humidity profile forobservations, Exp. CTL, Exp. radar, Exp. lightn and Exp. li_ra at Beijing, 1200 UTC.</p>
Full article ">
2672 KiB  
Article
Opposite Trends in Light Rain Days over Western and Eastern China from 1960 to 2014
by Shikai Song, Changqing Jing and Zengyun Hu
Atmosphere 2017, 8(3), 54; https://doi.org/10.3390/atmos8030054 - 14 Mar 2017
Cited by 1 | Viewed by 4740
Abstract
In this work, we examined spatial and temporal trends for light rain days based on daily precipitation measurements, obtained from 1960 to 2014, from 590 meteorological stations in China. For the analyzed time interval, light rain days over eastern China were determined to [...] Read more.
In this work, we examined spatial and temporal trends for light rain days based on daily precipitation measurements, obtained from 1960 to 2014, from 590 meteorological stations in China. For the analyzed time interval, light rain days over eastern China were determined to decrease by 0.23 days·year−1. In western China, they increased by 0.3 days·year−1. To detect underlying causes for changes in light rain days, lower-tropospheric relative humidity was set as a proxy for light rain days. We then calculated the respective impacts of lower-tropospheric temperature and specific humidity on changes in light rain days. A comparison of the contributions of temperature and specific humidity resulted in the identification of the main cause of changes. Our results indicated that increases in lower-tropospheric temperatures reduced light rain days over the entire country, while variations in specific humidity dominated regional differences for light rain day trends. Full article
(This article belongs to the Section Meteorology)
Show Figures

Figure 1

Figure 1
<p>Spatial and temporal trends in annual precipitation days and light rain days for the warm season from 1960 to 2014 over China and the sub-regions (western and eastern China). (<b>a</b>) The spatial distribution of trends for annual precipitation days; (<b>b</b>) temporal trends for annual precipitation days and light rain days over eastern China; (<b>c</b>) the spatial distribution of trends for light rain days; and (<b>d</b>) temporal trends for annual precipitation days and light rain days over western China. Black dots at stations represent significance at the 0.05 level.</p>
Full article ">Figure 2
<p>Spatial and temporal trends in lower-tropospheric relative humidity (RH) and the correlation between RH and light rain days in the warm season from 1960 to 2014 over China and the sub-regions (western and eastern China). (<b>a</b>) The spatial distribution of RH trends; (<b>b</b>) a comparison of normalized RH with normalized light rain days over eastern China; (<b>c</b>) the spatial distribution of the correlation between RH and light rain days; and (<b>d</b>) a comparison of normalized RH to normalized light rain days over western China. Black dots in the pixels represent significance at the 0.05 level.</p>
Full article ">Figure 3
<p>Spatial and temporal trends in lower-tropospheric temperature and specific humidity (SH) from 1960 to 2014 over China and the two sub-regions (western and eastern China). (<b>a</b>) The spatial distribution for trends in temperature; (<b>b</b>) temporal trends in temperature over western and eastern China; (<b>c</b>) the spatial distribution for the trend in SH; and (<b>d</b>) temporal trends for SH over western and eastern China. Black dots in the pixels represent significance at the 0.05 level.</p>
Full article ">Figure 4
<p>Changes in lower-tropospheric RH induced by temperature and SH from 1960 to 2014 over China. (<b>a</b>) Changes in RH induced by temperature; and (<b>b</b>) changes in RH induced by SH.</p>
Full article ">Figure 5
<p>The spatial distribution for proportions of lower-tropospheric temperature and SH contributing to changes in RH from 1960 to 2014 over China. (<b>a</b>) Proportions of temperature contributing to changes in RH over regions where RH exhibited an increasing trend; (<b>b</b>) proportions of temperature over regions where RH exhibited a decreasing trend; (<b>c</b>) proportions of SH over regions where RH exhibited an increasing trend; and (<b>d</b>) proportions of SH over regions where RH exhibited a decreasing trend.</p>
Full article ">Figure 6
<p>The regional contributions of lower-tropospheric temperature and SH contributing to changes in RH from 1960 to 2014 over China and its sub-regions.</p>
Full article ">
8486 KiB  
Article
Assessment of Temperature and Elevation Controls on Spatial Variability of Rainfall in Iran
by Majid Javari
Atmosphere 2017, 8(3), 45; https://doi.org/10.3390/atmos8030045 - 6 Mar 2017
Cited by 13 | Viewed by 9298
Abstract
With rainfall changes, hydrological process variability increases. This study predicts the potential effects of temperature and topography characteristics on rainfall spatial variability. Temperature and topography were considered as two effective factors that may influence monthly rainfall. This study uses rainfall and temperature data [...] Read more.
With rainfall changes, hydrological process variability increases. This study predicts the potential effects of temperature and topography characteristics on rainfall spatial variability. Temperature and topography were considered as two effective factors that may influence monthly rainfall. This study uses rainfall and temperature data from 174 synoptic and climatic stations and 39,055 rain, elevation and temperature points extracted by ArcGIS10.3 over the 40 years (1975–2014). In this study, in order to predict the relationship between temperature, topography and rainfall, a combination of statistics including spatial statistics and Geographical information System (GIS) methods were employed. It was found that the distribution and rainfall variability in some parts of Iran was regarded to be based on topography and temperature. The spatial patterns showed that the variability based on spatial autocorrelation in rainfall severity gradually increased from west to east and north to south in Iran. Temperature and topography influence rainfall spatial variability; moreover, these factors have direct, indirect and total effects on rainfall variability in temporal and spatial patterns. These research results will be useful for the regionalization of climate and rainfall formation factors, management of water sources, environmental planning and measuring environmental controls on the climate system. Full article
(This article belongs to the Special Issue Global Precipitation with Climate Change)
Show Figures

Figure 1

Figure 1
<p>Distribution of Stations.</p>
Full article ">Figure 2
<p>DEM and rainfall distribution in Iran.</p>
Full article ">Figure 3
<p>Distribution of annual temperature.</p>
Full article ">Figure 4
<p>Distribution of Annual Rainfall.</p>
Full article ">Figure 5
<p>The coefficient of variations of Annual Temperature (%).</p>
Full article ">Figure 6
<p>The coefficient of variations of Annual Rainfall (%).</p>
Full article ">Figure 7
<p>The temporal correlation analysis between the monthly temperatures and annual rainfall. In <a href="#atmosphere-08-00045-f007" class="html-fig">Figure 7</a>, the double-headed arrows indicate covariance or correlation between pairs of variables. The correlation model shows that monthly temperatures have negative and positive correlations (red data) on annual rainfall. In the model summary presented in <a href="#atmosphere-08-00045-f007" class="html-fig">Figure 7</a>, we observed the overall chi-square (χ<sup>2</sup>) value, together with its degrees of freedom, RMSEA 0.005 (a suitable fit) and probability value.</p>
Full article ">Figure 8
<p>The correlation between the monthly temperatures, elevation and annual rainfall. <a href="#atmosphere-08-00045-f008" class="html-fig">Figure 8</a> also shows the temporal correlation coefficients between the temperatures, rainfall and elevation amounts for all stations.</p>
Full article ">Figure 9
<p>Spatial correlation between the elevation and rainfall. Linear cross-variograms (dots) and measured spherical models (solid lines). The dashed lines show that there is a positive relationship between observed variables. Variogram factors: nugget variance or <span class="html-italic">C<sub>0</sub></span>; Sill or <span class="html-italic">C<sub>0</sub></span> + <span class="html-italic">C</span>; Range or <span class="html-italic">A</span> (<span class="html-italic">A</span>1—the range parameter for the major axis of variation and <span class="html-italic">A</span>2—the range parameter for the minor axis); Ratio <span class="html-italic">C</span>/ (<span class="html-italic">C<sub>0</sub></span> + <span class="html-italic">C</span>) or RNS and RSS. The linear anisotropic model describes a straight-line variogram (<math display="inline"> <semantics> <mrow> <mi>γ</mi> <mrow> <mo>(</mo> <mi>h</mi> <mo>)</mo> </mrow> <mo>=</mo> <msub> <mi>C</mi> <mn>0</mn> </msub> <mo>+</mo> <mi mathvariant="normal">h</mi> <mrow> <mo stretchy="false">(</mo> <mrow> <mfrac> <mi>C</mi> <mi>A</mi> </mfrac> </mrow> <mo stretchy="false">)</mo> </mrow> </mrow> </semantics> </math> that γ (<span class="html-italic">h</span>) = semi variance for interval distance class <span class="html-italic">h</span>, <span class="html-italic">h</span> = lag interval, <span class="html-italic">C<sub>0</sub></span> = nugget variance ≥0, <span class="html-italic">C</span> = structural variance ≥ <span class="html-italic">C<sub>0</sub></span> <math display="inline"> <semantics> <mrow> <mo>=</mo> <msqrt> <mrow> <mrow> <mo>{</mo> <mrow> <msubsup> <mi mathvariant="bold-italic">A</mi> <mstyle mathvariant="bold" mathsize="normal"> <mn>1</mn> </mstyle> <mstyle mathvariant="bold" mathsize="normal"> <mn>2</mn> </mstyle> </msubsup> <mrow> <mo>[</mo> <mrow> <mstyle mathvariant="bold" mathsize="normal"> <mi>c</mi> <mi>o</mi> </mstyle> <msup> <mstyle mathvariant="bold" mathsize="normal"> <mi>s</mi> </mstyle> <mstyle mathvariant="bold" mathsize="normal"> <mn>2</mn> </mstyle> </msup> <mrow> <mo>(</mo> <mrow> <mi mathvariant="bold-italic">θ</mi> <mo>−</mo> <mi mathvariant="bold-sans-serif">Ф</mi> </mrow> <mo>)</mo> </mrow> </mrow> <mo>]</mo> </mrow> </mrow> <mo>}</mo> </mrow> </mrow> </msqrt> <mo>+</mo> <mrow> <mo>{</mo> <mrow> <msubsup> <mi mathvariant="bold-italic">A</mi> <mstyle mathvariant="bold" mathsize="normal"> <mn>2</mn> </mstyle> <mstyle mathvariant="bold" mathsize="normal"> <mn>2</mn> </mstyle> </msubsup> <mrow> <mo>[</mo> <mrow> <mstyle mathvariant="bold" mathsize="normal"> <mi>s</mi> <mi>i</mi> </mstyle> <msup> <mstyle mathvariant="bold" mathsize="normal"> <mi>n</mi> </mstyle> <mstyle mathvariant="bold" mathsize="normal"> <mn>2</mn> </mstyle> </msup> <mrow> <mo>(</mo> <mrow> <mi mathvariant="bold-italic">θ</mi> <mo>−</mo> <mi mathvariant="bold-sans-serif">Ф</mi> </mrow> <mo>)</mo> </mrow> </mrow> <mo>]</mo> </mrow> </mrow> <mo>}</mo> </mrow> </mrow> </semantics> </math>, <span class="html-italic">A</span>1 = range parameter for the major axis (<span class="html-italic">Ф</span>) and <span class="html-italic">A</span>2 = range parameter for the minor axis (<span class="html-italic">Ф</span> + 90).</p>
Full article ">Figure 10
<p>Spatial correlation between the Temperature and Rainfall.</p>
Full article ">Figure 11
<p>Spatial correlation between the DEM and Rainfall.</p>
Full article ">Figure 12
<p>The effectiveness analysis between the monthly temperatures and annual rainfall. Effectiveness model analyzed casually in each climatic series. The single-headed arrows denote causal relationships and the impact of one variable on another; the double-headed arrows indicate covariance or correlation between pairs of variables. The SEM model shows that monthly temperatures have a direct effect (red data) on annual rainfall. Monthly temperatures have direct effects (positive and negative) on annual rainfall and monthly temperatures have a correlation with neighborhood series. An error term (e1) is associated with an observed variable (annual rainfall). In the model summary presented in <a href="#atmosphere-08-00045-f012" class="html-fig">Figure 12</a>, the overall chi-square (χ<sup>2</sup>) value, together with its degrees of freedom and probability value was observed.</p>
Full article ">Figure 13
<p>The effectiveness between the monthly temperatures and annual rainfall (first model). Monthly effectiveness investigated casually in rainfall series. The effectiveness model shows that eight monthly temperature series (January, April, May, June, July, October, November and September based on Standardized β higher) have an indirect effect on annual rainfall. Monthly temperature series (February, March, August and December) have direct effects (positive and negative) on annual rainfall.</p>
Full article ">Figure 14
<p>The effectiveness between the monthly temperature and annual rainfall (second model). Monthly effectiveness investigated on annual rainfall series. The effectiveness model shows that nine monthly temperature series (January, March, April, May, June, July, August, September, October, November and December) have indirect effects on annual rainfall. February temperature has a direct effect (negative effect) on annual rainfall. According to <a href="#atmosphere-08-00045-f014" class="html-fig">Figure 14</a>, there is significant (0.94 &lt; R<sup>2</sup> &lt; 1) effectiveness (red data) between the temperature series and annual rainfall in Iran.</p>
Full article ">Figure 15
<p>The effectiveness between the monthly temperature and annual rainfall (third model). Monthly effectiveness investigated on annual rainfall series. The effectiveness model shows that ten monthly temperature series (January, April, May, June, July, August, September, October, November and December) have an indirect effect on annual rainfall. March temperature has a direct effect (negative effect) on annual rainfall.</p>
Full article ">Figure 16
<p>The effectiveness between the monthly temperature and annual rainfall (fourth model). Monthly effectiveness investigated on annual rainfall series. The effectiveness model shows that eight monthly temperature series (May, June, July, August, September, October, November and December) have indirect effects on annual rainfall. January and November temperature series have a direct effect (negative and positive effects) on annual rainfall (0.86 &lt; R<sup>2</sup> &lt; 0.99, red data).</p>
Full article ">Figure 17
<p>The effectiveness between the monthly temperature and annual rainfall (fifth model). Monthly effectiveness investigated on annual rainfall series. The effectiveness model shows that six monthly temperature series (May, June, July, August and September) have an indirect effect on annual rainfall. October temperature has a direct effect (negative effect) on annual rainfall (<math display="inline"> <semantics> <mrow> <msup> <mi mathvariant="normal">R</mi> <mn>2</mn> </msup> </mrow> </semantics> </math> = 0.99 or 99%, red data).</p>
Full article ">Figure 18
<p>The effectiveness of the temperatures and elevation on annual rainfall (sixth model). Monthly effectiveness investigated on annual rainfall series. The effectiveness model shows that eight monthly temperature series (January, April, May, June, July, September, October and November) have indirect effects on annual rainfall. February, March, August, December temperatures and elevation have direct effects (negative and positive effects) on annual rainfall (0.48 &lt; R<sup>2</sup> &lt; 0.99, red data).</p>
Full article ">Figure 19
<p>The effectiveness of the temperatures, elevation, and DEM on annual rainfall (seventh model). Monthly effectiveness investigated on annual rainfall series. The effectiveness model shows that eight monthly temperature series (January, April, May, June, July, September, October and November) have indirect effects on annual rainfall. February, March, August, December temperature series, elevation and DEM have direct effects (negative and positive effects) on annual rainfall (0.48 &lt; R<sup>2</sup> &lt; 0.99, red data).</p>
Full article ">Figure 20
<p>The effectiveness of the seasonal temperatures, elevation, and DEM on annual rainfall (eighth model). Seasonal effectiveness investigated on annual rainfall series. The effectiveness model shows that seasonal temperature series (winter, spring, summer and autumn) have direct effects on annual rainfall. Elevation and DEM have indirect effects (negative and positive effects) on annual rainfall (0.45 &lt; R<sup>2</sup> &lt; 0.60, red data).</p>
Full article ">Figure 21
<p>The effectiveness of the temperatures, elevation, and DEM on annual rainfall (final model). Measurement and structural models analyzed on annual rainfall series. The effectiveness and causality model shows that latent variables or factors (monthly temperature series, seasonal and annual temperature series and topography) have direct (negative effects) and indirect effects (negative and positive effects) on annual rainfall (0.68 &lt; R<sup>2</sup> &lt; 0.99, or 68%–99%, red data).</p>
Full article ">Figure 22
<p>Forecasting of rainfall by using linear multi-regression.</p>
Full article ">Figure 23
<p>Forecasting of rainfall by using linear multi-regression.</p>
Full article ">Figure 24
<p>Illustrates forecasting of the Moran’s I statistics for spatial effectiveness. There is relatively high Moran’s <span class="html-italic">I</span> of 0.25 in the first distance class, indicating that Type Moran’s <span class="html-italic">I</span> errors are biased. More importantly, there is a lack of explanation of richness at those short distances. (<b>A</b>) Temperature and rainfall; (<b>B</b>) DEM and rainfall; (<b>C</b>) Elevation and rainfall.</p>
Full article ">Figure 25
<p>Moran’s I statistics of the GWR model.</p>
Full article ">Figure 26
<p>Local <math display="inline"> <semantics> <mrow> <msup> <mi mathvariant="normal">R</mi> <mn>2</mn> </msup> </mrow> </semantics> </math> of the GWR model.</p>
Full article ">Figure 27
<p>Gi statistics calculated monthly (<b>1</b>–<b>12</b>), seasonally (<b>13</b>–<b>16</b>) and monthly (<b>17</b>).</p>
Full article ">Figure 27 Cont.
<p>Gi statistics calculated monthly (<b>1</b>–<b>12</b>), seasonally (<b>13</b>–<b>16</b>) and monthly (<b>17</b>).</p>
Full article ">Figure 27 Cont.
<p>Gi statistics calculated monthly (<b>1</b>–<b>12</b>), seasonally (<b>13</b>–<b>16</b>) and monthly (<b>17</b>).</p>
Full article ">Figure 27 Cont.
<p>Gi statistics calculated monthly (<b>1</b>–<b>12</b>), seasonally (<b>13</b>–<b>16</b>) and monthly (<b>17</b>).</p>
Full article ">Figure 27 Cont.
<p>Gi statistics calculated monthly (<b>1</b>–<b>12</b>), seasonally (<b>13</b>–<b>16</b>) and monthly (<b>17</b>).</p>
Full article ">
3939 KiB  
Article
Temperature and Heat-Related Mortality Trends in the Sonoran and Mojave Desert Region
by Polioptro F. Martinez-Austria and Erick R. Bandala
Atmosphere 2017, 8(3), 53; https://doi.org/10.3390/atmos8030053 - 3 Mar 2017
Cited by 13 | Viewed by 8801
Abstract
Extreme temperatures and heat wave trends in five cities within the Sonoran Desert region (e.g., Tucson and Phoenix, Arizona, in the United States and Ciudad Obregon and San Luis Rio Colorado, Sonora; and Mexicali, Baja California, in Mexico) and one city within the [...] Read more.
Extreme temperatures and heat wave trends in five cities within the Sonoran Desert region (e.g., Tucson and Phoenix, Arizona, in the United States and Ciudad Obregon and San Luis Rio Colorado, Sonora; and Mexicali, Baja California, in Mexico) and one city within the Mojave Desert region (e.g., Las Vegas, Nevada) were assessed using field data collected from 1950 to 2014. Instead of being selected by watershed, the cities were selected because they are part of the same arid climatic region. The data were analyzed for maximum temperature increases and the trends were confirmed statistically using Spearman’s nonparametric test. Temperature trends were correlated with the mortality information related with extreme heat events in the region. The results showed a clear trend of increasing maximum temperatures during the months of June, July, and August for five of the six cities and statically confirmed using Spearman’s rho values. Las Vegas was the only city where the temperature increase was not confirmed using Spearman’s test, probably because it is geographically located outside of the Sonoran Desert or because of its proximity to the Hoover Dam. The relationship between mortality and temperature was analyzed for the cities of Mexicali, Mexico and Phoenix. Arizona. Full article
(This article belongs to the Special Issue Temperature Extremes and Heat/Cold Waves)
Show Figures

Figure 1

Figure 1
<p>Koppen-Geiger climatic map of North America. (Image by Peel, M. C., Finlayson, B. L., and McMahon, T. A. (University of Melbourne) (CC BY-SA 3.0 (<a href="http://creativecommons.org/licenses/by-sa/3.0))" target="_blank">http://creativecommons.org/licenses/by-sa/3.0))</a>, via Wikimedia Commons).</p>
Full article ">Figure 2
<p>Maximum monthly temperature variations and linear trend lines for August.</p>
Full article ">Figure 3
<p>Maximum monthly temperature variations and linear trend lines for September.</p>
Full article ">Figure 4
<p>Number of days that exceeded the 90th percentile of average maximum temperatures threshold in August.</p>
Full article ">Figure 5
<p>Maximum temperature and mortality rate (per 10,000 inhabitants) during August in Maricopa County (2004 to 2015).</p>
Full article ">Figure 6
<p>Relationship between mortality rate and max temperatures during August in Maricopa County (2004 to 2015).</p>
Full article ">Figure 7
<p>Mortality rate per 10,000 inhabitants and maximum monthly temperature in Mexicali during August (1990 to 2010).</p>
Full article ">Figure 8
<p>Mortality rate (per 10,000 inhabitants) versus maximum temperature during August in Mexicali (1990 to 2010).</p>
Full article ">Figure 9
<p>Mortality rate by 10,000 inhabitants for July (<b>a</b>), August (<b>b</b>), and September (<b>c</b>), 1990–2010 in Mexicali, Mexico.</p>
Full article ">
3349 KiB  
Article
Evaluating the Hydrological Cycle over Land Using the Newly-Corrected Precipitation Climatology from the Global Precipitation Climatology Centre (GPCC)
by Udo Schneider, Peter Finger, Anja Meyer-Christoffer, Elke Rustemeier, Markus Ziese and Andreas Becker
Atmosphere 2017, 8(3), 52; https://doi.org/10.3390/atmos8030052 - 3 Mar 2017
Cited by 241 | Viewed by 18647
Abstract
The 2015 release of the precipitation climatology from the Global Precipitation Climatology Centre (GPCC) for 1951–2000, based on climatological normals of about 75,100 rain gauges, allows for quantification of mean land surface precipitation as part of the global water cycle. In GPCC’s 2011-release, [...] Read more.
The 2015 release of the precipitation climatology from the Global Precipitation Climatology Centre (GPCC) for 1951–2000, based on climatological normals of about 75,100 rain gauges, allows for quantification of mean land surface precipitation as part of the global water cycle. In GPCC’s 2011-release, a bulk climatological correction was applied to compensate for gauge undercatch. In this paper we derive an improved correction approach based on the synoptic weather reports for the period 1982–2015. The compared results show that the climatological approach tends to overestimate the correction for Central and Eastern Europe, especially in the northern winter, and in other regions throughout the year. Applying the mean weather-dependent correction to the GPCC’s uncorrected precipitation climatology for 1951–2000 gives a value of 854.7 mm of precipitation per year (excluding Antarctica) or 790 mm for the global land surface. The warming of nearly 1 K relative to pre-industrial temperatures is expected to be accompanied by a 2%–3% increase in global (land and ocean) precipitation. However, a comparison of climatology for 30-year reference periods from 1931–1960 up to 1981–2010 reveals no significant trend for land surface precipitation. This may be caused by the large variability of precipitation, the varying data coverage over time and other issues related to the sampling of rain-gauge networks. The GPCC continues to enlarge and further improve the quality of its database, and will generate precipitation analyses with homogeneous data coverage over time. Another way to reduce the sampling issues is the combination of rain gauge-based analyses with remote sensing (i.e., satellite or radar) datasets. Full article
(This article belongs to the Special Issue Global Precipitation with Climate Change)
Show Figures

Figure 1

Figure 1
<p>Total number of stations with monthly precipitation data over time (shown since 1901) in the Full Data Base of the Global Precipitation Climatology Centre (GPCC) according to the different data sources.</p>
Full article ">Figure 2
<p>Spatial distribution of monthly in-situ stations with a climatological precipitation normal in the GPCC database (number of stations in July: 75,152).</p>
Full article ">Figure 3
<p>Climatological mean precipitation for July based on new Global Precipitation Climatology (Version 2015) from the GPCC, focusing on the period 1951–2000, 0.25° × 0.25° resolution).</p>
Full article ">Figure 4
<p>Differences (mm) between the 2015 release of GPCC’s precipitation climatology and the 2011 release for (<b>a</b>) January; (<b>b</b>) July and (<b>c</b>) for the year. The map for the year (<b>c</b>) also highlights the differences of the land masks (dark blue) between the two releases.</p>
Full article ">Figure 5
<p>Differences between mean annual precipitation for the different 30-year reference periods (<b>a</b>) 1931–1960; (<b>b</b>) 1941–1970; (<b>c</b>) 1951–1980; (<b>d</b>) 1961–1990; (<b>e</b>) 1971–2000 and (<b>f</b>) 1981–2010 to GPCC’s precipitation climatology 1951–2000 [<a href="#B3-atmosphere-08-00052" class="html-bibr">3</a>].</p>
Full article ">Figure 6
<p>Hovmoeller diagram of zonal mean precipitation (mm/month) over the year for (left) GPCC’s precipitation climatology 1951–2000, and the different 30-year reference periods (second-left to right) 1931–1960, 1941–1970, 1951–1980, 1961–1990, 1971–2000 and 1981–2010.</p>
Full article ">Figure 7
<p>Mean annual cycle over the global land surface for the different 30-year reference periods 1931–1960, 1941–1970, 1951–1980, 1961–1990, 1971–2000 and 1981–2010.</p>
Full article ">Figure 8
<p>Mean correction factors from (<b>left</b>) GPCC correction method averaged for 1982–2015 for January, April, July and October and (<b>right</b>) Legates and Willmott (L&amp;W1990, [<a href="#B8-atmosphere-08-00052" class="html-bibr">8</a>]) for the same months.</p>
Full article ">Figure 9
<p>Absolute differences (mm) between correction terms for the systematic gauge-measuring error according to GPCC and L&amp;W1990 for January, April, July, October and the year.</p>
Full article ">Figure 10
<p>Example of the mean percentage of precipitation phases for January over the period 1982–2015 (<b>top</b>) liquid, (<b>middle</b>) solid and (<b>bottom</b>) mixed phase.</p>
Full article ">Figure 11
<p>Average water transport/exchanges in km<sup>3</sup> per year as derived from GPCC’s precipitation climatology for 1951–2000 land surface precipitation, numbers for precipitation over oceans, evapotranspiration/evaporation over land/ocean taken from [<a href="#B13-atmosphere-08-00052" class="html-bibr">13</a>,<a href="#B14-atmosphere-08-00052" class="html-bibr">14</a>], background picture by courtesy of A. Kapala (Meteorological Institute, University Bonn).</p>
Full article ">
12636 KiB  
Article
Temporal Variability of Summer Temperature Extremes in Poland
by Agnieszka Wypych, Agnieszka Sulikowska, Zbigniew Ustrnul and Danuta Czekierda
Atmosphere 2017, 8(3), 51; https://doi.org/10.3390/atmos8030051 - 2 Mar 2017
Cited by 29 | Viewed by 7207
Abstract
The aim of the study is to estimate the trend in summer maximum air temperature extremes in Poland during the period 1951–2015 by demonstrating the changes in the magnitude of temperature anomalies, temperature “surplus”, as well as the area influenced by extreme temperature [...] Read more.
The aim of the study is to estimate the trend in summer maximum air temperature extremes in Poland during the period 1951–2015 by demonstrating the changes in the magnitude of temperature anomalies, temperature “surplus”, as well as the area influenced by extreme temperature occurrence. To express the latter two variables, daily maps of maximum air temperature were created to calculate the total area affected by temperature extremes. To combine the effect of spatial extent and temperature anomaly, an Extremity Index was introduced. The results confirmed an increase in summer maximum air temperature of about 0.4 °C per 10 years, evidenced also in the increase of summer extremeness. Positive anomalies have dominated since the 1990s, with the largest anomalies occurring during the summers of 1992, 1994, 2010 and finally 2015, the most exceptional summer during the analyzed period. Full article
(This article belongs to the Special Issue Temperature Extremes and Heat/Cold Waves)
Show Figures

Figure 1

Figure 1
<p>Study area: (<b>A</b>) location on the European subcontinent; (<b>B</b>) station distribution; (<b>C</b>) grid point locations for a resolution of 0.1°.</p>
Full article ">Figure 2
<p>Summer (JJA) maximum air temperature: (<b>A</b>) mean of 1951-2015; (<b>B</b>) mean of 1961–1990.</p>
Full article ">Figure 3
<p>Long-term trend of summer (JJA) maximum air temperature anomalies with respect to the 1961-1990 period; (<b>A</b>) areal mean elevation ≤500 m a.s.l. (bars) and Poznań station (line), (<b>B</b>) areal mean elevation &gt;500 m a.s.l. (bars) and Kasprowy Wierch high mountain observatory (line); dotted lines—linear trends.</p>
Full article ">Figure 4
<p>Multi-temporal trend analysis of summer (JJA) maximum air temperature (°C/10 years) in succeeding multi-year periods; (<b>A</b>) areal mean elevation ≤500 m a.s.l., (<b>B</b>) areal mean elevation &gt;500 m a.s.l. Colors correspond to the positive (red) and negative (blue) trend values.</p>
Full article ">Figure 5
<p>Summer (JJA) maximum air temperature with occurrence probability of 5% (i.e., 95th percentile): (<b>A</b>) 1951–2015, (<b>B</b>) 1961–1990.</p>
Full article ">Figure 6
<p>Long-term trend of the 95th percentile of summer (JJA) maximum air temperature values calculated for consecutive 30-year periods; (<b>A</b>) areal mean elevation ≤500 m a.s.l. (continuous line) and Poznań station (dashed line), (<b>B</b>) areal mean elevation &gt;500 m a.s.l. (continuous line) and Kasprowy Wierch high mountain observatory (dashed line); dotted lines—linear trends.</p>
Full article ">Figure 7
<p>Spatial distribution of the trend of summer (JJA) maximum air temperature with an occurrence probability of 5% (i.e., 95th percentile, as presented in <a href="#atmosphere-08-00051-f006" class="html-fig">Figure 6</a>).</p>
Full article ">Figure 8
<p>Long-term courses of number of days with extreme summer (JJA) maximum air temperature (<b>A</b>) areal mean for locations ≤500 m a.s.l. (bars) and Poznań station (dashed line), (<b>B</b>) areal mean for locations &gt;500 m a.s.l. (bars) and Kasprowy Wierch high mountain observatory (dashed line).</p>
Full article ">Figure 9
<p>Spatial distribution of the trend in the number of days with extreme summer (JJA) maximum air temperature (days/10 years).</p>
Full article ">Figure 10
<p>Relationship between two parameters of an extremity index (TS95 and TA) for extreme temperature events during 1951–2015 and the related Extremity Index (EI) ranges.</p>
Full article ">Figure 11
<p>Summer (JJA) temperature surplus (1951–2015); (<b>A</b>) long-term mean, (<b>B</b>) trend per 10 years.</p>
Full article ">Figure 12
<p>Long-term trends of areal mean summer (JJA) temperature surplus—anomalies with respect to the 1961-1990 period; (<b>A</b>) areal mean elevations ≤500 m a.s.l., (<b>B</b>) areal mean elevations &gt;500 m a.s.l. (dotted lines—linear trends).</p>
Full article ">Figure 13
<p>Long-term courses of the total area affected by extreme summer (JJA) maximum air temperature (1951–2015); (<b>A</b>) anomalies with respect to the 1961–1990 period (dotted line—linear trend), (<b>B</b>) inter seasonal differentiation.</p>
Full article ">Figure 14
<p>Long-term courses of the monthly and seasonal means of the extremity index (°C·km<sup>2</sup>) (1951-2015): (<b>A</b>) June, (<b>B</b>) July, (<b>C</b>) August, (<b>D</b>) summer season (dotted line—linear trend).</p>
Full article ">
13255 KiB  
Article
Synoptic Conditions Generating Heat Waves and Warm Spells in Romania
by Lucian Sfîcă, Adina-Eliza Croitoru, Iulian Iordache and Antoniu-Flavius Ciupertea
Atmosphere 2017, 8(3), 50; https://doi.org/10.3390/atmos8030050 - 1 Mar 2017
Cited by 48 | Viewed by 8517
Abstract
Heat waves and warm spells are extreme meteorological events that generate a significant number of casualties in temperate regions, as well as outside of temperate regions. For the purpose of this paper, heat waves and warm spells were identified based on daily maximum [...] Read more.
Heat waves and warm spells are extreme meteorological events that generate a significant number of casualties in temperate regions, as well as outside of temperate regions. For the purpose of this paper, heat waves and warm spells were identified based on daily maximum temperatures recorded at 27 weather stations located in Romania over a 55-year period (1961–2015). The intensity threshold was the 90th percentile, and the length of an event was of minimum three consecutive days. We analyzed 111 heat wave and warm spell events totaling 423 days. The classification of synoptic conditions was based on daily reanalysis at three geopotential levels and on the online version of a backward trajectories model. The main findings are that there are two major types of genetic conditions. These were identified as: (i) radiative heat waves and warm spells (type A) generated by warming the air mass due to high amounts of radiation which was found dominant in warm season; and (ii) advective heat waves and warm spells (type B) generated mainly by warm air mass advection which prevails in winter and transition seasons. These major types consist of two and three sub-types, respectively. The results could become a useful tool for weather forecasters in order to better predict the occurrence of heat waves and warm spells. Full article
(This article belongs to the Special Issue Temperature Extremes and Heat/Cold Waves)
Show Figures

Figure 1

Figure 1
<p>Location of weather stations used for this study.</p>
Full article ">Figure 2
<p>(<b>a</b>) Mean five-day backward trajectories of air particles before the first day of A1 HW/WS type; (<b>b</b>) composite sea level pressure anomaly; (<b>c</b>) composite air temperature anomaly at 850 hPa; and (<b>d</b>) composite of jet stream mean position anomaly at 300 hPa for A1 HW/WS type.</p>
Full article ">Figure 3
<p>(<b>a</b>) Mean five-day backward trajectories of air particles before the first day of A2 HW/WS type; (<b>b</b>) composite sea level pressure anomaly; (<b>c</b>) composite air temperature anomaly at 850 hPa; and (<b>d</b>) composite jet stream mean position anomaly at 300 hPa for A2 HW/WS type.</p>
Full article ">Figure 4
<p>(<b>a</b>) Mean five-day backward trajectories of air particles before the first day of B1 HW/WS type; (<b>b</b>) composite sea level pressure anomaly; (<b>c</b>) composite air temperature anomaly at 850 hPa; and (<b>d</b>) composite jet stream mean position anomaly at 300 hPa for B1 HW/WS type.</p>
Full article ">Figure 5
<p>(<b>a</b>) Mean five-day backward trajectories of air particles before the first day of B2 HW/WS type; (<b>b</b>) composite sea level pressure anomaly; (<b>c</b>) composite air temperature anomaly at 850 hPa; and (<b>d</b>) composite jet stream mean position anomaly at 300 hPa for B2 HW/WS type.</p>
Full article ">Figure 6
<p>(<b>a</b>) Mean five-day backward trajectories of air particles before the first day of B3 HW/WS type; (<b>b</b>) composite sea level pressure anomaly; (<b>c</b>) composite air temperature anomaly at 850 hPa; and (<b>d</b>) composite jet stream mean position anomaly at 300 hPa for B3 HW/WS type.</p>
Full article ">Figure 7
<p>Five-year frequency of HWs/WSs days in Romania (1961–2015) during: (<b>a</b>) radiative sub-types; and (<b>b</b>) advective sub-types.</p>
Full article ">Figure 8
<p>Absolute monthly frequency of HWs/WSs days in Romania (1961-2015) during (<b>a</b>) radiative sub-types; and (<b>b</b>) advective sub-types.</p>
Full article ">Figure 9
<p>Mean maximum temperature anomaly in Romania in summer (<b>a</b>); and mean maximum temperature in: June (<b>b</b>); July (<b>c</b>); and August (<b>d</b>) for A1 HW type based on <b>RO</b>manian <b>C</b>lim<b>A</b>tic <b>DA</b>taset (ROCADA) gridded database.</p>
Full article ">Figure 10
<p>Mean maximum temperature anomaly in Romania in summer (<b>a</b>); and mean maximum temperature in: June (<b>b</b>); July (<b>c</b>); and August (<b>d</b>) for A2 HW type based on ROCADA gridded database.</p>
Full article ">Figure 11
<p>Mean maximum temperature anomaly in Romania in spring and autumn (<b>a</b>); and mean maximum temperature in: March/November (<b>b</b>); April/October (<b>c</b>); and May/September (<b>d</b>), for B1 HW/WS type based on the ROCADA gridded database.</p>
Full article ">Figure 12
<p>Mean maximum temperature anomaly in Romania in spring and autumn (<b>a</b>); and mean maximum temperature in: March/November (<b>b</b>); April/October (<b>c</b>); and May/September (<b>d</b>), for B2 HW/WS type based on the ROCADA gridded database.</p>
Full article ">Figure 13
<p>Mean maximum temperature anomaly in Romania in winter (<b>a</b>); and mean maximum temperature in: December (<b>b</b>); January (<b>c</b>); and February (<b>d</b>) for B3 WS type based on the ROCADA gridded database.</p>
Full article ">
7467 KiB  
Article
On the Interpretation of Gravity Wave Measurements by Ground-Based Lidars
by Andreas Dörnbrack, Sonja Gisinger and Bernd Kaifler
Atmosphere 2017, 8(3), 49; https://doi.org/10.3390/atmos8030049 - 1 Mar 2017
Cited by 23 | Viewed by 6094
Abstract
This paper asks the simple question: How can we interpret vertical time series of middle atmosphere gravity wave measurements by ground-based temperature lidars? Linear wave theory is used to show that the association of identified phase lines with quasi-monochromatic waves should be considered [...] Read more.
This paper asks the simple question: How can we interpret vertical time series of middle atmosphere gravity wave measurements by ground-based temperature lidars? Linear wave theory is used to show that the association of identified phase lines with quasi-monochromatic waves should be considered with great care. The ambient mean wind has a substantial effect on the inclination of the detected phase lines. The lack of knowledge about the wind might lead to a misinterpretation of the vertical propagation direction of the observed gravity waves. In particular, numerical simulations of three archetypal atmospheric mountain wave regimes show a sensitivity of virtual lidar observations on the position relative to the mountain and on the scale of the mountain. Full article
(This article belongs to the Special Issue Atmospheric Gravity Waves)
Show Figures

Figure 1

Figure 1
<p>Gravity wave-induced temperature perturbations observed by Rayleigh lidar on 15/16 December 2015 above Sodankylä, Finland. The temperature measurements are filtered with a 3-h running mean to highlight signatures of gravity waves with periods in the range of approximately 1 to 5 h. The temporal and vertical resolutions are 30 min and 1 km, respectively.</p>
Full article ">Figure 2
<p>Horizontal (<b>a</b>) and vertical (<b>b</b>) components of the phase velocities <math display="inline"> <semantics> <msub> <mi>c</mi> <mrow> <mi>p</mi> <mi>x</mi> </mrow> </msub> </semantics> </math> and <math display="inline"> <semantics> <msub> <mi>c</mi> <mrow> <mi>p</mi> <mi>z</mi> </mrow> </msub> </semantics> </math> (red lines) and group velocities <math display="inline"> <semantics> <msub> <mi>c</mi> <mrow> <mi>g</mi> <mi>x</mi> </mrow> </msub> </semantics> </math> and <math display="inline"> <semantics> <msub> <mi>c</mi> <mrow> <mi>g</mi> <mi>z</mi> </mrow> </msub> </semantics> </math> (blue lines). (<b>c</b>) Horizontal (red lines) and vertical (blue lines) phase velocities <math display="inline"> <semantics> <msub> <mi>c</mi> <mrow> <mi>P</mi> <mi>x</mi> </mrow> </msub> </semantics> </math> and <math display="inline"> <semantics> <msub> <mi>c</mi> <mrow> <mi>P</mi> <mi>z</mi> </mrow> </msub> </semantics> </math>. All curves are drawn for fixed values of <span class="html-italic">m</span> &gt; 0 (upper row) and <span class="html-italic">m</span> &lt; 0 (lower row). Vertical wavelengths <math display="inline"> <semantics> <msub> <mi>λ</mi> <mi>z</mi> </msub> </semantics> </math> = <span class="html-italic">π</span>, 2<span class="html-italic">π</span>, 3<span class="html-italic">π</span>, 4<span class="html-italic">π</span>, 5<span class="html-italic">π</span> and 6<span class="html-italic">π</span> km are represented by lines from dotted to solid, respectively. The wavenumber vectors <math display="inline"> <semantics> <msub> <mover accent="true"> <mi mathvariant="bold">k</mi> <mo stretchy="false">→</mo> </mover> <mi mathvariant="normal">A</mi> </msub> </semantics> </math>, <math display="inline"> <semantics> <msub> <mover accent="true"> <mi mathvariant="bold">k</mi> <mo stretchy="false">→</mo> </mover> <mi mathvariant="normal">B</mi> </msub> </semantics> </math>, <math display="inline"> <semantics> <msub> <mover accent="true"> <mi mathvariant="bold">k</mi> <mo stretchy="false">→</mo> </mover> <mi mathvariant="normal">C</mi> </msub> </semantics> </math> and <math display="inline"> <semantics> <msub> <mover accent="true"> <mi mathvariant="bold">k</mi> <mo stretchy="false">→</mo> </mover> <mi mathvariant="normal">D</mi> </msub> </semantics> </math> denote the four possible orientations of the wave number vector in the respective area of the phase angle <span class="html-italic">φ</span>, as described in <a href="#sec3dot1-atmosphere-08-00049" class="html-sec">Section 3.1</a>.</p>
Full article ">Figure 3
<p>Spatial snapshots of the vertical displacements <math display="inline"> <semantics> <mrow> <mi>ξ</mi> <mo>(</mo> <mi>x</mi> <mo>,</mo> <mi>z</mi> <mo>,</mo> <mi>t</mi> <mo>)</mo> </mrow> </semantics> </math> of horizontally- and vertically-propagating plane waves for the four wavenumber vectors <math display="inline"> <semantics> <msub> <mover accent="true"> <mi mathvariant="bold">k</mi> <mo stretchy="false">→</mo> </mover> <mi mathvariant="normal">A</mi> </msub> </semantics> </math> (<b>a</b>), <math display="inline"> <semantics> <msub> <mover accent="true"> <mi mathvariant="bold">k</mi> <mo stretchy="false">→</mo> </mover> <mi mathvariant="normal">B</mi> </msub> </semantics> </math> (<b>b</b>), <math display="inline"> <semantics> <msub> <mover accent="true"> <mi mathvariant="bold">k</mi> <mo stretchy="false">→</mo> </mover> <mi mathvariant="normal">C</mi> </msub> </semantics> </math> (<b>c</b>) and <math display="inline"> <semantics> <msub> <mover accent="true"> <mi mathvariant="bold">k</mi> <mo stretchy="false">→</mo> </mover> <mi mathvariant="normal">D</mi> </msub> </semantics> </math> (<b>d</b>) at <span class="html-italic">t</span> = 24 min, respectively. The values of the horizontal and vertical wavenumber components are <span class="html-italic">k</span> = <math display="inline"> <semantics> <mrow> <mo>±</mo> <mn>2</mn> <mspace width="0.166667em"/> <mi>π</mi> <mo>/</mo> <msub> <mi>λ</mi> <mi>x</mi> </msub> </mrow> </semantics> </math> with <math display="inline"> <semantics> <msub> <mi>λ</mi> <mi>x</mi> </msub> </semantics> </math> = 8 km and <span class="html-italic">m</span> = <math display="inline"> <semantics> <mrow> <mo>±</mo> <mn>2</mn> <mspace width="0.166667em"/> <mi>π</mi> <mo>/</mo> <msub> <mi>λ</mi> <mi>z</mi> </msub> </mrow> </semantics> </math> with <math display="inline"> <semantics> <msub> <mi>λ</mi> <mi>z</mi> </msub> </semantics> </math> = 4 km, respectively. Red and blue contour lines refer to ± 0.95 times the wave amplitude and illustrate phase lines. The dashed black lines refer to the horizontal position where the vertical time series shown in <a href="#atmosphere-08-00049-f004" class="html-fig">Figure 4</a> are recorded.</p>
Full article ">Figure 4
<p>Vertical time series of the vertical displacements <math display="inline"> <semantics> <mrow> <mi>ξ</mi> <mo>(</mo> <mi>x</mi> <mo>,</mo> <mi>z</mi> <mo>,</mo> <mi>t</mi> <mo>)</mo> </mrow> </semantics> </math> of horizontally- and vertically-propagating plane waves for the four wavenumber vectors <math display="inline"> <semantics> <msub> <mover accent="true"> <mi mathvariant="bold">k</mi> <mo stretchy="false">→</mo> </mover> <mi mathvariant="normal">A</mi> </msub> </semantics> </math> (<b>a</b>), <math display="inline"> <semantics> <msub> <mover accent="true"> <mi mathvariant="bold">k</mi> <mo stretchy="false">→</mo> </mover> <mi mathvariant="normal">B</mi> </msub> </semantics> </math> (<b>b</b>), <math display="inline"> <semantics> <msub> <mover accent="true"> <mi mathvariant="bold">k</mi> <mo stretchy="false">→</mo> </mover> <mi mathvariant="normal">C</mi> </msub> </semantics> </math> (<b>c</b>) and <math display="inline"> <semantics> <msub> <mover accent="true"> <mi mathvariant="bold">k</mi> <mo stretchy="false">→</mo> </mover> <mi mathvariant="normal">D</mi> </msub> </semantics> </math> (<b>d</b>) recorded at the positions marked in <a href="#atmosphere-08-00049-f003" class="html-fig">Figure 3</a>. The values of the horizontal and vertical wavenumber components are <span class="html-italic">k</span> = <math display="inline"> <semantics> <mrow> <mo>±</mo> <mn>2</mn> <mspace width="0.166667em"/> <mi>π</mi> <mo>/</mo> <msub> <mi>λ</mi> <mi>x</mi> </msub> </mrow> </semantics> </math> with <math display="inline"> <semantics> <msub> <mi>λ</mi> <mi>x</mi> </msub> </semantics> </math> = 8 km and <span class="html-italic">m</span> = <math display="inline"> <semantics> <mrow> <mo>±</mo> <mn>2</mn> <mspace width="0.166667em"/> <mi>π</mi> <mo>/</mo> <msub> <mi>λ</mi> <mi>z</mi> </msub> </mrow> </semantics> </math> with <math display="inline"> <semantics> <msub> <mi>λ</mi> <mi>z</mi> </msub> </semantics> </math> = 4 km, respectively. Red and blue contour lines refer to ±0.95 times the wave amplitude and illustrate phase lines. The vertical black lines refer to the time when the plots shown in <a href="#atmosphere-08-00049-f003" class="html-fig">Figure 3</a> are drawn.</p>
Full article ">Figure 5
<p>Spatial snapshots of the vertical displacements <math display="inline"> <semantics> <mrow> <mi>ξ</mi> <mo>(</mo> <mi>x</mi> <mo>,</mo> <mi>z</mi> <mo>,</mo> <mi>t</mi> <mo>)</mo> </mrow> </semantics> </math> of horizontally- and vertically-propagating wave packets with four different wavenumber vectors <math display="inline"> <semantics> <msub> <mover accent="true"> <mi mathvariant="bold">k</mi> <mo stretchy="false">→</mo> </mover> <mi mathvariant="normal">A</mi> </msub> </semantics> </math> (<b>a</b>), <math display="inline"> <semantics> <msub> <mover accent="true"> <mi mathvariant="bold">k</mi> <mo stretchy="false">→</mo> </mover> <mi mathvariant="normal">B</mi> </msub> </semantics> </math> (<b>b</b>), <math display="inline"> <semantics> <msub> <mover accent="true"> <mi mathvariant="bold">k</mi> <mo stretchy="false">→</mo> </mover> <mi mathvariant="normal">C</mi> </msub> </semantics> </math> (<b>c</b>) and <math display="inline"> <semantics> <msub> <mover accent="true"> <mi mathvariant="bold">k</mi> <mo stretchy="false">→</mo> </mover> <mi mathvariant="normal">D</mi> </msub> </semantics> </math> (<b>d</b>) at <span class="html-italic">t</span> = 24 min, respectively. The wave packets are propagating downward (<math display="inline"> <semantics> <msub> <mi>c</mi> <mrow> <mi>g</mi> <mi>z</mi> </mrow> </msub> </semantics> </math> &lt; 0) in the top row and upward (<math display="inline"> <semantics> <msub> <mi>c</mi> <mrow> <mi>g</mi> <mi>z</mi> </mrow> </msub> </semantics> </math> &gt; 0) in the bottom row. Red and blue contour lines refer to ±0.95 times the wave amplitude and illustrate phase lines. The dashed black lines refer to the horizontal position where the time series shown in <a href="#atmosphere-08-00049-f006" class="html-fig">Figure 6</a> are recorded.</p>
Full article ">Figure 6
<p>Vertical time series of the vertical displacements <math display="inline"> <semantics> <mrow> <mi>ξ</mi> <mo>(</mo> <mi>x</mi> <mo>,</mo> <mi>z</mi> <mo>,</mo> <mi>t</mi> <mo>)</mo> </mrow> </semantics> </math> of horizontally- and vertically-propagating wave packets with four different wavenumber vectors <math display="inline"> <semantics> <msub> <mover accent="true"> <mi mathvariant="bold">k</mi> <mo stretchy="false">→</mo> </mover> <mi mathvariant="normal">A</mi> </msub> </semantics> </math> (<b>a</b>), <math display="inline"> <semantics> <msub> <mover accent="true"> <mi mathvariant="bold">k</mi> <mo stretchy="false">→</mo> </mover> <mi mathvariant="normal">B</mi> </msub> </semantics> </math> (<b>b</b>), <math display="inline"> <semantics> <msub> <mover accent="true"> <mi mathvariant="bold">k</mi> <mo stretchy="false">→</mo> </mover> <mi mathvariant="normal">C</mi> </msub> </semantics> </math> (<b>c</b>) and <math display="inline"> <semantics> <msub> <mover accent="true"> <mi mathvariant="bold">k</mi> <mo stretchy="false">→</mo> </mover> <mi mathvariant="normal">D</mi> </msub> </semantics> </math> (<b>d</b>) recorded at the positions marked in <a href="#atmosphere-08-00049-f005" class="html-fig">Figure 5</a>, respectively. The wave packets are propagating downward (<math display="inline"> <semantics> <msub> <mi>c</mi> <mrow> <mi>g</mi> <mi>z</mi> </mrow> </msub> </semantics> </math> &lt; 0) in the top row and upward (<math display="inline"> <semantics> <msub> <mi>c</mi> <mrow> <mi>g</mi> <mi>z</mi> </mrow> </msub> </semantics> </math> &gt; 0) in the bottom row. Red and blue contour lines refer to ±0.95 times the wave amplitude and illustrate phase lines. The vertical black lines refer to the time when the plots shown in <a href="#atmosphere-08-00049-f005" class="html-fig">Figure 5</a> are drawn.</p>
Full article ">Figure 7
<p>Spatial snapshots of the vertical displacements <math display="inline"> <semantics> <mrow> <mi>ξ</mi> <mo>(</mo> <mi>x</mi> <mo>,</mo> <mi>z</mi> <mo>,</mo> <mi>t</mi> <mo>)</mo> </mrow> </semantics> </math> of horizontally- and vertically-propagating wave packets with wavenumber vectors <math display="inline"> <semantics> <msub> <mover accent="true"> <mi mathvariant="bold">k</mi> <mo stretchy="false">→</mo> </mover> <mi mathvariant="normal">D</mi> </msub> </semantics> </math> at <span class="html-italic">t</span> = 60 min. The wave frequencies are Doppler shifted by <span class="html-italic">U</span> = <math display="inline"> <semantics> <mrow> <mo>+</mo> <msub> <mi>c</mi> <mrow> <mi>P</mi> <mi>x</mi> </mrow> </msub> </mrow> </semantics> </math> (<b>a</b>), <span class="html-italic">U</span> = 0 (<b>b</b>), <span class="html-italic">U</span> = <math display="inline"> <semantics> <mrow> <mo>−</mo> <msub> <mi>c</mi> <mrow> <mi>P</mi> <mi>x</mi> </mrow> </msub> </mrow> </semantics> </math> (<b>c</b>) and <span class="html-italic">U</span> = <math display="inline"> <semantics> <mrow> <mo>−</mo> <mn>2</mn> <mspace width="0.166667em"/> <msub> <mi>c</mi> <mrow> <mi>P</mi> <mi>x</mi> </mrow> </msub> </mrow> </semantics> </math> (<b>d</b>), respectively. Red and blue contour lines refer to ± 0.95 times the wave amplitude and illustrate phase lines. The dashed vertical black lines refer to the horizontal positions <span class="html-italic">x</span> = −12 km, 0, 12 km where the vertical time series shown in <a href="#atmosphere-08-00049-f008" class="html-fig">Figure 8</a> are recorded. The blue, red, and black crosses refer to the vertical positions <span class="html-italic">z</span> = 24.6 km, 29.6 km and 34.6 km where the time series of <a href="#atmosphere-08-00049-f009" class="html-fig">Figure 9</a> are recorded.</p>
Full article ">Figure 8
<p>Vertical time series of the vertical displacements <math display="inline"> <semantics> <mrow> <mi>ξ</mi> <mo>(</mo> <mi>x</mi> <mo>,</mo> <mi>z</mi> <mo>,</mo> <mi>t</mi> <mo>)</mo> </mrow> </semantics> </math> of horizontally- and vertically-propagating wave packets with the wavenumber vector <math display="inline"> <semantics> <msub> <mover accent="true"> <mi mathvariant="bold">k</mi> <mo stretchy="false">→</mo> </mover> <mi mathvariant="normal">D</mi> </msub> </semantics> </math> recorded at the horizontal positions marked in <a href="#atmosphere-08-00049-f007" class="html-fig">Figure 7</a>. The wave frequencies are Doppler shifted by <span class="html-italic">U</span> <math display="inline"> <semantics> <mrow> <mo>=</mo> <mspace width="0.166667em"/> <mo>+</mo> <msub> <mi>c</mi> <mrow> <mi>P</mi> <mi>x</mi> </mrow> </msub> </mrow> </semantics> </math> (<b>a</b>), <span class="html-italic">U</span> <math display="inline"> <semantics> <mrow> <mo>=</mo> <mspace width="0.166667em"/> </mrow> </semantics> </math>0 (<b>b</b>), <span class="html-italic">U</span> =<math display="inline"> <semantics> <mrow> <mo>−</mo> <msub> <mi>c</mi> <mrow> <mi>P</mi> <mi>x</mi> </mrow> </msub> </mrow> </semantics> </math> (<b>c</b>) and <span class="html-italic">U</span> =<math display="inline"> <semantics> <mrow> <mo>−</mo> <mn>2</mn> <msub> <mi>c</mi> <mrow> <mi>P</mi> <mi>x</mi> </mrow> </msub> </mrow> </semantics> </math> (<b>d</b>), respectively. Red and blue contour lines refer to ±0.95 times the wave amplitude and illustrate phase lines. The vertical black lines refer to the time <span class="html-italic">t</span> = 60 min where the altitude-distance plots are shown in <a href="#atmosphere-08-00049-f007" class="html-fig">Figure 7</a>.</p>
Full article ">Figure 9
<p>Time series of the vertical displacements <math display="inline"> <semantics> <mrow> <mi>ξ</mi> <mo>(</mo> <mi>x</mi> <mo>,</mo> <mi>z</mi> <mo>,</mo> <mi>t</mi> <mo>)</mo> </mrow> </semantics> </math> of horizontally- and vertically-propagating wave packets with the wavenumber vector <math display="inline"> <semantics> <msub> <mover accent="true"> <mi mathvariant="bold">k</mi> <mo stretchy="false">→</mo> </mover> <mi mathvariant="normal">D</mi> </msub> </semantics> </math> recorded at the three positions as marked by colored crosses in <a href="#atmosphere-08-00049-f007" class="html-fig">Figure 7</a>. The wave frequencies are Doppler shifted by <span class="html-italic">U</span> = <math display="inline"> <semantics> <mrow> <mo>+</mo> <msub> <mi>c</mi> <mrow> <mi>P</mi> <mi>x</mi> </mrow> </msub> </mrow> </semantics> </math> (<b>a</b>), <span class="html-italic">U</span> = 0 (<b>b</b>), <span class="html-italic">U</span> = <math display="inline"> <semantics> <mrow> <mo>−</mo> <msub> <mi>c</mi> <mrow> <mi>P</mi> <mi>x</mi> </mrow> </msub> </mrow> </semantics> </math> (<b>c</b>) and <span class="html-italic">U</span> = <math display="inline"> <semantics> <mrow> <mo>−</mo> <mn>2</mn> <mspace width="0.166667em"/> <msub> <mi>c</mi> <mrow> <mi>P</mi> <mi>x</mi> </mrow> </msub> </mrow> </semantics> </math> (<b>d</b>), respectively. The vertical black lines refer to the time <span class="html-italic">t</span> = 60 min where the altitude-distance plots are shown in <a href="#atmosphere-08-00049-f007" class="html-fig">Figure 7</a>.</p>
Full article ">Figure 10
<p>Spatial snapshots <b>left</b> (<b>a</b>,<b>c</b>,<b>e</b>) and vertical times series <b>right</b> (<b>b</b>,<b>d</b>,<b>f</b>) of the potential temperature perturbations <math display="inline"> <semantics> <msup> <mi mathvariant="normal">Θ</mi> <mo>′</mo> </msup> </semantics> </math> for the three different wave regimes. (a,b) non-hydrostatic wave regime; (c,d) hydrostatic nonrotating wave regime; (e,f) hydrostatic rotating wave regime. The right panels in (b,d,f) depict time-averaged <math display="inline"> <semantics> <msup> <mi mathvariant="normal">Θ</mi> <mo>′</mo> </msup> </semantics> </math>-profiles computed over the period from the time indicated by the vertical line until the end time of the respective panels. The spatial snapshots are taken at <span class="html-italic">t</span> = 125 min (a), <span class="html-italic">t</span> = 10 h (c) and <span class="html-italic">t</span> = 5 d (e). The vertical time series are recorded at <span class="html-italic">x</span> = 10 km (b), <span class="html-italic">x</span> = 0 (d) and <span class="html-italic">x</span> = 500 km (f), as indicated by the vertical dashed lines in (a,c,e). The amplitude of the surface topography is exaggerated by a factor of 10 in (a,c,e).</p>
Full article ">Figure 11
<p>Vertical time series of the potential temperature perturbations <math display="inline"> <semantics> <msup> <mi mathvariant="normal">Θ</mi> <mo>′</mo> </msup> </semantics> </math> from wave regime (iii) directly above the mountain (<b>a</b>) at <span class="html-italic">x</span> = 0 and (<b>b</b>) at <span class="html-italic">x</span> = 500 km for two different periods. The right panels depict the time-averaged <math display="inline"> <semantics> <mrow> <mrow> <mo>|</mo> </mrow> <msup> <mi mathvariant="normal">Θ</mi> <mo>′</mo> </msup> <msup> <mrow> <mo>|</mo> </mrow> <mn>2</mn> </msup> </mrow> </semantics> </math>-profiles over the respective periods.</p>
Full article ">Figure 12
<p>Vertical time series of the potential temperature perturbations <math display="inline"> <semantics> <msup> <mi mathvariant="normal">Θ</mi> <mo>′</mo> </msup> </semantics> </math> from wave regime (i) at <span class="html-italic">x</span> = 30 km for (<b>a</b>) <math display="inline"> <semantics> <msub> <mi>τ</mi> <mi>z</mi> </msub> </semantics> </math> = 900 s, (<b>b</b>) <math display="inline"> <semantics> <msub> <mi>τ</mi> <mi>z</mi> </msub> </semantics> </math> = 600 s, (<b>c</b>) <math display="inline"> <semantics> <msub> <mi>τ</mi> <mi>z</mi> </msub> </semantics> </math> = 270 s and (<b>d</b>) <math display="inline"> <semantics> <msub> <mi>τ</mi> <mi>z</mi> </msub> </semantics> </math> = 30 s. The right panels depict the time-averaged <math display="inline"> <semantics> <msup> <mi mathvariant="normal">Θ</mi> <mo>′</mo> </msup> </semantics> </math>-profiles over the respective periods.</p>
Full article ">
2706 KiB  
Article
The Effects of Dominant Driving Forces on Summer Precipitation during Different Periods in Beijing
by Fuxing Li and Li He
Atmosphere 2017, 8(3), 44; https://doi.org/10.3390/atmos8030044 - 27 Feb 2017
Cited by 8 | Viewed by 4500
Abstract
Wavelet analysis methods (CWT, XWT, WTC) were employed to evaluate the impact of dominant climatic driving factors on summer precipitation in the Beijing area based on monthly precipitation data of Beijing ranging from 1880 to 2014. The two climatic driving factors, i.e., the [...] Read more.
Wavelet analysis methods (CWT, XWT, WTC) were employed to evaluate the impact of dominant climatic driving factors on summer precipitation in the Beijing area based on monthly precipitation data of Beijing ranging from 1880 to 2014. The two climatic driving factors, i.e., the East Asian summer monsoon (EASM) and the Northern Limit of Western Pacific Subtropical High (NWPSH) were considered in particular. The relationships between summer precipitation and EASM/NWPSH were also examined. The results revealed similar periods in low-frequency oscillation (76–95 years) and mid-range frequency oscillation (32–60 years) for the summer precipitation in the Beijing area and EASM/NWPSH. The summer precipitation correlated positively with the NWPSH and EASM, especially for periods of 43 years and 33 years, respectively. This indicates that summer precipitation during 1880–1960 and during the years after 1960 was significantly affected by NWPSH and EASM, respectively. Based on the periodic change of 33 years for both summer precipitation and EASM, heavy precipitation can be expected to occur again in Beijing at approximately 2026. Understanding the relationships between summer precipitation and climatic factors is of significant importance for precipitation predictions and water resource variations in the Beijing area. Full article
Show Figures

Figure 1

Figure 1
<p>Topographic map of the Beijing area.</p>
Full article ">Figure 2
<p>Continuous wavelet transform ((<b>left</b>), red color means stronger power and blue means weakest power) and global wavelet spectrum (<b>right</b>) of East Asian Summer Monsoon index (EASMI) (<b>a</b>); Northern Limit of Western Pacific Subtropical High (NWPSH) (<b>b</b>); precipitation of the Beijing area (<b>c</b>).</p>
Full article ">Figure 3
<p>Cross Wavelet Spectrum between EASMI (<b>a</b>) and NWPSH (<b>b</b>) and the precipitation of the Beijing area.</p>
Full article ">Figure 4
<p>Wavelet Coherence Spectrum between EASMI (<b>a</b>); NWPSH (<b>b</b>) and precipitation of the Beijing area.</p>
Full article ">Figure 5
<p>Related periodic components and variations of Beijing summer precipitation and the EASMI (<b>a</b>,<b>c</b>)/NPWSH (<b>b</b>,<b>d</b>).</p>
Full article ">
11769 KiB  
Article
Operational Application of Optical Flow Techniques to Radar-Based Rainfall Nowcasting
by Wang-chun Woo and Wai-kin Wong
Atmosphere 2017, 8(3), 48; https://doi.org/10.3390/atmos8030048 - 25 Feb 2017
Cited by 149 | Viewed by 12329
Abstract
Hong Kong Observatory has been operating an in-house developed rainfall nowcasting system called “Short-range Warning of Intense Rainstorms in Localized Systems (SWIRLS)” to support rainstorm warning and rainfall nowcasting services. A crucial step in rainfall nowcasting is the tracking of radar echoes to [...] Read more.
Hong Kong Observatory has been operating an in-house developed rainfall nowcasting system called “Short-range Warning of Intense Rainstorms in Localized Systems (SWIRLS)” to support rainstorm warning and rainfall nowcasting services. A crucial step in rainfall nowcasting is the tracking of radar echoes to generate motion fields for extrapolation of rainfall areas in the following few hours. SWIRLS adopted a correlation-based method in its first operational version in 1999, which was subsequently replaced by optical flow algorithm in 2010 and further enhanced in 2013. The latest optical flow algorithm employs a transformation function to enhance a selected range of reflectivity for feature tracking. It also adopts variational optical flow computation that takes advantage of the Horn–Schunck approach and the Lucas–Kanade method. This paper details the three radar echo tracking algorithms, examines their performances in several significant rainstorm cases and summaries verification results of multi-year performances. The limitations of the current approach are discussed. Developments underway along with future research areas are also presented. Full article
(This article belongs to the Special Issue Radar Meteorology)
Show Figures

Figure 1

Figure 1
<p>A map of Hong Kong and its vicinity.</p>
Full article ">Figure 2
<p>The circle depicts the 256 km range of a radar scan, while the inner gray square shows the product output domain. The crosshair denotes the location of Tai Mo Shan (TMS) radar.</p>
Full article ">Figure 3
<p>An integrated product of SWIRLS to support rainstorm warning system.</p>
Full article ">Figure 4
<p>Reflectivity and motion fields based at 07:00 (HKT/UTC + 8) on 5 April 2013 (base time). (<b>a</b>) Reflectivity and motion field of TREC at base time; (<b>b</b>) Forecast reflectivity of TREC at 2 h from the base time; (<b>c</b>) Reflectivity and motion field of MOVA at base time; (<b>d</b>) Forecast reflectivity of MOVA at 2 h from the base time; (<b>e</b>) Reflectivity and motion field of ROVER at base time; (<b>f</b>) Forecast reflectivity of ROVER at 2 h from the base time; (<b>g</b>) Actual radar reflectivity at base time; and (<b>h</b>) Actual radar reflectivity at 2 h from the base time.</p>
Full article ">Figure 4 Cont.
<p>Reflectivity and motion fields based at 07:00 (HKT/UTC + 8) on 5 April 2013 (base time). (<b>a</b>) Reflectivity and motion field of TREC at base time; (<b>b</b>) Forecast reflectivity of TREC at 2 h from the base time; (<b>c</b>) Reflectivity and motion field of MOVA at base time; (<b>d</b>) Forecast reflectivity of MOVA at 2 h from the base time; (<b>e</b>) Reflectivity and motion field of ROVER at base time; (<b>f</b>) Forecast reflectivity of ROVER at 2 h from the base time; (<b>g</b>) Actual radar reflectivity at base time; and (<b>h</b>) Actual radar reflectivity at 2 h from the base time.</p>
Full article ">Figure 5
<p>Reflectivity and motion fields based at 07:30 (HKT/UTC + 8) on 26 July 2013 (base time). (<b>a</b>) Reflectivity and motion field of TREC at base time; (<b>b</b>) Forecast reflectivity of TREC at 2 h from the base time; (<b>c</b>) Reflectivity and motion field of MOVA at base time; (<b>d</b>) Forecast reflectivity of MOVA at 2 h from the base time; (<b>e</b>) Reflectivity and motion field of ROVER at base time; (<b>f</b>) Forecast reflectivity of ROVER at 2 h from the base time; (<b>g</b>) Actual radar reflectivity at base time; and (<b>h</b>) Actual radar reflectivity at 2 h from the base time.</p>
Full article ">Figure 5 Cont.
<p>Reflectivity and motion fields based at 07:30 (HKT/UTC + 8) on 26 July 2013 (base time). (<b>a</b>) Reflectivity and motion field of TREC at base time; (<b>b</b>) Forecast reflectivity of TREC at 2 h from the base time; (<b>c</b>) Reflectivity and motion field of MOVA at base time; (<b>d</b>) Forecast reflectivity of MOVA at 2 h from the base time; (<b>e</b>) Reflectivity and motion field of ROVER at base time; (<b>f</b>) Forecast reflectivity of ROVER at 2 h from the base time; (<b>g</b>) Actual radar reflectivity at base time; and (<b>h</b>) Actual radar reflectivity at 2 h from the base time.</p>
Full article ">Figure 6
<p>Reflectivity and motion fields based at 02:00 (HKT/UTC + 8) on 22 May 2013 (base time). (<b>a</b>) Reflectivity and motion field of TREC at base time; (<b>b</b>) Forecast reflectivity of TREC at 1 h from the base time; (<b>c</b>) Reflectivity and motion field of MOVA at base time; (<b>d</b>) Forecast reflectivity of MOVA at 1 h from the base time; (<b>e</b>) Reflectivity and motion field of ROVER at base time; (<b>f</b>) Forecast reflectivity of ROVER at 1 h from the base time; (<b>g</b>) Actual radar reflectivity at base time; and (<b>h</b>) Actual radar reflectivity at 1 h from the base time.</p>
Full article ">Figure 7
<p>Reflectivity and motion field based at 19:00 (HKT/UTC + 8) on 30 March 2014 (base time). (<b>a</b>) Reflectivity and motion field of TREC at base time; (<b>b</b>) Forecast reflectivity of TREC at 1 h from the base time; (<b>c</b>) Reflectivity and motion field of MOVA at base time; (<b>d</b>) Forecast reflectivity of MOVA at 1 h from the base time; (<b>e</b>) Reflectivity and motion field of ROVER at base time; (<b>f</b>) Forecast reflectivity of ROVER at 1 h from the base time; (<b>g</b>) Actual radar reflectivity at base time; and (<b>h</b>) Actual radar reflectivity at 1 h from the base time.</p>
Full article ">Figure 8
<p>A comparison of the performance of various radar echo tracking algorithms at various thresholds in 1–6 h forecasts (<span class="html-italic">x</span>-axis). (<b>a</b>) CSI at 0.5 mm·h<sup>−1</sup> threshold; (<b>b</b>) CSI at 5 mm·h<sup>−1</sup> threshold; (<b>c</b>) CSI at 30 mm·h<sup>−1</sup> threshold; (<b>d</b>) POD at 0.5 mm·h<sup>−1</sup> threshold; (<b>e</b>) POD at 5 mm·h<sup>−1</sup> threshold; (<b>f</b>) POD at 30 mm·h<sup>−1</sup> threshold; (<b>g</b>) FAR at 0.5 mm·h<sup>−1</sup> threshold; (<b>h</b>) FAR at 5 mm·h<sup>−1</sup> threshold; and (<b>i</b>) FAR at 30 mm·h<sup>−1</sup> threshold.</p>
Full article ">Figure 8 Cont.
<p>A comparison of the performance of various radar echo tracking algorithms at various thresholds in 1–6 h forecasts (<span class="html-italic">x</span>-axis). (<b>a</b>) CSI at 0.5 mm·h<sup>−1</sup> threshold; (<b>b</b>) CSI at 5 mm·h<sup>−1</sup> threshold; (<b>c</b>) CSI at 30 mm·h<sup>−1</sup> threshold; (<b>d</b>) POD at 0.5 mm·h<sup>−1</sup> threshold; (<b>e</b>) POD at 5 mm·h<sup>−1</sup> threshold; (<b>f</b>) POD at 30 mm·h<sup>−1</sup> threshold; (<b>g</b>) FAR at 0.5 mm·h<sup>−1</sup> threshold; (<b>h</b>) FAR at 5 mm·h<sup>−1</sup> threshold; and (<b>i</b>) FAR at 30 mm·h<sup>−1</sup> threshold.</p>
Full article ">Figure 9
<p>A seasonal comparison of the performance of various radar echo tracking algorithms at: (<b>a</b>) 0.5 mm·h<sup>−1</sup> threshold for 6 h forecast; (<b>b</b>) 5 mm·h<sup>−1</sup> threshold for 2 h forecast; and (<b>c</b>) 30 mm·h<sup>−1</sup> threshold for 1 h forecast.</p>
Full article ">Figure 9 Cont.
<p>A seasonal comparison of the performance of various radar echo tracking algorithms at: (<b>a</b>) 0.5 mm·h<sup>−1</sup> threshold for 6 h forecast; (<b>b</b>) 5 mm·h<sup>−1</sup> threshold for 2 h forecast; and (<b>c</b>) 30 mm·h<sup>−1</sup> threshold for 1 h forecast.</p>
Full article ">Figure 10
<p>Across year comparison of the performance of ROVER at: (<b>a</b>) 0.5 mm·h<sup>−1</sup>; and (<b>b</b>) 5 mm·h<sup>−1</sup> thresholds for forecast range of 1–6 h.</p>
Full article ">Figure 11
<p>POD and FAR of ROVER at: (<b>a</b>) 0.5 mm·h<sup>−1</sup>; and (<b>b</b>) 5 mm·h<sup>−1</sup> thresholds based on four years of data.</p>
Full article ">Figure 12
<p>HSS of ROVER at: (<b>a</b>) 0.5 mm·h<sup>−1</sup>; and (<b>b</b>) mm·h<sup>−1</sup> thresholds based on four years of data.</p>
Full article ">
4293 KiB  
Article
Morphology, Composition, and Mixing State of Individual Aerosol Particles in Northeast China during Wintertime
by Liang Xu, Lei Liu, Jian Zhang, Yinxiao Zhang, Yong Ren, Xin Wang and Weijun Li
Atmosphere 2017, 8(3), 47; https://doi.org/10.3390/atmos8030047 - 24 Feb 2017
Cited by 19 | Viewed by 6597
Abstract
Northeast China is located in a high latitude area of the world and undergoes a cold season that lasts six months each year. Recently, regional haze episodes with high concentrations of fine particles (PM2.5) have frequently been occurring in Northeast China [...] Read more.
Northeast China is located in a high latitude area of the world and undergoes a cold season that lasts six months each year. Recently, regional haze episodes with high concentrations of fine particles (PM2.5) have frequently been occurring in Northeast China during the heating period, but little information has been available. Aerosol particles were collected in winter at a site in a suburban county town (T1) and a site in a background rural area (T2). Morphology, size, elemental composition, and mixing state of individual aerosol particles were characterized by transmission electron microscopy (TEM). Aerosol particles were mainly composed of organic matter (OM) and S-rich and certain amounts of soot and K-rich. OM represented the most abundant particles, accounting for 60.7% and 53.5% at the T1 and T2 sites, respectively. Abundant spherical OM particles were likely emitted directly from coal-burning stoves. Soot decreased from 16.9% at the T1 site to 4.6% at the T2 site and sulfate particles decrease from 35.9% at the T2 site to 15.7% at the T1 site, suggesting that long-range transport air masses experienced more aging processes and produced more secondary particles. Based on our investigations, we proposed that emissions from coal-burning stoves in most rural areas of the west part of Northeast China can induce regional haze episodes. Full article
(This article belongs to the Special Issue Morphology and Internal Mixing of Atmospheric Particles)
Show Figures

Figure 1

Figure 1
<p>Locations of the two sampling sites and topography of the Northeast China area. The red line from the south to the north indicates rural and urban influence of air quality in Northeast China based on the distribution of population and cites. The blue arrow shows the main wind from northwest China and Mongolia during the sampling period. The T1 and T2 sites are located in a rural influence area.</p>
Full article ">Figure 2
<p>Transmission electron microscopy (TEM) images of organic matter (OM) and S-rich particles. (<b>a</b>) Externally mixed S-rich and OM particle; (<b>b</b>) dumbbell mixing structure between S-rich and OM particles; (<b>c</b>) OM particles surrounded by S-rich; (<b>d</b>) S-rich particle coated by OM. Energy-dispersive X-ray spectrometer (EDS) spectra show elemental composition of individual particles in red font in TEM images.</p>
Full article ">Figure 3
<p>TEM images of K-rich particles. (<b>a</b>) K-rich particles; (<b>b</b>) K-rich particle internally mixed with OM particle. EDS spectra shows the elemental composition of individual particles in red font in TEM images.</p>
Full article ">Figure 4
<p>TEM images of soot particles. (<b>a</b>) Bare soot particle; (<b>b</b>) soot internally mixed with S-rich and OM particle.</p>
Full article ">Figure 5
<p>Relative abundance of aerosol particles at the T1 site and T2 site. Number (N) of the analyzed aerosol particles is shown above each column. The bracket indicates that individual particle possibly contained other particle components.</p>
Full article ">Figure 6
<p>Size distributions of S-rich particles at the T1 site and T2 site.</p>
Full article ">Figure 7
<p>TEM images of aerosol particles at the T1 site (<b>a</b>) and the T2 site (<b>b</b>). The arrows in red, black, and blue indicate OM, S-rich, and soot particles, respectively.</p>
Full article ">Figure 8
<p>The conceptual graph of the emission and transport of pollutants in Northeast China during the winter monsoon. The direct emissions from rural area can influence the air quality of downwind urban areas.</p>
Full article ">
226 KiB  
Letter
On the Action of the Radiation Field Generated by a Traveling-Wave Element and Its Connection to the Time Energy Uncertainty Principle, Elementary Charge and the Fine Structure Constant
by Vernon Cooray and Gerald Cooray
Atmosphere 2017, 8(3), 46; https://doi.org/10.3390/atmos8030046 - 24 Feb 2017
Cited by 5 | Viewed by 4172
Abstract
Recently, we published two papers in this journal. One of the papers dealt with the action of the radiation fields generated by a traveling-wave element and the other dealt with the momentum transferred by the same radiation fields and their connection to the [...] Read more.
Recently, we published two papers in this journal. One of the papers dealt with the action of the radiation fields generated by a traveling-wave element and the other dealt with the momentum transferred by the same radiation fields and their connection to the time energy uncertainty principle. The traveling-wave element is defined as a conductor through which a current pulse propagates with the speed of light in free space from one end of the conductor to the other without attenuation. The goal of this letter is to combine the information provided in these two papers together and make conclusive statements concerning the connection between the energy dissipated by the radiation fields, the time energy uncertainty principle and the elementary charge. As we will show here, the results presented in these two papers, when combined together, show that the time energy uncertainty principle can be applied to the classical radiation emitted by a traveling-wave element and it results in the prediction that the smallest charge associated with the current that can be detected using radiated energy as a vehicle is on the order of the elementary charge. Based on the results, an expression for the fine structure constant is obtained. This is the first time that an order of magnitude estimation of the elementary charge based on electromagnetic radiation fields is obtained. Even though the results obtained in this paper have to be considered as order of magnitude estimations, a strict interpretation of the derived equations shows that the fine structure constant or the elementary charge may change as the size or the age of the universe increases. Full article
5661 KiB  
Article
Seasonal Changing Effect on Airflow and Pollutant Dispersion Characteristics in Urban Street Canyons
by Jingliang Dong, Zijing Tan, Yimin Xiao and Jiyuan Tu
Atmosphere 2017, 8(3), 43; https://doi.org/10.3390/atmos8030043 - 23 Feb 2017
Cited by 20 | Viewed by 5507
Abstract
In this study, the effect of seasonal variation on air flow and pollutant dispersion characteristics was numerically investigated. A three-dimensional urban canopy model with unit aspect ratio (H/D = 1) was used to calculate surface temperature distribution in the street [...] Read more.
In this study, the effect of seasonal variation on air flow and pollutant dispersion characteristics was numerically investigated. A three-dimensional urban canopy model with unit aspect ratio (H/D = 1) was used to calculate surface temperature distribution in the street canyon. Four representative time events (1000 LST, 1300 LST, 1600 LST and 2000 LST) during typical clear summer and winter days were selected to examine the air flow diurnal variation. The results revealed the seasonal variation significantly altered the street canyon microclimate. Compared with the street canyon surface temperature distribution in summer, the winter case showed a more evenly distributed surface temperature. In addition, the summer case showed greater daily temperature fluctuation than that of the winter case. Consequently, distinct pollutant dispersion patterns were observed between summer and winter scenarios, especially for the afternoon (1600 LST) and night (2000 LST) events. Among all studied time events, the pollutant removal performance of the morning (1000 LST) and the night (2000 LST) events were more sensitive to the seasonal variation. Lastly, limited natural ventilation performance was found during the summer morning and the winter night, which induced relatively high pollutant concentration along the pedestrian height level. Full article
(This article belongs to the Special Issue Recent Advances in Urban Ventilation Assessment and Flow Modelling)
Show Figures

Figure 1

Figure 1
<p>Schematic diagram of the computational domain (<span class="html-italic">H</span> = 20 m; <span class="html-italic">W</span> = 20 m; <span class="html-italic">D</span> = 2 m; <span class="html-italic">L</span> = 100 m; <span class="html-italic">U</span><sub>a</sub>: ambient wind velocity; <span class="html-italic">T</span><sub>a</sub>: ambient air temperature).</p>
Full article ">Figure 2
<p>Diurnal variation of sunlight angles for four typical time events: (<b>a</b>) Morning (1000 LST); (<b>b</b>) Noon (1300 LST); (<b>c</b>) Afternoon (1600 LST); (<b>d</b>) Night (2000 LST).</p>
Full article ">Figure 3
<p>Meteorological conditions: (<b>a</b>) solar radiation; and (<b>b</b>) air temperature, dew point and sky effective temperature.</p>
Full article ">Figure 4
<p>Surface temperature comparison between numerical simulations with field measurements: (<b>a</b>) Northern wall; (<b>b</b>) Southern wall [<a href="#B41-atmosphere-08-00043" class="html-bibr">41</a>].</p>
Full article ">Figure 5
<p>Comparison of normalized horizontal velocity along the centerline of the street canyon between numerical simulation and wind tunnel data (Uehara et al., 2000).</p>
Full article ">Figure 6
<p>Diurnal variation of canyon facets temperatures between summer and winter conditions.</p>
Full article ">Figure 7
<p>Temperature comparison for all time events: (<b>a</b>) leeward wall and ground; (<b>b</b>) leeward wall and windward wall; (<b>c</b>) the most heated wall and the ambient air. <span class="html-italic">T</span><sub>lee</sub> represents leeward wall temperature; <span class="html-italic">T</span><sub>g</sub> represents ground temperature; <span class="html-italic">T</span><sub>wind</sub> represents windward wall temperature; <span class="html-italic">T</span><sub>max</sub> represents maximum temperature among all canyon facets; <span class="html-italic">T</span><sub>air</sub>: ambient air temperature.</p>
Full article ">Figure 8
<p>Along-canyon averaged streamlines for all time events: (<b>a</b>,<b>b</b>) represents 1000 LST; (<b>c</b>,<b>d</b>) represents 1300 LST; (<b>e</b>,<b>f</b>) represents 1600 LST; (<b>g</b>,<b>h</b>) represents 2000 LST. The averaging calculation was taken from <span class="html-italic">x</span>/<span class="html-italic">L</span> = 0.25 to <span class="html-italic">x</span>/<span class="html-italic">L</span> = 0.75.</p>
Full article ">Figure 9
<p>Averaged horizontal velocity profile on the symmetry plane (<span class="html-italic">y</span> = 0): (<b>a</b>) represents 1000 LST; (<b>b</b>) represents 1300 LST; (<b>c</b>) represents 1600 LST; (<b>d</b>) represents 2000 LST.</p>
Full article ">Figure 10
<p>Along-canyon averaged pollutant concentration: (<b>a</b>,<b>b</b>) represents 1000 LST; (<b>c</b>,<b>d</b>) represents 1300 LST; (<b>e</b>,<b>f</b>) represents 1600 LST; (<b>g</b>,<b>h</b>) represents 2000 LST. Please note, pollutant concentration <math display="inline"> <semantics> <mi>C</mi> </semantics> </math> was normalized by averaged pollutant concentration <math display="inline"> <semantics> <mrow> <mover accent="true"> <mi>C</mi> <mo stretchy="true">¯</mo> </mover> </mrow> </semantics> </math>.</p>
Full article ">Figure 11
<p>Normalized air exchange rate (AER) of the street canyon. Please note, <span class="html-italic">V</span> stands for the volume of street canyon of unity aspect ratio; <span class="html-italic">T</span> stands for the reference time scale <span class="html-italic">H</span>/<span class="html-italic">U</span><sub>a</sub>.</p>
Full article ">Figure 12
<p>Residual pollutant percentage within inhabitant zones: (<b>a</b>) represents the combined results, (<b>b</b>) and (<b>c</b>) represent the localized concentration. (<span class="html-italic">Q</span><sub>wall</sub>: residual pollutant mass in the near-wall-zone; <span class="html-italic">Q</span><sub>ground</sub>: residual pollutant mass in the near-ground-zone; <span class="html-italic">Q</span><sub>i</sub>: residual pollutant mass in the inhabitant-zone, <span class="html-italic">Q</span><sub>r</sub>: total residual pollutant mass).</p>
Full article ">
Previous Issue
Next Issue
Back to TopTop