[go: up one dir, main page]

Article

The Effects of Upper-Ocean Sea Temperatures and Salinity on the Intensity Change of Tropical Cyclones over the Western North Pacific and the South China Sea: An Observational Study

1
Hong Kong Observatory, Hong Kong, China
2
National Marine Data and Information Service, Tianjin 300171, China
3
Department of Civil and Environmental Engineering, Hong Kong University of Science and Technology, Hong Kong, China
*
Author to whom correspondence should be addressed.
Atmosphere 2024, 15(6), 674; https://doi.org/10.3390/atmos15060674
Submission received: 2 April 2024 / Revised: 22 May 2024 / Accepted: 29 May 2024 / Published: 31 May 2024
Figure 1
<p>A flowchart showing the data and methodology used in this study.</p> ">
Figure 2
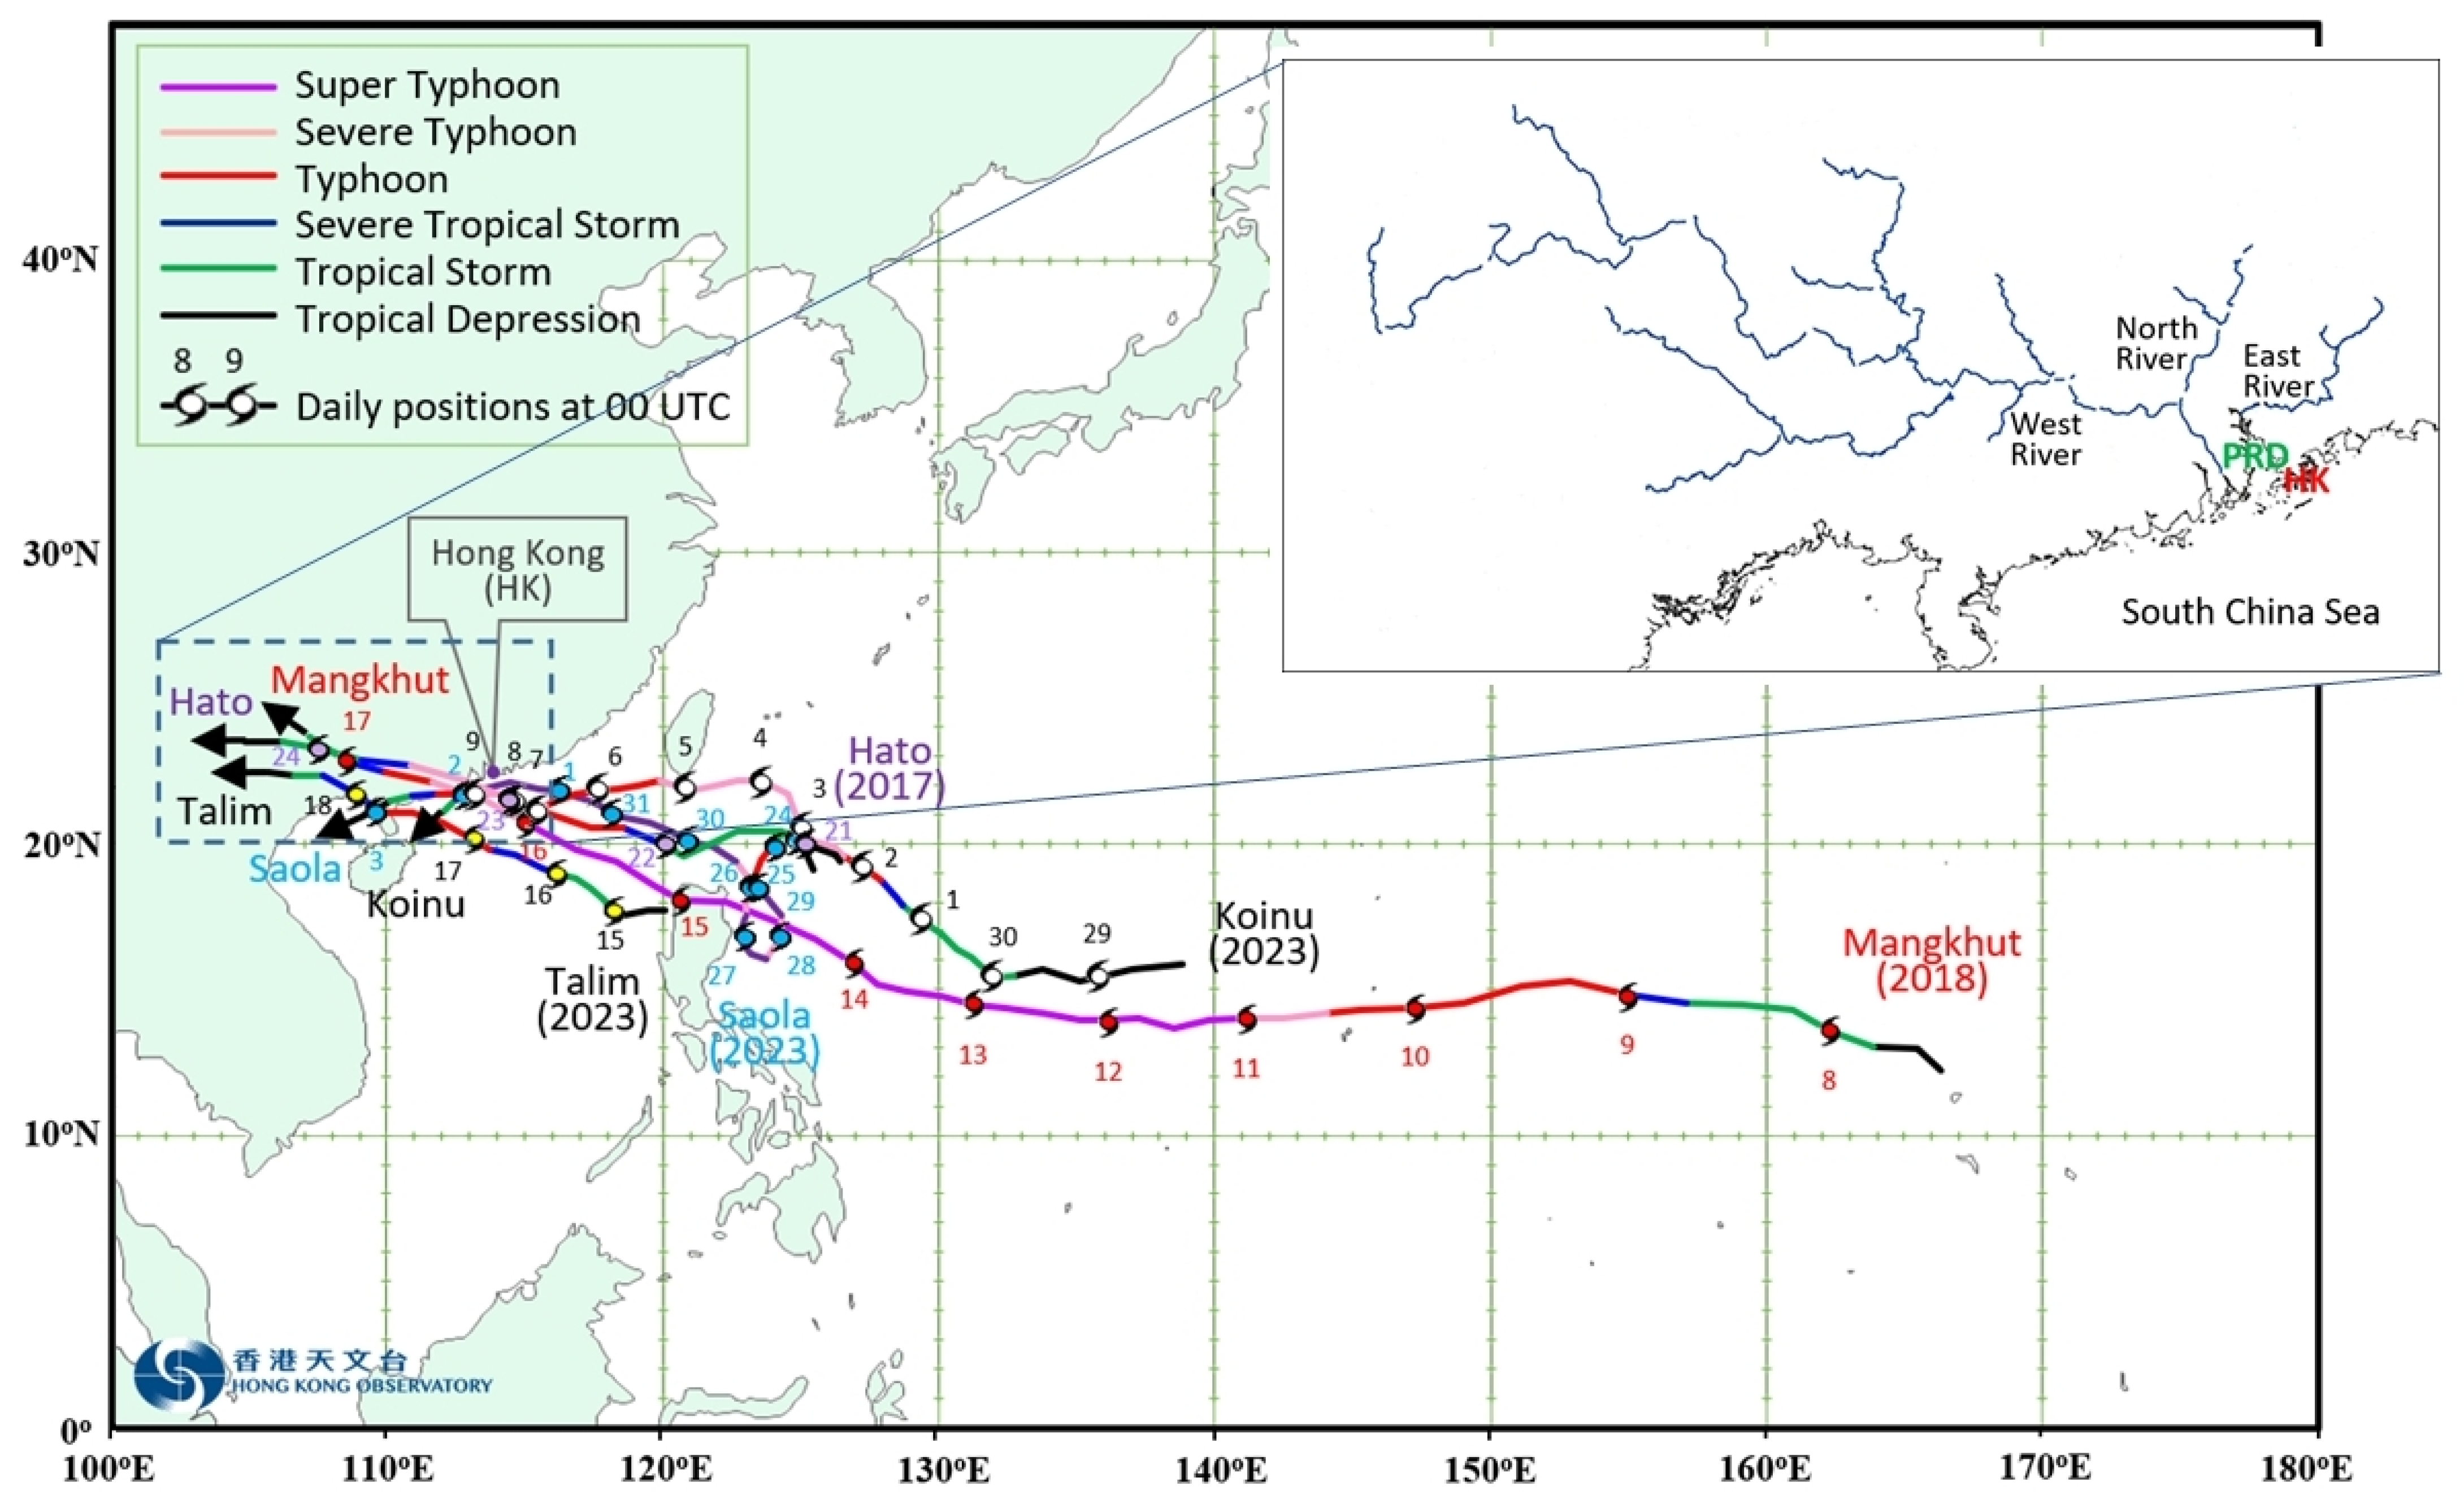
<p>Five TCs that traversed the WNP and the SCS, viz. Super Typhoon Hato (20–24 August 2017), Super Typhoon Mangkhut (7–17 September 2018), Typhoon Talim (14–18 July 2023), Super Typhoon Saola (24 August–3 September 2023), and Severe Typhoon Koinu (29 September–9 October 2023), in the area of study. Blue lines in the inset show the three main tributaries of the Pearl River.</p> ">
Figure 3
<p>Data and methodology used in CORA2.</p> ">
Figure 4
<p>(<b>a</b>) The HKO-analysed track and intensity of TC Hato overlaid on the SST distribution on 20 August 2017 before its passage over the WNP; (<b>b</b>) a snapshot of the vertical profile taken on the same day showing sea temperatures over a sea depth of about 150 m along the TC track with location points as shown in (<b>a</b>). A change in the TC category [<a href="#B50-atmosphere-15-00674" class="html-bibr">50</a>] with the central maximum wind in brackets is also marked on the time line. TC symbol in different colours show different TC categories (TD in black; TS in green, STS in blue, T in red, ST in pink, SuperT in purple) at the time.</p> ">
Figure 5
<p>The same as <a href="#atmosphere-15-00674-f004" class="html-fig">Figure 4</a>, but replacing SST with SSS.</p> ">
Figure 6
<p>(<b>a</b>) Vertical profile of sea temperatures over a depth of about 150 m below the sea surface shown at locations traversed by TC Mangkhut over the WNP and the SCS (<b>a</b>) before its passage on 7 September 2018, and (<b>b</b>) after its passage on 17 September 2018. The meanings of the annotations are the same as those described for <a href="#atmosphere-15-00674-f004" class="html-fig">Figure 4</a>b. (<b>c</b>) HKO-analysed track and intensity of TC Mangkhut overlaid on SST data for 17 September 2018 after its passage. The dotted blue box marks the region over the WNP where the cooling of the SST was significant.</p> ">
Figure 6 Cont.
<p>(<b>a</b>) Vertical profile of sea temperatures over a depth of about 150 m below the sea surface shown at locations traversed by TC Mangkhut over the WNP and the SCS (<b>a</b>) before its passage on 7 September 2018, and (<b>b</b>) after its passage on 17 September 2018. The meanings of the annotations are the same as those described for <a href="#atmosphere-15-00674-f004" class="html-fig">Figure 4</a>b. (<b>c</b>) HKO-analysed track and intensity of TC Mangkhut overlaid on SST data for 17 September 2018 after its passage. The dotted blue box marks the region over the WNP where the cooling of the SST was significant.</p> ">
Figure 7
<p>The same as <a href="#atmosphere-15-00674-f006" class="html-fig">Figure 6</a> (<b>a</b>) and (<b>b</b>), respectively, but replacing SST with SSS. The meanings of the annotations are the same as those described for <a href="#atmosphere-15-00674-f004" class="html-fig">Figure 4</a>b.</p> ">
Figure 8
<p>The same as <a href="#atmosphere-15-00674-f004" class="html-fig">Figure 4</a>a, but with TC Talim overlaid on the SST distribution (<b>a</b>) on 14 July 2023 before its passage over the SCS; (<b>b</b>) on 16 July 2023 in the middle of its life history; and (<b>c</b>) on 18 July 2023 after its passage.</p> ">
Figure 8 Cont.
<p>The same as <a href="#atmosphere-15-00674-f004" class="html-fig">Figure 4</a>a, but with TC Talim overlaid on the SST distribution (<b>a</b>) on 14 July 2023 before its passage over the SCS; (<b>b</b>) on 16 July 2023 in the middle of its life history; and (<b>c</b>) on 18 July 2023 after its passage.</p> ">
Figure 9
<p>Vertical profile of (<b>a</b>) sea temperatures and (<b>b</b>) salinity over a depth of about 150 m below the sea surface on 14 July 2023 before the passage of TC Talim over the SCS at the locations it traversed. The meanings of the annotations are the same as those described for <a href="#atmosphere-15-00674-f004" class="html-fig">Figure 4</a>b.</p> ">
Figure 9 Cont.
<p>Vertical profile of (<b>a</b>) sea temperatures and (<b>b</b>) salinity over a depth of about 150 m below the sea surface on 14 July 2023 before the passage of TC Talim over the SCS at the locations it traversed. The meanings of the annotations are the same as those described for <a href="#atmosphere-15-00674-f004" class="html-fig">Figure 4</a>b.</p> ">
Figure 10
<p>(<b>a</b>) The same as <a href="#atmosphere-15-00674-f004" class="html-fig">Figure 4</a>a, but with TC Saola overlaid on the SST distribution (<b>a</b>) on 24 August 2023 before its passage over the WNP; and vertical profiles of (<b>b</b>) the sea temperatures and (<b>c</b>) the salinity over a depth of about 150 m below the sea surface on 24 August 2023 before its passage over the WNP and the SCS at the locations it traversed, as shown in (<b>a</b>). The meanings of the annotations are the same as those described for <a href="#atmosphere-15-00674-f004" class="html-fig">Figure 4</a>b.</p> ">
Figure 10 Cont.
<p>(<b>a</b>) The same as <a href="#atmosphere-15-00674-f004" class="html-fig">Figure 4</a>a, but with TC Saola overlaid on the SST distribution (<b>a</b>) on 24 August 2023 before its passage over the WNP; and vertical profiles of (<b>b</b>) the sea temperatures and (<b>c</b>) the salinity over a depth of about 150 m below the sea surface on 24 August 2023 before its passage over the WNP and the SCS at the locations it traversed, as shown in (<b>a</b>). The meanings of the annotations are the same as those described for <a href="#atmosphere-15-00674-f004" class="html-fig">Figure 4</a>b.</p> ">
Figure 11
<p>(<b>a</b>) The same as <a href="#atmosphere-15-00674-f004" class="html-fig">Figure 4</a>a, except with TC Koinu overlaid on the SST distribution (<b>a</b>) on 30 September 2023 before its passage over the WNP; and vertical profiles of (<b>b</b>) the sea temperatures and (<b>c</b>) the salinity over a depth of about 150 m below the sea surface on 30 September 2023 before its passage over the WNP and the SCS at the locations it traversed, as shown in (<b>a</b>). The meanings of the annotations are the same as those described for <a href="#atmosphere-15-00674-f004" class="html-fig">Figure 4</a>b.</p> ">
Figure 11 Cont.
<p>(<b>a</b>) The same as <a href="#atmosphere-15-00674-f004" class="html-fig">Figure 4</a>a, except with TC Koinu overlaid on the SST distribution (<b>a</b>) on 30 September 2023 before its passage over the WNP; and vertical profiles of (<b>b</b>) the sea temperatures and (<b>c</b>) the salinity over a depth of about 150 m below the sea surface on 30 September 2023 before its passage over the WNP and the SCS at the locations it traversed, as shown in (<b>a</b>). The meanings of the annotations are the same as those described for <a href="#atmosphere-15-00674-f004" class="html-fig">Figure 4</a>b.</p> ">
Versions Notes

Abstract

:
With increasing air and sea temperatures, the thermodynamic environments over the oceans are becoming more favourable for the development of intense tropical cyclones (TCs) with rapid intensification (RI). The South China coastal region consists of highly densely populated cities, especially over the Pearl River Delta (PRD) region. Intense TCs maintaining their strength or the RI of TCs close to the coastal region can present substantial forecasting challenges and have significant potential impacts on the coastal population. This study investigates the effect of sea-surface and sub-surface temperatures and salinity on the intensification of five TCs, namely Super Typhoon Hato in 2017, Super Typhoon Mangkhut in 2018, and Typhoon Talim, Super Typhoon Saola, and Severe Typhoon Koinu in 2023, which have significantly affected the South China coastal region and triggered high TC warning signals in Hong Kong in the past few years. This analysis utilised the Hong Kong Observatory’s TC best-track and intensity data, along with sea temperature and salinity profiles generated using the China Ocean ReAnalysis version 2 (CORA2) product from the National Marine Data and Information Service of China. It was found that high sea-surface temperatures (SST) of 30 °C or above for a depth of about 20 m, low sea-surface salinity (SSS) levels of 33.8 psu or below for a depth of at least 20 m, and strong salinity stratification of at least 0.6 psu per 100 m depth might offer useful hints for predicting the RI of TCs over the western North Pacific and the South China Sea (SCS) in operational forecasting, while noting other contributing environmental factors and synoptic flow patterns conducive to RI. This study represents the first documentation of sub-surface salinity’s impact on some intense TCs traversing the SCS during 2017–2023 based on an observational study. Our aim is to supplement operational techniques for forecasting RI with some quantitative guidance based on upper-level ocean observations of temperatures and salinity, on top of well-known but more rapidly changing dynamical factors like low-level convergence, weak vertical wind shear, and upper-level divergent outflow, as forecasted with numerical weather prediction models. This study will also encourage further research to refine the analysis of quantitative contributions from different RI factors and the identification of essential features for developing AI models as one way to improve the forecasting of TC RI before the TC makes landfall near the PRD, with due consideration given to the effect of freshwater river discharge from the Pearl River.

1. Introduction

The coast of southern China is often hit by tropical cyclones (TCs) in summer. Situated at the eastern side of the Pearl River Delta (PRD) of the South China coast, Hong Kong is affected by five to six TCs each year on average [1]. TCs generally bring severe weather to the regions they pass by. In TC forecasting and warning operations, one of the major challenges is forecasting TCs’ intensity and, in particular, their rapid intensification (RI). Against the background of climate change, air and sea temperatures have increased and thermodynamic environments around TCs have become more favourable for intensification, which will cause storm surges to become more severe [2]. In fact, a significant increase in intensification rates has been observed in multiple basins [3,4,5,6,7,8]. The number of TCs undergoing RI was found to be rising [9,10,11,12]. A TC undergoing RI over coastal sea areas before landfalling is particularly impactful and threatening to coastal lives and properties. There have also been studies showing that offshore areas within 400 km of the coastline have experienced a significant increase in RI events, with the count tripling from 1980 to 2020 globally [13]. An increase in the annual maximum intensity of TC landfalls over southern China during 2012–2018 was found to be related to the increase in the frequency of TCs undergoing RI over the SCS and landfalling in southern China, as well as intense typhoons over the WNP maintaining a high intensity before making their landfall [8]. The forecasting challenges associated with these RI events are likely exacerbated by the upward trend in the proportion of TCs that achieve RI in future projections [14].
There have been numerous studies on the RI of TCs over various basins using different approaches, including theories, observational approaches, and statistical and numerical modelling methods [5,8,10,14,15,16,17,18,19,20,21]. Some utilised postprocessing of TC intensity forecasts from numerical weather prediction (NWP) models together with the use of artificial intelligence (AI) [22,23,24]. With increasing model resolution and improved physical schemes with grid-resolvable dynamical and thermodynamic processes, as well as the use of air–sea coupled NWP models, there have been significant improvements in TC track and intensity forecasts. However, the model capability of predicting TC intensity or the RI of TCs accurately, which involves multi-scale processes, remains limited. This may be due to inadequate model capability in providing sufficient heat and energy to support RI [25]. In fact, the accuracy of TC track forecasts will also be affected by the intensity forecast, as stronger TCs typically extend through the depth of the troposphere and are steered by a deep-layer mean wind, while weaker storms typically have less vertical depth and a shallower layer of average winds in the steering environmental flow [26].
More RI cases near the shore pose a significant threat to human lives and properties as well as socioeconomic developments in coastal regions like the PRD in southern China. The Hong Kong Observatory (HKO), which provides official TC forecasts and warnings in Hong Kong, has developed a number of tools for forecasting the intensity change of TCs, and the one for RI forecasting combines logistic regression and the naïve Bayes classifier based on predictors including the tropical cyclone heat potential (TCHP; a measure of the integrated vertical temperature from the sea surface to the depth of the 26 °C isotherm), 200 hPa divergence, 850–200 hPa mean vertical wind shear (VWS), previous 12 h intensity change, and current intensity [27]. Sea temperature and salinity in the upper ocean have not yet been utilised in operational TC intensity forecasting.
Satellite altimetry observations have revealed that oceanic sub-surface warm features such as eddies and currents could make a critical contribution to the sudden intensification of high-impact TCs. These warm features are characterised by high ocean heat content or a high TCHP and can effectively limit a TC’s self-induced negative feedback from ocean cooling to favour intensification [28]. There have been recent studies using machine learning techniques to predict the RI of TCs based on parameters describing the heat content of the ocean and the energy exchanges between the ocean and the atmosphere with the incorporation of the thermal conditions of the upper ocean [29]. Understanding the ocean’s role in generating intense TCs or recognising that RI can produce high-storm-surge events due to landfalling TCs is of utmost importance to national meteorological and hydrological centres (NMHSs), which provide official weather forecasts and warnings to the public and users.
TCs interact not only with the ocean surface but also with the entire upper-ocean column, typically from the surface down to a depth of 100 m. It is therefore also important to understand the air–sea interactions during the passage of a TC, not only in terms of the SST, but also in terms of the upper-ocean thermal structure (UOTS) [30]. Many intense TCs, such as Hurricane Katrina (2005) and Cyclone Nargis (2008), which claimed more than 130,000 lives in Myanmar, suddenly intensify while travelling over regions of positive upper-ocean thermal anomalies, such as warm ocean eddies [31,32]. The anomalous warmer SST also contributed to the RI of the Super Typhoon Rammasun (2014) in the South China Sea (SCS) [33].
In recent years, there has been increasingly more attention paid to the effect of salinity on the intensification of TCs, and some have considered that the upper-ocean salinity profile might be a missing factor in tackling the problem of RI. It is noted that operational statistical–dynamical RI models in many places have not yet used salinity as a predictor [34]. It is commonly known that the strong winds of TCs induce vertical mixing and sea-surface cooling that acts as a negative feedback on the TC intensity. In the western tropical Atlantic, near-surface ocean salinity stratification is substantially enhanced by the freshwater lens of the Amazon–Orinoco River system, which acts to inhibit TC-induced oceanic mixing and SST cooling [35,36]. The reduction in SST cooling caused by salinity stratification has a noticeable positive impact on TCs undergoing RI, but the impact of salinity on more weakly intensifying storms is considered insignificant in the eastern Caribbean and western tropical Atlantic [34]. Similar results were also obtained for the storms over the post-monsoon Bay of Bengal (BoB), where a thick barrier layer with strong salinity stratification induced by the freshwater rainfall and river runoff during the summer monsoon season formed above the top of the thermocline in the northern BoB, limiting TC-induced sea-surface cooling and, in turn, favouring TC intensification [7]. However, there are limited studies about the impact of salinity on the RI of TCs over the WNP and the SCS.
This paper summarises the observations of sea temperature and salinity profiles under water, especially in the upper 100 m or so, and their possible relationship with the intensity changes of selected TCs that have had a significant impact on Hong Kong in recent years. Though the number of cases is limited in this study, it serves as the first documentation of temperature and salinity profiles and their relationship with TC intensity in the WNP and SCS basins, and may stimulate further studies, especially statistical analyses, on more TC cases in this region. Before more in-depth and systematic studies are conducted, the observations and findings in this study can serve as rules of thumb for application in the operational forecasting of TC RI over the WNP and the SCS.

2. Data and Methods

This study utilised the HKO’s TC best-track dataset and analysed the sea temperature and salinity profiles generated from the China Ocean ReAnalysis version 2 (CORA2) of the National Marine Data and Information Service (NMDIS) of China along the TC tracks at 3-hourly intervals. The workflow and methodology are summarised in Figure 1.

2.1. Study Area and TC Data

Intense TCs in recent years that posed significant threats to Hong Kong and necessitated the issuance of TC Warning Signal Number 8 (which gives a warning of gale- or storm-force winds) or even the highest TC Signal No.10 (warning of hurricane-force winds), namely Super Typhoon Hato in 2017, Super Typhoon Mangkhut in 2018, and Typhoon Talim, Super Typhoon Saola, and Severe Typhoon Koinu in 2023, were selected to study the impact of sea temperatures and salinity over a depth of about 150 m on TC intensity changes and, in particular, RI. Three-hourly data on the TCs’ positions and intensity were interpolated from the HKO’s best-track analyses, which were performed after the passage of each TC over the WNP and the SCS (i.e., the area bounded by 0–45° N, 100–180° E) based on all TC-related observational data and information collected, including the unconventional ones, or the operational warning track if best-track data were not available at the time of analysis. The best-track dataset consists of the analysed positions of the TCs, the maximum sustained surface wind, and the minimum sea-level pressure at 6-hourly intervals covering all TCs reaching or above the strength of tropical depression over the above-mentioned area. The intensity is based on the maximum 10 min sustained wind near the centre of the TC. Figure 2 shows the study area and the TC cases selected for this observational study.

2.2. RI Threshold

RI is commonly defined as an increase in the central maximum wind speed of a certain threshold within 24 h. Some take RI to be the 95th percentile of 24 h intensity changes [17]. Subsequently, the threshold of 30 knots has been widely adopted, especially in the Atlantic basin, where the 1 min average wind speed near the TC centre is used [17]. Other thresholds ranging from 25 knots [27] to 45 knots [13] also exist. The HKO’s TC best-track analysis based on the 10 min average wind speed near the TC centre for the analysed intensity was used in this study. According to the recommendation of the World Meteorological Organization (WMO) [37], a conversion factor of 0.93 was used for the conversion of 1 min mean values to 10 min mean values. Using this conversion factor to convert the RI threshold of 1 min mean wind of 30 knots to 10 min mean wind and rounding down to the nearest 5 knots gives an RI threshold of 25 knots of 10 min mean wind. On the other hand, if taking the 95th percentile of intensity change based on the HKO’s TC best-track data from 1986 to 2015, the RI thresholds for a 24 h period are 25 knots in the WNP and 20 knots in the SCS [27]. To ensure the consistency and continuity of forecasts for TCs entering the SCS from the WNP, the same criterion for determining RI, i.e., an intensity gain of 25 knots in 24 h, was adopted for both the WNP and SCS in this study.

2.3. Sea Temperature and Salinity Profiles

The sea temperature and salinity profile data analysed along the tracks of the TCs under study were generated from CORA2, developed by the NMDIS [38]. The ocean variables in the CORA2 product, including sea-surface height (SSH), 3D temperature, salinity, and current, are saved on a global uniform horizontal grid of 0.1° × 0.1° and 50 layers at 3-hourly intervals. The global average monthly root-mean-square error (RMSE) of the sub-surface temperature data from CORA2 was about 0.87 °C and that of salinity was about 0.15 psu with respect to Argo profiles over 0–2000 m between 2004 and 2017 [38].

2.4. Observations Used in Data Assimilation for CORA2

The assimilated observations included in situ temperature–salinity (T-S) profiles, altimeter sea-level anomaly (SLA) data, satellite sea-surface temperature (SST) data, and TOPEX/POSEIDON global tide model (TPXO8) surface tidal elevation data. The T-S profiles were sourced from the data archive of the NMDIS, the World Ocean Database (WOD) 2018 [39], the Global Temperature and Salinity Profile Project (GTSPP), and the Array for Real-Time Geostrophic Oceanography (Argo) Project. The altimeter SLA data came from the gridded Archiving, Validation, and Interpretation of Satellite Oceanographic (AVISO) data, which are part of the Copernicus Marine Environment Monitoring (CMEMS) dataset and merge all of the altimetry mission measurements into a daily grid with a spatial resolution of 0.25 degrees [40]. This study used the daily NOAA Optimum Interpolation Sea Surface Temperature version 2 (OISSTv2) SST data with a resolution of 0.25 degrees × 0.25 degrees [41]. Usually, more than 10 Argo float temperature and salinity profiles were within the region traversed by the TCs under study, viz. Super Typhoon Hato (20–24 August 2017), Super Typhoon Mangkhut (7–17 September 2018), Typhoon Talim (14–18 July 2023), Super Typhoon Saola (24 August–3 September 2023), and Severe Typhoon Koinu (30 September–9 October 2023), which were used in the data assimilation.

2.5. Oceanic Dynamical Model Used for CORA2

The CORA2 product used the MITgcm oceanic dynamical model [42] to solve the 3D primitive equations with an implicit linear free surface under hydrostatic and Boussinesq approximations. A cube–sphere grid projection, allowing a relatively even grid spacing throughout the whole model domain with no singularities, was adopted in this model [43]. The model domain covered the whole globe. The horizontal grid spacing was about 9 km. There were 50 vertical levels, with thicknesses ranging from 10 m near the surface to around 450 m at the maximum model depth of 6150 m. The topography data were taken from the General Bathymetric Chart of the Ocean (GEBCO08) bathymetry data at a resolution of 30 arcseconds. The atmospheric forcing variables included 10 m wind, 2 m temperature and humidity, total precipitation, and surface-downward shortwave and longwave radiative fluxes from the Japanese 55-year Reanalysis (JRA-55) of the Japan Meteorological Agency [44,45]. The wind stress over the ocean was calculated following the bulk formulas of Large and Pond [46]. Seasonal climatology was used for runoff [47]. The model employed quadratic bottom-boundary-layer drag and there was no parametrisation of the topographic internal wave drag [48]. The data and methodology used in CORA2 are summarised in Figure 3.

3. Results

3.1. Super Typhoon Hato in August 2017

Super Typhoon Hato brought severe storm surges and damaging winds to the coastal region of the PRD, including Hong Kong and Macao [49]. Record-high sea levels were recorded in many places, and there were serious floods and significant casualties and economic losses over the region, in particular the inner-harbour area of Macau, which experienced the worst flooding seen since 1925. The track and intensity of Hato overlaid on the SST plot are given in Figure 4a. One major challenge of forecasting Hato is its RI over the northern part of the SCS from location points 14 to 22, with an intensity gain of 45 knots in 24 h, and its strengthening to a super typhoon with an estimated sustained wind of 100 knots near its centre at around 03 UTC 23 August 2017, just a couple of hours before it made landfall about 100 km west of Hong Kong. The circulation of Hato was compact and the radius of its gale-force winds was about 160 km. The SST distribution is assumed to be unchanged before the passage of a TC. From the depth–location plot of sea temperatures in Figure 4b, Hato was the only one, among the five TCs studied in this paper, that experienced persistently high SSTs along its track, over 30 °C, with a vertical extent of about 20 m below the sea surface. Sea temperatures of above 26 °C spanned over a depth of about 40 m over the northern part of the SCS. These relatively high sea temperatures are considered to be a major factor for the intensification of Hato. After the passage of Hato over the SCS, the SST drop was only about 1 °C and upwelling was not significant.
The sea-surface salinity (SSS) and the salinity profile along the track of Hato can be found in Figure 5a and Figure 5b, respectively. During the RI period with the intensity gain of 45 knots in 24 h from location points 14 to 22, there appeared significant rapid changes in intensity, namely with a 3 h increase of 10 knots in the central maximum wind at around 06 UTC 22 August and also at 00 UTC on 23 August, and it was found to have a good correlation with a relatively low SSS, namely below 33.4 psu for a depth of about 20 m, and a relatively strong salinity stratification, in the order of a change of 1 psu per 100 m of water depth. In fact, the two pools of relatively low-salinity seawater also coincided well with the two pools of 30 °C seawater in the upper ocean. This is the first time that SSS and vertical salinity profiles have been documented for Hato in 2017. These factors may have contributed to the intensification of Hato when it was close to the South China coast.

3.2. Super Typhoon Mangkhut in September 2018

Super Typhoon Mangkhut in 2018 was characterised by its extensive circulation, ferocious winds, and fast movement, as well as its special wind structure [49]. It brought damaging winds and severe storm surges to the coast of Pearl River estuary, leading to many buildings and coastal structures suffering damages, as well as the serious inundation of low-lying areas. Although Mangkhut showed signs of weakening after it moved across Luzon and took on a track further away from Hong Kong compared with Hato, its extensive circulation with a radius of gale-force winds of about 400 km and maintenance of intensity as a severe typhoon before making landfall about 160 km west of Hong Kong still caused widespread and serious impacts, as well as record-breaking storm surges at levels unseen since records began in 1954 in Hong Kong.
The sea temperature profiles along the track of Mangkhut are shown in Figure 6a before its passage, and Figure 6b after its passage. The RI of Mangkhut occurred over the WNP with an intensity gain of 30 knots in 24 h ending at 00 UTC on 9 September 2018 from location points 5 to 13, and an increase of 35 knots in 24 h from location points 27 to 25 with the central maximum wind strengthening to 125 knots at around 18 UTC on 11 September 2018. A peak intensity of 135 knots was attained shortly before it moved across Luzon. Over the WNP where the RI occurred, sea temperatures were around 29 °C with a depth of 40 m, while temperatures above 26 °C even reached as deep as 100 m. Compared to those observed for Hato, the SSTs over the SCS in the case of Mangkhut were not particularly high. Sea temperatures were slightly below 29 °C over a depth of 20 m, but those over 26 °C were down to a greater depth of 60 m over the SCS. Mangkhut weakened into a severe typhoon shortly after crossing the landmass of Luzon. It managed to maintain its state as a severe typhoon when it moved across the northern part of the SCS at a fast speed.
The circulation of Mangkhut was extensive and its associated high winds spanned over a large area when it was over the WNP. It is no wonder that after the passage of Mangkhut, there was a significant upwelling of seawater with an SST drop of about 3 °C at the location points 35 and 55 (dotted blue rectangle in Figure 6c) over the seas east of Luzon.
From the salinity profiles recorded before (Figure 7a) and after (Figure 7b) the passage of Mangkhut, the SSS was relatively low in the region of 33.8 psu for a depth of 20 m over the areas where Mangkhut underwent RI over the WNP (i.e., location points 5–13 and 27–35), and the salinity stratification was in the order of 0.8 to 1 psu over a depth of 100 m, being particularly strong when Mangkhut rapidly intensified into a super typhoon. Again, regions of relatively low salinity coincided with warm pools of seawater in the upper ocean of the WNP. With the extensive circulation of Mangkhut, its change in intensity might have been affected by SSS and salinity stratification over a much larger area.
Over the northern part of the SCS, the SSS was distinctively much lower than that of the WNP in the upper ocean. It was as low as 33 psu for a depth of 20 m from the surface, and below 33.4 psu for a depth of 40 m. The salinity stratification was relatively strong (in the order of 0.8 psu for a depth of 100 m), as can be seen in Figure 7a. This, together with the relatively deep layer of warm sea temperatures and fast speed of movement, helped Mangkhut to maintain the strength of a severe typhoon over the SCS. After its passage, apart from the SST cooling as a result of vertical mixing, the SSS also increased, with less salinity stratification at location point 35 and thereafter (Figure 7b). The salinity profiles also suggest vertical mixing of the seawater mainly in the upper 100 m or so over the boundary layer of the ocean.

3.3. Typhoon Talim in July 2023

An observational study of Typhoon Talim based on extensive surface and upper air measurements is documented in [51], but it does not include vertical profiles of sea temperatures and salinity. Figure 8 shows the sequence of SST distribution over the northern part of the SCS for Typhoon Talim. It illustrates the cooling of the SST after the passage of Talim, suggesting the occurrence of vertical mixing of the seawater over the region. An RI with an intensity gain of 25 knots in 24 h occurred at location points 10 to 18. Similar to the case of Hato, the SST was rather high in the case of Talim (Figure 9a), reaching 30 °C for a depth of 20 m over location points 11–21. A low salinity of 33.4 psu over a depth of 20 m was observed in Figure 9b. The salinity stratification was also relatively strong within the upper 100 m or so, with a change of around 1 psu over this depth. The horizontal gradient of temperature and salinity over the path traversed by Talim appears to be rather smooth. Though the relatively high SST and strong salinity stratification should favour intensification, a comparatively lower rate of RI was seen in Talim as compared with other TCs in this study with similar ocean parameters. It is unclear what role the horizontal gradients of salinity and temperature plays in the TC intensification process.

3.4. Super Typhoon Saola in September 2023

Saola necessitated the issuance of the Hurricane Signal No. 10 again, for the first time since Super Typhoon Mangkhut hit Hong Kong in 2018. Saola attained its peak intensity of 120 knots over the SCS, making it the second strongest TC in the SCS since the HKO’s records began in 1950. It brought high winds to Hong Kong. Detailed documentation of the observation and forecasting of Saola can be found in [52,53,54,55]. The track and intensity of Saola overlaid on the SST plot are given in Figure 10a, while the sea temperature and salinity profiles along the track of Saola are given in Figure 10b and Figure 10c, respectively. There were three instances of RI when Saola was over the WNP near Luzon, namely showing intensity gains of 30, 25, and 35 knots in 24 h, respectively: intensifying at location points 11–19 into a severe typhoon with an intensity of 85 knots; intensifying at location points 17–24 into a super typhoon with an intensity of 105 knots; and ending at location points 43–49 with a maximum intensity of 125 knots. Sea temperatures over the intensification regions were around 29 °C over a depth of only 10 m, but temperatures above 26 °C were as deep as 90 m. The salinity stratification over those regions was not particularly strong. The instance of RI with the largest gain in intensity near location point 49 coincides with the region showing a sharp gradient of salinity from the WNP to the SCS, and a relatively strong salinity stratification (around 0.8 psu per 100 m in the upper ocean).
When Saola moved across the region with high sea temperatures of 30 °C with a relatively low salinity of 33.4 psu from location points 55 to 61 shortly after entering into the SCS, unlike Hato, it became weaker instead of undergoing intensification. Both Saola and Hato were developed in late August and their circulation was compact. However, their intensities were different upon entering the SCS: Saola has already intensified into a super typhoon, while Hato was only a tropical storm before entering the SCS. Although Saola showed a weakening trend on its approach to the South China coast, it was still a super typhoon over the northeastern part of the SCS and only underwent significant weakening to the south of Hong Kong, when almost half of its circulation had moved across the landmass.

3.5. Severe Typhoon Koinu in October 2023

Koinu rapidly intensified into a severe typhoon with a maximum intensity of 95 knots over the WNP and weakened into a typhoon after entering the SCS. However, it re-intensified again into a severe typhoon with intensity of 85 knots when it tracked southwestward over the northeastern part of the SCS. Some observations of Koinu are summarised in [56]. Its circulation became increasingly more compact when it moved across the northern part of the SCS, with the radius of gale-force winds decreasing from around 280 km to 85 km when it came close to Hong Kong. The track and intensity of Koinu overlaid on the SST plot are given in Figure 11a. RI with an intensity gain of 35 knots in 24 h occurred at location points 15 to 23. There was a successive increase of 10 knots every 6 h over a period of 18 h, culminating in a total intensity gain of 45 knots in 30 h and ending with a maximum intensity of 95 knots at 12 UTC 2 October 2023 over the WNP.
The Koinu sea temperature and salinity profiles are shown in Figure 11b and Figure 11c, respectively. Although the SSS was on the relatively high side at 34.4 psu and the salinity stratification had a relatively minor value of 0.6 psu for a depth of 100 m over the RI region, the SST was persistently high at around 30 °C with a deep layer down to 40–60 m and a large horizontal extent covering location points 1 to 23. Even if there is vertical mixing of the upper ocean, the deep layer of high temperatures may still be sufficient to provide heat energy to the atmospheric boundary layer and the RI process. The weakening of Koinu at location points 45 to 51 upon entering the SCS might be related to the drop in sea temperatures along its path and half of its circulation hitting the landmass of Taiwan. Koinu also interacted with the northeast monsoon prevailing over southern China after passing south of the Taiwan Strait. Normally, when a TC interacts with a northeast monsoon late in the season, it may weaken when dry and cooler air intrudes into the TC. The steering level of the TC will then be lowered after weakening, and the TC may take on a southwesterly track following the northeasterly flow in the lower levels. However, in the case of Koinu, it intensified rather than weakened when it was tracking southwestward from location points 51 to 61. The preferred location of intensification near the shore may be associated with the strengthening of the interactions between the TC and the upper-level trough, and the transport of water level flux accompanied by the monsoon surge entering the TC’s circulation [57]. The mechanisms of changes in the intensity and track of Koinu over the SCS require detailed analyses of both the dynamical and the thermodynamic processes in its interactions with the northeast monsoon, including the increase in low-level horizontal cyclonic shear, the effect of baroclinicity, the energy transfer, and the inner-core dynamics of the TC.

4. Discussion

The upper ocean interacts with the atmospheric boundary layer, which requires an atmosphere–ocean coupled model to simulate these interactions. However, the complex interactions at different spatial and temporal scales, heat and momentum exchanges between the atmosphere and ocean, and insufficient observational data over the boundary layers make the model forecasting of TC intensity very challenging. Although ocean-related parameters like SST, TCHP, and POT have been considered in past studies of RI over the SCS, most of them did not comprehensively study the upper-level temperatures and salinity of the ocean, analyse the evolution of these factors before and during RI, and assess their contributions as compared with other RI factors. Recent studies on the impact of salinity on rapidly intensifying TCs have demonstrated that the influence of salinity on RI is independent of that of temperature; a study in the eastern Caribbean and western tropical Atlantic demonstrated that the relevance of salinity for a TC increases with its intensification rate, and the use of SSS as an additional predictor in the statistical RI prediction model may significantly improve model performance in RI forecasting [34]. The contributions of various environmental factors to the variability of RI have also not been quantified in other studies, like salinity stratification’s impact on TC RI over the post-monsoon Bay of Bengal [7]. The variability of TC RI and its dependence on different environmental factors may vary among ocean basins. The mixed layer depth in the upper ocean, which controls the turbulent mixing and exchange of heat and momentum in the interactions with the atmosphere, plays an important role in TC intensification. Past studies have not provided much insight into quantitative analyses of sea temperatures and salinity over the upper ocean of the SCS for TC RI over the region. The results of this observational study may be useful for providing some quantitative references of additional predictors in the operational forecasting of TC RI near the shore of the South China coast before a more comprehensive and systematic analysis is carried out.
From the RI cases of Hato in 2017, Mangkhut in 2018, and Talim, Saola, and Koinu in 2023, analyses of the vertical profiles of sea temperatures and salinity over a depth of 100 m or so indicated that over the regions of RI, pools of relatively high-temperature seawater often coincided with relatively low SSS and strong salinity stratification. TCs moving across these regions may likely undergo RI if other favourable environmental factors like weak VWS and large horizontal cyclonic wind shear also support such intensification. It is well known that the SST of RI TCs around the storm centre is significantly higher than that of non-RI TCs [21]. TCs tend to intensify at a higher rate under higher SSTs due to the more abundant supply of latent and sensible heat fluxes [19,58,59]. SSTs near the TC centre exceeding 28 °C meet the necessary SST conditions for RI [15]. In this study, it was found that all five RI cases had SSTs of at least 29 °C and SSS levels below 33.8 psu for a depth of at least about 20 m; temperatures above 26 °C for at least 40 m deep; and salinity stratification in the order of 0.8–1 psu over a depth of 100 m. If the SST is slightly less than 29 °C, a deep layer of temperatures more than 26 °C, for example, over a depth of 60 m or more may also favour RI over the SCS.
There is a sharp gradient of salinity from the WNP to the SCS as there is significant difference in the ocean depth. In fact, the continental shelf off the South China coast with a depth less than 200 m and the freshwater from river discharge, for example from the PRD, may also affect the salinity distribution, noting that the Pearl River is the second largest river in China in terms of water discharge and among the largest 25 rivers in the world [60]. Rapidly intensifying TCs induce a much stronger surface enthalpy flux via salinity stratification compared to more weakly intensifying storms, partly due to a reduction in the SST cooling caused by salinity stratification [34]. A salinity stratification of at least 0.6 psu over a depth of 100 m may be necessary for inhibiting oceanic mixing and SST cooling to some extent. Instances of RI that show a higher increase in intensity appear to have stronger salinity stratifications of 1 psu over 100 m and sea temperatures of 30 °C for a depth of 40 m or more. Salinity modulates ocean density and affects the extent of turbulent mixing in the upper layer of the ocean. Lower-salinity seawater is lighter, and so the upper level of seawater will be more effectively warmed up by solar radiation under strong-salinity-stratification conditions. In fact, their interconnections and causality are still unclear, and a comprehensive study with the use of air–sea coupled models is required to investigate their causality, which is outside the scope of the present study.
The intensity of a TC’s current may also affect the intensity change of the TC after entering the SCS, as seen in the cases of Hato and Saola, where similar favourable conditions for RI were present at the SCS; but the former underwent RI and the latter exhibited a weakening trend when it came close to Hong Kong.
The role that the horizontal gradient of salinity and temperature plays in the TC intensification process is unclear, as revealed in the case of Talim. More in-depth studies of RI and non-RI cases over the SCS are required for a better understanding of the mechanisms and contributions of various environmental factors involved in the rapid intensification or weakening of TCs, which may, respectively, lead to the under-warning or over-warning of TCs in operational forecasting.

5. Summary and Conclusions

An observational study of five intense TCs that developed over the WNP or the SCS and traversed the SCS during 2017–2023, namely Super Typhoon Hato, Super Typhoon Mangkhut, Super Typhoon Saola, Severe Typhoon Koinu, and Typhoon Talim, was conducted to investigate the effect of upper-level sea temperatures and salinity on RI based on the HKO’s TC best-track dataset and the NMDIS’s CORA2 sea temperature and salinity reanalysed data over the WNP and the SCS. An attempt was made to draw up some quantitative references of sea-surface and sub-surface temperatures and salinity for use in the operational forecasting of TC RI over the SCS.
Some major observations from this study are summarised below:
(a)
Relatively high SSTs (30 °C or above) for a depth of about 20 m and relatively strong salinity stratification (0.8 to 1 psu) in the upper ocean of 100 m may be associated with the RI of TCs, or at least with the maintenance of relatively high-intensity values;
(b)
If the SST is slightly less than 29 °C, a deep layer of temperatures more than 26 °C for a depth of 60 m or more may also favour RI over the SCS;
(c)
SSS levels below 33.8 psu for a depth of at least about 20 m may favour RI;
(d)
A salinity stratification of at least 0.6 psu over a depth of 100 m may be necessary for inhibiting oceanic mixing and SST cooling to some extent;
(e)
Persistently low levels of SSS and strong stratification in the SCS near the PRD were observed, which could be related to the freshwater discharge from rivers and rainwater;
(f)
There is a rather sharp gradient of SSS from the WNP to the SCS. Whether or not a TC intensifies or weakens after entering the SCS also depends on the intensity of the current upon its entrance, as well as the sea temperatures and salinity stratification over a certain depth. The interactions of TCs with northeast monsoons and the role of the horizontal gradient of SSS require more in-depth studies.
The contributions of various environmental factors—including large-scale environmental forcing, thermodynamics, and inner-core processes—to TC intensity changes and RI have not been analysed thoroughly and quantified in the present study. The number of TC cases might also be too small to ensure robustness of the findings. Nevertheless, this study presents the first attempt to document the impact of temperature and salinity profiles at a depth of around 150 m for recent intense TCs in the SCS. It is also useful to provide some quantitative forecasting references regarding TC RI for operational TC intensity forecasting over the SCS as a supplement to statistical–dynamical model prediction tools, especially when TCs are near the South China coastal region. In some cases, they might fit in the missing puzzle piece and add to our knowledge of the favourable conditions for RI after considering all dynamical factors of the environmental flow for delineating RI and non-RI identified from the previous research studies.
More statistical analyses of TCs over this basin should be carried out in order to evaluate the probability of the rapid intensification or weakening of TCs that are about to make landfall over the South China coast. Modelling approaches could also be taken to investigate the causality and the interconnections between sea temperatures, sea salinity, and its stratification over the upper ocean. In view of the possible increasing frequency of TCs undergoing the RI process near the South China coast due to climate change, this study also encourages the gathering of more upper-ocean profiles for data assimilation in air–sea coupled NWP models; further research to refine the analysis of quantitative contributions from different RI factors; and the identification of essential features and the associated physical processes for developing AI models as one way to improve RI forecasting for TCs before they make their landfall near the PRD, with due consideration being given to the effects of freshwater river discharge from the Pearl River. Improvements should also be made to air–sea coupled models in simulating upper-ocean temperatures and salinity in order to improve the forecasting of TC RI over the SCS.

Author Contributions

Conceptualisation, P.-W.C. and H.S.; methodology, T.-W.H., Z.G., H.F. and C.S.; software, Z.G., H.F. and C.S.; validation, T.-W.H. and C.-C.L.; formal analysis, P.-W.C., T.-W.H. and C.-C.L.; investigation, Z.G., T.-W.H. and C.-C.L.; resources, P.-W.C.; data curation, T.-W.H.; writing—original draft preparation, P.-W.C. and C.-C.L.; writing—review and editing, C.-C.L. and T.-W.H.; visualisation, T.-W.H. and C.-C.L.; supervision, P.-W.C. and H.S.; project administration, P.-W.C. and C.-C.L. All authors have read and agreed to the published version of the manuscript.

Funding

The research undertaken by H.S. of the Hong Kong University of Science and Technology (HKUST) was funded by the Center for Ocean Research (CORE) Hong Kong–Macau at HKUST.

Institutional Review Board Statement

Not applicable.

Informed Consent Statement

Not applicable.

Data Availability Statement

The data are available upon reasonable request to the National Marine Data and Information Service and the Hong Kong Observatory.The data are not publicly available due to privacy.

Conflicts of Interest

The authors declare no conflicts of interest.

References

  1. Lee, T.C.; Cheng, Y.Y. Typhoon 5-6. Hong Kong Observatory Blog on 3 April 2021. Available online: https://www.hko.gov.hk/en/blog/00000120.htm (accessed on 28 May 2024).
  2. Chen, J.L.; Wang, Z.Q.; Tam, C.Y.; Lau, N.C.; Lau, D.S.; Mok, H.Y. Impacts of climate change on tropical cyclones and induced storm surges in the Pearl River Delta region using pseudo-global-warming method. Sci. Rep. 2020, 10, 1965. [Google Scholar] [CrossRef]
  3. Kishtawal, C.M.; Jaiswal, N.; Singh, R.; Niyogi, D. Tropical cyclone intensification trends during satellite era (1986–2010). Geophys. Res. Lett. 2012, 39, L10810. [Google Scholar] [CrossRef]
  4. Mei, W.; Xie, S.-P. Intensification of landfalling typhoons over the northwest Pacific since the late 1970s. Nat. Geosci. 2016, 9, 753–757. [Google Scholar] [CrossRef]
  5. Balaguru, K.; Foltz, G.R.; Leung, L.R. Increasing magnitude of hurricane rapid intensification in the central and eastern tropical Atlantic. Geophy. Res. Lett. 2018, 45, 4238–4247. [Google Scholar] [CrossRef]
  6. Bhatia, K.T.; Vecchi, G.A.; Knutson, T.R.; Murakami, H.; Kossin, J.; Dixon, K.W.; Whitlock, C.E. Recent increases in tropical cyclone intensification rates. Nat. Commun. 2019, 10, 635. [Google Scholar] [CrossRef]
  7. Fan, K.; Wang, X.; He, Z. Control of salinity stratification on recent increase in tropical cyclone intensification rates over the postmonsoon Bay of Bengal. Environ. Res. Lett. 2020, 15, 094028. [Google Scholar] [CrossRef]
  8. Liu, K.S.; Chan, J.C.L. Recent increase in extreme intensity of tropical cyclones making landfall in south China. Clim. Dyn. 2020, 55, 1059–1074. [Google Scholar] [CrossRef]
  9. Zhao, H.; Duan, X.; Raga, G.B.; Klotzbach, P.J. Changes in characteristics of rapidly intensifying western North Pacific tropical cyclones related to climate regime shifts. J. Clim. 2018, 31, 8163–8179. [Google Scholar] [CrossRef]
  10. Song, J.; Duan, Y.; Klotzbach, P.J. Increasing trend in rapid intensification magnitude of tropical cyclones over the western North Pacific. Environ. Res. Lett. 2020, 15, 084043. [Google Scholar] [CrossRef]
  11. Hong, J.; Wu, Q. Modulation of global sea surface temperature on tropical cyclone rapid intensification frequency. Environ. Res. Commun. 2021, 3, 041001. [Google Scholar] [CrossRef]
  12. Liu, K.S.; Chan, J.C.L. Growing threat of rapidly-intensifying tropical cyclones in East Asia. Adv. Atmos. Sci. 2022, 39, 222–234. [Google Scholar] [CrossRef]
  13. Li, Y.; Tang, Y.; Wang, S.; Toumi, R.; Song, X.Z.; Wang, Q. Recent increases in tropical cyclone rapid intensification events in global offshore regions. Nat. Commun. 2023, 14, 5167. [Google Scholar] [CrossRef]
  14. Bhatia, K.; Baker, A.; Yang, W.C.; Vecchi, G.; Knutson, T.; Murakami, H.; Kossin, J.; Hodges, K.; Dixon, K.; Bronselaer, B.; et al. A potential explanation for the global increase in tropical cyclone rapid intensification. Nat. Commun. 2022, 13, 6626. [Google Scholar] [CrossRef]
  15. Holliday, C.R.; Thompson, A.H. Climatological characteristics of rapidly intensifying typhoons. Mon. Weather Rev. 1979, 107, 1022–1034. [Google Scholar]
  16. Hu, H.; Duan, Y. Analysis of environmental variables of rapidly intensifying tropical cyclones in the South China Sea. J. Trop. Meteorol. 2016, 32, 299–310, (In Chinese, with English Abstract). [Google Scholar] [CrossRef]
  17. Kaplan, J.; DeMaria, M. Large-scale characteristics of rapidly intensifying tropical cyclones in the North Atlantic basin. Weather Forecast. 2003, 18, 1093–1108. [Google Scholar] [CrossRef]
  18. Kaplan, J.; DeMaria, M.; Knaff, J.A. A revised tropical cyclone rapid intensification index for the Atlantic and eastern North Pacific basins. Weather Forecast. 2010, 25, 220–241. [Google Scholar] [CrossRef]
  19. Gao, S.; Chiu, L.S. Surface latent heat flux and rainfall associated with rapidly intensifying tropical cyclones over the western North Pacific. Int. J. Rem. Sens. 2010, 31, 469904710. [Google Scholar] [CrossRef]
  20. Chen, X.; Wang, Y.; Zhao, K. Synoptic flow patterns and large-scale characteristics associated with rapidly intensifying tropical cyclones in the South China Sea. Mon. Weather Rev. 2014, 143, 64–87. [Google Scholar] [CrossRef]
  21. Chen, Y.; Gao, S.; Li, X.; Shen, X. Key environmental factors for rapid intensification of the South China Sea tropical cyclones. Front. Earth Sci. 2021, 8, 609727. [Google Scholar] [CrossRef]
  22. Xu, W.; Balaguru, K.; August, A.; Lalo, N.; Hodas, N.; DeMaria, M.; Judi, D. Deep learning experiments for tropical cyclone intensity forecasts. Weather Forecast. 2021, 36, 1453–1470. [Google Scholar] [CrossRef]
  23. Griffin, S.M.; Wimmers, A.; Velden, C.S. Predicting rapid intensification in North Atlantic and eastern North Pacific tropical cyclones using a convolutional neural network. Weather Forecast. 2022, 37, 1333–1355. [Google Scholar] [CrossRef]
  24. Wei, Y.; Yang, R.; Sun, D. Investigating tropical cyclone rapid intensification with an advanced artificial intelligence system and gridded reanalysis data. Atmosphere 2023, 14, 195. [Google Scholar] [CrossRef]
  25. Huang, Y.Y.; Zhang, Y.X.; Zhang, C.Z.; Zheng, B.; Dai, G.F.; Li, M.J. An assessment of model capability on rapid intensification prediction of tropical cyclones in the South China Sea. Dyn. Atmos. Ocean. 2024, 106, 101431. [Google Scholar] [CrossRef]
  26. WMO. Global Guide to Tropical Cyclone Forecasting; WMO-No.1194; WMO: Geneva, Switzerland, 2017; 397p. [Google Scholar]
  27. Tam, H.F.; Choy, W.C.; Wong, W.K. Development of objective forecast guidance on tropical cyclone rapid intensity change. Meteorol. Appl. 2021, 28, e1981. [Google Scholar] [CrossRef]
  28. Lin, I.-I.; Goni, G.J.; Knaff, J.A.; Forbes, C.; Ali, M.M. Ocean heat content for tropical cyclone intensity forecasting and its impact on storm surge. Nat. Hazards 2013, 66, 1481–1500. [Google Scholar] [CrossRef]
  29. Kim, S.H.; Lee, W.J.; Kang, H.W.; Kang, S.K. Predicting rapid intensification of tropical cyclones on the western North Pacific: A machine learning and net energy gain rate approach. Front. Mar. Sci. 2024, 10, 1296274. [Google Scholar] [CrossRef]
  30. Lin, I.-I.; Pun, I.F.; Wu, C.C. Upper ocean thermal structure and the western North Pacific category-5 typhoons part II: Dependence on translation speed. Mon. Weather Rev. 2009, 137, 3744–3757. [Google Scholar] [CrossRef]
  31. Scharroo, R.; Smith, W.H.F.; Lillibridge, J.L. Satellite altimetry and the intensification of Hurricane Katrina. Eos 2005, 86, 366. [Google Scholar] [CrossRef]
  32. Lin, I.-I.; Chen, C.H.; Pun, I.F.; Liu, W.T.; Wu, C.C. Warm ocean anomaly, air sea fluxes, and the rapid intensification of tropical cyclone Nargis (2008). Geophys. Res. Lett. 2009, 36, LO3817. [Google Scholar] [CrossRef]
  33. Cheng, Z.; Lin, L.; Yang, G.; Sha, T. Rapid intensification and associated large-scale circulation of super typhoon Rammasun in 2014. J. Appl. Meteorol. Sci. 2017, 28, 318–326, (In Chinese, with English Abstract). [Google Scholar]
  34. Balaguru, K.; Foltz, G.R.; Leung, J.R.; Kaplan, J.; Xu, W.; Reul, N.; Chapron, B. Pronounced impact of salinity on rapidly intensifying tropical cyclones. Bull. Am. Meteorol. Soc. 2020, 101, E1497–E1511. [Google Scholar] [CrossRef]
  35. Balaguru, K.; Chang, P.; Saravanan, R.; Leung, L.R.; Xu, Z.; Li, M.; Hsieh, J.-S. Ocean barrier layers’ effect on tropical cyclone intensification. Proc. Natl. Acad. Sci. USA 2012, 109, 14343–14347. [Google Scholar] [CrossRef]
  36. Grodsky, S.A.; Reul, N.; Lagerloef, G.; Reverdin, G.; Carton, J.A.; Chapron, B.; Quilfen, Y.; Kudryavtsev, V.N.; Kao, H.Y. Haline hurricane wake in the Amazon/Orinoco plume: AQUARIUS/SACD and SMOS observations. Geophys. Res. Lett. 2012, 39, L20603. [Google Scholar] [CrossRef]
  37. Harper, B.A.; Kepert, J.D.; Ginger, J.D. Guidelines for Converting between Various Wind Averaging Periods in Tropical Cyclone Conditions; WMO/TD-1555; WMO: Geneva, Switzerland, 2010; 54p. [Google Scholar]
  38. Fu, H.L.; Dan, B.; Gao, Z.G.; Wu, X.R.; Chao, G.F.; Zhang, L.X.; Zhang, Y.Q.; Liu, K.X.; Zhang, X.S.; Li, W. Global ocean reanalysis CORA2 and its inter comparison with a set of other reanalysis products. Front. Mar. Sci. 2023, 10, 1084186. [Google Scholar] [CrossRef]
  39. Garcia, H.E.; Boyer, T.P.; Locarnini, R.A.; Baranova, O.K.; Zweng, M.M. World Ocean Database 2018: User’s Manual (Prerelease); Mishonov, A.V., Ed.; NOAA: Silver Spring, MD, USA, 2018. Available online: https://www.nodc.noaa.gov/OC5/WOD/pr_wod.html (accessed on 28 May 2024).
  40. Pujol, M.; Faugėre, Y.; Taburet, G.; Dupuy, S.; Pelloquin, C.; Ablain, M.; Picot, N. DUACS DT2014: The new muti-mission altimeter data set reprocessed over 20 years. Ocean Sci. 2016, 12, 1067–1090. [Google Scholar] [CrossRef]
  41. Reynolds, R.; Smith, T.; Liu, C.; Chelton, D.; Casey, K.; Schlax, M. Daily high-resolution-blended analysis for sea surface temperature. J. Clim. 2007, 20, 5473–5496. [Google Scholar] [CrossRef]
  42. Marshall, J.; Adcroft, A.; Hill, C.; Perelman, L.; Heisey, C. A finite volume, incompressible Navier-Stokes model for studies of the ocean on parallel computers. J. Geophys. Res. 1997, 102, 5753–5766. [Google Scholar] [CrossRef]
  43. Adcroft, A.; Campin, J.; Hill, C.; Marshall, J. Implementation of an atmosphere-ocean general circulation model on the expanded spherical cube. Mon. Weather Rev. 2004, 132, 2845–2863. [Google Scholar] [CrossRef]
  44. Kobayashi, S.; Ota, Y.; Harada, Y.; Ebita, A.; Moriya, M.; Onoda, H.; Onogi, K.; Kamahori, H.; Kobayashi, C.; Endo, H.; et al. The JRA-55 reanalysis: General specifications and basic characteristics. J. Meteorol. Soc. Jpn. Ser. II 2015, 93, 5–48. [Google Scholar] [CrossRef]
  45. Harada, Y.; Kamahori, H.; Kobayashi, C.; Endo, H.; Kobayashi, S.; Ota, Y.; Onoda, H.; Onogi, K.; Miyaoka, K.; Takahashi, K. The JRA-55 Reanalysis: Representation of atmospheric circulation and climate variability. J. Meteorol. Soc. Jpn. Ser. II 2016, 94, 269–302. [Google Scholar] [CrossRef]
  46. Large, W.G.; Pond, S. Open ocean momentum flux measurements in moderate to strong winds. J. Phys. Oceanogr. 1981, 11, 324–336. [Google Scholar] [CrossRef]
  47. Fekete, B.M.; Vörösmarty, C.J.; Grabs, W. High-resolution fields of global runoff combining observed river discharge and simulated water balances. Glob. Biogeochem. Cycl. 2002, 16, 15-1–15-10. [Google Scholar] [CrossRef]
  48. Arbic, B.K.; Alford, M.H.; Ansong, J.K.; Buijsman, M.C.; Ciotti, R.B.; Farrar, J.T.; Hallberg, R.W.; Henze, C.E.; Hill, C.N.; Luecke, C.A.; et al. A primer on global internal tide and internal gravity wave continuum modelling in HYCOM and MITgcm. N. Front. Op. Oceanogr. 2018, 307–391. Available online: https://aquila.usm.edu/fac_pubs//15680 (accessed on 28 May 2024).
  49. Choy, C.W.; Lau, D.S.; He, Y.H. Super typhoons Hato and Mangkhut, part I: Analysis of maximum intensity and wind structure. Wea 2020, 77, 314–320. [Google Scholar] [CrossRef]
  50. Chan, C.C. Tropical Cyclone Classification. Available online: https://www.hko.gov.hk/en/education/tropical-cyclone/classification-naming-characteristics/00145-tropical-cyclone-classification.html (accessed on 28 May 2024).
  51. He, J.; Li, Q.; Chan, P.W.; Choy, C.W.; Mak, B.; Lam, C.C.; Luo, H.Y. An observational study of Typhoon Talim over the northern part of the South China Sea in July 2023. Atmosphere 2023, 14, 1340. [Google Scholar] [CrossRef]
  52. Chan, P.W.; Choy, C.W.; Chiu, Y.Y.; He, J. Observational study of Super Typhoon Saola in 2023 when it was close to Hong Kong. Weather 2024. [Google Scholar] [CrossRef]
  53. He, J.Y.; Chan, P.W.; Chan, Y.W.; Cheung, P. Super Typhoon Saola (2023) over the northern part of the South China Sea—Aircraft data analysis. Atmosphere 2023, 14, 1595. [Google Scholar] [CrossRef]
  54. Lau, D.S.; Chan, W.S.; Wong, Y.C.; Lam, C.C.; Chan, P.W. Hindcast insights from storm surge forecasting of Super Typhoon Saola (2309) in Hong Kong with the Sea, Lake and Overland Surges from Hurricanes Model. Atmosphere 2024, 15, 17. [Google Scholar] [CrossRef]
  55. Chan, P.W.; He, Y.H.; Lui, Y.S. Forecasting Super Typhoon Saola and its effects on Hong Kong. Weather 2024. [Google Scholar] [CrossRef]
  56. He, Y.H.; Chan, P.W. Challenges in the Forecasting of Severe Typhoon Koinu in 2023. Atmosphere 2024, 15, 31. [Google Scholar] [CrossRef]
  57. Qiu, W.; Wu, L.; Ren, F. Monsoonal influences on offshore rapid intensification of landfalling typhoons in a sheared environment over the South China Sea. Weather Forecast. 2020, 35, 623–634. [Google Scholar] [CrossRef]
  58. Emanuel, K.A. An air-sea interaction theory for tropical cyclones. Part 1: Steady-state maintenance. J. Atmos. Sci. 1986, 43, 585–605. [Google Scholar]
  59. Emanuel, K.A. The maximum intensity of hurricanes. J. Atmos. Sci. 1988, 45, 1143–1155. [Google Scholar]
  60. Ranasinghe, R.; Wu, C.S.; Conallin, J.; Duong, T.M.; Anthony, E.J. Disentangling the relative impacts of climate change and human activities on fluvial sediment supply to the coast by the world’s large rivers: Pearl River Basin, China. Sci. Rep. 2019, 9, 9236. [Google Scholar] [CrossRef]
Figure 1. A flowchart showing the data and methodology used in this study.
Atmosphere 15 00674 g001
Figure 2. Five TCs that traversed the WNP and the SCS, viz. Super Typhoon Hato (20–24 August 2017), Super Typhoon Mangkhut (7–17 September 2018), Typhoon Talim (14–18 July 2023), Super Typhoon Saola (24 August–3 September 2023), and Severe Typhoon Koinu (29 September–9 October 2023), in the area of study. Blue lines in the inset show the three main tributaries of the Pearl River.
Atmosphere 15 00674 g002
Figure 3. Data and methodology used in CORA2.
Atmosphere 15 00674 g003
Figure 4. (a) The HKO-analysed track and intensity of TC Hato overlaid on the SST distribution on 20 August 2017 before its passage over the WNP; (b) a snapshot of the vertical profile taken on the same day showing sea temperatures over a sea depth of about 150 m along the TC track with location points as shown in (a). A change in the TC category [50] with the central maximum wind in brackets is also marked on the time line. TC symbol in different colours show different TC categories (TD in black; TS in green, STS in blue, T in red, ST in pink, SuperT in purple) at the time.
Atmosphere 15 00674 g004
Figure 5. The same as Figure 4, but replacing SST with SSS.
Atmosphere 15 00674 g005
Figure 6. (a) Vertical profile of sea temperatures over a depth of about 150 m below the sea surface shown at locations traversed by TC Mangkhut over the WNP and the SCS (a) before its passage on 7 September 2018, and (b) after its passage on 17 September 2018. The meanings of the annotations are the same as those described for Figure 4b. (c) HKO-analysed track and intensity of TC Mangkhut overlaid on SST data for 17 September 2018 after its passage. The dotted blue box marks the region over the WNP where the cooling of the SST was significant.
Atmosphere 15 00674 g006aAtmosphere 15 00674 g006b
Figure 7. The same as Figure 6 (a) and (b), respectively, but replacing SST with SSS. The meanings of the annotations are the same as those described for Figure 4b.
Atmosphere 15 00674 g007
Figure 8. The same as Figure 4a, but with TC Talim overlaid on the SST distribution (a) on 14 July 2023 before its passage over the SCS; (b) on 16 July 2023 in the middle of its life history; and (c) on 18 July 2023 after its passage.
Atmosphere 15 00674 g008aAtmosphere 15 00674 g008b
Figure 9. Vertical profile of (a) sea temperatures and (b) salinity over a depth of about 150 m below the sea surface on 14 July 2023 before the passage of TC Talim over the SCS at the locations it traversed. The meanings of the annotations are the same as those described for Figure 4b.
Atmosphere 15 00674 g009aAtmosphere 15 00674 g009b
Figure 10. (a) The same as Figure 4a, but with TC Saola overlaid on the SST distribution (a) on 24 August 2023 before its passage over the WNP; and vertical profiles of (b) the sea temperatures and (c) the salinity over a depth of about 150 m below the sea surface on 24 August 2023 before its passage over the WNP and the SCS at the locations it traversed, as shown in (a). The meanings of the annotations are the same as those described for Figure 4b.
Atmosphere 15 00674 g010aAtmosphere 15 00674 g010b
Figure 11. (a) The same as Figure 4a, except with TC Koinu overlaid on the SST distribution (a) on 30 September 2023 before its passage over the WNP; and vertical profiles of (b) the sea temperatures and (c) the salinity over a depth of about 150 m below the sea surface on 30 September 2023 before its passage over the WNP and the SCS at the locations it traversed, as shown in (a). The meanings of the annotations are the same as those described for Figure 4b.
Atmosphere 15 00674 g011aAtmosphere 15 00674 g011b
Disclaimer/Publisher’s Note: The statements, opinions and data contained in all publications are solely those of the individual author(s) and contributor(s) and not of MDPI and/or the editor(s). MDPI and/or the editor(s) disclaim responsibility for any injury to people or property resulting from any ideas, methods, instructions or products referred to in the content.

