[go: up one dir, main page]

Next Issue
Volume 15, February-1
Previous Issue
Volume 15, January-1
 
 
nutrients-logo

Journal Browser

Journal Browser

Nutrients, Volume 15, Issue 2 (January-2 2023) – 225 articles

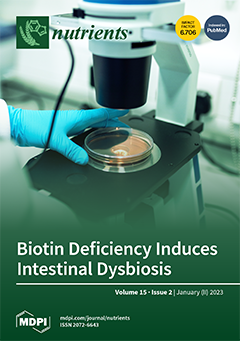
Cover Story (view full-size image): Biotin is an essential vitamin and critical cofactor in several metabolic pathways, and its deficiency has been linked to several disorders including inflammatory bowel disease (IBD). We previously reported that biotin deficiency (BD) in mice, whether modeled through intestine-specific deletion of biotin transporter (SMVT-icKO) or through a biotin-deficient diet, resulted in intestinal inflammation consistent with an IBD-like phenotype. To assess whether the gut microbiome is associated with these BD-induced changes, we collected stool and intestinal samples from both of these mouse models and utilized them for 16S rRNA gene sequencing. We find that both diet-mediated and deletion-mediated BD result in the expansion of opportunistic microbes including Klebsiella, Enterobacter, and Helicobacter, at the expense of mucus-resident microbes including Akkermansia. View this paper
  • Issues are regarded as officially published after their release is announced to the table of contents alert mailing list.
  • You may sign up for e-mail alerts to receive table of contents of newly released issues.
  • PDF is the official format for papers published in both, html and pdf forms. To view the papers in pdf format, click on the "PDF Full-text" link, and use the free Adobe Reader to open them.
Order results
Result details
Section
Select all
Export citation of selected articles as:
23 pages, 4982 KiB  
Review
Bioactivity and Digestibility of Microalgae Tetraselmis sp. and Nannochloropsis sp. as Basis of Their Potential as Novel Functional Foods
by Samuel Paterson, Pilar Gómez-Cortés, Miguel Angel de la Fuente and Blanca Hernández-Ledesma
Nutrients 2023, 15(2), 477; https://doi.org/10.3390/nu15020477 - 16 Jan 2023
Cited by 28 | Viewed by 6258
Abstract
It is estimated that by 2050, the world’s population will exceed 10 billion people, which will lead to a deterioration in global food security. To avoid aggravating this problem, FAO and WHO have recommended dietary changes to reduce the intake of animal calories [...] Read more.
It is estimated that by 2050, the world’s population will exceed 10 billion people, which will lead to a deterioration in global food security. To avoid aggravating this problem, FAO and WHO have recommended dietary changes to reduce the intake of animal calories and increase the consumption of sustainable, nutrient-rich, and calorie-efficient products. Moreover, due to the worldwide rising incidence of non-communicable diseases and the demonstrated impact of diet on the risk of these disorders, the current established food pattern is focused on the consumption of foods that have functionality for health. Among promising sources of functional foods, microalgae are gaining worldwide attention because of their richness in high-value compounds with potential health benefits. However, despite the great opportunities to exploit microalgae in functional food industry, their use remains limited by challenges related to species diversity and variations in cultivation factors, changes in functional composition during extraction procedures, and limited evidence on the safety and bioavailability of microalgae bioactives. The aim of this review is to provide an updated and comprehensive discussion on the nutritional value, biological effects, and digestibility of two microalgae genera, Tetraselmis and Nannochloropsis, as basis of their potential as ingredients for the development of functional foods. Full article
Show Figures

Figure 1

Figure 1
<p>Overview of the nutritional value and bioactivities demonstrated for microalgae <span class="html-italic">Tetraselmis</span> sp. and <span class="html-italic">Nannochloropsis</span> sp. species.</p>
Full article ">
14 pages, 466 KiB  
Article
Optimizing the Relationship between Regulation and Innovation in Dietary Supplements: A Case Study of Food with Function Claims in Japan
by Keigo Sato, Kota Kodama and Shintaro Sengoku
Nutrients 2023, 15(2), 476; https://doi.org/10.3390/nu15020476 - 16 Jan 2023
Cited by 7 | Viewed by 5599
Abstract
Regulation has long been a counterpart of innovation in the health care industry, and recent cases have demonstrated that appropriately designed regulations can both coexist with and promote innovation. This study is the first study to explore how the regulatory environment affected the [...] Read more.
Regulation has long been a counterpart of innovation in the health care industry, and recent cases have demonstrated that appropriately designed regulations can both coexist with and promote innovation. This study is the first study to explore how the regulatory environment affected the innovation process during the transition of the regulations for functional foods in Japan by examining quantitatively the impact of the foods with function claims (FFC) system on industry, companies, and products. Based on a dataset of Japanese dietary supplement manufacturing companies (n = 169) and their products (n = 731) in 2019, we found that companies that have newly entered the FFC system are smaller in scale than existing companies (p < 0.01, Wilcoxon rank sum test). We also found that companies with FFC products have larger revenue growth (p = 0.01). A multiple regression analysis revealed that FFC product sales increased with in-house clinical testing (coefficient: 26.8, p < 0.0001), diverse active ingredients (coefficient: 7.6, p < 0.001), and the claim of new functions (coefficient: 10.2, p < 0.05). These results suggested that the FFC system facilitated the market entry of small and mid-size enterprises and promoted the creation of high-value products through innovative company efforts. Full article
Show Figures

Figure 1

Figure 1
<p>Food with health claims (FHC) system in Japan.</p>
Full article ">
19 pages, 2202 KiB  
Article
Fructose Diet-Associated Molecular Alterations in Hypothalamus of Adolescent Rats: A Proteomic Approach
by Chiara D’Ambrosio, Luisa Cigliano, Arianna Mazzoli, Monica Matuozzo, Martina Nazzaro, Andrea Scaloni, Susanna Iossa and Maria Stefania Spagnuolo
Nutrients 2023, 15(2), 475; https://doi.org/10.3390/nu15020475 - 16 Jan 2023
Cited by 3 | Viewed by 2481
Abstract
Background: The enhanced consumption of fructose as added sugar represents a major health concern. Due to the complexity and multiplicity of hypothalamic functions, we aim to point out early molecular alterations triggered by a sugar-rich diet throughout adolescence, and to verify their persistence [...] Read more.
Background: The enhanced consumption of fructose as added sugar represents a major health concern. Due to the complexity and multiplicity of hypothalamic functions, we aim to point out early molecular alterations triggered by a sugar-rich diet throughout adolescence, and to verify their persistence until the young adulthood phase. Methods: Thirty days old rats received a high-fructose or control diet for 3 weeks. At the end of the experimental period, treated animals were switched to the control diet for further 3 weeks, and then analyzed in comparison with those that were fed the control diet for the entire experimental period. Results: Quantitative proteomics identified 19 differentially represented proteins, between control and fructose-fed groups, belonging to intermediate filament cytoskeleton, neurofilament, pore complex and mitochondrial respiratory chain complexes. Western blotting analysis confirmed proteomic data, evidencing a decreased abundance of mitochondrial respiratory complexes and voltage-dependent anion channel 1, the coregulator of mitochondrial biogenesis PGC-1α, and the protein subunit of neurofilaments α-internexin in fructose-fed rats. Diet-associated hypothalamic inflammation was also detected. Finally, the amount of brain-derived neurotrophic factor and its high-affinity receptor TrkB, as well as of synaptophysin, synaptotagmin, and post-synaptic protein PSD-95 was reduced in sugar-fed rats. Notably, deregulated levels of all proteins were fully rescued after switching to the control diet. Conclusions: A short-term fructose-rich diet in adolescent rats induces hypothalamic inflammation and highly affects mitochondrial and cytoskeletal compartments, as well as the level of specific markers of brain function; above-reported effects are reverted after switching animals to the control diet. Full article
(This article belongs to the Special Issue The Impact of Nutrition on Brain Metabolism and Disease)
Show Figures

Figure 1

Figure 1
<p>Experimental design.</p>
Full article ">Figure 2
<p>Proteomic analysis of rat hypothalamus. (<b>A</b>) Proteins showing quantitative changes in the comparison of fructose-fed adolescent (F, orange) versus control adolescent (C, light blue) rats, and young-adult fructose-rescued (FR, green) versus young-adult control rescued (CR, red) rats. Differentially represented proteins are indicated using corresponding gene names. (<b>B</b>) STRING analysis of differentially represented proteins present in F versus C fed rats. Functional protein associations were based on data recorded for <span class="html-italic">R. norvegicus</span>. Only medium-confidence interactions (0.4) are shown. Sorcs2, sortilin-related VPS10 domain containing receptor 2; Ndufs1, NADH-ubiquinone oxidoreductase 75 kDa subunit, mitochondrial; Atp5mpl (Atp5mj), mitochondrial membrane ATP synthase F (1) F (0); Camk2b, calcium/calmodulin-dependent protein kinase type II, subunit beta; S100b, protein S100-B; Ndufb10, NADH:ubiquinone oxidoreductase subunit B10; Vdac2, voltage-dependent anion-selective channel protein 2; Vdac1, voltage-dependent anion-selective channel protein 1; Ndufb9, NADH dehydrogenase (ubiquinone) 1 beta subcomplex 9; Slc6a7, solute carrier family 6 (neurotransmitter transporter, l-proline) member 7; Avp, vasopressin-neurophysin 2-copeptin; Nefl, neurofilament, light polypeptide; Erlin2, ER lipid raft associated 2; Cox6b1, cytochrome c oxidase, subunit VIb polypeptide 1; Vdac3, voltage-dependent anion-selective channel protein 3; LOC685069, H2A histone family, member V; Ina, internexin neuronal intermediate filament protein, alpha; Nefm, neurofilament, medium polypeptide; Pcbd2, 4a-hydroxytetrahydrobiopterin dehydratase. (<b>C</b>) Functional enrichment analysis of differentially represented proteins in F versus C fed rats. GO terms for biological process (upper panel), molecular function (middle panel) and cellular component (lower panel) are reported.</p>
Full article ">Figure 3
<p>Mitochondrial respiratory complexes amount in rat hypothalamus. The amount of mitochondrial complex I, II, III, IV, and V was measured in protein extracts from the hypothalamus of control adolescent (C), fructose-fed adolescent (F), young-adult control rescued (CR), young-adult fructose-rescued (FR) rats. Samples were analyzed by 12.5% SDS-PAGE and western blotting. After the detection of immunocomplexes (by mouse anti-OXPHOS and GAM-HRP IgGs) the membrane was stripped and treated with anti-β-actin IgG as the loading control. (<b>A</b>) Representative western blotting of respiratory complexes. Panels B-E show results from densitometric analysis. (<b>B</b>) Complex I amount relative β-actin; (<b>C</b>) Complex II amount relative to β-actin; (<b>D</b>) Complex III amount relative to β-actin; (<b>E</b>) Complex IV amount relative to β-actin; (<b>F</b>) Complex IV amount relative to β-actin; (<b>F</b>): Complex V amount relative to β-actin. Data shown are reported as means ± SEM of eight animals from each group * <span class="html-italic">p</span> &lt; 0.05, ** <span class="html-italic">p</span> &lt; 0.01, *** <span class="html-italic">p</span> &lt; 0.001 versus C (one-way Anova followed by Bonferroni post-test).</p>
Full article ">Figure 4
<p>PGC-1α, PINK-1 and VDAC-1 levels in rat hypothalamus. PGC-1α (<b>A</b>), PINK-1 (<b>B</b>), and VDAC-1 (<b>C</b>) were quantified in protein extracts from the hypothalamus of control adolescent (C), fructose-fed adolescent (F), young-adult control rescued (CR), young-adult fructose-rescued (FR) rats. Samples were analyzed by 10% (PGC-1α) or 12.5% (PINK-1, VDAC-1) SDS-PAGE and western blotting. After detection of immunocomplexes [by rabbit anti-PGC-1α and GAR-HRP IgGs (<b>A</b>), or mouse anti-PINK-1 and GAM-HRP IgGs (<b>B</b>), or mouse anti-VDAC-1 and GAM-HRP IgGs (<b>C</b>)], the membranes were stripped and treated with anti-β-actin as loading control. Data shown are means ± SEM of eight animals from each group * <span class="html-italic">p</span> &lt; 0.05, ** <span class="html-italic">p</span> &lt; 0.01, *** <span class="html-italic">p</span> &lt; 0.001 versus C (one-way Anova followed by Bonferroni post-test).</p>
Full article ">Figure 5
<p>Evaluation of inflammatory and oxidative status in rat hypothalamus. (<b>A</b>) p-NFkB/NFkB ratio (representative western blotting and densitometric analysis). Samples were analyzed by 10% SDS-PAGE and western blotting. After rivelation of the immunocomplexes (by mouse anti-phosphoNFkB and GAM-HRP IgGs), the membrane was stripped and treated with mouse anti-NFkB and GAM-HRP IgGs. The amount of phosphorylated NFkB was expressed relative to the total NFkB level. Data shown are means ± SEM of eight animals from each group. (<b>B</b>) TNF-alpha and (<b>C</b>) IL-6 amount was titrated by sandwich ELISA on samples diluted 1:25 and following the manufacturer’s instructions. Data are expressed as pg per mg of total proteins and reported as means ± SEM of eight different rats from each experimental group. (<b>D</b>) GFAP amount (representative western blotting and densitometric analysis). Samples were analyzed by 12.5% SDS-PAGE and western blotting. After the rivelation of immunocomplexes (by rabbit anti-GFAP and GAR-HRP IgGs), the membrane was stripped and re-incubated with anti-β-actin. Data shown are means ± SEM of eight animals from each group. (<b>E</b>) Hpt level was titrated by ELISA in samples diluted 1: 2000, 1:8000 and 1:25,000. Immunodetection was carried out with rabbit anti-Hpt and GAR-HRP IgGs. Data are means ± SEM of eight animals from each group. (<b>F</b>) Adiponectin amount (representative western blotting and densitometric analysis). Samples were analyzed by 12.5% SDS-PAGE and western blotting. After rivelation of the immunocomplexes (by rabbit anti-adiponectin and GAR-HRP IgGs), the membrane was stripped and re-incubated with anti-β-actin. Data shown are means ± SEM of eight animals from each group. (<b>G</b>) N-Tyr amount was titrated by ELISA on samples diluted 1:1500, 1:3000 and 1:6000. Immunodetection was carried out with rabbit anti-N-Tyr and GAR-HRP IgGs. Data are expressed as OD per mg of total proteins and reported as means ± SEM of eight different rats from each experimental group. Control (C), fructose-fed (F), control rescued (CR), and fructose-rescued (FR) rats. * <span class="html-italic">p</span> &lt; 0.05, ** <span class="html-italic">p</span> &lt; 0.01, *** <span class="html-italic">p</span> &lt; 0.001; **** <span class="html-italic">p</span> &lt; 0.0001 versus C (one-way Anova followed by Bonferroni post-test).</p>
Full article ">Figure 6
<p>Evaluation of α-internexin, BDNF, TrkB, and synaptic proteins in rat hypothalamus. (<b>A</b>) α-internexin, (<b>B</b>) BDNF, (<b>C</b>) full-length TrkB isoform, (<b>D</b>) synaptophysin, (<b>E</b>) synaptotagmin, and (<b>F</b>) PSD-95 were measured in protein extracts from the hypothalamus of control adolescent (C), fructose-fed adolescent (F), young-adult control rescued (CR), young-adult fructose-rescued (FR) rats. Samples were analyzed by 10% (α-internexin, TrkB, synaptotagmin, PSD-95) or 12.5% (BDNF, synaptophysin) SDS-PAGE and western blotting. Immunocomplexes were detected by rabbit mouse anti-α-internexin and GAM-HRP IgGs (<b>A</b>), or rabbit anti-BDNF (<b>B</b>), rabbit anti-TrkB (<b>C</b>), rabbit anti-synaptophysin (<b>D</b>), rabbit anti-synaptotagmin (<b>E</b>), rabbit anti-PSD-95 (<b>F</b>) and GAR-HRP IgGs. After detection, the membranes were stripped and treated with anti- β-actin. Means ± SEM of eight animals from each experimental group are shown. * <span class="html-italic">p</span> &lt; 0.05, ** <span class="html-italic">p</span> &lt; 0.01 versus C (one-way Anova followed by Bonferroni post-test).</p>
Full article ">
22 pages, 4152 KiB  
Article
Resveratrol Food Supplement Products and the Challenges of Accurate Label Information to Ensure Food Safety for Consumers
by Maja Bensa, Irena Vovk and Vesna Glavnik
Nutrients 2023, 15(2), 474; https://doi.org/10.3390/nu15020474 - 16 Jan 2023
Cited by 10 | Viewed by 3742
Abstract
The food supplement market is growing as many consumers wish to complement their nutrient intake. Despite all the regulations in place to ensure food supplements safety, there are still many cases of irregularities reported especially connected to internet sales. Twenty resveratrol food supplement [...] Read more.
The food supplement market is growing as many consumers wish to complement their nutrient intake. Despite all the regulations in place to ensure food supplements safety, there are still many cases of irregularities reported especially connected to internet sales. Twenty resveratrol food supplement products sold on the Slovenian market were evaluated on their compliance of declared vs. determined resveratrol content, as well as the compliance of labels with the European Union (EU) and Slovenian regulatory requirements. Both the ingredient contents and food information are important parts of food safety. Analyses of 20 food supplements performed using high-performance thin-layer chromatography (HPTLC) coupled with densitometry showed that 95% of products had contents different from what was declared and 55% of products contained higher contents than declared. In 25% of the products the determined content per unit exceeded the maximum level (150 mg/day) specified in EU novel food conditions for food supplement with trans-resveratrol. Evaluation of the 20 food supplement labels included mandatory and voluntary food information, food supplement information, novel food information, health claims and nutrition claims. Most labels contained the necessary information, but multiple errors were observed ranging from typos to misleading practices. From a food safety perspective there is still a lot of improvement needed in the field of food supplements. Full article
Show Figures

Figure 1

Figure 1
<p>Number of food supplement products and producers.</p>
Full article ">Figure 2
<p>Forms of food supplement products.</p>
Full article ">Figure 3
<p>Comparison of declared contents vs. the average (<span class="html-italic">n</span> = 3) determined resveratrol contents in food supplements with contents of resveratrol higher than 70 mg/unit.</p>
Full article ">Figure 4
<p>Comparison of declared contents vs. the average (<span class="html-italic">n</span> = 3) determined resveratrol contents in food supplements with contents of resveratrol lower than 50 mg/unit.</p>
Full article ">Figure 5
<p>Percent of declared resveratrol content in food supplements.</p>
Full article ">Figure 6
<p>Deviation of determined content from declared content of resveratrol in food supplements.</p>
Full article ">Figure 7
<p>Resveratrol origin declared on food supplements.</p>
Full article ">Figure 8
<p>Compliance of mandatory food information on food supplement labels.</p>
Full article ">Figure 9
<p>Voluntary food information on food supplement labels.</p>
Full article ">Figure 10
<p>Food supplements with health and nutrition claims.</p>
Full article ">Figure 11
<p>Food supplement information and novel food information on food supplement labels.</p>
Full article ">Figure 12
<p>Resveratrol vs. <span class="html-italic">trans</span>-resveratrol declarations on food supplement labels.</p>
Full article ">
14 pages, 300 KiB  
Article
Prevalence of Sarcopenic Obesity and Factors Influencing Body Composition in Persons with Spinal Cord Injury in Japan
by Ryu Ishimoto, Hirotaka Mutsuzaki, Yukiyo Shimizu, Hiroshi Kishimoto, Ryoko Takeuchi and Yasushi Hada
Nutrients 2023, 15(2), 473; https://doi.org/10.3390/nu15020473 - 16 Jan 2023
Cited by 5 | Viewed by 3027
Abstract
This study aims to investigate the prevalence of sarcopenic obesity and factors influencing body composition in persons with spinal cord injury (SCI) in Japan. Adults with SCI aged ≥ 20 years who underwent whole-body dual-energy X-ray absorptiometry between 2016 and 2022 were retrospectively [...] Read more.
This study aims to investigate the prevalence of sarcopenic obesity and factors influencing body composition in persons with spinal cord injury (SCI) in Japan. Adults with SCI aged ≥ 20 years who underwent whole-body dual-energy X-ray absorptiometry between 2016 and 2022 were retrospectively analyzed. Data from 97 patients were examined. The primary outcome was appendicular skeletal muscle mass (ASM). Multiple linear regression analysis was conducted to assess factors influencing the lean and adipose indices in persons with SCI. Sarcopenia, obesity, and sarcopenic obesity were prevalent in 76%, 85%, and 64% of patients, respectively. Multivariate linear regression analysis revealed that sex (β = 0.34, p < 0.001), lesion level (β = 0.25, p = 0.007), severity (β = 0.20, p = 0.043), and ability to walk (β = 0.29, p = 0.006) were independently associated with ASM. Sex (β = −0.63, p < 0.001) was independently associated with percent body fat. In conclusion, sarcopenia, obesity, and sarcopenic obesity were prevalent among patients with SCI in Japan. Female sex, tetraplegia, motor-complete injury, and inability to walk were risk factors for sarcopenia, whereas female sex was a risk factor for obesity in persons with SCI. A routine monitoring of body composition is necessary, especially among those with multiple risk factors, to identify individuals in need of preventive and therapeutic interventions. Full article
(This article belongs to the Section Clinical Nutrition)
19 pages, 324 KiB  
Article
Ethnic Differences in Preferences for Lifestyle Intervention among Women after Childbirth: A Multi-Methods Study in Australia
by Mingling Chen, Maureen Makama, Helen Skouteris, Lisa J. Moran, Cheryce L. Harrison, Tammie Choi and Siew Lim
Nutrients 2023, 15(2), 472; https://doi.org/10.3390/nu15020472 - 16 Jan 2023
Cited by 1 | Viewed by 2641
Abstract
Postpartum weight retention contributes to maternal obesity and varies by ethnicity. Despite the well-established benefits of lifestyle intervention on weight management, little is known about how to engage postpartum women effectively, especially among ethnic minority groups. This multi-methods study aimed to explore ethnic [...] Read more.
Postpartum weight retention contributes to maternal obesity and varies by ethnicity. Despite the well-established benefits of lifestyle intervention on weight management, little is known about how to engage postpartum women effectively, especially among ethnic minority groups. This multi-methods study aimed to explore ethnic differences in women’s preferences for lifestyle intervention after childbirth. Women within five years of childbirth and living with their youngest child in Australia were recruited in an online survey (n = 504) and semi-structured interviews (n = 17). The survey and interview questions were structured based on the Template for Intervention Description and Replication (TIDieR) framework. Ethnic groups were categorized as Oceanian, Asian and Other according to the Australian Bureau of Statistics. Chi-square tests were used to compare the preferred intervention characteristics between groups. Qualitative data were thematically analysed. The survey showed that most women across all ethnic groups were interested in receiving lifestyle support in the early postpartum period (from 7 weeks to 3 months postpartum). All ethnic groups preferred a regular lifestyle intervention delivered by health professionals that promotes accountability and provides practical strategies. However, Asian women had a higher desire for infant care and a lower desire for mental health in the intervention content compared with Oceanian women. Moreover, Asian women were more likely to favour interventions that are initiated in a later postpartum period, over a shorter duration, and with less intervention frequency, compared with Oceanian women. The interviews further indicated the need for intervention adaptations in the Asian group to address the cultural relevance of food and postpartum practices. These ethnic-specific preferences should be considered in the development of culturally appropriate intervention strategies to optimize engagement in healthy lifestyles among the targeted ethnic groups. Full article
(This article belongs to the Special Issue Dietary Interventions and Women’s Health)
13 pages, 1168 KiB  
Article
Gut Microbiome Composition and Metabolic Capacity Differ by FUT2 Secretor Status in Exclusively Breastfed Infants
by Alexander W. Thorman, Grace Adkins, Shannon C. Conrey, Allison R. Burrell, Ying Yu, Brendon White, Rachel Burke, David Haslam, Daniel C. Payne, Mary A. Staat, Ardythe L. Morrow and David S. Newburg
Nutrients 2023, 15(2), 471; https://doi.org/10.3390/nu15020471 - 16 Jan 2023
Cited by 12 | Viewed by 3583
Abstract
A major polymorphism in the fucosyltransferase2 (FUT2) gene influences risk of multiple gut diseases, but its impact on the microbiome of breastfed infants was unknown. In individuals with an active FUT2 enzyme (“secretors”), the intestinal mucosa is abundantly fucosylated, providing mutualist [...] Read more.
A major polymorphism in the fucosyltransferase2 (FUT2) gene influences risk of multiple gut diseases, but its impact on the microbiome of breastfed infants was unknown. In individuals with an active FUT2 enzyme (“secretors”), the intestinal mucosa is abundantly fucosylated, providing mutualist bacteria with a rich endogenous source of fucose. Non-secretors comprise approximately one-fifth of the population, and they lack the ability to create this enzyme. Similarly, maternal secretor status influences the abundance of a breastfeeding mother’s fucosylated milk oligosaccharides. We compared the impact of maternal secretor status, measured by FUT2 genotype, and infant secretor status, measured by FUT2 genotype and phenotype, on early infant fecal microbiome samples collected from 2-month-old exclusively breastfed infants (n = 59). Infant secretor status (19% non-secretor, 25% low-secretor, and 56% full-secretor) was more strongly associated with the infant microbiome than it was with the maternal FUT2 genotype. Alpha diversity was greater in the full-secretors than in the low- or non-secretor infants (p = 0.049). Three distinct microbial enterotypes corresponded to infant secretor phenotype (p = 0.022) and to the dominance of Bifidobacterium breve, B. longum, or neither (p < 0.001). Infant secretor status was also associated with microbial metabolic capacity, specifically, bioenergetics pathways. We concluded that in exclusively breastfed infants, infant—but not maternal—secretor status is associated with infant microbial colonization and metabolic capacity. Full article
Show Figures

Figure 1

Figure 1
<p>Potential contributions of fucose to the intestinal mucosa of breastfeeding infants by the <span class="html-italic">FUT2</span> gene product in the infant gut and by a secretor’s milk.</p>
Full article ">Figure 2
<p>Alpha diversity by secretor status. The presence of secretor (presence/absence of functional <span class="html-italic">FUT2</span> gene product) milk from a mother was not accompanied by significant changes in the overall alpha-diversity of an infant’s gut microbiota (<b>A</b>) (Kruskal–Wallis <span class="html-italic">p</span> = 0.81). The secretor genotype of the infants was not significantly associated with a change in the alpha-diversity of an infant’s gut (<b>B</b>) (Kruskal–Wallis <span class="html-italic">p</span> = 0.20). However, the secretor phenotype (measured as the presence of the H-antigen blood group antigens in the saliva) of the infants revealed no significant differences in the alpha diversity measured as the Shannon index between the low- and non-secretors (Kruskal–Wallis <span class="html-italic">p</span> = 0.86), but the Shannon index of the full-secretor group was significantly higher than that of the low- and non-secretors (<b>C</b>) (Kruskal–Wallis <span class="html-italic">p</span> = 0.049).</p>
Full article ">Figure 3
<p>Beta-diversity by infant secretor phenotype. The Bray–Curtis distance between the subjects resulted in significant clustering by infant secretor status by infant phenotype (Adonis <span class="html-italic">p</span> = 0.043). The three clusters generated by the k-means are depicted as triangles, circles, and squares, and the ellipses correspond to the k-means (k = 3) clusters of all points, irrespective of phenotype. A significant association of phenotype to these clusters occurred. Thus, at least three distinct enterotypes of microbial communities could be identified and are significantly associated with infant secretor phenotype.</p>
Full article ">Figure 4
<p>Heatmap of the highest variance in species across all subjects. A high abundance of <span class="html-italic">Bifidobacterium</span> occurred regardless of secretor status, but the species of <span class="html-italic">Bifidobacterium</span> varied. (<b>A</b>) By hierarchical clustering, significant clustering occurred in the infant secretor genotype (<span class="html-italic">p</span> = 0.030) and phenotype (<span class="html-italic">p</span> = 0.012) but not in the maternal secretor genotype (<span class="html-italic">p</span> = 0.80). (<b>B</b>) The cluster associated with non-secretors was enriched for <span class="html-italic">Bifidobacterium breve</span> by infant genotype and phenotype (<span class="html-italic">p</span> = 7.9 × 10<sup>−8</sup>). (<b>C</b>) <span class="html-italic">Bifidobacterium longum</span> was enriched in the cluster primarily associated with the low-secretors (<span class="html-italic">p</span> = 3.4 × 10<sup>−8</sup>). Additionally, there were some subjects that demonstrated a microbiota not dominated by these two species of <span class="html-italic">Bifidobacteria</span> that were primarily associated with the full-secretor population.</p>
Full article ">Figure 5
<p>Pathway enrichment of metabolic capacity showing the differences between the secretor phenotypes. The metagenomic sequences were aligned to genes and pathways using HUMAnN2 and compared across the secretor phenotypes using LEfSe. (<b>A</b>) The pathways enriched in the full-secretors and low-secretors demonstrated a bioenergetics signature, while the non-secretors had more genes dedicated to the utilization of sucrose and the production of seleno-amino acids. The adenosine and guanosine biosynthesis pathways showed significant increases in the full-secretor individuals ((<b>B</b>), <span class="html-italic">p</span> = 0.034), whereas the sucrose degradation ((<b>C</b>), <span class="html-italic">p</span> = 0.0075) and seleno-amino acid biosynthesis pathways ((<b>D</b>), <span class="html-italic">p</span> = 0.021) were enriched in the microbiota of the non-secretor individuals.</p>
Full article ">
12 pages, 311 KiB  
Article
Barriers to and Facilitators of the Consumption of Animal-Based Protein-Rich Foods in Older Adults: Re-Analysis with a Focus on Sustainability
by Katherine M. Appleton
Nutrients 2023, 15(2), 470; https://doi.org/10.3390/nu15020470 - 16 Jan 2023
Cited by 2 | Viewed by 2110
Abstract
Older adults may gain health benefits from the consumption of animal-based protein-rich foods, but environmental pressures suggest advocating some meat and dairy foods over others, and understanding the barriers and facilitators for consuming these different foods would be of value. Existing data on [...] Read more.
Older adults may gain health benefits from the consumption of animal-based protein-rich foods, but environmental pressures suggest advocating some meat and dairy foods over others, and understanding the barriers and facilitators for consuming these different foods would be of value. Existing data on the barriers to and facilitators of the consumption of meat and dairy products were re-analysed for differing effects for white, red, and processed meat consumption and for yoghurt, soft cheese, and hard cheese consumption. White meat consumption was associated with fewer concerns over spoilage and waste and stronger perceptions that meat is convenient (smallest Beta = 0.135, p = 0.01), while red and processed meat consumption were positively associated with liking /taste, appearance, and convenience (smallest Beta = 0.117, p = 0.03). Yoghurt and soft cheese consumption were positively associated with liking/taste and medical concerns, and fewer concerns over ability and habit (smallest Beta = −0.111, p = 0.05), while hard cheese consumption was only associated with liking/taste (Beta = 0.153, p = 0.01). Taken together, these data suggest that enhancing or promoting the enjoyment, taste, visual appeal, and ease-of-consumption of the more sustainable meat and dairy options may be of value in encouraging the consumption of these foods in older adults. Full article
16 pages, 978 KiB  
Article
Effects of Interaction between SLC35F3 and Carbohydrate Intake on the Incidence of Metabolic Syndrome in Korean Middle-Aged Adults
by Haeun Park and Dayeon Shin
Nutrients 2023, 15(2), 469; https://doi.org/10.3390/nu15020469 - 16 Jan 2023
Cited by 2 | Viewed by 2856
Abstract
Solute carrier family 35 member F3 (SLC35F3) mediates intracellular thiamine transport, which is crucial for carbohydrate metabolism as thiamine is required for key pathways such as glycolysis and the tricarboxylic acid cycle. This study aimed to investigate the impact of the [...] Read more.
Solute carrier family 35 member F3 (SLC35F3) mediates intracellular thiamine transport, which is crucial for carbohydrate metabolism as thiamine is required for key pathways such as glycolysis and the tricarboxylic acid cycle. This study aimed to investigate the impact of the interaction between SLC35F3 and dietary carbohydrate intake on the incidence of metabolic syndrome (MetS). The study included 3923 Korean adults over 40 years of age from the Korean Genome and Epidemiology Study. The association between dietary carbohydrate intake, SLC35F3 rs10910387 genotypes, and MetS incidence was studied using multivariable Cox proportional hazard models. Over an average of 8.5 years of follow-ups, we documented 1471 MetS cases. MetS incidence was 1.88 times greater in men with the TT genotype and the highest carbohydrate intake than in those with the CC genotype and lowest carbohydrate intake (Hazard Ratio (HR) 1.88, 95% confidence interval (CI) 1.03–3.41). MetS incidence were 2.22 and 2.53 times higher in women with the TT genotype and carbohydrate intake tertile 2 and 3, respectively, than those with the CC genotype and carbohydrate intake tertile 1 (HR 2.22, 95% CI 1.12–4.42; HR 2.53, 95% CI 1.38–4.61). In summary, we report a novel interaction between SLC35F3 rs10910387 genotypes and dietary carbohydrate intake on MetS in Koreans. Full article
(This article belongs to the Section Carbohydrates)
Show Figures

Figure 1

Figure 1
<p>Flow chart for the study design: participants and exclusion criteria.</p>
Full article ">Figure 2
<p>Manhattan plots for genome-wide association study (GWAS) of metabolic syndrome.</p>
Full article ">
18 pages, 3969 KiB  
Article
Siraitia grosvenorii Extract Attenuates Airway Inflammation in a Murine Model of Chronic Obstructive Pulmonary Disease Induced by Cigarette Smoke and Lipopolysaccharide
by Mi-Sun Kim, Dong-Seon Kim, Heung Joo Yuk, Seung-Hyung Kim, Won-Kyung Yang, Geum Duck Park, Kyung Seok Kim, Woo Jung Ham and Yoon-Young Sung
Nutrients 2023, 15(2), 468; https://doi.org/10.3390/nu15020468 - 16 Jan 2023
Cited by 5 | Viewed by 3099
Abstract
We studied the activities of Siraitia grosvenorii extracts (SGE) on airway inflammation in a mouse model of chronic obstructive pulmonary disease (COPD) stimulated by cigarette smoke extract (CSE) and lipopolysaccharide (LPS), as well as in LPS-treated human bronchial epithelial cell line (BEAS-2B). SGE [...] Read more.
We studied the activities of Siraitia grosvenorii extracts (SGE) on airway inflammation in a mouse model of chronic obstructive pulmonary disease (COPD) stimulated by cigarette smoke extract (CSE) and lipopolysaccharide (LPS), as well as in LPS-treated human bronchial epithelial cell line (BEAS-2B). SGE improved the viability of LPS-incubated BEAS-2B cells and inhibited the expression and production of inflammatory cytokines. SGE also attenuated the mitogen-activated protein kinase (MAPK)-nuclear factor-kappa B (NF-κB) signaling activated by LPS stimulation in BEAS-2B cells. In mice stimulated by CSE and LPS, we observed the infiltration of immune cells into the airway after COPD induction. SGE reduced the number of activated T cells, B cells, and neutrophils in bronchoalveolar fluid (BALF), lung tissue, mesenteric lymph node, and peripheral blood mononuclear cells, as well as inhibited infiltration into organs and mucus production. The secretion of cytokines in BALF and the expression level of pro-inflammatory cytokines, mucin 5AC, Transient receptor potential vanilloid 1, and Transient receptor potential ankyrin 1 in lung tissue were alleviated by SGE. In addition, to investigate the activity of SGE on expectoration, we evaluated phenol red secretions in the trachea of mice. SGE administration showed the effect of improving expectoration through an increase in phenol red secretion. Consequently, SGE attenuates the airway inflammatory response in CSE/LPS-stimulated COPD. These findings indicate that SGE may be a potential herbal candidate for the therapy of COPD. Full article
(This article belongs to the Section Nutritional Immunology)
Show Figures

Figure 1

Figure 1
<p>Effects of <span class="html-italic">S. grosvenorii</span> extract (SGE) on cytotoxicity and pro-inflammatory cytokine production in LPS-induced BEAS-2B cells. (<b>A</b>) Cytotoxicity of LPS and SGE in BEAS-2B cells was measured using the CCK-8 assay. (<b>B</b>–<b>E</b>) BEAS-2B cells were treated with LPS at 20 μg/mL and SGE at 50, 100, or 200 mg/mL for 24 h. Cytokines (IL-6, IL-8, TNF-α) and MUC5AC were measured using ELISA. (<b>F</b>) The relative expression of mRNA of the genes for IL-1β, IL-6, IL-8, TNF-α, IL-17, CXCL1, and IRAK1 in the LPS-stimulated cells. The data are presented as means ± SEM for three independent experiments. ## <span class="html-italic">p</span> &lt; 0.01, ### <span class="html-italic">p</span> &lt; 0.001 compared to the vehicle group. * <span class="html-italic">p</span> &lt; 0.05, ** <span class="html-italic">p</span> &lt; 0.01, *** <span class="html-italic">p</span> &lt; 0.001 compared to the control group. Dexa, dexamethasone.</p>
Full article ">Figure 2
<p>Effects of SGE on LPS-induced MAPK-NF-κB pathway in BEAS-2B cells. (<b>A</b>,<b>B</b>) The ratio of p-IκB to IκB and p-p65 to p65 was determined by pretreatment of BEAS-2B cells with SGE (50, 100, or 200 μg/mL) for 24 h, followed by stimulation with 20 μg/mL of LPS for 1 h and then immunoblotting. (<b>C</b>,<b>D</b>) The ratio of p-JNK to JNK and p-p38 to p38 was determined by pretreatment of BEAS-2B cells with SGE (50, 100, or 200 μg/mL) for 24 h, followed by stimulation with LPS for 1 h and then immunoblotting. Raw data of Western blot are described in the <a href="#app1-nutrients-15-00468" class="html-app">Supplementary Figure S1</a>. The data are expressed as means ± SEM of three independent experiments. # <span class="html-italic">p</span> &lt; 0.05, ## <span class="html-italic">p</span> &lt; 0.01 compared to the vehicle group. ** <span class="html-italic">p</span> &lt; 0.01, *** <span class="html-italic">p</span> &lt; 0.001 compared to the control group. Dexa, dexamethasone.</p>
Full article ">Figure 3
<p>Effects of SGE on the number of airway immune cells and neutrophilic airway inflammation in CSE/LPS-induced COPD murine model. (<b>A</b>) Schematic diagram of CSE/LPS-induced COPD model in mice. (<b>B</b>) The total number of cells in COPD-induced BALF in each treatment group. (<b>C</b>) The total number of cells in the lungs of COPD-induced mice in each treatment group. (<b>D</b>) The total number of cells in COPD-induced MLN in each treatment group. (<b>E</b>) The number of neutrophils in BALF was counted using a hemocytometer. (<b>F</b>) Photomicrograph of BALF cytospins from COPD model mice treated with CSE/LPS (magnification, 200×) by differential leukocyte staining. Neutrophils are indicated by arrows. Scale bar = 100 µm. The data are presented as means ± SEM (n = 6 mice) for individual mice. ### <span class="html-italic">p</span> &lt; 0.001 compared to normal, and * <span class="html-italic">p</span> &lt; 0.05, ** <span class="html-italic">p</span> &lt; 0.01, and *** <span class="html-italic">p</span> &lt; 0.001 compared to control. Dexa, dexamethasone.</p>
Full article ">Figure 4
<p>Effects of SGE on cytokine production in BALF of COPD-induced mice. Production of (<b>A</b>) MIP2, (<b>B</b>) CXCL1, (<b>C</b>) IL-17, (<b>D</b>), and TNF-α in BALF of COPD-induced mice was measured by ELISA. The data are presented as means ± SEM (n = 6 mice) for individual mice. ## <span class="html-italic">p</span> &lt; 0.01, ### <span class="html-italic">p</span> &lt; 0.001 compared to normal, and * <span class="html-italic">p</span> &lt; 0.05, ** <span class="html-italic">p</span> &lt; 0.01, and *** <span class="html-italic">p</span> &lt; 0.001 compared to control. Dexa, dexamethasone.</p>
Full article ">Figure 5
<p>Effects of SGE on the expression of genes for TNF-α, MIP2, CXCL1, MUC5AC, TRPV1, and TRPA1 in lung tissue of COPD-induced mice. Expression of (<b>A</b>) TNF-α, (<b>B</b>) MIP2, (<b>C</b>) CXCL-1, (<b>D</b>) MUC5AC, (<b>E</b>) TRPV1, and (<b>F</b>) TRPA1 genes was determined by RT-qPCR in lung tissue of COPD-induced mice. The data are presented as means ± SEM (n = 6 mice) for individual mice. ## <span class="html-italic">p</span> &lt; 0.01, ### <span class="html-italic">p</span> &lt; 0.001 compared to normal, and * <span class="html-italic">p</span> &lt; 0.05, ** <span class="html-italic">p</span> &lt; 0.01, and *** <span class="html-italic">p</span> &lt; 0.001 compared to control. Dexa, dexamethasone.</p>
Full article ">Figure 6
<p>Effects of SGE on histopathological markers for lung tissue of COPD-induced mice. Lung tissue was sectioned in paraffin and stained for histological analysis. (<b>A</b>) H&amp;E staining showing immune cell infiltration and the morphology of small airways. (<b>B</b>) M-T staining showing collagen fibers increased by pulmonary fibrosis. Black arrows indicate blue-dyed collagen fibers. (<b>C</b>) PAS staining showing hyperplasia of goblet cells in small airways. Black arrows indicate goblet cells. Scale bar = 100 µm. (<b>D</b>) Total index number were quantitated. The data are presented as means ± SEM (n = 6 mice) for individual mice. ### <span class="html-italic">p</span> &lt; 0.001 compared to normal, and ** <span class="html-italic">p</span> &lt; 0.01 compared to control. Dexa, dexamethasone.</p>
Full article ">Figure 7
<p>Effect of SGE on TNF-α, CXCL1, IRAK1 using immunofluorescence analysis of lung tissue from COPD-induced mice. Sectioned COPD-induced mouse lung tissue was stained with (<b>A</b>) TNF-α, (<b>B</b>) CXCL-1, or (<b>C</b>) IRAK1 antibodies and visualized as red fluorescence. Hoechst was used as a nuclear stain with blue fluorescence. Fluorescence for each factor is shown in a quantitative bar graph. Scale bar = 100 µm. The data are presented as means ± SEM (n = 6 mice) for individual mice. ### <span class="html-italic">p</span> &lt; 0.001 compared to normal, and * <span class="html-italic">p</span> &lt; 0.05, ** <span class="html-italic">p</span> &lt; 0.01, and *** <span class="html-italic">p</span> &lt; 0.001 compared to control. Dexa, dexamethasone.</p>
Full article ">Figure 8
<p>Effect of SGE on phenol red secretion in ICR mice. The amount of phenol red secretion in the airways was measured by injecting 5% phenol red into mice treated with Levosol or SGE for 3 days. The data are presented as means ± SEM (n = 10 mice) for individual mice. ### <span class="html-italic">p</span> &lt; 0.001 compared to the normal group, and *** <span class="html-italic">p</span> &lt; 0.001 compared to the control group.</p>
Full article ">
11 pages, 2225 KiB  
Systematic Review
Does Bariatric Surgery Reduce the Risk of Colorectal Cancer in Individuals with Morbid Obesity? A Systematic Review and Meta-Analysis
by Andrea Chierici, Paolo Amoretti, Céline Drai, Serena De Fatico, Jérôme Barriere, Luigi Schiavo and Antonio Iannelli
Nutrients 2023, 15(2), 467; https://doi.org/10.3390/nu15020467 - 16 Jan 2023
Cited by 8 | Viewed by 3924
Abstract
Bariatric surgery has shown to be effective in producing sustained weight loss and the resolution of obesity related medical problems. Recent research focused on the role of obesity and adipose tissue in tumorigenesis, finding a strong crosslink through different mechanisms and highlighting an [...] Read more.
Bariatric surgery has shown to be effective in producing sustained weight loss and the resolution of obesity related medical problems. Recent research focused on the role of obesity and adipose tissue in tumorigenesis, finding a strong crosslink through different mechanisms and highlighting an increase in cancer incidence in individuals with obesity. The aim of this meta-analysis is to find if bariatric surgery reduces the incidence of colorectal cancer in patients with obesity. We performed a meta-analysis including 18 studies (PROSPERO ID: CRD4202235931). Bariatric surgery was found to be significantly protective toward colorectal cancer incidence in individuals with obesity (HR: 0.81, p = 0.0142). The protective effect persisted when considering women (RR: 0.54, p = 0.0014) and men (RR: 0.74, p = 0.2798) separately, although this was not significant for the latter. No difference was found when comparing Roux-en-Y gastric bypass and sleeve gastrectomy. Bariatric surgery reduces the incidence of colorectal cancer in individuals with obesity independently from gender and surgical procedure. Prospective large cohort studies are needed to confirm these findings. Full article
(This article belongs to the Section Nutrition and Obesity)
Show Figures

Figure 1

Figure 1
<p>PRISMA flow-chart depicting the overall review process.</p>
Full article ">Figure 2
<p>Forest plot comparing colorectal cancer incidence in individuals with obesity who did or did not undergo BS [<a href="#B2-nutrients-15-00467" class="html-bibr">2</a>,<a href="#B6-nutrients-15-00467" class="html-bibr">6</a>,<a href="#B20-nutrients-15-00467" class="html-bibr">20</a>,<a href="#B21-nutrients-15-00467" class="html-bibr">21</a>,<a href="#B22-nutrients-15-00467" class="html-bibr">22</a>,<a href="#B23-nutrients-15-00467" class="html-bibr">23</a>,<a href="#B25-nutrients-15-00467" class="html-bibr">25</a>,<a href="#B26-nutrients-15-00467" class="html-bibr">26</a>,<a href="#B27-nutrients-15-00467" class="html-bibr">27</a>,<a href="#B28-nutrients-15-00467" class="html-bibr">28</a>,<a href="#B29-nutrients-15-00467" class="html-bibr">29</a>,<a href="#B30-nutrients-15-00467" class="html-bibr">30</a>,<a href="#B31-nutrients-15-00467" class="html-bibr">31</a>,<a href="#B32-nutrients-15-00467" class="html-bibr">32</a>,<a href="#B33-nutrients-15-00467" class="html-bibr">33</a>,<a href="#B34-nutrients-15-00467" class="html-bibr">34</a>,<a href="#B35-nutrients-15-00467" class="html-bibr">35</a>].</p>
Full article ">Figure 3
<p>Forest plot of HR meta-analysis after sensitivity analysis [<a href="#B6-nutrients-15-00467" class="html-bibr">6</a>,<a href="#B20-nutrients-15-00467" class="html-bibr">20</a>,<a href="#B27-nutrients-15-00467" class="html-bibr">27</a>,<a href="#B30-nutrients-15-00467" class="html-bibr">30</a>,<a href="#B31-nutrients-15-00467" class="html-bibr">31</a>,<a href="#B33-nutrients-15-00467" class="html-bibr">33</a>,<a href="#B34-nutrients-15-00467" class="html-bibr">34</a>].</p>
Full article ">Figure 4
<p>Risk of bias barplot with details of risk of bias for each bias domain.</p>
Full article ">
12 pages, 398 KiB  
Article
The Impact of the COVID-19 Pandemic on Public Interest in the Energy Labelling on Restaurant Menus
by Areej A. Alkhaldy, Omar A. Alhumaidan, Sarah M. Alkhunein, Majid M. Alkhalaf, Khlood A. Bookari and Jamila M. Arrish
Nutrients 2023, 15(2), 466; https://doi.org/10.3390/nu15020466 - 16 Jan 2023
Cited by 4 | Viewed by 2645
Abstract
No study has investigated the effect of the COVID-19 pandemic on the public’s interest in using energy labelling on restaurant menus. This study explores the effects of the COVID-19 pandemic on the public interest in using energy labelling on restaurant menus and meal [...] Read more.
No study has investigated the effect of the COVID-19 pandemic on the public’s interest in using energy labelling on restaurant menus. This study explores the effects of the COVID-19 pandemic on the public interest in using energy labelling on restaurant menus and meal delivery applications and the impact of energy-labelling availability on food choices during the COVID-19 pandemic in Saudi Arabia. An online questionnaire was completed by 1657 participants aged ≥ 18 years. Before the COVID-19 pandemic, 32% of customers visited a restaurant 2–4 times/week. However, during the pandemic, 35% of customers visited a restaurant only once per week. There was no difference in interest in reading energy labelling or using meal delivery applications before and during the pandemic. During the COVID-19 pandemic, about 55% of restaurant customers reported that they had noticed energy labelling, with 42% of them being influenced by the energy-labelling information. Regarding energy information on food delivery applications, 40% of customers noticed energy labelling when using the applications, with 33% of them being affected by the energy labelling. Customer interest in reading about energy on restaurant menus during the pandemic did not change significantly from the level of interest before the pandemic. The interest expressed by the public in using the energy labelling was low both before and during the COVID-19 pandemic. Full article
Show Figures

Figure 1

Figure 1
<p>Frequency of restaurant visits and using food delivery applications before and after the COVID-19 pandemic (1657).</p>
Full article ">
11 pages, 2575 KiB  
Article
Policy to Decrease Low Birth Weight in Indonesia: Who Should Be the Target?
by Ratna Dwi Wulandari, Agung Dwi Laksono and Ratu Matahari
Nutrients 2023, 15(2), 465; https://doi.org/10.3390/nu15020465 - 16 Jan 2023
Cited by 1 | Viewed by 3481
Abstract
The study aimed to analyze the target of the policy to decrease low birth weight (LBW) in Indonesia. This cross-sectional study used a sample of live births in last five years preceding the survey of birth weight. Data collection took place from July [...] Read more.
The study aimed to analyze the target of the policy to decrease low birth weight (LBW) in Indonesia. This cross-sectional study used a sample of live births in last five years preceding the survey of birth weight. Data collection took place from July to September 2017. The weighted sample size was 17,848 participants. The variables analyzed included residence, age, marital status, education, employment, parity, and wealth. The study employed binary logistic regression in the final stage to determine the target of policy regarding LBW. The results showed that women in urban areas were 1.200 times more likely to deliver babies with LBW than women in rural areas. All age groups were less likely to deliver babies with LBW than those aged 45–49. The study also found all marital statuses had a lower likelihood of providing babies with LBW than those who had never been in a marriage. Women of all education levels had a greater risk of giving birth to babies with LBW than women with higher education levels. Unemployed women had 1.033 times more chances of delivering babies with LBW than employed women. Primiparous women were 1.132 times more likely to give birth to babies with LBW than multiparous women. Overall, the women in all wealth status categories had a higher probability of delivering babies with LBW than the wealthiest groups. The study concluded that policymakers should target women who live in urban areas, are old, have never been married, have low education, and are unemployed, primiparous, and poor to decrease LBW cases in Indonesia. Full article
(This article belongs to the Special Issue Nutrition Status and Policies in Low- and Middle-Income Countries)
Show Figures

Figure 1

Figure 1
<p>Distribution of LBW percentage by the province in Indonesia, 2017.</p>
Full article ">
23 pages, 1110 KiB  
Review
Bioactive Molecules from Marine Diatoms and Their Value for the Nutraceutical Industry
by Paola Nieri, Sara Carpi, Roberta Esposito, Maria Costantini and Valerio Zupo
Nutrients 2023, 15(2), 464; https://doi.org/10.3390/nu15020464 - 16 Jan 2023
Cited by 18 | Viewed by 4013
Abstract
The search for novel sources of nutrients is among the basic goals for achievement of sustainable progress. In this context, microalgae are relevant organisms, being rich in high-value compounds and able to grow in open ponds or photobioreactors, thus enabling profitable exploitation of [...] Read more.
The search for novel sources of nutrients is among the basic goals for achievement of sustainable progress. In this context, microalgae are relevant organisms, being rich in high-value compounds and able to grow in open ponds or photobioreactors, thus enabling profitable exploitation of aquatic resources. Microalgae, a huge taxon containing photosynthetic microorganisms living in freshwater, as well as in brackish and marine waters, typically unicellular and eukaryotic, include green algae (Chlorophyceae), red algae (Rhodophyceae), brown algae (Phaeophyceae) and diatoms (Bacillariophyceae). In recent decades, diatoms have been considered the most sustainable sources of nutrients for humans with respect to other microalgae. This review focuses on studies exploring their bio-pharmacological activities when relevant for human disease prevention and/or treatment. In addition, we considered diatoms and their extracts (or purified compounds) when relevant for specific nutraceutical applications. Full article
(This article belongs to the Special Issue Marine Nutraceuticals and Human Health)
Show Figures

Figure 1

Figure 1
<p>Bioactive molecules isolated from diatoms and functionally evaluated, as summarized in this review.</p>
Full article ">Figure 2
<p>Chemical structures of the most significant molecules isolated from diatoms, drawn by using the software ChemDraw.</p>
Full article ">Figure 3
<p>Pipeline adopted to obtain potential use of diatoms as biomass, extracts or purified compounds in functional food and diet supplements.</p>
Full article ">
15 pages, 3241 KiB  
Article
Maternal Protein Restriction in Rats Alters Postnatal Growth and Brain Lipid Sensing in Female Offspring
by Valentine S. Moullé, Morgane Frapin, Valérie Amarger and Patricia Parnet
Nutrients 2023, 15(2), 463; https://doi.org/10.3390/nu15020463 - 16 Jan 2023
Cited by 2 | Viewed by 2449
Abstract
Perinatal nutrition is a key player in the susceptibility to developing metabolic diseases in adulthood, leading to the concept of “metabolic programming”. The aim of this study was to assess the impact of maternal protein restriction during gestation and lactation on glucose homeostasis [...] Read more.
Perinatal nutrition is a key player in the susceptibility to developing metabolic diseases in adulthood, leading to the concept of “metabolic programming”. The aim of this study was to assess the impact of maternal protein restriction during gestation and lactation on glucose homeostasis and eating behaviour in female offspring. Pregnant rats were fed a normal or protein-restricted (PR) diet and followed throughout gestation and lactation. Body weight, glucose homeostasis, and eating behaviour were evaluated in offspring, especially in females. Body weight gain was lower in PR dams during lactation only, despite different food and water intakes throughout gestation and lactation. Plasma concentration of leptin, adiponectin and triglycerides increased drastically before delivery in PR dams in relation to fat deposits. Although all pups had identical birth body weight, PR offspring body weight differed from control offspring around postnatal day 10 and remained lower until adulthood. Offspring glucose homeostasis was mildly impacted by maternal PR, although insulin secretion was reduced for PR rats at adulthood. Food intake, satiety response, and cerebral activation were examined after a lipid preload and demonstrated some differences between the two groups of rats. Maternal PR during gestation and lactation does induce extrauterine growth restriction, accompanied by alterations in maternal plasma leptin and adiponectin levels, which may be involved in programming the alterations in eating behaviour observed in females at adulthood. Full article
(This article belongs to the Section Nutrition in Women)
Show Figures

Figure 1

Figure 1
<p>Schematic diagram of the study design. Two groups of animals were generated from mothers fed with control diet (CTL; 20% proteins) or low-protein diet (PR; 8% proteins). Insulin sensitivity and glucose tolerance were studied in offspring at postnatal day (PND) 30 and PND100. Lipid preload test and c-fos staining in brain were performed in female offspring at PND100 to test the impact of maternal diet on hypothalamic lipid sensing in offspring. ITT, insulin tolerance test; OGTT, oral glucose tolerance test.</p>
Full article ">Figure 2
<p>Dams follow-up during gestation and lactation. Body weight (<b>a</b>); food intake (<b>b</b>); protein (<b>c</b>), lipid (<b>d</b>), and carbohydrate (<b>e</b>) consumption; and water intake (<b>f</b>) are presented during gestation (from D1 to D21) and lactation (from D22 to D42). Solid line, CTL; Dotted line, PR. Vertical dotted line at D21 indicates delivery. CTL, control. PR, protein restriction, BW, body weight. Data are mean ± SEM (<span class="html-italic">n</span> = 8–13). * <span class="html-italic">p</span> &lt; 0.05, ** <span class="html-italic">p</span> &lt; 0.01, *** <span class="html-italic">p</span> &lt; 0.001 vs. CTL, 2-way ANOVA with Sidak post-test.</p>
Full article ">Figure 3
<p>Plasma parameters and adiposity follow-up of dams during gestation and lactation. Blood glucose (<b>a</b>), plasma insulin (<b>b</b>), leptin (<b>c</b>), adiponectin (<b>d</b>), and triglyceride (<b>e</b>) levels have been followed during gestation (from D1 to D21) and lactation (from D22 to D42). At weaning, mothers have been sacrificed and liver (<b>f</b>), mammary gland (<b>g</b>), perirenal (<b>h</b>), and mesenteric (<b>i</b>) white adipose tissues have been weighed. Triglyceride and cholesterol contents (<b>j</b>) have been assayed in the liver. Solid line, CTL; Dotted line, PR. Vertical dotted line at D21 indicates delivery. CTL, control. PR, protein restriction; WAT, white adipose tissue; TG, triglycerides; CHOL, cholesterol. Data are mean ± SEM or individual values (<span class="html-italic">n</span> = 2–13). * <span class="html-italic">p</span> &lt; 0.05, ** <span class="html-italic">p</span> &lt; 0.01, *** <span class="html-italic">p</span> &lt; 0.001 vs. CTL, 2-way ANOVA with Sidak post-test.</p>
Full article ">Figure 4
<p>Postnatal growth of male and female offspring. Body weight (BW; <b>a</b>,<b>c</b>,<b>e</b>,<b>g</b>) and BW gain at postnatal day (PND) 21 (<b>b</b>,<b>f</b>) and PND100 (<b>d</b>,<b>h</b>) have been followed in male (<b>a</b>–<b>d</b>) and female (<b>e</b>–<b>h</b>) offspring from the birth. Black line, CTL; coloured line, PR. Green, male; purple, female. CTL, control. PR, protein restriction. Data are mean ± SEM or individual values (<span class="html-italic">n</span> = 5–31). * <span class="html-italic">p</span> &lt; 0.05, ** <span class="html-italic">p</span> &lt; 0.01, *** <span class="html-italic">p</span> &lt; 0.001 vs. CTL, 2-way ANOVA with Sidak post-test, unpaired <span class="html-italic">t</span>-test.</p>
Full article ">Figure 5
<p>Insulin and glucose tolerance in male and female offspring at postnatal day (PND) 30 and PND100. Blood glucose follow-up after intraperitoneal insulin injection (0.75 U/kg) in male (<b>a</b>) and female (<b>b</b>) after 5 h-fasting. Blood glucose follow-up after oral glucose gavage (2 g/kg) in male (<b>c</b>,<b>i</b>) and female (<b>f</b>,<b>l</b>) at PND 30 (<b>c</b>–<b>h</b>) and PND100 (<b>i</b>–<b>n</b>). Area under the curve (AUC) for male (<b>d</b>,<b>j</b>) and female (<b>g</b>,<b>m</b>). Plasma insulin in response to blood glucose increase in male (e,k) and female (<b>h</b>,<b>n</b>). Black line, CTL; coloured line, PR. Green, male; purple, female. CTL, control. PR, protein restriction; AUC, area under the curve. Data are mean ± SEM or individual values (<span class="html-italic">n</span> = 5–10). * <span class="html-italic">p</span> &lt; 0.05, ** <span class="html-italic">p</span> &lt; 0.01, *** <span class="html-italic">p</span> &lt; 0.001 vs. CTL, 2-way ANOVA with Sidak post-test, unpaired <span class="html-italic">t</span>-test.</p>
Full article ">Figure 6
<p>Food intake measurement after water or Intralipid 5% (IL) ingestion in female offspring at postnatal day (PND) 100. Schematic representation of the experiment (<b>a</b>): after 5 h-food deprivation, a weighed bottle of water or IL was presented to rats during 15 min then removed. Food pellets were given back and food intake was measured after 1 h, 3 h, 5 h, and 19 h. This sequence was repeated 7 days in a row. IL intake (<b>b</b>) each day of the training period. Daily 1 h-food intake after water (<b>c</b>) and IL (<b>d</b>) preload, and AUC (<b>e</b>) in CTL and PR females. Daily 5 h-food intake after water (<b>f</b>) and IL (<b>g</b>) preload, and AUC (<b>h</b>) in CTL and PR females. Daily 19 h-food intake after water (<b>i</b>) and IL (<b>j</b>) preload, and AUC (<b>k</b>) in CTL and PR females. The 1 h-, 3 h-, and 5 h-calorie intakes in CTL and PR females after water (<b>l</b>) or IL preload (<b>m</b>). Black and purple bars, water; grey and pink bars, IL. Solid line, food intake. Dotted line, IL intake. CTL, control. PR, protein restriction. IL, intralipid. AUC, area under the curve. Data are individual values and mean ± SEM or individual values (<span class="html-italic">n</span> = 4–5). * <span class="html-italic">p</span> &lt; 0.05 vs. CTL, 1-way or 2-way ANOVA with Sidak post-test, unpaired <span class="html-italic">t</span>-test.</p>
Full article ">Figure 6 Cont.
<p>Food intake measurement after water or Intralipid 5% (IL) ingestion in female offspring at postnatal day (PND) 100. Schematic representation of the experiment (<b>a</b>): after 5 h-food deprivation, a weighed bottle of water or IL was presented to rats during 15 min then removed. Food pellets were given back and food intake was measured after 1 h, 3 h, 5 h, and 19 h. This sequence was repeated 7 days in a row. IL intake (<b>b</b>) each day of the training period. Daily 1 h-food intake after water (<b>c</b>) and IL (<b>d</b>) preload, and AUC (<b>e</b>) in CTL and PR females. Daily 5 h-food intake after water (<b>f</b>) and IL (<b>g</b>) preload, and AUC (<b>h</b>) in CTL and PR females. Daily 19 h-food intake after water (<b>i</b>) and IL (<b>j</b>) preload, and AUC (<b>k</b>) in CTL and PR females. The 1 h-, 3 h-, and 5 h-calorie intakes in CTL and PR females after water (<b>l</b>) or IL preload (<b>m</b>). Black and purple bars, water; grey and pink bars, IL. Solid line, food intake. Dotted line, IL intake. CTL, control. PR, protein restriction. IL, intralipid. AUC, area under the curve. Data are individual values and mean ± SEM or individual values (<span class="html-italic">n</span> = 4–5). * <span class="html-italic">p</span> &lt; 0.05 vs. CTL, 1-way or 2-way ANOVA with Sidak post-test, unpaired <span class="html-italic">t</span>-test.</p>
Full article ">Figure 7
<p>Immunostaining of c-fos-positive cells in hypothalamic nuclei after 1 h water or Intralipid 5% (IL) ingestion in female offspring at postnatal day (PND). Number of c-fos-positive cells in ARC (<b>a</b>), PVN (<b>b</b>), LH (<b>c</b>), DMN (<b>d</b>), and VMN (<b>e</b>) in CTL and PR females. Representative photomicrographs of lateral hypothalamus after water or IL ingestion in CTL and PR females (<b>f</b>). C-fos-positive cells in ARC (<b>g</b>), PVN (<b>h</b>), LH (<b>i</b>), DMN (<b>j</b>), and VMN (<b>k</b>) in fold increase of water CTL and PR females. Black and purple bars, water; grey and pink bars, IL. CTL, control. PR, protein restriction. IL, intralipid; ARC, arcuate nucleus; PVN, paraventricular nucleus; LH, lateral hypothalamus; DMN, dorsomedian nucleus; VMN, ventromedian nucleus; f, fornix. Scale bar = 100 nm. Data are individual values and mean ± SEM or individual values (<span class="html-italic">n</span> = 4–5). * <span class="html-italic">p</span> &lt; 0.05 vs. CTL, unpaired <span class="html-italic">t</span>-test.</p>
Full article ">
10 pages, 1284 KiB  
Article
A Nutraceutical Containing Chlorogenic Acid and Luteolin Improves Cardiometabolic Parameters in Subjects with Pre-Obesity: A 6-Month Randomized, Double-Blind, Placebo-Controlled Study
by Simona Terzo, Antonella Amato, Antonio Magán-Fernández, Giuseppa Castellino, Pasquale Calvi, Roberta Chianetta, Rosaria V. Giglio, Angelo M. Patti, Dragana Nikolic, Alberto Firenze, Flavia Mulè, Marcello Ciaccio and Manfredi Rizzo
Nutrients 2023, 15(2), 462; https://doi.org/10.3390/nu15020462 - 16 Jan 2023
Cited by 11 | Viewed by 3591
Abstract
Pre-obesity is a condition that predisposes to the risk of developing obesity, cardiovascular diseases (CVD), and diabetes. Our previous study demonstrated that a Cynara cardunculus (L.) based nutraceutical named Altilix® (Bionap, Italy), containing chlorogenic acid and luteolin extracts, was able to improve [...] Read more.
Pre-obesity is a condition that predisposes to the risk of developing obesity, cardiovascular diseases (CVD), and diabetes. Our previous study demonstrated that a Cynara cardunculus (L.) based nutraceutical named Altilix® (Bionap, Italy), containing chlorogenic acid and luteolin extracts, was able to improve several hepatic and cardio-metabolic parameters. Given this background, we conducted a post-hoc analysis of the Altilix® study in order to analyze the supplement’s effects in the subgroup of pre-obesity subjects on anthropometry (weight and waist circumference), glucose metabolism (HbA1C, HOMA-IR, and HOMA-β), lipid profile (total cholesterol, triglycerides, LDL-cholesterol and HDL-cholesterol), hepatic functionality (FLI, AST, ALT and AST/ALT), carotid-media thickness (CIMT) and endothelial function (FMD). Fifty subjects from the original study cohort (which consisted of 100 subjects) were chosen with BMI ≥ 25 and < 30 kg/m2. All subjects received the Altilix® supplement (150 mg/day) or placebo using a computer-based random allocation system. After six months of treatment Altilix® significantly reduced body weight, glycemic, and lipid parameters (total cholesterol, triglycerides, LDL-cholesterol) and improved hepatic functionality, CIMT, and FMD. In conclusion, these results confirm that Altilix® supplementation has a significant effect on cardiometabolic parameters not only in obese subjects but also in pre-obesity subjects. Full article
Show Figures

Figure 1

Figure 1
<p>Study design.</p>
Full article ">Figure 2
<p>Percentage changes of anthropometric, glycemic and lipid parameters in all subjects.</p>
Full article ">Figure 3
<p>Percentage changes of liver and cardiovascular parameters in all subjects.</p>
Full article ">
12 pages, 896 KiB  
Article
Association of Blood Urea Nitrogen with Cardiovascular Diseases and All-Cause Mortality in USA Adults: Results from NHANES 1999–2006
by Canlin Hong, Huiping Zhu, Xiaoding Zhou, Xiaobing Zhai, Shiyang Li, Wenzhi Ma, Keyang Liu, Kokoro Shirai, Haytham A. Sheerah and Jinhong Cao
Nutrients 2023, 15(2), 461; https://doi.org/10.3390/nu15020461 - 16 Jan 2023
Cited by 14 | Viewed by 5537
Abstract
In the general population, there is little evidence of a link between blood urea nitrogen (BUN) and long-term mortality. The goal of this study was to explore whether higher BUN concentration is a predictor of cardiovascular disease (CVD) and all-cause mortality. From 1999 [...] Read more.
In the general population, there is little evidence of a link between blood urea nitrogen (BUN) and long-term mortality. The goal of this study was to explore whether higher BUN concentration is a predictor of cardiovascular disease (CVD) and all-cause mortality. From 1999 to 2006, the National Health and Nutrition Examination Survey (NHANES) included 17,719 adult individuals. Death outcomes were ascertained by linkage to the database records through 31 December 2015. The Cox proportional hazard regression model was used to calculate hazard ratios (HRs) and 95% confidence intervals (CIs) for CVD and all-cause mortality in individuals. We also performed stratified analyses based on age, gender, drinking, smoking, history of hypertension and diabetes. During a mean follow-up 11.65 years, a total of 3628 deaths were documented, of which 859 were due to CVD. Participants with higher BUN had a higher risk of CVD and all-cause death compared to those with lower BUN. After multifactor adjustment for demographics, major lifestyle factors, and hypertension and diabetes history, higher BUN levels compared with lower levels were significantly associated with higher risk of CVD (HR: 1.48 [1.08, 2.02], P-trend < 0.001) and all-cause mortality (HR: 1.48 [1.28, 1.72], P-trend < 0.001). In subgroup analyses, we found that the trend in the association of BUN with the risk of death remained strong in female subjects. Greater BUN levels were linked to higher CVD and all-cause mortality in the NHANES of American adults. The importance of BUN in predicting death is supported by our research. Full article
(This article belongs to the Topic Metabolism and Health)
Show Figures

Figure 1

Figure 1
<p>Flowchart of participants included in the analysis.</p>
Full article ">Figure 2
<p>Associations between blood urea nitrogen and CVD, all-cause mortality stratified by age, gender, alcohol drinking status, smoking status, history of hypertension, history of diabetes. Hazard ratios were adjusted for age, sex, race/ethnicity, education, BMI, alcohol drinking status, smoking status, total cholesterol, ALT, total protein, albumin, globulin, HDL, history of hypertension and history of diabetes.</p>
Full article ">
14 pages, 309 KiB  
Article
Legume Intake, Body Weight, and Abdominal Adiposity: 10-Year Weight Change and Cross-Sectional Results in 15,185 U.S. Adults
by Larry A. Tucker
Nutrients 2023, 15(2), 460; https://doi.org/10.3390/nu15020460 - 16 Jan 2023
Cited by 3 | Viewed by 3654
Abstract
There were three objectives: (1) evaluate the relationship between legume intake and weight change across the previous 10 years, (2) examine the cross-sectional associations between legume consumption, BMI, and abdominal adiposity, and (3) determine if the relationship between legume intake and the outcomes [...] Read more.
There were three objectives: (1) evaluate the relationship between legume intake and weight change across the previous 10 years, (2) examine the cross-sectional associations between legume consumption, BMI, and abdominal adiposity, and (3) determine if the relationship between legume intake and the outcomes were influenced by multiple covariates, particularly fiber intake. The sample included 15,185 randomly selected adults representative of the U.S. population. Percent change in weight was used as the outcome measure for the 10-year analysis. BMI, and waist circumference, corrected for height, were employed as the outcomes for the cross-sectional analyses. Legume, fiber, and energy intakes were measured using the average of two 24-h dietary recalls. Legume intake was divided into three categories. Five demographic and five lifestyle covariates were controlled statistically. There was an inverse dose-response relationship between legume intake and percent weight change over the previous 10 years after adjusting for 9 of the covariates (F = 6.5, p = 0.0028). However, after controlling for fiber with the other covariates, there were no differences across the three legume intake groups (F = 1.9, p = 0.1626). The cross-sectional findings showed similar inverse dose-response results until fiber intake was controlled. Then the associations became non-significant. In conclusion, legume intake is a good predictor of percent weight change over the previous 10 years, and it is also a significant predictor of BMI and abdominal adiposity cross-sectionally. These relationships are strongly influenced by fiber consumption. Evidently, legumes have dietary advantages, especially high fiber levels, that seem to be valuable in the battle against weight gain and obesity. Full article
(This article belongs to the Special Issue Advances in Legumes for Human Nutrition)
13 pages, 3659 KiB  
Article
Natural Activators of Autophagy Reduce Oxidative Stress and Muscle Injury Biomarkers in Endurance Athletes: A Pilot Study
by Alessandra D’Amico, Chiara Fossati, Fabio Pigozzi, Paolo Borrione, Mariangela Peruzzi, Simona Bartimoccia, Filippo Saba, Annachiara Pingitore, Giuseppe Biondi-Zoccai, Luigi Petramala, Fabrizio De Grandis, Daniele Vecchio, Luca D’Ambrosio, Sonia Schiavon, Luigi Sciarra, Cristina Nocella and Elena Cavarretta
Nutrients 2023, 15(2), 459; https://doi.org/10.3390/nu15020459 - 16 Jan 2023
Cited by 1 | Viewed by 3758
Abstract
Background: Oxidative stress and impaired autophagy are directly and indirectly implicated in exercise-mediated muscle injury. Trehalose, spermidine, nicotinamide, and polyphenols possess pro-autophagic and antioxidant properties, and could therefore reduce exercise-induced damage to skeletal muscle. The aim of this study was to investigate whether [...] Read more.
Background: Oxidative stress and impaired autophagy are directly and indirectly implicated in exercise-mediated muscle injury. Trehalose, spermidine, nicotinamide, and polyphenols possess pro-autophagic and antioxidant properties, and could therefore reduce exercise-induced damage to skeletal muscle. The aim of this study was to investigate whether a mixture of these compounds was able to improve muscle injury biomarkers in endurance athletes through the modulation of oxidative stress and autophagic machinery. Methods and Results: sNOX2-dp; H2O2 production; H2O2 breakdown activity (HBA); ATG5 and p62 levels, both markers of autophagic process; and muscle injury biomarkers were evaluated in five endurance athletes who were allocated in a crossover design study to daily administration of 10.5 g of an experimental mixture or no treatment, with evaluations conducted at baseline and after 30 days of mixture consumption. Compared to baseline, the mixture intake led to a remarkable reduction of oxidative stress and positively modulated autophagy. Finally, after the 30-day supplementation period, a significant decrease in muscle injury biomarkers was found. Conclusion: Supplementation with this mixture positively affected redox state and autophagy and improved muscle injury biomarkers in athletes, allowing for better muscle recovery. Moreover, it is speculated that this mixture could also benefit patients suffering from muscle injuries, such as cancer or cardiovascular patients, or elderly subjects. Full article
(This article belongs to the Special Issue Sport Supplementation for Performance and Health)
Show Figures

Graphical abstract

Graphical abstract
Full article ">Figure 1
<p>A schematic representation of the study design.</p>
Full article ">Figure 2
<p>Serum levels of CK (<b>a</b>), LDH (<b>b</b>), and myoglobin (<b>c</b>) before (T0) and 1 month (T30 days) after mixture intake (<span class="html-italic">n</span> = 5) or no-treatment period (<span class="html-italic">n</span> = 5) in athletes. Data are expressed as mean ± SD. * <span class="html-italic">p</span> &lt; 0.05, ** <span class="html-italic">p</span> &lt; 0.01.</p>
Full article ">Figure 3
<p>Serum soluble NOX2-derived peptide (sNOX2-dp) (<b>a</b>), serum H<sub>2</sub>O<sub>2</sub> (<b>b</b>), and blood HBA (<b>c</b>) before (T0) and 1 month (T30 days) after mixture intake (<span class="html-italic">n</span> = 5) or no-treatment period (<span class="html-italic">n</span> = 5) in athletes. Data are expressed as mean ± SD. * <span class="html-italic">p</span> &lt; 0.05, ** <span class="html-italic">p</span> &lt; 0.01.</p>
Full article ">Figure 4
<p>Serum ATG5 (<b>a</b>) and p62 (<b>b</b>) before (T0) and 1 month (T30 days) after mixture intake (<span class="html-italic">n</span> = 5) or no-treatment period (<span class="html-italic">n</span> = 5) in athletes. Data are expressed as mean ± SD. * <span class="html-italic">p</span> &lt; 0.05, ** <span class="html-italic">p</span> &lt; 0.01.</p>
Full article ">Figure 5
<p>Linear correlation analysis between the parameters describing muscle injury, oxidative stress and autophagy. Relationship between Δ CK and Δ p62 (<b>a</b>), Δ CK and Δ H<sub>2</sub>O<sub>2</sub> (<b>b</b>), Δ CK and Δ sNOX2-dp (<b>c</b>), Δ CK and Δ HBA (<b>d</b>), Δ LDH and Δ sNO2-dp (<b>e</b>), and Δ LDH and Δ HBA (<b>f</b>).</p>
Full article ">
13 pages, 1750 KiB  
Article
Metabolic Effects and Safety Aspects of Acute D-allulose and Erythritol Administration in Healthy Subjects
by Fabienne Teysseire, Valentine Bordier, Aleksandra Budzinska, Lukas Van Oudenhove, Nathalie Weltens, Christoph Beglinger, Bettina K. Wölnerhanssen and Anne Christin Meyer-Gerspach
Nutrients 2023, 15(2), 458; https://doi.org/10.3390/nu15020458 - 15 Jan 2023
Cited by 3 | Viewed by 6254
Abstract
The rapid increase in sugar consumption is associated with various negative metabolic and inflammatory effects; therefore, alternative sweeteners become of interest. The aim of this study was to investigate the metabolic effects and safety aspects of acute D-allulose and erythritol on glucose, insulin, [...] Read more.
The rapid increase in sugar consumption is associated with various negative metabolic and inflammatory effects; therefore, alternative sweeteners become of interest. The aim of this study was to investigate the metabolic effects and safety aspects of acute D-allulose and erythritol on glucose, insulin, ghrelin, blood lipids, uric acid, and high-sensitive C-reactive protein (hsCRP). In three study visits, 18 healthy subjects received an intragastric administration of 25 g D-allulose or 50 g erythritol, or 300 mL tap water (placebo) in a randomized, double-blind and crossover order. To measure the aforementioned parameters, blood samples were drawn at fixed time intervals. Glucose and insulin concentrations were lower after D-allulose compared to tap water (p = 0.001, dz = 0.91 and p = 0.005, dz = 0.58, respectively); however, Bayesian models show no difference for insulin in response to D-allulose compared to tap water, and there was no effect after erythritol. An exploratory analysis showed that ghrelin concentrations were reduced after erythritol compared to tap water (p = 0.026, dz = 0.59), with no effect after D-allulose; in addition, both sweeteners had no effect on blood lipids, uric acid and hsCRP. This combination of properties identifies both sweeteners as excellent candidates for effective and safe sugar alternatives. Full article
(This article belongs to the Special Issue Effects of Non-nutritive Sweeteners on Energy Intake and Human Health)
Show Figures

Figure 1

Figure 1
<p>Study timeline: Intragastric administration of the solutions at t = 0 min to 18 healthy subjects in a randomized, double-blind, crossover order, in three different study visits after an overnight fast. The red tubes indicate blood sample collection.</p>
Full article ">Figure 2
<p>Glucose (<b>A</b>) and insulin (<b>B</b>) concentrations in response to intragastric administration of solutions containing 25 g D-allulose, 50 g erythritol or tap water to 18 healthy subjects. Data are expressed as mean ± SEM, and changes from baseline values are shown.</p>
Full article ">Figure 3
<p>Raincloud plots showing the Bayesian repeated measures ANOVA on the AUC of glucose (<b>A</b>) or insulin (<b>B</b>) concentrations in response to the intragastric administration of solutions containing 25 g D-allulose (green), 50 g erythritol (orange) or tap water (purple) to 18 healthy subjects.</p>
Full article ">Figure 4
<p>Ghrelin concentrations in response to intragastric administration of solutions containing 25 g D-allulose, 50 g erythritol or tap water to 18 healthy subjects. Data are expressed as mean ± SEM, and changes from baseline values are shown.</p>
Full article ">
24 pages, 426 KiB  
Review
Valorization of Chicken Slaughterhouse Byproducts to Obtain Antihypertensive Peptides
by Francisca Isabel Bravo, Enrique Calvo, Rafael A. López-Villalba, Cristina Torres-Fuentes, Begoña Muguerza, Almudena García-Ruiz and Diego Morales
Nutrients 2023, 15(2), 457; https://doi.org/10.3390/nu15020457 - 15 Jan 2023
Cited by 11 | Viewed by 3465
Abstract
Hypertension (HTN) is the leading cause of premature deaths worldwide and the main preventable risk factor for cardiovascular diseases. Therefore, there is a current need for new therapeutics to manage this condition. In this regard, protein hydrolysates containing antihypertensive bioactive peptides are of [...] Read more.
Hypertension (HTN) is the leading cause of premature deaths worldwide and the main preventable risk factor for cardiovascular diseases. Therefore, there is a current need for new therapeutics to manage this condition. In this regard, protein hydrolysates containing antihypertensive bioactive peptides are of increasing interest. Thus, agri-food industry byproducts have emerged as a valuable source to obtain these hydrolysates as they are rich in proteins and inexpensive. Among these, byproducts from animal origin stand out as they are abundantly generated worldwide. Hence, this review is focused on evaluating the potential role of chicken slaughterhouse byproducts as a source of peptides for managing HTN. Several of these byproducts such as blood, bones, skins, and especially, chicken feet have been used to obtain protein hydrolysates with angiotensin-converting enzyme (ACE)-inhibitory activity and blood pressure-lowering effects. An increase in levels of endogenous antioxidant compounds, a reduction in ACE activity, and an improvement of HTN-associated endothelial dysfunction were the mechanisms underlying their effects. However, most of these studies were carried out in animal models, and further clinical studies are needed in order to confirm these antihypertensive properties. This would increase the value of these byproducts, contributing to the circular economy model of slaughterhouses. Full article
18 pages, 4901 KiB  
Article
Gamma-Aminobutyric Acid Promotes Beige Adipocyte Reconstruction by Modulating the Gut Microbiota in Obese Mice
by Xiaoyi Ma, Huanhuan Yan, Shubin Hong, Shuang Yu, Yingying Gong, Dide Wu, Yanbing Li and Haipeng Xiao
Nutrients 2023, 15(2), 456; https://doi.org/10.3390/nu15020456 - 15 Jan 2023
Cited by 5 | Viewed by 2935
Abstract
Given the increasing prevalence of obesity, the white-to-beige adipocyte conversion has attracted interest as a target for obesity treatment. Gamma-aminobutyric acid (GABA) treatment can reduce obesity, but the underlying mechanism remains unclear. Here, we aimed to investigate the mechanism by which GABA triggers [...] Read more.
Given the increasing prevalence of obesity, the white-to-beige adipocyte conversion has attracted interest as a target for obesity treatment. Gamma-aminobutyric acid (GABA) treatment can reduce obesity, but the underlying mechanism remains unclear. Here, we aimed to investigate the mechanism by which GABA triggers weight loss by improving the beiging of inguinal white adipose tissue (iWAT) and the role of gut microbiota in this process. The results showed that GABA reduced body weight and adipose inflammation and promoted the expression of thermogenic genes in the iWAT. The 16S rRNA sequence analysis of gut microbiota showed that GABA treatment increased the relative abundance of Bacteroidetes, Akkermansia, and Romboutsia and reduced that of Firmicutes and Erysipelatoclostridium in obese mice. Additionally, serum metabolomic analysis revealed that GABA treatment increased 3-hydroxybutyrate and reduced oxidized lipid levels in obese mice. Spearman’s correlation analysis showed that Akkermansia and Romboutsia were negatively associated with the levels of oxidized lipids. Fecal microbiota transplantation analysis confirmed that the gut microbiota was involved in the white-to-beige adipocyte reconstruction by GABA. Overall, our findings suggest that GABA treatment may promote iWAT beiging through the gut microbiota in obese mice. GABA may be utilized to protect obese people against metabolic abnormalities brought on by obesity and gut dysbiosis. Full article
(This article belongs to the Section Nutrition and Metabolism)
Show Figures

Figure 1

Figure 1
<p>GABA treatment promotes energy consumption and improves glucose metabolism. Mice were administered SD (black), SD+GABA (green), HFD (red), or HFD+GABA (blue) treatment. (<b>A</b>) Changes in body weight curves of the mice over the 16 weeks of treatment. For SD+GABA and HFD+GABA group, 6 mg·mL<sup>−1</sup> GABA was intervened at 12 weeks for a period of 4 weeks. (<b>B</b>) Body weight after the experiment. (<b>C</b>) Food intake of SD group, SD+GABA group, HFD group and HFD+GABA group. (<b>D</b>,<b>E</b>) MRI measurement of adipose tissue content (BAT, iWAT, and eWAT) and statistical analysis at the end of experiment. (<b>F</b>) Rectal temperature of mice in 25 °C (standard) or 4 °C (cold stimulation) for 180 min at the end of experiment. (<b>G</b>) Fast blood glucose concentrations at the 12th and the 16th week of the experiment. (<b>H</b>,<b>I</b>) Blood glucose concentrations during GTT (<b>H</b>), and the area under the GTT curve (<b>I</b>) at the end of experiment. (<b>J</b>,<b>K</b>) Blood glucose concentrations during ITT (<b>J</b>), and the area under the ITT curve (<b>K</b>) at the end of experiment. Data are presented mean  ±  standard deviation and were analyzed using a one-way or two-way ANOVA. * <span class="html-italic">p</span>  &lt;  0.05, ** <span class="html-italic">p</span>  &lt;  0.01, *** <span class="html-italic">p</span>  &lt;  0.001, **** <span class="html-italic">p</span>  &lt;  0.0001 compared to the SD group in (<b>A</b>,<b>B</b>,<b>F</b>–<b>K</b>). ^ <span class="html-italic">p</span>  &lt;  0.05, ^^ <span class="html-italic">p</span>  &lt;  0.01 and ^^^^ <span class="html-italic">p</span>  &lt;  0.0001 compared to the HFD group in (<b>A</b>,<b>H</b>,<b>J</b>). <span class="html-italic">n</span>  =  5–6 for all groups. Ns, not significant. ANOVA, analysis of variance; BAT, brown adipose tissue; eWAT, epididymal white adipose tissue; GABA, Gamma-aminobutyric acid; GTT, glucose tolerance test; HFD, high-fat diet; ITT, insulin tolerance tests; iWAT inguinal white adipose tissue; SD, standard diet.</p>
Full article ">Figure 2
<p>GABA treatment promotes energy consumption through iWAT beiging. (<b>A</b>) Representative H&amp;E staining in the iWAT samples (Scale bars 100 μm). (<b>B</b>) Area of lipid droplets (*1000 μm<sup>2</sup>) was estimated using the Image J software. (<b>C</b>–<b>G</b>) Expression of thermogenic genes (including Ucp1, Prdm16, Cidea, Pgc1α, and Mct1) in the iWAT. (<b>H</b>) Representative UCP1 IHC staining of the iWAT (Scale bars, 50 μm). <span class="html-italic">n</span>  =  5–6 for all groups. β-actin as PCR reference gene in (<b>C</b>–<b>G</b>). Data are presented as mean ± standard deviation and were analyzed using a one-way or two-way ANOVA. * <span class="html-italic">p</span>  &lt;  0.05 and **** <span class="html-italic">p</span>  &lt;  0.0001. ANOVA, analysis of variance; iWAT inguinal white adipose tissue.</p>
Full article ">Figure 3
<p>GABA treatment reduces fat inflammation and restored intestinal structure in HFD mice. (<b>A</b>–<b>D</b>) mRNA expression of inflammation-related factors (including F4/80, TNFα, IL 1β, and IL 10) in the iWAT. (<b>E</b>) Representative CD86 IHC staining of the iWAT (Scale bars, 50 μm). (<b>F</b>,<b>I</b>) Representative H&amp;E staining in the small intestine and colon samples (Scale bars, 100 μm). (<b>G</b>,<b>H</b>) Villus height and crypt depth of the small intestine. (<b>J</b>) Representative ZO-1 IHC staining of the colon (Scale bars, 100 μm). (<b>K</b>) PAS staining of the colon (Scale bars, 50 μm). <span class="html-italic">n</span>  =  5 for all groups. Data are represented as means ± standard deviation and were analyzed by one-way ANOVA. * <span class="html-italic">p</span>  &lt;  0.05, ** <span class="html-italic">p</span>  &lt;  0.01, *** <span class="html-italic">p</span>  &lt;  0.001 and **** <span class="html-italic">p</span>  &lt;  0.0001. H&amp;E, hematoxylin and eosin; IHC, immunohistochemistry; iWAT, inguinal white adipose tissue; PAS, periodic acid Schiff.</p>
Full article ">Figure 4
<p>GABA modulates the composition of gut microbiota. (<b>A</b>) Relative abundance of intestinal flora in the four experimental groups. (<b>B</b>) Phylum level analyses were based on OTU classification; “others” indicates OTUs that were not classified at the phylum level. (<b>C</b>,<b>D</b>) Gut microbiota richness, as indicated by the Chao1 and Shannon indices. (<b>E</b>) NMDS plots for metabolomics analysis (Stress = 0.09). (<b>F</b>) The <span class="html-italic">t</span>-test of differential species abundance under each level between the SD group and HFD group. (<b>G</b>) Comparison of microbial variations, using LEfSe (LDA Effect Size) analysis, between the HFD and HFD+GABA groups. (<b>H</b>) Relative abundance of Tax4Fun function annotations. LEfSe, linear discriminant analysis effect size. <span class="html-italic">n</span>  =  4–6 for all groups. OTU, operational taxonomic unit. * <span class="html-italic">p</span>  &lt;  0.05 and ** <span class="html-italic">p</span>  &lt;  0.01.</p>
Full article ">Figure 5
<p>Gut microbiota mediates the effect of GABA on the beiging of iWAT. Intestinal microbiota-free HFD-fed mice were treated daily with the vehicle or GABA for 4 weeks. (<b>A</b>) Flow chart of animal experiments. (<b>B</b>,<b>C</b>) Gut microbiota richness, as indicated by the Chao1 and Shannon indices. (<b>D</b>) Body weight after the experiment. (<b>E</b>,<b>F</b>) GTT curve and the AUC analysis. (<b>G</b>,<b>H</b>) ITT curve and the AUC analysis. (<b>I</b>) Tissue weights of iWAT. (<b>J</b>) Expression of thermogenic genes (including Ucp1, Prdm16, Cidea, Pgc1α, Mct1, and Dio2) in the iWAT. Abx, antibiotics. <span class="html-italic">n</span>  =  5–7 for all groups. Data are represented as means ± standard deviation and were analyzed by one-way or two-way ANOVA. Ns, not significant. ** <span class="html-italic">p</span>  &lt;  0.01, *** <span class="html-italic">p</span>  &lt;  0.001 and **** <span class="html-italic">p</span>  &lt;  0.0001. GABA, Gamma-aminobutyric acid; HFD, high-fat diet; NMDS, non-metric multidimensional scaling; OTU, operational taxonomic unit.</p>
Full article ">Figure 6
<p>FMT is sufficient to induce the beiging of iWAT caused by GABA. Intestinal microbiota-free HFD-fed mice were colonized by fecal matter from either HFD-fed mice or GABA-treated mice for one week. (<b>A</b>) Body weight after the FMT experiment. (<b>B</b>) GTT curve of the HFD/FMT and GABA/FMT groups. (<b>C</b>,<b>D</b>) UCP1 protein expression in the iWAT was detected via immunoblot analysis. β-actin was used as the internal reference. (<b>E</b>) Relative mRNA expression of thermogenic genes in the HFD/FMT and GABA/FMT groups. (<b>F</b>) Histograms of LDA scores identifying taxa differentially represented between the HFD/FMT and GABA/FMT groups (LDA score &gt; 2). Data are presented as mean ± standard deviation and were analyzed using a two-tailed Student’s <span class="html-italic">t</span>-test or two-way ANOVA. ** <span class="html-italic">p</span>  &lt;  0.01, *** <span class="html-italic">p</span>  &lt;  0.001 and **** <span class="html-italic">p</span>  &lt;  0.0001 compared to HFD/FMT group. ANOVA, analysis of variance; FMT, fecal microbiota transplantation; GABA, Gamma-aminobutyric acid; GTT, glucose tolerance test; HFD, high fat diet; iWAT inguinal white adipose tissue; LDA, linear discriminant analysis.</p>
Full article ">Figure 7
<p>Bacterial metabolites affect the regulation of GABA on fat beige. (<b>A</b>,<b>B</b>) OPLS-DA score plot of metabolite profiles. (<b>C</b>) Volcano plot of metabolites between the HFD and HFD+GABA groups. The green dots represent downregulated differentially expressed metabolites, the red dots represent upregulated differentially expressed metabolites, and the gray ones represent detected but not significant metabolites. (<b>D</b>) Histograms of LDA scores identifying the taxa differentially represented between HFD and HFD+GABA groups (LDA score &gt; 2). (<b>E</b>) Statistics of KEGG enrichment and classification. (<b>F</b>) Correlation diagram between the top 20 differential metabolites and intestinal microbes in the HFD and HFD+GABA groups. Each row represents a type of microorganism, and each column represents a metabolite. The red ellipse indicates a positive correlation, and the blue ellipse indicates a negative correlation. The greater the absolute value of the correlation, the thinner the ellipse. A blank grid indicates a significant <span class="html-italic">p</span>-value &gt; 0.05. (<b>G</b>,<b>H</b>) Spearman correlation analysis between 3-hydroxybutyrate and Ruminococcus (<b>G</b>) and PGF2α and Akkermansia (<b>H</b>). OPLS-DA, orthogonal partial least squares discriminant analysis.</p>
Full article ">
17 pages, 2385 KiB  
Article
The Effect of Nerolidol Renal Dysfunction following Ischemia–Reperfusion Injury in the Rat
by Fayez T. Hammad, Suhail Al-Salam, Rahaf Ahmad, Javed Yasin, Awwab F. Hammad, Jasmine Abdul Rasheed and Loay Lubbad
Nutrients 2023, 15(2), 455; https://doi.org/10.3390/nu15020455 - 15 Jan 2023
Cited by 5 | Viewed by 2240
Abstract
Efforts to decrease the deleterious effects of renal ischemia–reperfusion injury (IRI) are ongoing. Recently, there has been increasing interest in using natural phytochemical compounds as alternative remedies in several diseases. Nerolidol is a natural product extracted from plants with floral odors and has [...] Read more.
Efforts to decrease the deleterious effects of renal ischemia–reperfusion injury (IRI) are ongoing. Recently, there has been increasing interest in using natural phytochemical compounds as alternative remedies in several diseases. Nerolidol is a natural product extracted from plants with floral odors and has been proven to be effective for the treatment of some conditions. We investigated the effect of nerolidol in a rat model of renal IRI. Nerolidol was dissolved in a vehicle and administered orally as single daily dose of 200 mg/kg for 5 days prior to IRI and continued for 3 days post IRI. G-Sham (n = 10) underwent sham surgery, whereas G-IRI (n = 10) and G-IRI/NR (n = 10) underwent bilateral warm renal ischemia for 30 min and received the vehicle/nerolidol, respectively. Renal functions and histological changes were assessed before starting the medication, just prior to IRI and 3 days after IRI. Nerolidol significantly attenuated the alterations in serum creatinine and urea, creatinine clearance, urinary albumin and the urinary albumin–creatinine ratio. Nerolidol also significantly attenuated the alterations in markers of kidney injury; proinflammatory, profibrotic and apoptotic cytokines; oxidative stress markers; and histological changes. We conclude that nerolidol has a renoprotective effect on IRI-induced renal dysfunction. These findings might have clinical implications. Full article
(This article belongs to the Section Nutrition and Public Health)
Show Figures

Figure 1

Figure 1
<p>Schematic presentation of the study plan showing interventions in all groups.</p>
Full article ">Figure 2
<p>Gene expression of two markers of acute renal injury (KIM-1 and NGAL) in all groups. Values represent mean ± SEM.</p>
Full article ">Figure 3
<p>Gene expression of transforming growth factor-β (TGF-β1), tumor necrosis factor-α (TNF-α) and plasminogen activator inhibitor-1 (PAI-1) in all groups. Values represent mean ± SEM.</p>
Full article ">Figure 4
<p>Gene expression of the proinflammatory cytokines interleukin 6 (IL-6) and interleukin 1 beta (IL-1β) in all groups. Values represent mean ± SEM.</p>
Full article ">Figure 5
<p>Gene expression of the proapoptotic p53 gene and procollagen-1 (COLA-1) in all groups. Values represent mean ± SEM.</p>
Full article ">Figure 6
<p>Gene expression of the antioxidant enzymes glutathione peroxidase (GPX-1) and glutathione-disulfide reductase (GSR) in all groups. Values represent mean ± SEM.</p>
Full article ">Figure 7
<p>Kidney tissue concentration of gene expression of the glutathione (GSH) and malondialdehyde (MDA, TBARS) measured by ELISA. Values represent mean ± SEM.</p>
Full article ">Figure 8
<p>Histological features in all the experimental groups. (<b>A</b>,<b>B</b>) The kidneys in G-Sham showed normal architecture and histology. (<b>C</b>,<b>D</b>) Histological features in the G-IRI with diffuse acute tubular necrosis (thin arrow) and intratubular necrotic material and secretions (arrowhead). (<b>E</b>,<b>F</b>) Histological features in G-IRI/NR with mild acute tubular necrosis and tubular dilation (thin arrow) and intratubular secretion (arrowhead).</p>
Full article ">
18 pages, 5485 KiB  
Article
Protective Effect of Vegan Microbiota on Liver Steatosis Is Conveyed by Dietary Fiber: Implications for Fecal Microbiota Transfer Therapy
by Nikola Daskova, Marie Heczkova, Istvan Modos, Jaromir Hradecky, Tomas Hudcovic, Marek Kuzma, Helena Pelantova, Irena Buskova, Eva Sticova, David Funda, Jaroslav Golias, Barbora Drabonova, Jarmila Jarkovska, Maria Kralova, Ivana Cibulkova, Jan Gojda and Monika Cahova
Nutrients 2023, 15(2), 454; https://doi.org/10.3390/nu15020454 - 15 Jan 2023
Cited by 2 | Viewed by 3485
Abstract
Fecal microbiota transfer may serve as a therapeutic tool for treating obesity and related disorders but currently, there is no consensus regarding the optimal donor characteristics. We studied how microbiota from vegan donors, who exhibit a low incidence of non-communicable diseases, impact on [...] Read more.
Fecal microbiota transfer may serve as a therapeutic tool for treating obesity and related disorders but currently, there is no consensus regarding the optimal donor characteristics. We studied how microbiota from vegan donors, who exhibit a low incidence of non-communicable diseases, impact on metabolic effects of an obesogenic diet and the potential role of dietary inulin in mediating these effects. Ex-germ-free animals were colonized with human vegan microbiota and fed a standard or Western-type diet (WD) with or without inulin supplementation. Despite the colonization with vegan microbiota, WD induced excessive weight gain, impaired glucose metabolism, insulin resistance, and liver steatosis. However, supplementation with inulin reversed steatosis and improved glucose homeostasis. In contrast, inulin did not affect WD-induced metabolic changes in non-humanized conventional mice. In vegan microbiota-colonized mice, inulin supplementation resulted in a significant change in gut microbiota composition and its metabolic performance, inducing the shift from proteolytic towards saccharolytic fermentation (decrease of sulfur-containing compounds, increase of SCFA). We found that (i) vegan microbiota alone does not protect against adverse effects of WD; and (ii) supplementation with inulin reversed steatosis and normalized glucose metabolism. This phenomenon is associated with the shift in microbiota composition and accentuation of saccharolytic fermentation at the expense of proteolytic fermentation. Full article
(This article belongs to the Special Issue Nutritional Regulation of Insulin Resistance and Lipid Metabolism)
Show Figures

Figure 1

Figure 1
<p>Experimental design. CV, conventional mice; GF, germ-free; OGTT, oral glucose tolerance test. (<b>A</b>), timepoint A (prior diet intervention); (<b>B</b>), timepoint B (after diet intervention).</p>
Full article ">Figure 2
<p>Effect of the diet and inulin supplementation on body composition and glucose homeostasis. (<b>A</b>): total body weight (g); (<b>B</b>): liver weight (g); (<b>C</b>): liver TAG content (nmol TAG. mg<sup>−1</sup> protein); (<b>D</b>): fasting C-peptide concentration in plasma (pg. L<sup>−1</sup>); (<b>E</b>): C-peptide concentration in plasma at 30 min of OGTT (pg. L<sup>−1</sup>); (<b>F</b>): glycemia at 30 min of OGTT (mM); (<b>G</b>): histological assessment of liver slices. Data are shown as box plots (first and third quartile, median) with whiskers (min, max). OGTT, oral glucose tolerance test; CV, conventional mice; VG, humanized mice; SD, standard diet; SD + I, standard diet supplemented with inulin; WD, Western diet; WD + I, western diet supplemented with inulin. <sup>†</sup> <span class="html-italic">p</span> ˂ 0.05, <sup>††</sup> <span class="html-italic">p</span> ˂ 0.01 CV_WD vs CV_SD; <sup>x</sup> <span class="html-italic">p</span> ˂ 0.05 CV_WD vs CV_SD + I; <sup>‡</sup> <span class="html-italic">p</span> ˂ 0.05, <sup>‡‡</sup> <span class="html-italic">p</span> ˂ 0.01, <sup>‡‡‡</sup> <span class="html-italic">p</span> ˂ 0.001 VG_WD vs VG_SD; <sup>•</sup> <span class="html-italic">p</span> ˂ 0.05, <sup>••</sup> <span class="html-italic">p</span> ˂ 0.01, <sup>•••</sup> <span class="html-italic">p</span> ˂ 0.001 VG_WD vs VG_SD + I; <sup>#</sup> <span class="html-italic">p</span> ˂ 0.05, <sup>##</sup> <span class="html-italic">p</span> ˂ 0.01 VG_WD + I vs VG_WD; <sup>++</sup> <span class="html-italic">p</span> ˂ 0.01 VG_WD vs CV_WD; ٭ <span class="html-italic">p</span> ˂ 0.05 VG_WD + I vs CV_WD + I.</p>
Full article ">Figure 3
<p>Cecum microbiota composition in humanized mice. (<b>A</b>,<b>C</b>): The 2D PCA scores plot. The explained variance of each component is included in the axis labels. The large points represent the centroids of each group. (<b>B</b>,<b>D</b>): Held-out characteristics of Lasso logistic regression model. (<b>E</b>,<b>F</b>): Alpha diversity of cecum microbiota assessed as Shannon index. ~~~ <span class="html-italic">p</span> ˂ 0.001 VG_SD + I vs VG_SD; °°° <span class="html-italic">p</span> ˂ 0.001 VG_WD + I vs VG_SD; <sup>#</sup> <span class="html-italic">p</span> ˂ 0.05, <span class="html-italic">p</span> VG_WD + I vs VG_WD. Data are shown as box plots (1st and 3rd quartile, median) with whiskers (min, max).</p>
Full article ">Figure 4
<p>Bacterial taxa significantly affected by diet and/or inulin. (<b>A</b>): Taxa affected by inulin only in combination with SD (adj_pval VG_SD + I vs VG_SD ˂ 0.1); (<b>B</b>): Taxa affected by inulin only in combination with WD (adj_pval VG_WD + I vs VG_SD ˂ 0.1); (<b>C</b>): Taxa affected by inulin independently on the diet (adj_pval VG_SD + I vs VG_SD ˂ 0.1 and adj_pval VG_WD + I vs VG_SD ˂ 0.1); (<b>D</b>): Taxa affected only by WD (adj_pval VG_WD vs VG_SD ˂ 0.1); (<b>E</b>) Taxa affected by both WD and inulin: additive effect (adj_pval VG_WD vs VG_SD ˂ 0.1 and adj_pval VG_WD + I vs VG_WD ˂ 0.1, effect size VG_WD vs VG_SD and VG_WD vs VG_WD + I in the same direction); (<b>F</b>) Taxa affected by both WD and inulin: opposing effect (adj_pval VG_WD vs VG_SD ˂ 0.1 and adj_pval VG_WD + I vs VG_WD ˂ 0.1, effect size VG_WD vs VG_SD and VG_WD vs VG_WD + I in the opposite direction). The taxa were selected according to the outcome of the univariable statistic test (Kruskal–Wallis), omnibus adj_pval ˂ 0.1. The graph shows the effect size calculated as log2FC. adj_pval, adjusted <span class="html-italic">p</span>-value; FC, fold change.</p>
Full article ">Figure 5
<p>Cecum VOCs composition. (<b>A</b>) The 2D PCA scores plot. The explained variance of each component is included in the axis labels. The large points represent the centroids of each group. (<b>B</b>) Held-out characteristics of Lasso logistic regression model.</p>
Full article ">Figure 6
<p>VOCs significantly affected by diet and/or inulin. (<b>A</b>): VOCs affected by inulin only in combination with SD (adj_pval VG_SD + I vs VG_SD ˂ 0.1); (<b>B</b>): VOCs affected by inulin only in combination with WD (adj_pval VG_WD + I vs VG_SD ˂ 0.1); (<b>C</b>): VOCs affected by inulin independently on the diet (adj_pval VG_SD + I vs VG_SD ˂ 0.1 and adj_pval VG_WD + I vs VG_SD ˂ 0.1); (<b>D</b>): VOCs affected by both WD and inulin: additive effect (adj_pval VG_WD vs VG_SD ˂ 0.1 and adj_pval VG_WD + I vs VG_WD ˂ 0.1, effect size VG_WD vs VG_SD and VG_WD vs VG_WD + I in the same direction); (<b>E</b>): VOCs affected by both WD and inulin: opposing effect (adj_pval VG_WD vs VG_SD ˂ 0.1 and adj_pval VG_WD + I vs VG_WD ˂ 0.1, effect size VG_WD vs VG_SD and VG_WD vs VG_WD + I in the opposite direction). The VOCs were selected according to the outcome of the univariable statistic test (Kruskal-Wallis), omnibus adj_pval ˂ 0.1. The graph shows the effect size calculated as log2FC. adj_pval, adjusted <span class="html-italic">p</span>-value; FC, fold change; RI, retention index.</p>
Full article ">Figure 7
<p>Correlation network between liver TAG content and cecum microbiome (<b>A</b>) and VOCs (<b>B</b>) composition. The edge width and color are proportional to the value of the correlation (red: positive; blue: negative). RI, retention index.</p>
Full article ">
18 pages, 3238 KiB  
Article
Biobran/MGN-3, an Arabinoxylan Rice Bran, Protects against Severe Acute Respiratory Syndrome Coronavirus 2 (SARS-CoV-2): An In Vitro and In Silico Study
by Mamdooh Ghoneum, Shaymaa Abdulmalek and Hewida H. Fadel
Nutrients 2023, 15(2), 453; https://doi.org/10.3390/nu15020453 - 15 Jan 2023
Cited by 9 | Viewed by 3561
Abstract
Severe Acute Respiratory Syndrome Coronavirus 2 (SARS-CoV-2), the causative agent of Coronavirus Disease 2019 (COVID-19), poses a serious global public health threat for which there is currently no satisfactory treatment. This study examines the efficacy of Biobran/MGN-3 against SARS-CoV-2. Biobran is an arabinoxylan [...] Read more.
Severe Acute Respiratory Syndrome Coronavirus 2 (SARS-CoV-2), the causative agent of Coronavirus Disease 2019 (COVID-19), poses a serious global public health threat for which there is currently no satisfactory treatment. This study examines the efficacy of Biobran/MGN-3 against SARS-CoV-2. Biobran is an arabinoxylan rice bran that has been shown to significantly inhibit the related influenza virus in geriatric subjects. Here, Biobran’s anti-SARS-CoV-2 activity was assessed using MTT and plaque reduction assays, RT-PCR, ELISA techniques, and measurements of SARS-CoV-2-related gene expression and protein levels. For Vero E6 cells infected with SARS-CoV-2, Biobran reduced the viral load by 91.9% at a dose of 100 μg/mL, it reduced viral counts (PFU/mL) by 90.6% at 50 μg/mL, and it exhibited a significant selectivity index (EC50/IC50) of 22.5. In addition, Biobran at 10 μg/mL inhibited papain-like proteinase (PLpro) by 87% and ACE2 SARS-CoV-2 S-protein RBD by 90.5%, and it significantly suppressed SARS-CoV-2 gene expression, down-regulating E-gene and RdRp gene expression by 93% each at a dose of 50 μg/mL and inhibiting the E-protein by 91.3%. An in silico docking study was also performed to examine the protein–protein interaction (PPI) between SARS-CoV-2 RBD and DC-SIGN as well as between serine carboxypeptidase and papain-like protease PLpro. Serine carboxypeptidase, an active ingredient in Biobran, was found to interfere with the binding of SARS-CoV-2 to its receptor DC-SIGN on Vero cells, thus preventing the cell entry of SARS-CoV-2. In addition, it impairs the viral replication cycle by binding to PLpro. We conclude that Biobran possesses potent antiviral activity against SARS-CoV-2 in vitro and suggest that Biobran may be able to prevent SARS-CoV-2 infection. This warrants further investigation in clinical trials. Full article
(This article belongs to the Section Carbohydrates)
Show Figures

Graphical abstract

Graphical abstract
Full article ">Figure 1
<p>The RBD domain of the SARS-CoV-2 spike protein binds with DC-SIGN. (<b>a</b>) A 3D image for position (model 3) showing the molecular docking of the RBD domain of the SARS-CoV-2 spike protein (chain A) (cyan) to DC-SIGN CRD (light orange); (<b>b</b>) a 3D image showing protein–protein interaction (PPI) via binding of R346 F347 A348 S349 V350 Y351 A352 N354 R355 Y449 N450 L452 E465 R466 D467 I468 T470 E471 I472 G482 E484 F490 L492 Q493 S494 of chain A of the RBD domain of the SARS-CoV-2 spike protein (cyan) to C253 H254 P255 C256 P257 W258 E259 A381 of chain B and L252 C253 H254 P255 C256 W258 R275 E286 V287 A382 C384 of chain E of DC-SIGN CRD (light orange), using a cut-off of 4.0 Å; (<b>c</b>) a 3D image showing the binding sites between R346 F347 A348 N354 Y351 T470 G482 E484 F490 of the RBD domain of the SARS-CoV-2 spike protein (cyan) and C253 C256 of chain B and C253 C256 C384 of chain E of DC-SIGN CRD (light orange) using a cut-off of 3.5 Å.</p>
Full article ">Figure 2
<p>Ferulic acid binds to DC-SIGN: 3D image of Ferulic showing the hydrogen donor and acceptor (left) and 2D image showing the types of bonds and distances (right) between Ferulic and DC-SIGN where Ferulic can bind to Arg266, Thr273, Gln297, and Arg300 of DC-SIGN via hydrogen bonds with distances of 3.14 Å, 3.45 Å, 3.52 Å, and 3.30 Å, respectively. In addition, Ferulic can bind to Cys268 with carbon HBs with a distance of 4.42 Å, and Ferulic can bind to Arg300 via 2 alkyl bonds with distances of 3.58 Å and 5.00 Å.</p>
Full article ">Figure 3
<p>Serine carboxypeptidase binding to DC-SIGN: 3D image showing the interface between the whole structure of serine carboxypeptidase (cyan) and DC-SIGN (pink) (left side), with multiple binding sites between F191 W193 H195 G196 T337 S368 P371 Y373 I376 R393 G422 of serine carboxypeptidase (cyan) binding to L252 C253 H254 C256 W259 V287 G288 A289 K379 S380 A381 A382 S383 and C384 of DC-SIGN (pink) (right side) (cut-off: 4.0 Å).</p>
Full article ">Figure 4
<p>Serine carboxypeptidase binding to DC-SIGN: 3D image showing multiple binding sites between serine carboxypeptidase (cyan) and DC-SIGN (pink), including I197 S199 D200 E232 N235 Y242 P244 N247 E259 S368 W369 of serine carboxypeptidase (cyan) binding to L252 C253 W258 E259 E298 F302 L305 N349 N350 V351 G352 of DC-SIGN (pink) (right side) and a focus on binding between S368 W369 of serine carboxypeptidase (cyan) and N349 N350 V351 G352 of DC-SIGN (pink) (left side) (cut-off: 4.0 Å).</p>
Full article ">Figure 5
<p>Ferulic acid docking PLpro by binding to Thr74 via a hydrogen bond (4.26 Å), binding to Asp76 via a carbon HB (3.42 Å), binding to Pro59 (4.22 Å, 4.58 Å), Arg65 (5.24 Å), Ala68 (5.89 Å), and Phe79 (5.52 Å), and Leu80 (3.92 Å) via alkyl bonds, and binding to Thr75 via a pi-sigma bond (4.61 Å). A 3D image showing hydrogen donor and acceptor (left) and a 2D image showing types of bonds and distances (right).</p>
Full article ">Figure 6
<p>Serine carboxypeptidase can bind to PLpro: 3D images showing (<b>a</b>) the PPI between the whole structure of serine carboxypeptidase (cyan) and that of PLpro (pink); (<b>b</b>) the key residues in the interface between H183, R318, G351 A352 W369 D375 Q375A E376 V377 of serine carboxypeptidase (cyan) and N156 Q174 V188 C189 C192 G193 Q194 Q195 T197 L199 E203 C224 T225 C226 of PLpro (pink) in SARS-CoV-2 using a cut-off of 4.0 Å; and (<b>c</b>) the binding sites between D375 of chain B8 of serine carboxypeptidase and C224 and C226 of PLpro as well as those between Q375 of chain B9 of serine carboxypeptidase and C189 and C192 of PLpro using a cut-off of 3.5 Å.</p>
Full article ">Figure 7
<p>Serine carboxypeptidase can bind to PLpro: 3D images showing (<b>a</b>) the PPI between the whole structure of serine carboxypeptidase (cyan) and that of PLpro (pink); (<b>b</b>) the interface between E272 R273 Q285 N291 T293 G294 A295 M296 N297 Y298 T299 of serine carboxypeptidase (cyan) and L162 G163 D164 V165 R166 E167 M208 T225 A246 P247 Y264 Y268 Q269 Y273 of PLpro (pink) in SARS-CoV-2 using a cut-off of 4.0 Å; and (<b>c</b>) the binding sites between T293 and Y298 of serine carboxypeptidase and the key residues of PLpro (D164 and Y268) using a cut-off of 3.5 Å.</p>
Full article ">
16 pages, 1131 KiB  
Review
Plant-Based Meat Alternatives: Technological, Nutritional, Environmental, Market, and Social Challenges and Opportunities
by Giulia Andreani, Giovanni Sogari, Alessandra Marti, Federico Froldi, Hans Dagevos and Daniela Martini
Nutrients 2023, 15(2), 452; https://doi.org/10.3390/nu15020452 - 15 Jan 2023
Cited by 75 | Viewed by 25987
Abstract
There is a growing awareness that fostering the transition toward plant-based diets with reduced meat consumption levels is essential to alleviating the detrimental impacts of the food system on the planet and to improving human health and animal welfare. The reduction in average [...] Read more.
There is a growing awareness that fostering the transition toward plant-based diets with reduced meat consumption levels is essential to alleviating the detrimental impacts of the food system on the planet and to improving human health and animal welfare. The reduction in average meat intake may be reached via many possible ways, one possibility being the increased consumption of plant-based meat alternatives (PBMAs). For this reason, in recent years, hundreds of products have been launched on the market with sensory attributes (i.e., taste, texture, appearance, and smell) similar to their animal counterparts; however, these products have often a long list of ingredients and their nutritional values are very different from animal meat. The present review aims to highlight the main opportunities and challenges related to the production and consumption of PBMAs through an interdisciplinary approach. Aspects related to the production technology, nutritional profiles, potential impacts on health and the environment, and the current market and consumer acceptance of PBMAs are discussed. Focusing on the growing literature on this topic, this review will also highlight research gaps related to PBMAs that should be considered in the future, possibly through the collaboration of different stakeholders that can support the transition toward sustainable plant-based diets. Full article
(This article belongs to the Special Issue Beyond Meat: Alternative Sources of Proteins to Feed the World)
Show Figures

Figure 1

Figure 1
<p>Number of PBMAs’ launches (<span class="html-italic">n</span> = 4965—green bar), new varieties (<span class="html-italic">n</span> = 1910—orange bar), new products (<span class="html-italic">n</span> = 1822—gray bar), new packaging (<span class="html-italic">n</span> = 1822—yellow bar), re-launches (<span class="html-italic">n</span> = 386—blue bar), and new formulations (<span class="html-italic">n</span> = 58—black bar) launched worldwide over the past three years (2019–2021). Abbreviations: PBMAs, plant-based meat alternatives.</p>
Full article ">Figure 2
<p>Twelve most active countries in PBMA launches over the past three years (2019–2021). Note: Each bar represents the total number of PBMAs’ launches between January 2019 and December 2021. Abbreviations: PBMAs, plant-based meat alternatives.</p>
Full article ">Figure 3
<p>Food category distribution of PBMAs launched over the past three years (2019–2021). Abbreviations: PBMAs, plant-based meat alternatives.</p>
Full article ">Figure 4
<p>Word cloud of the top 20 claims employed in PBMA products launched over the past three years (2019–2021). Abbreviations: PBMA, plant-based meat alternative. Note: A word cloud is a visual representation of word frequency and value. The “Social Media” claim indicates the presence on the packaging of a logo/claim to entice consumers to join the company’s social media community and follow its channel/website.</p>
Full article ">
24 pages, 1476 KiB  
Article
Susceptibility to COVID-19 Nutrition Misinformation and Eating Behavior Change during Lockdowns: An International Web-Based Survey
by Maria A. Ruani and Michael J. Reiss
Nutrients 2023, 15(2), 451; https://doi.org/10.3390/nu15020451 - 14 Jan 2023
Cited by 5 | Viewed by 5166
Abstract
To understand the susceptibility to nutrition-health misinformation related to preventing, treating, or mitigating the risk of COVID-19 during the initial lockdowns around the world, the present international web-based survey study (15 April–15 May 2020) gauged participants’ (n = 3707) level of nutrition-health [...] Read more.
To understand the susceptibility to nutrition-health misinformation related to preventing, treating, or mitigating the risk of COVID-19 during the initial lockdowns around the world, the present international web-based survey study (15 April–15 May 2020) gauged participants’ (n = 3707) level of nutrition-health misinformation discernment by presenting them with 25 statements (including unfounded or unproven claims circulated at the time), alongside the influence of information sources of varying quality on the frequency of changes in their eating behavior and the extent of misinformation held, depending on the source used for such changes. Results revealed widespread misinformation about food, eating, and health practices related to COVID-19, with the 25 statements put to participants receiving up to 43% misinformed answers (e.g., ‘It is safe to eat fruits and vegetables that have been washed with soap or diluted bleach’). Whereas higher quality information sources (nutrition scientists, nutrition professionals) had the biggest influence on eating behavior change, we found greater misinformation susceptibility when relying on poor quality sources for changing diet. Appropriate discernment of misinformation was weakest amongst participants who more frequently changed their eating behavior because of information from poor quality sources, suggesting disparities in the health risks/safety of the changes performed. Full article
(This article belongs to the Special Issue Nutrition within and beyond Corona Virus)
Show Figures

Graphical abstract

Graphical abstract
Full article ">Figure 1
<p>Comparison of dietary change frequencies per source between participants with increased (‘yes’) and no increased (‘no’) interest in nutrition since the start of the COVID-19 pandemic.</p>
Full article ">Figure 2
<p>Proportion of COVID-19 nutrition misinformation held in relation to different information sources used for subsequent eating behavior change.</p>
Full article ">
16 pages, 2488 KiB  
Article
The Effect of an Essential Oil Blend on Growth Performance, Intestinal Health, and Microbiota in Early-Weaned Piglets
by Yirui Shao, Qingyun Peng, Yuliang Wu, Changfeng Peng, Shanshan Wang, Lijun Zou, Ming Qi, Can Peng, Hongnan Liu, Rui Li, Xia Xiong and Yulong Yin
Nutrients 2023, 15(2), 450; https://doi.org/10.3390/nu15020450 - 14 Jan 2023
Cited by 7 | Viewed by 3423
Abstract
Essential oils (EO) are promising feed additives for their antibacterial, antioxidant, and immune-enhancing abilities with low toxicity. Carvacrol, thymol, and cinnamaldehyde are commonly used to synthesize EO. However, few studies focus on combining these three EO in early-weaned piglets. In the present study, [...] Read more.
Essential oils (EO) are promising feed additives for their antibacterial, antioxidant, and immune-enhancing abilities with low toxicity. Carvacrol, thymol, and cinnamaldehyde are commonly used to synthesize EO. However, few studies focus on combining these three EO in early-weaned piglets. In the present study, 24 piglets weaned at 21 d of age were randomly divided into 2 groups (6 replicate pens per group, 2 piglets per pen). The piglets were fed a basal diet (the control group) and a basal diet supplemented with 400 mg/kg EO (a blend consisting of carvacrol, thymol, and cinnamaldehyde, the EO group) for 28 days. At the end of the experiment, one piglet per pen was randomly chosen to be sacrificed. Growth performance, hematology, plasma biochemical indices, antioxidant capacity, intestinal epithelial development and immunity, colonic volatile fatty acids (VFA), and microbiota were determined. The results indicated that the diet supplemented with EO significantly improved average daily feed intake (ADFI, p < 0.01) and average daily gain (ADG, p < 0.05) in the day 0 to 28 period. EO supplementation led to a significant decrease in plasma lysozyme (p < 0.05) and cortisol levels (p < 0.01). Additionally, EO significantly promoted jejunal goblet cells in the villus, jejunal mucosa ZO-1 mRNA expression, ileal villus height, and ileal villus height/crypt depth ratio in piglets (p < 0.05). The ileal mucosal TLR4 and NFκB p-p65/p65 protein expression were significantly inhibited in the EO group (p < 0.05). Colonic digesta microbiota analysis revealed that bacteria involving the Erysipelotrichaceae family, Holdemanella genus, Phascolarctobacterium genus, and Vibrio genus were enriched in the EO group. In conclusion, these findings indicate that the EO blend improves ADG and ADFI in the day 0 to 28 period, as well as intestinal epithelial development and intestinal immunity in early-weaned piglets, which provides a theoretical basis for the combined use of EO in weaned piglets. Full article
(This article belongs to the Special Issue Dietary Fiber, Gut Microbiota and Metabolic Disorder)
Show Figures

Figure 1

Figure 1
<p>Effect of EO on piglet diarrhea score (<b>A</b>) and organ index (<b>B</b>–<b>E</b>). Data are presented as means ± SEM (<span class="html-italic">n</span> = 6). EO, essential oil.</p>
Full article ">Figure 2
<p>Effect of EO on piglet plasma biochemical index (<b>A</b>–<b>D</b>) and antioxidant capacity (<b>E</b>–<b>H</b>). Data are presented as means ± SEM (<span class="html-italic">n</span> = 6). * <span class="html-italic">p</span> &lt; 0.05. EO: essential oil; TG: triglycerides; LDL-C: low density lipoprotein cholesterol; HDL-C: high density lipoprotein cholesterol; EO: essential oil; MDA: malondialdehyde; T-AOC: total antioxidant capacity; SOD: superoxide dismutase; GSH-Px: glutathione peroxidase.</p>
Full article ">Figure 3
<p>Effect of EO on piglet plasma immunity parameters. (<b>A</b>–<b>C</b>) Effect of EO on piglet plasma immunoglobulin. (<b>D</b>) Effect of EO on piglet plasma cortisol level. (<b>E</b>) Effect of EO on piglet plasma lysozyme level. (<b>F</b>–<b>H</b>) Effect of EO on piglet blood lymphocyte subset. Data are presented as means ± SEM (<span class="html-italic">n</span> = 6). * <span class="html-italic">p</span> &lt; 0.05, ** <span class="html-italic">p</span> &lt; 0.01. EO: essential oil; IgA: immunoglobulin A; IgM: immunoglobulin M; IgG: immunoglobulin G.</p>
Full article ">Figure 4
<p>Effect of EO on piglet jejunal and ileal epithelial morphological structure. (<b>A</b>) Representative hematoxylin–eosin-stained image of piglet jejunum and ileum (scale bar: 100 μm). (<b>B</b>–<b>D</b>) Villus height, crypt depth, and villus height/crypt depth ratio of piglet jejunum and ileum. (<b>E</b>) The number of goblet cells per villus in the jejunum and ileum. (<b>F</b>) The number of goblet cells per crypt in jejunum and ileum. Data are presented as means ± SEM (<span class="html-italic">n</span> = 6). * <span class="html-italic">p</span> &lt; 0.05. EO: essential oil.</p>
Full article ">Figure 5
<p>Effect of EO on relative mRNA expression of genes involved in barrier function in piglet jejunal and ileal mucosa (<b>A</b>–<b>F</b>). Data are presented as means ± SEM (<span class="html-italic">n</span> = 6), * <span class="html-italic">p</span> &lt; 0.05. EO: essential oil. <span class="html-italic">MUC1</span>: mucin-1; <span class="html-italic">MUC2</span>: mucin-2; <span class="html-italic">MUC4</span>: mucin-4; <span class="html-italic">ZO-1</span>: zonula occludens-1.</p>
Full article ">Figure 6
<p>Effect of EO on relative protein expression of genes involved in NF-κB pathway in ileal mucosa (<b>A</b>–<b>D</b>). Data are presented as means ± SEM (<span class="html-italic">n</span> = 4), * <span class="html-italic">p</span> &lt; 0.05. EO: essential oil; p-IKK: phosphor-IκB kinase; IKK: IκB kinase; p-p65: phosphor-nuclear factor kappa B; p65: nuclear factor kappa B; TLR4: toll-like receptor 4.</p>
Full article ">Figure 7
<p>Effect of EO on VFA concentrations in piglet colonic content (<b>A</b>–<b>I</b>). Data are presented as means ± SEM (<span class="html-italic">n</span> = 6). EO: essential oil; VFA: volatile fatty acid.</p>
Full article ">Figure 8
<p>Effect of EO on microbial α-diversity and β-diversity in piglet colonic content. (<b>A</b>) Effect of EO on microbial α-diversity. (<b>B</b>,<b>C</b>) PCoA and NMDS analyses. (<b>D</b>) UPGMA analysis. (<b>E</b>) LEfSe analysis. Data are presented as means ± SEM (<span class="html-italic">n</span> = 6). EO: essential oil; PCoA: principal coordinate analysis; NMDS: non-metric multidimensional scaling; UPGMA: unweighted pair-group method with arithmetic mean; LEfSe: linear discriminant analysis effect size.</p>
Full article ">
33 pages, 2354 KiB  
Review
Neuroprotective Effects of Agri-Food By-Products Rich in Phenolic Compounds
by Alejandro Rojas-García, Álvaro Fernández-Ochoa, María de la Luz Cádiz-Gurrea, David Arráez-Román and Antonio Segura-Carretero
Nutrients 2023, 15(2), 449; https://doi.org/10.3390/nu15020449 - 14 Jan 2023
Cited by 15 | Viewed by 4317
Abstract
Neurodegenerative diseases are known for their wide range of harmful conditions related to progressive cell damage, nervous system connections and neuronal death. These pathologies promote the loss of essential motor and cognitive functions, such as mobility, learning and sensation. Neurodegeneration affects millions of [...] Read more.
Neurodegenerative diseases are known for their wide range of harmful conditions related to progressive cell damage, nervous system connections and neuronal death. These pathologies promote the loss of essential motor and cognitive functions, such as mobility, learning and sensation. Neurodegeneration affects millions of people worldwide, and no integral cure has been created yet. Here, bioactive compounds have been proven to exert numerous beneficial effects due to their remarkable bioactivity, so they could be considered as great options for the development of new neuroprotective strategies. Phenolic bioactives have been reported to be found in edible part of plants; however, over the last years, a large amount of research has focused on the phenolic richness that plant by-products possess, which sometimes even exceeds the content in the pulp. Thus, their possible application as an emergent neuroprotective technique could also be considered as an optimal strategy to revalorize these agricultural residues (those originated from plant processing). This review aims to summarize main triggers of neurodegeneration, revise the state of the art in plant extracts and their role in avoiding neurodegeneration and discuss how their main phenolic compounds could exert their neuroprotective effects. For this purpose, a diverse search of studies has been conducted, gathering a large number of papers where by-products were used as strong sources of phenolic compounds for their neuroprotective properties. Finally, although a lack of investigation is quite remarkable and greatly limits the use of these compounds, phenolics remain attractive for research into new multifactorial anti-neurodegenerative nutraceuticals. Full article
(This article belongs to the Special Issue Neuroprotection with Bioactive Compounds)
Show Figures

Figure 1

Figure 1
<p>Flowchart summarizing the literature selection process according to PRISMA methodology.</p>
Full article ">Figure 2
<p>Different key biological mechanisms associated with the neurodegeneration implicated in the progression and pathogenesis of AD and PD, as well as the main cellular processes involved. ↑: increase; ↓: decrease.</p>
Full article ">Figure 3
<p>Neuroprotective molecular targets of EGCG in amyloidogenic pathologies.</p>
Full article ">Figure 4
<p>Main mechanisms through which plant extracts and their phenolic compounds exert their neuroprotective effects, as well as key cell processes involved. Finally, several references in which this information is demonstrated [<a href="#B30-nutrients-15-00449" class="html-bibr">30</a>,<a href="#B34-nutrients-15-00449" class="html-bibr">34</a>,<a href="#B41-nutrients-15-00449" class="html-bibr">41</a>,<a href="#B48-nutrients-15-00449" class="html-bibr">48</a>,<a href="#B57-nutrients-15-00449" class="html-bibr">57</a>,<a href="#B58-nutrients-15-00449" class="html-bibr">58</a>,<a href="#B75-nutrients-15-00449" class="html-bibr">75</a>,<a href="#B79-nutrients-15-00449" class="html-bibr">79</a>,<a href="#B80-nutrients-15-00449" class="html-bibr">80</a>,<a href="#B81-nutrients-15-00449" class="html-bibr">81</a>,<a href="#B85-nutrients-15-00449" class="html-bibr">85</a>,<a href="#B86-nutrients-15-00449" class="html-bibr">86</a>,<a href="#B87-nutrients-15-00449" class="html-bibr">87</a>,<a href="#B88-nutrients-15-00449" class="html-bibr">88</a>,<a href="#B89-nutrients-15-00449" class="html-bibr">89</a>,<a href="#B92-nutrients-15-00449" class="html-bibr">92</a>,<a href="#B93-nutrients-15-00449" class="html-bibr">93</a>,<a href="#B95-nutrients-15-00449" class="html-bibr">95</a>,<a href="#B102-nutrients-15-00449" class="html-bibr">102</a>,<a href="#B108-nutrients-15-00449" class="html-bibr">108</a>,<a href="#B110-nutrients-15-00449" class="html-bibr">110</a>,<a href="#B115-nutrients-15-00449" class="html-bibr">115</a>,<a href="#B123-nutrients-15-00449" class="html-bibr">123</a>,<a href="#B130-nutrients-15-00449" class="html-bibr">130</a>,<a href="#B131-nutrients-15-00449" class="html-bibr">131</a>].</p>
Full article ">
12 pages, 781 KiB  
Article
Body-Fat-Percentile Curves for Thai Children and Adolescents
by Maneerat Puwanant, Ladda Mo-Suwan, Somchit Jaruratanasirikul and Wipa Jessadapakorn
Nutrients 2023, 15(2), 448; https://doi.org/10.3390/nu15020448 - 14 Jan 2023
Cited by 3 | Viewed by 2610
Abstract
This study aimed to generate sex-specific percentile curves for the percentage of body fat (PBF) in Thai children using a bioelectrical impedance analysis (BIA). The secondary objective of this study was to determine the association between body fat and other anthropometric measurements. A [...] Read more.
This study aimed to generate sex-specific percentile curves for the percentage of body fat (PBF) in Thai children using a bioelectrical impedance analysis (BIA). The secondary objective of this study was to determine the association between body fat and other anthropometric measurements. A cross-sectional study was conducted on 3455 Thai school children aged 6–18 years. The body-fat contents were measured using BIA. Smoothed percentile curves of PBF were derived using a scatter plot with a smooth curve fitted by the Loess method. The correlations between the body fat and the anthropometric measurements were assessed using the Spearman’s rank correlation. The 50th and lower body-fat-percentile curves of the boys slowly increased until age 12, after which they slightly decreased until age 15 and then slightly increased until age 18. In the higher boys’ percentiles, the body fat sharply increased until age 11 and then decreased until age 18. In the girls, the PBF percentiles increased steadily from 6 to 18 years. The body-mass index was strongly correlated with PBF and fat mass in both sexes. The waist-to-height ratios showed strong correlations with PBF and fat mass in the boys but were moderate in the girls. The use of PBF percentile curves can be an additional metric for the evaluation of obesity in Thai children. Full article
Show Figures

Figure 1

Figure 1
<p>Flow chart of the study process, wherein participants were randomly selected by probability-proportional-to-size sampling.</p>
Full article ">Figure 2
<p>Percentile curves for percentage body fat of (<b>a</b>) boys and (<b>b</b>) girls.</p>
Full article ">Figure 3
<p>The 3rd, 50th and 97th percentiles for percentage body fat according to age in Thai, Turkish, Colombian and Portuguese (<b>a</b>) boys and (<b>b</b>) girls. Abbreviations: TH, Thai; TR, Turkish; CO, Colombian; PT, Portuguese.</p>
Full article ">
Previous Issue
Back to TopTop