[go: up one dir, main page]

Next Issue
Volume 16, October
Previous Issue
Volume 16, August
 
 
ijms-logo

Journal Browser

Journal Browser

Int. J. Mol. Sci., Volume 16, Issue 9 (September 2015) – 165 articles , Pages 20100-23126

Cover Story: 
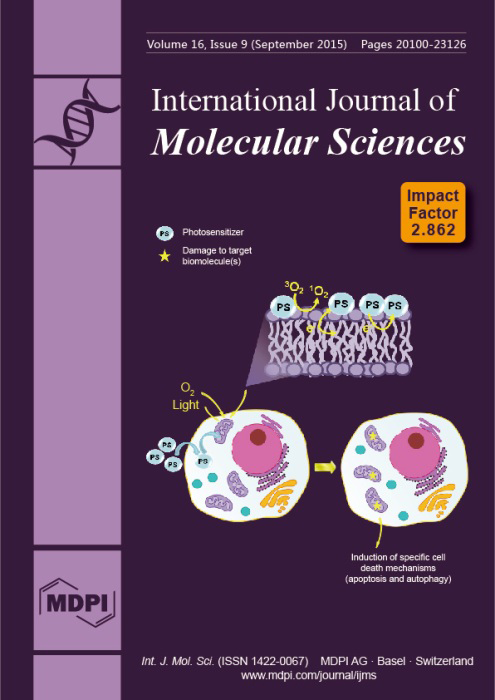
Photosensitizers (PS) are the main agents for Photodynamic therapy (PDT). Still, photosensitizers are usually considered simple singlet oxygen generators. By analyzing the molecular and biological processes taking place during and after photosensitization, we aim to suggest alternatives for achieving high-efficiency PDT protocols. We submit that PSs should be designed to induce specific mechanisms of cell death and researchers should first consider tissue and intracellular localization, instead of trying to maximize the generation of reactive species. View the article.
  • Issues are regarded as officially published after their release is announced to the table of contents alert mailing list.
  • You may sign up for e-mail alerts to receive table of contents of newly released issues.
  • PDF is the official format for papers published in both, html and pdf forms. To view the papers in pdf format, click on the "PDF Full-text" link, and use the free Adobe Reader to open them.
Order results
Result details
Section
Select all
Export citation of selected articles as:
1075 KiB  
Article
Multiple Factors Drive Replicating Strand Composition Bias in Bacterial Genomes
by Hai-Long Zhao, Zhong-Kui Xia, Fa-Zhan Zhang, Yuan-Nong Ye and Feng-Biao Guo
Int. J. Mol. Sci. 2015, 16(9), 23111-23126; https://doi.org/10.3390/ijms160923111 - 23 Sep 2015
Cited by 9 | Viewed by 5184
Abstract
Composition bias from Chargaff’s second parity rule (PR2) has long been found in sequenced genomes, and is believed to relate strongly with the replication process in microbial genomes. However, some disagreement on the underlying reason for strand composition bias remains. We performed an [...] Read more.
Composition bias from Chargaff’s second parity rule (PR2) has long been found in sequenced genomes, and is believed to relate strongly with the replication process in microbial genomes. However, some disagreement on the underlying reason for strand composition bias remains. We performed an integrative analysis of various genomic features that might influence composition bias using a large-scale dataset of 1111 genomes. Our results indicate (1) the bias was stronger in obligate intracellular bacteria than in other free-living species (p-value = 0.0305); (2) Fusobacteria and Firmicutes had the highest average bias among the 24 microbial phyla analyzed; (3) the strength of selected codon usage bias and generation times were not observably related to strand composition bias (p-value = 0.3247); (4) significant negative relationships were found between GC content, genome size, rearrangement frequency, Clusters of Orthologous Groups (COG) functional subcategories A, C, I, Q, and composition bias (p-values < 1.0 × 10?8); (5) gene density and COG functional subcategories D, F, J, L, and V were positively related with composition bias (p-value < 2.2 × 10?16); and (6) gene density made the most important contribution to composition bias, indicating transcriptional bias was associated strongly with strand composition bias. Therefore, strand composition bias was found to be influenced by multiple factors with varying weights. Full article
(This article belongs to the Special Issue Microbial Genomics and Metabolomics)
Show Figures

Figure 1

Figure 1
<p>Box-and-whiskers represent for composition bias of all genomes, which sorted into 24 phyla. The bottom and top of box mark the first and third quartiles, and the band inside the box denotes the median. The ends of the whiskers in each plot represent the lowest datum still within 1.5 IQR (interquartile range) of the lower quartiles, and the highest datum still within 1.5 IQR of the upper quartiles. Any data not included between the whiskers is plotted as an outlier with a small circle. This boxplot graphically depict the different bias distribution in respective phylum.</p>
Full article ">Figure 2
<p>The phylogenetic tree of the 24 phyla. <span class="html-italic">N</span> means the total strains in a phylum, <span class="html-italic">M</span> means the average <span class="html-italic">Score<sub>composition bias</sub></span> in a phylum.</p>
Full article ">
840 KiB  
Review
Rational Protein Engineering Guided by Deep Mutational Scanning
by HyeonSeok Shin and Byung-Kwan Cho
Int. J. Mol. Sci. 2015, 16(9), 23094-23110; https://doi.org/10.3390/ijms160923094 - 23 Sep 2015
Cited by 12 | Viewed by 9183
Abstract
Sequence–function relationship in a protein is commonly determined by the three-dimensional protein structure followed by various biochemical experiments. However, with the explosive increase in the number of genome sequences, facilitated by recent advances in sequencing technology, the gap between protein sequences available and [...] Read more.
Sequence–function relationship in a protein is commonly determined by the three-dimensional protein structure followed by various biochemical experiments. However, with the explosive increase in the number of genome sequences, facilitated by recent advances in sequencing technology, the gap between protein sequences available and three-dimensional structures is rapidly widening. A recently developed method termed deep mutational scanning explores the functional phenotype of thousands of mutants via massive sequencing. Coupled with a highly efficient screening system, this approach assesses the phenotypic changes made by the substitution of each amino acid sequence that constitutes a protein. Such an informational resource provides the functional role of each amino acid sequence, thereby providing sufficient rationale for selecting target residues for protein engineering. Here, we discuss the current applications of deep mutational scanning and consider experimental design. Full article
(This article belongs to the Special Issue Protein Engineering)
Show Figures

Figure 1

Figure 1
<p>Schematics of the simplified overview of deep mutational scanning: (<b>a</b>) generation of the initial protein variant library for target protein sequences; (<b>b</b>) screening for protein variants with desired properties; and (<b>c</b>) sequencing and quantification of the mutations under different selection pressures. The asterisks indicate mutations at a specific site and the stacked asterisks indicate enrichment of mutations in specific sites after quantification. For example, mutation counts at different sites are shown with <b>*</b> positions carrying a mutation, <b>**</b> positions carrying two mutations, and <b>****</b> positions carrying four mutations.</p>
Full article ">Figure 2
<p>Schematics of the simplified screening systems of the (<b>a</b>) conventional strategy of directed evolution, where iterative assays are performed until a desired phenotype appears; and (<b>b</b>) deep mutational scanning, where the protein variants are screened to a simpler selection pressure. The different phenotypes of the protein variants are shown by gradient of green colored wells. The desirable phenotypes are shown by darker green colored wells and loss of function is shown by white colored wells.</p>
Full article ">Figure 3
<p>Methods to rectify sequencing errors: (<b>a</b>) a scheme of how paired end reads with short sequencing reads allow the detection of sequencing errors; (<b>b</b>) schematic showing the concept of the duplex sequencing method; (<b>c</b>) how the consensus sequence is used to remove sequencing errors, adapted by permission from the Macmillan Publishers Ltd: <span class="html-italic">Nature Protocols</span> [<a href="#B61-ijms-16-23094" class="html-bibr">61</a>], copyright 2014. The black bar indicate the target inserts reads for sequencing and the orange and dark blue colored bars at end of the insert reads indicate sequencing adaptors; the yellow and light blue bars indicate the randomized duplex tags; and (<b>d</b>) Hypothetical mapping of the mutation frequency for variant library sequencing. The red line indicates the sequencing error rate of the ampicillin gene used as the cutoff. The asterisks indicate mutations and the orange and blue bars at the ends of the reads indicate the sequencing adaptors.</p>
Full article ">Figure 4
<p>(<b>a</b>) A hypothetical mutational map generated to show mutation frequency at each position; Part of the mutational map showing (<b>b</b>) extremely tolerant and critical residues to mutations; (<b>c</b>) tolerant to hydrophobic mutations and (<b>d</b>) tolerant to hydrophilic mutations. The x-axis indicates the protein residues and the y-axis indicates the possible amino acids. The color key represents the mutation frequency at each amino acid. The white color indicates that no mutation was found. The blue color indicates mutation frequency of loss-of-function variants and red color indicates mutation frequency of function-retained variants. The stop codon is indicated by <b>*</b>.</p>
Full article ">
1087 KiB  
Review
Critical Issues in the Study of Magnesium Transport Systems and Magnesium Deficiency Symptoms in Plants
by Natsuko I. Kobayashi and Keitaro Tanoi
Int. J. Mol. Sci. 2015, 16(9), 23076-23093; https://doi.org/10.3390/ijms160923076 - 23 Sep 2015
Cited by 57 | Viewed by 11616
Abstract
Magnesium (Mg) is the second most abundant cation in living cells. Over 300 enzymes are known to be Mg-dependent, and changes in the Mg concentration significantly affects the membrane potential. As Mg becomes deficient, starch accumulation and chlorosis, bridged by the generation of [...] Read more.
Magnesium (Mg) is the second most abundant cation in living cells. Over 300 enzymes are known to be Mg-dependent, and changes in the Mg concentration significantly affects the membrane potential. As Mg becomes deficient, starch accumulation and chlorosis, bridged by the generation of reactive oxygen species, are commonly found in Mg-deficient young mature leaves. These defects further cause the inhibition of photosynthesis and finally decrease the biomass. Recently, transcriptome analysis has indicated the transcriptinal downregulation of chlorophyll apparatus at the earlier stages of Mg deficiency, and also the potential involvement of complicated networks relating to hormonal signaling and circadian oscillation. However, the processes of the common symptoms as well as the networks between Mg deficiency and signaling are not yet fully understood. Here, for the purpose of defining the missing pieces, several problems are considered and explained by providing an introduction to recent reports on physiological and transcriptional responses to Mg deficiency. In addition, it has long been unclear whether the Mg deficiency response involves the modulation of Mg2+ transport system. In this review, the current status of research on Mg2+ transport and the relating transporters are also summarized. Especially, the rapid progress in physiological characterization of the plant MRS2 gene family as well as the fundamental investigation about the molecular mechanism of the action of bacterial CorA proteins are described. Full article
Show Figures

Graphical abstract

Graphical abstract
Full article ">Figure 1
<p>RRIS (real-time radioisotope imaging system [<a href="#B89-ijms-16-23076" class="html-bibr">89</a>,<a href="#B90-ijms-16-23076" class="html-bibr">90</a>]) captured each radionuclide image at 5 and 15 h of root absorption of (<b>a</b>) <sup>28</sup>Mg; (<b>b</b>) <sup>32</sup>P phosphate. <span class="html-italic">Arabidopsis thaliana</span> (Columbia 0) was grown with nutrient solution for 43 days under a light/dark cycle of 16 h/8 h at 22 °C.</p>
Full article ">
2102 KiB  
Article
Reference Genes in the Pathosystem Phakopsora pachyrhizi/ Soybean Suitable for Normalization in Transcript Profiling
by Daniela Hirschburger, Manuel Müller, Ralf T. Voegele and Tobias Link
Int. J. Mol. Sci. 2015, 16(9), 23057-23075; https://doi.org/10.3390/ijms160923057 - 23 Sep 2015
Cited by 16 | Viewed by 6900
Abstract
Phakopsora pachyrhizi is a devastating pathogen on soybean, endangering soybean production worldwide. Use of Host Induced Gene Silencing (HIGS) and the study of effector proteins could provide novel strategies for pathogen control. For both approaches quantification of transcript abundance by RT-qPCR is essential. [...] Read more.
Phakopsora pachyrhizi is a devastating pathogen on soybean, endangering soybean production worldwide. Use of Host Induced Gene Silencing (HIGS) and the study of effector proteins could provide novel strategies for pathogen control. For both approaches quantification of transcript abundance by RT-qPCR is essential. Suitable stable reference genes for normalization are indispensable to obtain accurate RT-qPCR results. According to the Minimum Information for Publication of Quantitative Real-Time PCR Experiments (MIQE) guidelines and using algorithms geNorm and NormFinder we tested candidate reference genes from P. pachyrhizi and Glycine max for their suitability in normalization of transcript levels throughout the infection process. For P. pachyrhizi we recommend a combination of CytB and PDK or GAPDH for in planta experiments. Gene expression during in vitro stages and over the whole infection process was found to be highly unstable. Here, RPS14 and UbcE2 are ranked best by geNorm and NormFinder. Alternatively CytB that has the smallest Cq range (Cq: quantification cycle) could be used. We recommend specification of gene expression relative to the germ tube stage rather than to the resting urediospore stage. For studies omitting the resting spore and the appressorium stages a combination of Elf3 and RPS9, or PKD and GAPDH should be used. For normalization of soybean genes during rust infection Ukn2 and cons7 are recommended. Full article
(This article belongs to the Special Issue Plant Microbe Interaction)
Show Figures

Figure 1

Figure 1
<p>Variation of <span class="html-italic">C</span>q values for <span class="html-italic">P. pachyrhizi</span> candidate reference genes between samples (vertical axis: <span class="html-italic">C</span>q). (<b>a</b>) Average and standard deviation of <span class="html-italic">C</span>q values for every sample; (<b>b</b>–<b>d</b>) box plots representing the range of <span class="html-italic">C</span>q values; (<b>b</b>) <span class="html-italic">in vitro</span> samples; (<b>c</b>) <span class="html-italic">in planta</span> samples; (<b>d</b>) all samples. For better representation of RNA abundance the <span class="html-italic">C</span>q values were corrected for primer efficiency: <span class="html-italic">C</span>q<sub>corr</sub> = lg<sub>2</sub> ((2 × e)<span class="html-italic"><sup>C</sup></span><sup>q</sup>).</p>
Full article ">Figure 2
<p>Ranking of <span class="html-italic">P. pachyrhizi</span> candidate reference genes for stability by the algorithms geNorm (<b>a</b>,<b>c</b>,<b>e</b>,<b>g</b>) and NormFinder (<b>b</b>,<b>d</b>,<b>f</b>,<b>h</b>). Analyses performed for (<b>a</b>,<b>b</b>) <span class="html-italic">in vitro</span> samples; (<b>c</b>,<b>d</b>) <span class="html-italic">in planta</span> samples; (<b>e</b>,<b>f</b>) all samples; (<b>g</b>,<b>h</b>) <span class="html-italic">in planta</span> samples together with germ tube (gt) sample; M-value: gene-stability measure calculated by geNorm—the arithmetic mean of all pairwise variations of the respective gene against all other genes between the different samples; standard deviation (here): stability measure calculated by NormFinder based on group wise comparisons.</p>
Full article ">Figure 3
<p>Variation of <span class="html-italic">C</span>q values for <span class="html-italic">G. max</span> candidate reference genes between samples (vertical axis: <span class="html-italic">C</span>q). (<b>a</b>) Average and standard deviation of <span class="html-italic">C</span>q values for every sample; (<b>b</b>) box plots representing the range of <span class="html-italic">C</span>q values; For better representation of RNA abundance the <span class="html-italic">C</span>q values were corrected for primer efficiency: <span class="html-italic">C</span>q<sub>corr</sub> = lg<sub>2</sub> ((2 × e)<span class="html-italic"><sup>C</sup></span><sup>q</sup>).</p>
Full article ">Figure 4
<p>Ranking of <span class="html-italic">G. max</span> candidate reference genes for stability by the algorithms geNorm (<b>a</b>) and NormFinder (<b>b</b>).</p>
Full article ">Figure 5
<p>Number of reference genes recommended by NormFinder (optimal number marked red); (<b>a</b>) for <span class="html-italic">P. pachyrhizi in vitro</span> structures; (<b>b</b>) for <span class="html-italic">P. pachyrhizi in planta</span> structures; (<b>c</b>) for all <span class="html-italic">P. pachyrhizi</span> samples; (<b>d</b>) for all <span class="html-italic">P. pachyrhizi</span> samples excepting spore and appressorium; (<b>e</b>) for <span class="html-italic">G. max</span>.</p>
Full article ">
2530 KiB  
Review
Early Pregnancy Biomarkers in Pre-Eclampsia: A Systematic Review and Meta-Analysis
by Pensée Wu, Caroline Van den Berg, Zarko Alfirevic, Shaughn O’Brien, Maria Röthlisberger, Philip Newton Baker, Louise C. Kenny, Karolina Kublickiene and Johannes J. Duvekot
Int. J. Mol. Sci. 2015, 16(9), 23035-23056; https://doi.org/10.3390/ijms160923035 - 23 Sep 2015
Cited by 92 | Viewed by 16838
Abstract
Pre-eclampsia (PE) complicates 2%–8% of all pregnancies and is an important cause of perinatal morbidity and mortality worldwide. In order to reduce these complications and to develop possible treatment modalities, it is important to identify women at risk of developing PE. The use [...] Read more.
Pre-eclampsia (PE) complicates 2%–8% of all pregnancies and is an important cause of perinatal morbidity and mortality worldwide. In order to reduce these complications and to develop possible treatment modalities, it is important to identify women at risk of developing PE. The use of biomarkers in early pregnancy would allow appropriate stratification into high and low risk pregnancies for the purpose of defining surveillance in pregnancy and to administer interventions. We used formal methods for a systematic review and meta-analyses to assess the accuracy of all biomarkers that have been evaluated so far during the first and early second trimester of pregnancy to predict PE. We found low predictive values using individual biomarkers which included a disintegrin and metalloprotease 12 (ADAM-12), inhibin-A, pregnancy associated plasma protein A (PAPP-A), placental growth factor (PlGF) and placental protein 13 (PP-13). The pooled sensitivity of all single biomarkers was 0.40 (95% CI 0.39–0.41) at a false positive rate of 10%. The area under the Summary of Receiver Operating Characteristics Curve (SROC) was 0.786 (SE 0.02). When a combination model was used, the predictive value improved to an area under the SROC of 0.893 (SE 0.03). In conclusion, although there are multiple potential biomarkers for PE their efficacy has been inconsistent and comparisons are difficult because of heterogeneity between different studies. Therefore, there is an urgent need for high quality, large-scale multicentre research in biomarkers for PE so that the best predictive marker(s) can be identified in order to improve the management of women destined to develop PE. Full article
(This article belongs to the Special Issue Prediction, Diagnostics and Prevention of Pregnancy Complications)
Show Figures

Figure 1

Figure 1
<p>Flowchart of selection process. GA: gestational age.</p>
Full article ">Figure 2
<p>QUADAS-2 Quality score. QUADAS: Quality Assessment of Diagnostic Accuracy Studies.</p>
Full article ">Figure 3
<p>Distribution of studied laboratory biomarkers (<span class="html-italic">n</span> = 401) in included articles (<span class="html-italic">n</span> = 147). PlGF: Placental growth factor; PAPP-A: Pregnancy associated plasma protein A; PP-13: Placental protein 13; ADAM-12: a disintegrin and metalloprotease 12; CRP: C-reactive protein; sFlt: Soluble fms-like tyrosine kinase-1; MMP-9: Matrix metallopeptidase 9; TNF-R1: Tumour-necrosis factor receptor-1; VEGF: Vascular endothelial growth factor; VEGFR: Vascular endothelial growth factor receptor; SHBG: Sex hormone-binding globulin.</p>
Full article ">Figure 4
<p>Meta-analysis of single laboratory biomarkers in PE (both EOPE and LOPE). Legend: (<b>1</b>) activin-A; (<b>2</b>) ADAM-12; (<b>3</b>) α fetoprotein; (<b>4</b>) α-1-macroglobulin; (<b>5</b>) anti-CD63 (GP53, lysosomal secretion); (<b>6</b>) chemerin; (<b>7</b>) C-reactive protein; (<b>8</b>) cystatin C; (<b>9</b>) endoglin; (<b>10</b>) E-selectin; (<b>11</b>) fetal DNA; (<b>12</b>) fetal hemoglobin (ratio); (<b>13</b>) fibronectin; (<b>14</b>) free β-hCG; (<b>15</b>) free leptin index; (<b>16</b>) GRP78 (glucose regulated protein) ratio C-term/full length; (<b>17</b>) Htr-A1 (High-Temperature Requirement A1); (<b>18</b>) inhibin-A; (<b>19</b>) NGAL (neutrophil gelatinase-associated lipocalin); (<b>20</b>) PAPP-A; (<b>21</b>) PBMC (peripheral blood mononuclear cell) miRNA; (<b>22</b>) PlGF; (<b>23</b>) PP-13; (<b>24</b>) P-selectin; (<b>25</b>) soluble endoglin; (<b>26</b>) sFLT/PlGF ratio; (<b>27</b>) sFlt-1; (<b>28</b>) sVEGFR-1 (vascular endothelial growth factor); (<b>29</b>) TNF-R1 (tumor necrosis factor receptor). PE: Pre-eclampsia; EOPE: early-onset PE; LOPE: late-onset PE.</p>
Full article ">Figure 5
<p>Summary of receiver operating characteristics curve of single laboratory biomarkers in PE (both EOPE and LOPE).</p>
Full article ">Figure 6
<p>Meta-analysis of combination of laboratory and clinical makers in PE (both EOPE and LOPE). Legend: (<b>1</b>) PAPP-A, AFP, uE3, hCG (total or free β), inhibin-A; (<b>2</b>) mean PI + activin-A; (<b>3</b>) PlGF/sEng-ratio; (<b>4</b>) PAPP-A and free leptin index; (<b>5</b>) PP-13, UA-PI, AIx-75 (measure of arterial stiffness); (<b>6</b>) cystatin-C, CRP, uterine artery resistance index; (<b>7</b>) HbF ratio and A1M; (<b>8</b>) activin-A, inhibin-A, PlGF and UA-PI; (<b>9</b>) African American race, systolic blood pressure, BMI, education level, ADAM12, PAPP-A, PlGF; (<b>10</b>) BMI, education mother and HtrA1; (<b>11</b>) maternal characteristics, PlGF; (<b>12</b>) maternal characteristics, ADAM12; (<b>13</b>) maternal characteristics, PlGF; (<b>14</b>) sFLT-1, PlGF, PAPP-A, inhibin A, BMI, MAP; (<b>15</b>) PlGF, MAP, BMI, high fruit intake, uterine artery Doppler resistive index (UA-RI) * validation cohort; (<b>16</b>) PlGF, MAP, BMI, high fruit intake, UA-RI * training cohort.</p>
Full article ">Figure 7
<p>Summary of receiver operating characteristics curve of combination model of laboratory and makers in PE (both EOPE and LOPE).</p>
Full article ">
3209 KiB  
Review
Quo Vadis Clozapine? A Bibliometric Study of 45 Years of Research in International Context
by Francisco López-Muñoz, Javier Sanz-Fuentenebro, Gabriel Rubio, Pilar García-García and Cecilio Álamo
Int. J. Mol. Sci. 2015, 16(9), 23012-23034; https://doi.org/10.3390/ijms160923012 - 23 Sep 2015
Cited by 19 | Viewed by 8102
Abstract
We have carried out a bibliometric study about the international scientific publications on clozapine. We have used the EMBASE and MEDLINE databases, and we applied bibliometric indicators of production, as Price’s Law on the increase of scientific literature. We also calculated the participation [...] Read more.
We have carried out a bibliometric study about the international scientific publications on clozapine. We have used the EMBASE and MEDLINE databases, and we applied bibliometric indicators of production, as Price’s Law on the increase of scientific literature. We also calculated the participation index (PI) of the different countries. The bibliometric data have also been correlated with some social and health data from the 12 most productive countries in biomedicine and health sciences. In addition, 5607 original documents dealing with clozapine, published between 1970 and 2013, were downloaded. Our results state non-fulfilment of Price’s Law, with scientific production on clozapine showing linear growth (r = 0.8691, vs. r = 0.8478 after exponential adjustment). Seven of the 12 journals with the highest numbers of publications on clozapine have an Impact Factor > 2. Among the countries generating clozapine research, the most prominent is the USA (PI = 24.32), followed by the UK (PI = 6.27) and Germany (PI = 5.40). The differences among countries on clozapine research are significantly related to economic variables linked to research. The scientific interest in clozapine remains remarkable, although after the application of bibliometric indicators of production, a saturation point is evident in the growth of scientific literature on this topic. Full article
(This article belongs to the Special Issue Antipsychotics)
Show Figures

Figure 1

Figure 1
<p>Growth of scientific production on clozapine. A linear adjustment of the data was carried out, and a fitting to an exponential curve, in order to check whether production follows Price’s law of exponential growth. Linear adjustment: <span class="html-italic">y</span> = 7.0338<span class="html-italic">x</span> − 30.828 (<span class="html-italic">r</span><sup>2</sup> = 0.7554). Exponential adjustment: <span class="html-italic">y</span> = 6.7016<span class="html-italic">e</span><sup>0.0999<span class="html-italic">x</span></sup> (<span class="html-italic">r</span><sup>2</sup> = 0.7188).</p>
Full article ">Figure 2
<p>Growth of scientific production on other AADs. A linear adjustment of the data was carried out, and a fitting to an exponential curve, in order to check whether production follows Price’s Law of exponential growth. Linear adjustment: <span class="html-italic">y =</span> 38.718<span class="html-italic">x −</span> 315.56 (<span class="html-italic">r</span><sup>2</sup> = 0.8641). Exponential adjustment: <span class="html-italic">y =</span> 1.6462<span class="html-italic">e</span><sup>0.2191<span class="html-italic">x</span></sup> (<span class="html-italic">r</span><sup>2</sup> = 0.9176). AADs (atypical antipsychotic drugs: Risperidone, olanzapine, ziprasidone, quetiapine, sertindole, aripiprazole, paliperidone, amisulpride, zotepine, asenapine, iloperidone, lurasidone, perospirone and blonanserin).</p>
Full article ">Figure 3
<p>Evolution of the accumulated scientific production on atypical antipsychotic drugs.</p>
Full article ">Figure 4
<p>Distribution of publications on atypical antipsychotic drugs and current trend lines in relation to the scientific production from the group “clozapine” and the group “other AADs”. AADs (atypical antipsychotic drugs: Risperidone, olanzapine, ziprasidone, quetiapine, sertindole, aripiprazole, paliperidone, amisulpride, zotepine, asenapine, iloperidone, lurasidone, perospirone and blonanserin).</p>
Full article ">Figure 5
<p>Evolution of documents on clozapine and other individual AADs.</p>
Full article ">Figure 6
<p>Differences in the type of publication used between the group “clozapine” and the group “other AADs”. The sections are sorted moving clockwise: Article (61%, 57%); Letter (17%, 15%); Conference document (8%, 15%); Review (6%, 7%); Others (8%, 6%).</p>
Full article ">Figure 7
<p>Relationship between production of scientific literature on clozapine and other atypical antipsychotic drugs (AADs) and total production in the field of psychiatry and neurology in the world’s 12 most productive countries in biomedicine and health sciences. PI (Participation Index); AADs (Atypical antipsychotic drugs: Risperidone, olanzapine, ziprasidone, quetiapine, sertindole, aripiprazole, paliperidone, amisulpride, zotepine, asenapine, iloperidone, lurasidone, perospirone and blonanserin).</p>
Full article ">Figure 8
<p>Relationship between production of scientific literature on clozapine and <span class="html-italic">per capita</span> gross domestic product in the world’s 12 most productive countries in biomedicine and health sciences. We have excluded the USA from the graph in order to give a clearer impression of the rest of the countries. GDP (Gross Domestic Product), PI (Participation Index). The economic data were obtained from the website of the World Health Organization (Available online: <a href="http://www.who.int/country/es/" target="_blank">http://www.who.int/country/es/</a>). Economic data are expressed in international dollars (data 2012). JAP: Japan; SPA: Spain; NET: Netherlands; AUS: Australia; FRA: France; CAN: Canada; GER: Germany; CHI: China; UK: United Kingdom; IND: India.</p>
Full article ">Figure 9
<p><span class="html-italic">Per capita</span> Health Expenditure and relationship between production of scientific literature on clozapine and <span class="html-italic">per capita</span> health expenditure and gross domestic expenditure on research and development, in the world’s 12 most productive countries in biomedicine and health sciences. PI (Participation Index). Total Health Expenditure <span class="html-italic">per capita</span> Purchasing Power Parity (PPP) Int. $ (data WHO 2011) (Available online: <a href="http://www.who.int/country/es/" target="_blank">http://www.who.int/country/es/</a>). Gross Domestic Expenditure on research and development (%). Data OECD 2011, except Australia and Japan (data 2010) and China (data 2009) (Available online: <a href="http://www.oecd-ilibrary.org/science-and-technology/gross-domestic-expenditure-on-r-d_2075843x-table1" target="_blank">http://www.oecd-ilibrary.org/science-and-technology/gross-domestic-expenditure-on-r-d_2075843x-table1</a>).</p>
Full article ">
9388 KiB  
Article
Modulation of the PI3K/Akt Pathway and Bcl-2 Family Proteins Involved in Chicken’s Tubular Apoptosis Induced by Nickel Chloride (NiCl2)
by Hongrui Guo, Hengmin Cui, Xi Peng, Jing Fang, Zhicai Zuo, Junliang Deng, Xun Wang, Bangyuan Wu, Kejie Chen and Jie Deng
Int. J. Mol. Sci. 2015, 16(9), 22989-23011; https://doi.org/10.3390/ijms160922989 - 23 Sep 2015
Cited by 50 | Viewed by 8287
Abstract
Exposure of people and animals to environments highly polluted with nickel (Ni) can cause pathologic effects. Ni compounds can induce apoptosis, but the mechanism and the pathway of Ni compounds-induced apoptosis are unclear. We evaluated the alterations of apoptosis, mitochondrial membrane potential (MMP), [...] Read more.
Exposure of people and animals to environments highly polluted with nickel (Ni) can cause pathologic effects. Ni compounds can induce apoptosis, but the mechanism and the pathway of Ni compounds-induced apoptosis are unclear. We evaluated the alterations of apoptosis, mitochondrial membrane potential (MMP), phosphoinositide-3-kinase (PI3K)/serine-threonine kinase (Akt) pathway, and Bcl-2 family proteins induced by nickel chloride (NiCl2) in the kidneys of broiler chickens, using flow cytometry, terminal deoxynucleotidyl transferase 2?-deoxyuridine 5?-triphosphate dUTP nick end-labeling (TUNEL), immunohistochemstry and quantitative real-time polymerase chain reaction (qRT-PCR). We found that dietary NiCl2 in excess of 300 mg/kg resulted in a significant increase in apoptosis, which was associated with decrease in MMP, and increase in apoptosis inducing factor (AIF) and endonuclease G (EndoG) protein and mRNA expression. Concurrently, NiCl2 inhibited the PI3K/Akt pathway, which was characterized by decreasing PI3K, Akt1 and Akt2 mRNA expression levels. NiCl2 also reduced the protein and mRNA expression of anti-apoptotic Bcl-2 and Bcl-xL and increased the protein and mRNA expression of pro-apoptotic Bax and Bak. These results show that NiCl2 causes mitochondrial-mediated apoptosis by disruption of MMP and increased expression of AIF and EndoG mRNA and protein, and that the underlying mechanism of MMP loss involves the Bcl-2 family proteins modulation and PI3K/Akt pathway inhibition. Full article
(This article belongs to the Special Issue Metal Metabolism in Animals)
Show Figures

Graphical abstract

Graphical abstract
Full article ">Figure 1
<p>Histopathological changes in the kidney at 14 days of age. (<b>a</b>) Control group. No changes are observed (H·E × 400); (<b>b</b>) 300 mg/kg group. Tubular cells show slight granular degeneration (H·E × 400); (<b>c</b>) 600 mg/kg group. Tubular cells show granular degeneration and vacuolar degeneration (H·E × 400); and (<b>d</b>) 900 mg/kg group. Tubular cells show obvious granular and vacuolar degeneration. Also, few necrotic tubular cells (▲) and apoptotic tubular cells (↑) are observed (H·E × 400).</p>
Full article ">Figure 2
<p>Histopathological changes in the kidney at 28 days of age. (<b>a</b>) Control group. No changes are observed (H·E × 400); (<b>b</b>) 300 mg/kg group. Tubular cells show granular degeneration (H·E × 400); (<b>c</b>) 600 mg/kg group. Tubular cells show obvious granular and vacuolar degeneration. Also, few necrotic tubular cells and apoptotic tubular cells are observed (H·E × 400); and (<b>d</b>) 900 mg/kg group. Tubular cells show marked granular and vacuolar degeneration. Also, some necrotic tubular cells (▲) and apoptotic tubular cells (↑) are observed (H·E × 400).</p>
Full article ">Figure 3
<p>Histopathological changes in kidney at 28 days of age. (<b>a</b>) Control group. No changes are observed (H·E × 400); (<b>b</b>) 300 mg/kg group. Tubular cells show granular and vacuolar degeneration (H·E × 400); (<b>c</b>) 600 mg/kg group. Tubular cells show marked granular and vacuolar degeneration. Also, some necrotic tubular cells and apoptotic tubular cells are observed (H·E × 400); and (<b>d</b>) 900 mg/kg group. A large number of necrotic tubular cells (▲) and apoptotic tubular cells (↑) are observed (H·E × 400).</p>
Full article ">Figure 3 Cont.
<p>Histopathological changes in kidney at 28 days of age. (<b>a</b>) Control group. No changes are observed (H·E × 400); (<b>b</b>) 300 mg/kg group. Tubular cells show granular and vacuolar degeneration (H·E × 400); (<b>c</b>) 600 mg/kg group. Tubular cells show marked granular and vacuolar degeneration. Also, some necrotic tubular cells and apoptotic tubular cells are observed (H·E × 400); and (<b>d</b>) 900 mg/kg group. A large number of necrotic tubular cells (▲) and apoptotic tubular cells (↑) are observed (H·E × 400).</p>
Full article ">Figure 4
<p>Morphological changes of apoptotic cells. (<b>a</b>) In the apoptotic cell, cytoplasm was intensely eosinophilic, and nucleus is shrunken and dense ring-shaped (↑). (H·E × 1000); and (<b>b</b>) In the apoptotic cell, nucleus is crescentic (↑). (H·E × 1000); (<b>c</b>) and (<b>d</b>) In the apoptotic cells, nuclei are cracked into two or multiple apoptotic bodies (↑). (H·E × 1000).</p>
Full article ">Figure 5
<p>Changes of TUNEL-positive cells at 14, 28 and 42 days. Data are presented with the mean ± standard deviation (<span class="html-italic">n</span> = 5 × 5); * <span class="html-italic">p</span> &lt; 0.05, compared with the control group; ** <span class="html-italic">p</span> &lt; 0.01, compared with the control group.</p>
Full article ">Figure 6
<p>NiCl<sub>2</sub>-induced mitochondrial dysfunction in the kidney. (<b>a</b>) Representative flow cytometric diagram of MMP analysis; and (<b>b</b>) The percentage of MMP damage. Data are presented with the mean ± standard deviation (<span class="html-italic">n</span> = 5); ** <span class="html-italic">p</span> &lt; 0.01, compared with the control group.</p>
Full article ">Figure 7
<p>The protein expression levels of AIF and EndoG in the kidney. Data are presented with the mean ± standard deviation (<span class="html-italic">n</span> = 5 × 5); * <span class="html-italic">p</span> &lt; 0.05, compared with the control group; ** <span class="html-italic">p</span> &lt; 0.01, compared with the control group.</p>
Full article ">Figure 8
<p>The mRNA expression levels of AIF and EndoG in the kidney. Data are presented with the mean ± standard deviation (<span class="html-italic">n</span> = 5); * <span class="html-italic">p</span> &lt; 0.05, compared with the control group; ** <span class="html-italic">p</span> &lt; 0.01, compared with the control group.</p>
Full article ">Figure 8 Cont.
<p>The mRNA expression levels of AIF and EndoG in the kidney. Data are presented with the mean ± standard deviation (<span class="html-italic">n</span> = 5); * <span class="html-italic">p</span> &lt; 0.05, compared with the control group; ** <span class="html-italic">p</span> &lt; 0.01, compared with the control group.</p>
Full article ">Figure 9
<p>The mRNA expression levels of PI3K, Akt1 and Akt2 in the kidney. Data are presented with the mean ± standard deviation (<span class="html-italic">n</span> = 5); * <span class="html-italic">p</span> &lt; 0.05, compared with the control group; ** <span class="html-italic">p</span> &lt; 0.01, compared with the control group.</p>
Full article ">Figure 9 Cont.
<p>The mRNA expression levels of PI3K, Akt1 and Akt2 in the kidney. Data are presented with the mean ± standard deviation (<span class="html-italic">n</span> = 5); * <span class="html-italic">p</span> &lt; 0.05, compared with the control group; ** <span class="html-italic">p</span> &lt; 0.01, compared with the control group.</p>
Full article ">Figure 10
<p>The protein expression levels of Bcl-2, Bcl-xL, Bax and Bak in the kidney. Data are presented with the mean ± standard deviation (<span class="html-italic">n</span> = 5 × 5); * <span class="html-italic">p</span> &lt; 0.05, compared with the control group; ** <span class="html-italic">p</span> &lt; 0.01, compared with the control group.</p>
Full article ">Figure 11
<p>The ratio of Bax/Bcl-2 protein expression in the kidney. Data are presented with the mean ± standard deviation (<span class="html-italic">n</span> =5 × 5); * <span class="html-italic">p</span> &lt; 0.05, compared with the control group; ** <span class="html-italic">p</span> &lt; 0.01, compared with the control group.</p>
Full article ">Figure 12
<p>The mRNA expression levels of Bcl-2, Bcl-xL, Bax and Bak in the kidney. Data are presented with the mean ± standard deviation (<span class="html-italic">n</span> = 5); * <span class="html-italic">p</span> &lt; 0.05, compared with the control group; ** <span class="html-italic">p</span> &lt; 0.01, compared with the control group.</p>
Full article ">Figure 12 Cont.
<p>The mRNA expression levels of Bcl-2, Bcl-xL, Bax and Bak in the kidney. Data are presented with the mean ± standard deviation (<span class="html-italic">n</span> = 5); * <span class="html-italic">p</span> &lt; 0.05, compared with the control group; ** <span class="html-italic">p</span> &lt; 0.01, compared with the control group.</p>
Full article ">Figure 13
<p>The ratio of Bax/Bcl-2 mRNA expression in the kidney. Data are presented with the mean ± standard deviation (<span class="html-italic">n</span> = 5); * <span class="html-italic">p</span> &lt; 0.05, compared with the control group; ** <span class="html-italic">p</span> &lt; 0.01, compared with the control group.</p>
Full article ">Figure 14
<p>Schematic diagram of NiCl<sub>2</sub>-caused mitochondria-mediated apoptosis.</p>
Full article ">
1013 KiB  
Review
Dual Inhibition of MEK and PI3K Pathway in KRAS and BRAF Mutated Colorectal Cancers
by Sally Temraz, Deborah Mukherji and Ali Shamseddine
Int. J. Mol. Sci. 2015, 16(9), 22976-22988; https://doi.org/10.3390/ijms160922976 - 23 Sep 2015
Cited by 91 | Viewed by 12917
Abstract
Colorectal cancer (CRC) is a heterogeneous disease with multiple underlying causative genetic mutations. Genetic mutations in the phosphatidylinositol-3 kinase (PI3K) and the mitogen activated protein kinase (MAPK) pathways are frequently implicated in CRC. Targeting the downstream substrate MEK in these mutated tumors stands [...] Read more.
Colorectal cancer (CRC) is a heterogeneous disease with multiple underlying causative genetic mutations. Genetic mutations in the phosphatidylinositol-3 kinase (PI3K) and the mitogen activated protein kinase (MAPK) pathways are frequently implicated in CRC. Targeting the downstream substrate MEK in these mutated tumors stands out as a potential target in CRC. Several selective inhibitors of MEK have entered clinical trial evaluation; however, clinical activity with single MEK inhibitors has been rarely observed and acquired resistance seems to be inevitable. Amplification of the driving oncogene KRAS(13D), which increases signaling through the ERK1/2 pathway, upregulation of the noncanonical wingless/calcium signaling pathway (Wnt), and coexisting PIK3CA mutations have all been implicated with resistance against MEK inhibitor therapy in KRAS mutated CRC. The Wnt pathway and amplification of the oncogene have also been associated with resistance to MEK inhibitors in CRCs harboring BRAF mutations. Thus, dual targeted inhibition of MEK and PI3K pathway effectors (mTOR, PI3K, AKT, IGF-1R or PI3K/mTOR inhibitors) presents a potential strategy to overcome resistance to MEK inhibitor therapy. Many clinical trials are underway to evaluate multiple combinations of these pathway inhibitors in solid tumors. Full article
(This article belongs to the Special Issue Molecular Classification of Human Cancer: Diagnosis and Treatment)
Show Figures

Graphical abstract

Graphical abstract
Full article ">Figure 1
<p>Cross talk between MAPK, PI3K and Wnt pathway in CRC. Upon MEK inhibition with one of the MEK inhibitors (shown in red box), KRAS mutated (Red lines) and BRAF mutated (Green lines) CRCs activate parallel pathways that incur resistance to MEK inhibition. Dual targeted inhibition of MEK with mTOR (shown in blue box), PI3K (shown in green box), AKT (shown in yellow box), IGF-1R (shown in purple box) or PI3K/mTOR (shown in orange) inhibitors has been studied to overcome this resistance. Regular arrow: activates; Arrow ending with a straight line: inhibits.</p>
Full article ">
2896 KiB  
Article
Exogenous GA3 Application Enhances Xylem Development and Induces the Expression of Secondary Wall Biosynthesis Related Genes in Betula platyphylla
by Huiyan Guo, Yucheng Wang, Huizi Liu, Ping Hu, Yuanyuan Jia, Chunrui Zhang, Yanmin Wang, Shan Gu, Chuanping Yang and Chao Wang
Int. J. Mol. Sci. 2015, 16(9), 22960-22975; https://doi.org/10.3390/ijms160922960 - 23 Sep 2015
Cited by 49 | Viewed by 7613
Abstract
Gibberellin (GA) is a key signal molecule inducing differentiation of tracheary elements, fibers, and xylogenesis. However the molecular mechanisms underlying the effect of GA on xylem elongation and secondary wall development in tree species remain to be determined. In this study, Betula platyphylla [...] Read more.
Gibberellin (GA) is a key signal molecule inducing differentiation of tracheary elements, fibers, and xylogenesis. However the molecular mechanisms underlying the effect of GA on xylem elongation and secondary wall development in tree species remain to be determined. In this study, Betula platyphylla (birch) seeds were treated with 300 ppm GA3 and/or 300 ppm paclobutrazol (PAC), seed germination was recorded, and transverse sections of hypocotyls were stained with toluidine blue; the two-month-old seedlings were treated with 50 ?M GA3 and/or 50 ?M PAC, transverse sections of seedling stems were stained using phloroglucinol–HCl, and secondary wall biosynthesis related genes expression was analyzed by real-time quantitative PCR. Results indicated that germination percentage, energy and time of seeds, hypocotyl height and seedling fresh weight were enhanced by GA3, and reduced by PAC; the xylem development was wider in GA3-treated plants than in the control; the expression of NAC and MYB transcription factors, CESA, PAL, and GA oxidase was up-regulated during GA3 treatment, suggesting their role in GA3-induced xylem development in the birch. Our results suggest that GA3 induces the expression of secondary wall biosynthesis related genes to trigger xylogenesis in the birch plants. Full article
(This article belongs to the Special Issue Molecular Research in Plant Secondary Metabolism 2015)
Show Figures

Figure 1

Figure 1
<p>The germination of birch seeds treated with GA<sub>3</sub> and/or paclobutrazol (PAC). (<b>A</b>) Germination percentage (%) of birch seeds treated with GA<sub>3</sub> and/or PAC; (<b>B</b>) Germination energy (%) of birch seeds treated with GA<sub>3</sub> and/or PAC; (<b>C</b>) Germination time (day) of birch seeds treated with GA<sub>3</sub> and/or PAC; (<b>D</b>) Growth of birch seedlings; (<b>E</b>) Hypocotyl height of birch seedling; and (<b>F</b>) Fresh weight of birch seedlings. Lower case letter indicates <span class="html-italic">p</span> &lt; 0.05.</p>
Full article ">Figure 1 Cont.
<p>The germination of birch seeds treated with GA<sub>3</sub> and/or paclobutrazol (PAC). (<b>A</b>) Germination percentage (%) of birch seeds treated with GA<sub>3</sub> and/or PAC; (<b>B</b>) Germination energy (%) of birch seeds treated with GA<sub>3</sub> and/or PAC; (<b>C</b>) Germination time (day) of birch seeds treated with GA<sub>3</sub> and/or PAC; (<b>D</b>) Growth of birch seedlings; (<b>E</b>) Hypocotyl height of birch seedling; and (<b>F</b>) Fresh weight of birch seedlings. Lower case letter indicates <span class="html-italic">p</span> &lt; 0.05.</p>
Full article ">Figure 2
<p>Transverse sections of 15-day-old birch seedlings germinating under GA<sub>3</sub> and/or PAC. The hypocotyl base was sectioned 15 days after germination. (<b>A</b>) Toluidine blue staining analysis of the differentiation of xylem. xy, xylem cell. Bars = 50 μm; (<b>B</b>) The diameter of the hypocotyl (μm); and (<b>C</b>) The number of xylem cell. Lower case letter indicates <span class="html-italic">p</span> &lt; 0.05.</p>
Full article ">Figure 3
<p>Phenotypic changes of 2-month-old birch seedlings under GA<sub>3</sub> and/or PAC.</p>
Full article ">Figure 4
<p>Transverse sections of 2-month-old birch seedlings and the ratio of xylem area to total area under GA<sub>3</sub> and/or PAC treatments. (<b>A</b>–<b>D</b>) GA and/or PAC treatment for 3 days; (<b>E</b>–<b>H</b>) GA and/or PAC treatment for 7 days; (<b>I</b>–<b>L</b>) GA and/or PAC treatment for 14 days; and (<b>M</b>–<b>P</b>) GA and/or PAC treatment for 21 days. (<b>A</b>,<b>E</b>,<b>I</b>,<b>M</b>) GA treatment; (<b>B</b>,<b>F</b>,<b>J</b>,<b>N</b>) GA + PAC treatment; (<b>C</b>,<b>G</b>,<b>K</b>,<b>O</b>) PAC treatment; and (<b>D</b>,<b>H</b>,<b>L</b>,<b>P</b>) water treatment (control). Phloroglucinol–HCl was used to stain lignin to highlight xylem vessels and fibers. Bars = 1 mm; (<b>Q</b>) The ratio of xylem area to total area in birch plants under GA<sub>3</sub>, GA<sub>3</sub> + PAC, PAC and control for 3, 7, 14 or 21 days. Error bars were obtained from multiple replicates of the real-time PCR. Lower case letter indicates <span class="html-italic">p</span> &lt; 0.05.</p>
Full article ">Figure 4 Cont.
<p>Transverse sections of 2-month-old birch seedlings and the ratio of xylem area to total area under GA<sub>3</sub> and/or PAC treatments. (<b>A</b>–<b>D</b>) GA and/or PAC treatment for 3 days; (<b>E</b>–<b>H</b>) GA and/or PAC treatment for 7 days; (<b>I</b>–<b>L</b>) GA and/or PAC treatment for 14 days; and (<b>M</b>–<b>P</b>) GA and/or PAC treatment for 21 days. (<b>A</b>,<b>E</b>,<b>I</b>,<b>M</b>) GA treatment; (<b>B</b>,<b>F</b>,<b>J</b>,<b>N</b>) GA + PAC treatment; (<b>C</b>,<b>G</b>,<b>K</b>,<b>O</b>) PAC treatment; and (<b>D</b>,<b>H</b>,<b>L</b>,<b>P</b>) water treatment (control). Phloroglucinol–HCl was used to stain lignin to highlight xylem vessels and fibers. Bars = 1 mm; (<b>Q</b>) The ratio of xylem area to total area in birch plants under GA<sub>3</sub>, GA<sub>3</sub> + PAC, PAC and control for 3, 7, 14 or 21 days. Error bars were obtained from multiple replicates of the real-time PCR. Lower case letter indicates <span class="html-italic">p</span> &lt; 0.05.</p>
Full article ">Figure 5
<p>Expression analysis of the genes in birch plants under GA<sub>3</sub> and/or PAC. These genes include <span class="html-italic">NAC</span>, <span class="html-italic">MYB</span>, <span class="html-italic">PAL</span>, <span class="html-italic">CESA</span>, and <span class="html-italic">GA20ox</span>. Error bars were obtained from multiple replicates of the real-time PCR. Lower case letter indicates <span class="html-italic">p</span> &lt; 0.05.</p>
Full article ">Figure 5 Cont.
<p>Expression analysis of the genes in birch plants under GA<sub>3</sub> and/or PAC. These genes include <span class="html-italic">NAC</span>, <span class="html-italic">MYB</span>, <span class="html-italic">PAL</span>, <span class="html-italic">CESA</span>, and <span class="html-italic">GA20ox</span>. Error bars were obtained from multiple replicates of the real-time PCR. Lower case letter indicates <span class="html-italic">p</span> &lt; 0.05.</p>
Full article ">
1211 KiB  
Correction
Zhou, N., et al. Exposure of Tumor-Associated Macrophages to ApoptoticMCF-7 Cells Promotes Breast Cancer Growth and Metastasis. Int. J. Mol. Sci. 2015, 16, 11966–11982
by Na Zhou, Yizhuang Zhang, Xuehui Zhang, Zhen Lei, Ruobi Hu, Hui Li, Yiqing Mao, Xi Wang, David M. Irwin, Gang Niu and Huanran Tan
Int. J. Mol. Sci. 2015, 16(9), 22957-22959; https://doi.org/10.3390/ijms160922957 - 22 Sep 2015
Viewed by 4097
Abstract
The authors wish to change Figure 2 in Section 2 of their paper published in IJMS [1]. In Figure 2C, the tumor tissue of the Mac group was mixed up with that of the CoA group. [...] Full article
Show Figures

Figure 1 Cont.

Figure 1 Cont.
<p><span class="html-italic">In vivo</span> tumorigenicity and metastatic assay. (<b>A</b>) Growth curves for tumors generated by MCF-7 cells grown in three types of conditioned media. The width and diameter of each tumor were measured using calipers, and tumor volume was calculated using the formula ½ × a × b<sup>2</sup>, where “a” is the longer tumor axis and “b” is the shorter tumor axis; (<b>B</b>) Tumor weight was measured after excision from mice,<span class="html-italic">n</span> = 5; (<b>C</b>) Images of tumors from the three groups of mice; (<b>D</b>) Macroscopic view of nodules in the lungs from the three groups of mice; (<b>E</b>,<b>F</b>) Quantification of the metastatic nodules in the three groups of mice (<span class="html-italic">n</span> = 5); (<b>G</b>,<b>H</b>) Hematoxylin-eosin (HE) staining of paraffin sections from livers and the lungs of the three groups of mice. Metastases are indicated by the black arrows. <b>**</b> <span class="html-italic">p</span> &lt; 0.01, <b>***</b> <span class="html-italic">p</span> &lt; 0.001 <span class="html-italic">vs.</span> Normal media group; <b><sup>###</sup></b> <span class="html-italic">p</span> &lt; 0.001 <span class="html-italic">vs.</span> Mac group.</p>
Full article ">Figure 2
<p><span class="html-italic">In vivo</span> tumorigenicity and metastatic assay. (<b>A</b>) Growth curves for tumors generated by MCF-7 cells grown in three types of conditioned media. The width and diameter of each tumor were measured using calipers, and tumor volume was calculated using the formula ½ × a × b<sup>2</sup>, where “a” is the longer tumor axis and “b” is the shorter tumor axis; (<b>B</b>) Tumor weight was measured after excision from mice,<span class="html-italic">n</span> = 5; (<b>C</b>) Images of tumors from the three groups of mice; (<b>D</b>) Macroscopic view of nodules in the lungs from the three groups of mice; (<b>E</b>,<b>F</b>) Quantification of the metastatic nodules in the three groups of mice (<span class="html-italic">n</span> = 5); (<b>G</b>,<b>H</b>) Hematoxylin-eosin (HE) staining of paraffin sections from livers and the lungs of the three groups of mice. Metastases are indicated by the black arrows. <b>**</b> <span class="html-italic">p</span> &lt; 0.01, <b>***</b> <span class="html-italic">p</span> &lt; 0.001 <span class="html-italic">vs.</span> Normal media group; <b><sup>###</sup></b> <span class="html-italic">p</span> &lt; 0.001 <span class="html-italic">vs.</span> Mac group.</p>
Full article ">
1337 KiB  
Article
Phenotypic and Transcriptomic Analyses of Autotetraploid and Diploid Mulberry (Morus alba L.)
by Fanwei Dai, Zhenjiang Wang, Guoqing Luo and Cuiming Tang
Int. J. Mol. Sci. 2015, 16(9), 22938-22956; https://doi.org/10.3390/ijms160922938 - 22 Sep 2015
Cited by 57 | Viewed by 7952
Abstract
Autopolyploid plants and their organs are often larger than their diploid counterparts, which makes them attractive to plant breeders. Mulberry (Morus alba L.) is an important commercial woody plant in many tropical and subtropical areas. In this study, we obtained a series [...] Read more.
Autopolyploid plants and their organs are often larger than their diploid counterparts, which makes them attractive to plant breeders. Mulberry (Morus alba L.) is an important commercial woody plant in many tropical and subtropical areas. In this study, we obtained a series of autotetraploid mulberry plants resulting from a colchicine treatment. To evaluate the effects of genome duplications in mulberry, we compared the phenotypes and transcriptomes of autotetraploid and diploid mulberry trees. In the autotetraploids, the height, breast-height diameter, leaf size, and fruit size were larger than those of diploids. Transcriptome data revealed that of 21,229 expressed genes only 609 (2.87%) were differentially expressed between diploids and autotetraploids. Among them, 30 genes were associated with the biosynthesis and signal transduction of plant hormones, including cytokinin, gibberellins, ethylene, and auxin. In addition, 41 differentially expressed genes were involved in photosynthesis. These results enhance our understanding of the variations that occur in mulberry autotetraploids and will benefit future breeding work. Full article
(This article belongs to the Special Issue Plant Molecular Biology)
Show Figures

Graphical abstract

Graphical abstract
Full article ">Figure 1
<p>Ploidy analysis of mulberry leaves. (<b>A</b>) DNA content of diploids (the main peak is at channel 100); (<b>B</b>) DNA content of autotetraploids (the main peak is at channel 200); (<b>C</b>) Chromosome number in diploids (2<span class="html-italic">n</span> = 2<span class="html-italic">x</span> = 28). Bars = 5 μm; and (<b>D</b>) Chromosome number in autotetraploids (2<span class="html-italic">n</span> = 4<span class="html-italic">x</span> = 56). Bars = 5 μm.</p>
Full article ">Figure 2
<p>Phenotypic characterization of diploids and autotetraploids grown under the same conditions. (<b>A</b>) Leaves of diploids and autotetraploids; (<b>B</b>) Fruits of diploids and autotetraploids at the red (<b>left</b>) and black (<b>right</b>) fruit stages; (<b>C</b>) Leaf cross-section of a diploid; and (<b>D</b>) Leaf cross-section of an autotetraploid.</p>
Full article ">Figure 3
<p>Number of differentially expressed genes identified between autotetraploids and diploids. The genes differentially up- and down-regulated in autotetraploids were determined comparing with corresponding samples of diploids (log<sub>2</sub>(RPKM<sub>autotetraploid</sub>/RPKM<sub>di</sub><sub>ploid</sub>) ≥ 1, and probability ≥ 0.8)</p>
Full article ">Figure 4
<p>Verification of RNA-Seq results by qPCR.</p>
Full article ">Figure 5
<p>GO classifications of differentially expressed genes.</p>
Full article ">Figure 6
<p>The top 20 enriched KEGG pathways among the differentially expressed genes.</p>
Full article ">
229 KiB  
Article
Effects of Microcystin-LR Exposure on Spermiogenesis in Nematode Caenorhabditis elegans
by Yunhui Li, Minhui Zhang, Pan Chen, Ran Liu, Geyu Liang, Lihong Yin and Yuepu Pu
Int. J. Mol. Sci. 2015, 16(9), 22927-22937; https://doi.org/10.3390/ijms160922927 - 22 Sep 2015
Cited by 9 | Viewed by 5289
Abstract
Little is known about the effect on spermiogenesis induced by microcystin-leucine arginine (MC-LR), even though such data are very important to better elucidate reproductive health. In the current work, with the aid of nematode Caenorhabditis elegans (C. elegans) as an animal [...] Read more.
Little is known about the effect on spermiogenesis induced by microcystin-leucine arginine (MC-LR), even though such data are very important to better elucidate reproductive health. In the current work, with the aid of nematode Caenorhabditis elegans (C. elegans) as an animal model, we investigated the defects on spermiogenesis induced by MC-LR. Our results showed that MC-LR exposure induced sperm morphology abnormality and caused severe defects of sperm activation, trans-activation, sperm behavior and competition. Additionally, the expression levels of spe-15 were significantly decreased in C. elegans exposed to MC-LR lower than 16.0 ?g/L, while the expression levels of spe-10 and fer-1 could be significantly lowered in C. elegans even exposed to 1.0 ?g/L of MC-LR. Therefore, the present study reveals that MC-LR can induce adverse effects on spermiogenesis, and those defects of sperm functions may be induced by the decreases of spe-10, spe-15 and fer-1 gene expressions in C. elegans. Full article
(This article belongs to the Section Molecular Toxicology)
Show Figures

Figure 1

Figure 1
<p>Effects of microcystin-leucine arginine (MC-LR) exposure on nematodes sperm activation (<b>a</b>) <span class="html-italic">him-5</span> sperm activation <span class="html-italic">in vitro</span> with Pronase; and (<b>b</b>) Number of self-progeny of male-derived sperm trans-activation. Bars represent means ± SEM. <b>*</b> <span class="html-italic">p</span> &lt; 0.05 <span class="html-italic">vs</span>. the control group.</p>
Full article ">Figure 2
<p>Effects of MC-LR exposure on spermatids morphology. Bars represent means ± SEM. <b>*</b> <span class="html-italic">p</span> &lt; 0.05 <span class="html-italic">vs</span>. the control group.</p>
Full article ">Figure 3
<p>Effects of MC-LR exposure on spermatids size. (<b>a</b>) Spermatids diameters; and (<b>b</b>) Spermatids cross-sectional area. One male was dissected and 200 spermatids were analyzed. Bars represent means ± SEM.</p>
Full article ">Figure 4
<p>Effects of MC-LR exposure on sperm migration. The number of abnormal sperm migration worms and total worms were counted. Bars represent means ± SEM. <b>*</b> <span class="html-italic">p</span> &lt; 0.05 <span class="html-italic">vs</span>. the control group.</p>
Full article ">Figure 5
<p>Effects of MC-LR exposure on sperm competitiveness. The number of self-progeny and outcrossed-progeny were counted. Bars represent means ± SEM. <b>*</b> <span class="html-italic">p</span> &lt; 0.05 <span class="html-italic">vs</span>. the control group.</p>
Full article ">Figure 6
<p>Effects of MC-LR exposure on relative mRNA expression levels of genes involved in spermiogenesis. Bars represent means ± SEM. <b>*</b> <span class="html-italic">p</span> &lt; 0.01 <span class="html-italic">vs</span>. the control group.</p>
Full article ">
3456 KiB  
Article
Transcriptome Analysis and Identification of Differentially Expressed Transcripts of Immune-Related Genes in Spleen of Gosling and Adult Goose
by Anqi Wang, Fei Liu, Shun Chen, Mingshu Wang, Renyong Jia, Dekang Zhu, Mafeng Liu, Kunfeng Sun, Ying Wu, Xiaoyue Chen and Anchun Cheng
Int. J. Mol. Sci. 2015, 16(9), 22904-22926; https://doi.org/10.3390/ijms160922904 - 22 Sep 2015
Cited by 19 | Viewed by 6925
Abstract
The goose (Anser cygnoides), having high nutritional value, high-quality feathers and high economic benefit, is an economically important poultry species. However, the molecular mechanisms underlying the higher susceptibility to pathogens in goslings than in adult geese remains poorly understood. In this [...] Read more.
The goose (Anser cygnoides), having high nutritional value, high-quality feathers and high economic benefit, is an economically important poultry species. However, the molecular mechanisms underlying the higher susceptibility to pathogens in goslings than in adult geese remains poorly understood. In this study, the histological sections of spleen tissue from a two-week-old gosling and an adult goose, respectively, were subjected to comparative analysis. The spleen of gosling was mainly composed of mesenchyma, accompanied by scattered lymphocytes, whereas the spleen parenchyma was well developed in the adult goose. To investigate goose immune-related genes, we performed deep transcriptome and gene expression analyses of the spleen samples using paired-end sequencing technology (Illumina). In total, 50,390 unigenes were assembled using Trinity software and TGICL software. Moreover, these assembled unigenes were annotated with gene descriptions and gene ontology (GO) analysis was performed. Through Kyoto encyclopedia of genes and genomes (KEGG) analysis, we investigated 558 important immune-relevant unigenes and 23 predicted cytokines. In addition, 22 immune-related genes with differential expression between gosling and adult goose were identified, among which the three genes showing largest differences in expression were immunoglobulin alpha heavy chain (IgH), mannan-binding lectin serine protease 1 isoform X1 (MASP1) and C–X–C chemokine receptor type 4 (CXCR4). Finally, of these 22 differentially expressed immune-related genes, seven genes, including tumor necrosis factor receptor superfamily member 13B (TNFRSF13B), C-C motif chemokine 4-like (CCL4), CXCR4, interleukin 2 receptor alpha (IL2RA), MHC class I heavy chain (MHCI?), transporter of antigen processing 2 (TAP2), IgH, were confirmed by quantitative real-time PCR (qRT-PCR). The expression levels of all the candidate unigenes were up-regulated in adult geese other than that of TNFRSF13B. The comparative analysis of the spleen transcriptomes of gosling and adult goose may promote better understanding of immune molecular development in goose. Full article
(This article belongs to the Section Biochemistry)
Show Figures

Graphical abstract

Graphical abstract
Full article ">Figure 1
<p>Histological changes in goose spleens at different developmental stages. The spleen samples from the gosling (<b>A</b>–<b>C</b>), and the adult goose (<b>D</b>–<b>F</b>) were cut into sections and stained with hematoxylin and eosin (H&amp;E). The parenchyma in the gosling spleen was sparse. However, well-developed spleen parenchyma was detected in the adult goose. G indicates germinal centers; P indicates periarteriolar lymphoid sheaths; arrows indicate lymphocytes.</p>
Full article ">Figure 2
<p>Histogram of the unigene length distribution. The <span class="html-italic">x</span>-axis indicates the length range of unigenes. The <span class="html-italic">y</span>-axis denotes the number of unigenes in every range of length.</p>
Full article ">Figure 3
<p>Comparison of the number of unigene annotations obtained from the different databases. Each section illustrates the number of unigenes shared among the Nr, Swiss-Prot, KOG and GO databases.</p>
Full article ">Figure 4
<p>Statistical analysis of the assembled unigenes against Nr database. (<b>A</b>) <span class="html-italic">E</span>-value distribution; (<b>B</b>) Species distribution.</p>
Full article ">Figure 5
<p>Histogram presentation of eukaryotic clusters of orthologous groups (KOG) classification. A total of 9534 sequences were clustered into 25 KOG categories.</p>
Full article ">Figure 6
<p>Histogram presentation of Gene Ontology classification. Unigenes were assigned to three categories: cellular components, molecular functions and biological processes.</p>
Full article ">Figure 7
<p>Distribution of unigenes in the immune system. In the immune system, 16 pathways were identified. A total of 456 unigenes were involved in the 16 immune system KEGG pathways. Each unigene may be grouped into more than one pathway.</p>
Full article ">Figure 8
<p>Top 20 KEGG pathways enriched up-regulated genes. Among the 1470 up-regulated unigenes, 11 unigenes are involved in the largest KEGG pathway “Cytokine–cytokine receptor interaction”. Five of the top 20 KEGG pathways participate directly in the immune response.</p>
Full article ">Figure 9
<p>Validation of the gene expression profile by qRT-PCR. Each dot represents an individual goose in one of the two groups (one group is two-week-old goslings; the other group is adult geese). The mRNA level of each spleen sample was quantified by qRT-PCR in triplicate for each gene. <span class="html-italic">GAPDH</span> was amplified as an internal control. The chart was constructed in GraphPad Prism 5. The relative expression levels were compared using multiple <span class="html-italic">t</span>-tests. Data are represented as the mean ± SEM (<span class="html-italic">n</span> = 3). For gene symbols representing different genes, refer to <a href="#ijms-16-22904-t004" class="html-table">Table 4</a>. <b>*</b> indicates significant differences (<span class="html-italic">p</span> ≤ 0.05), <b>**</b> indicates extremely significant differences (<span class="html-italic">p</span> ≤ 0.01).</p>
Full article ">
3338 KiB  
Article
Roles of NlAKTIP in the Growth and Eclosion of the Rice Brown Planthopper, Nilaparvata lugens Stål, as Revealed by RNA Interference
by Peiying Hao, Chaofeng Lu, Yan Ma, Lingbo Xu, Jiajun Zhu and Xiaoping Yu
Int. J. Mol. Sci. 2015, 16(9), 22888-22903; https://doi.org/10.3390/ijms160922888 - 22 Sep 2015
Cited by 10 | Viewed by 6168
Abstract
AKT-interacting protein (AKTIP) interacts with serine/threonine protein kinase B (PKB)/AKT. AKTIP modulates AKT’s activity by enhancing the phosphorylation of the regulatory site and plays a crucial role in multiple biological processes. In this study, the full length cDNA of NlAKTIP, a novel [...] Read more.
AKT-interacting protein (AKTIP) interacts with serine/threonine protein kinase B (PKB)/AKT. AKTIP modulates AKT’s activity by enhancing the phosphorylation of the regulatory site and plays a crucial role in multiple biological processes. In this study, the full length cDNA of NlAKTIP, a novel AKTIP gene in the brown planthopper (BPH) Nilaparvata lugens, was cloned. The reverse transcription quantitive PCR (RT-qPCR) results showed that the NlAKTIP gene was strongly expressed in gravid female adults, but was relatively weakly expressed in nymphs and male adult BPH. In female BPH, treatment with dsAKTIP resulted in the efficient silencing of NlAKTIP, leading to a significant reduction of mRNA levels, about 50% of those of the untreated control group at day 7 of the study. BPH fed with dsAKTIP had reduced growth with lower body weights and smaller sizes, and the body weight of BPH treated with dsAKTIP at day 7 decreased to about 30% of that of the untreated control. Treatment of dsAKTIP significantly delayed the eclosion for over 7 days relative to the control group and restricted ovarian development to Grade I (transparent stage), whereas the controls developed to Grade IV (matured stage). These results indicated that NlAKTIP is crucial to the growth and development of female BPH. This study provided a valuable clue of a potential target NlAKTIP for inhibiting the BPH, and also provided a new point of view on the interaction between BPH and resistant rice. Full article
(This article belongs to the Section Biochemistry)
Show Figures

Graphical abstract

Graphical abstract
Full article ">Figure 1
<p>Phylogenetic analysis of AKT-interacting protein (AKTIP) in insects and other organisms. The phylogenetic analysis was constructed using the neighbor-joining method. Branch lengths are proportional to the sequence divergence. The bar represents 0.1 substitutions per site. The bootstrap values are shown in the nodes. The boxed <span class="html-italic">Nilaparvata lugens</span> was the insect of brown planthopper used in this study.</p>
Full article ">Figure 2
<p><span class="html-italic">NlAKTIP</span> mRNA expression in BPH. (<b>A</b>) Expression patterns of <span class="html-italic">NlAKTIP</span> mRNA at different developmental stages of the Tn and Rh colonies. The mRNA level of <span class="html-italic">NlAKTIP</span> was detected using RT-qPCR. The mRNA level was normalized relative to the <span class="html-italic">β-actin</span> transcription levels and the reference was the mRNA level of 1st–2nd Tn instar nymph. The results are expressed as the means ± S.E from three replicates. 1–2N: 1st–2nd instar nymph; 3–5N: 3rd–4th instar nymph; 5N: 5th instar nymph; EF: newly eclosed female; GF: gravid female, M: male; (<b>B</b>) <span class="html-italic">NlAKTIP</span> expression in the gravid adult female. The mRNA level of <span class="html-italic">NlAKTIP</span> was detected using RT-qPCR. The mRNA level was normalized relative to the β-actin transcription levels and the reference was the mRNA level of the Tn gravid adult female. Asterisks represent significant differences between reference Tn and other subjects (Student’s <span class="html-italic">t</span>-test, ** <span class="html-italic">p</span> &lt; 0.01). The results are expressed as the means ± SE from three replicates.</p>
Full article ">Figure 3
<p>Effects of <span class="html-italic">NlAKTIP</span> RNAi. CK: female fed on D-97 (untreated diet); dsGFP: female fed on 0.5 μg/μL dsGFP control; 0.02: female fed on 0.02 μg/μL dsAKTIP; 0.1: females fed on 0.1 μg/μL dsAKTIP; 0.5: female fed on 0.5 μg/μL dsAKTIP. (<b>A</b>) <span class="html-italic">NlAKTIP</span> mRNA levels after feeding D-97, dsGFP or dsAKTIP. The results are expressed as the means ± SD from 20 individuals with three replications. The relative gene expression level was compared by Tukey’s test at each sampling time, and different letters of a, b, and c on the bars indicated significant differences among treatments (<span class="html-italic">p</span> &lt; 0.05); (<b>B</b>) Western blot analysis of AKTIP from the different treatments; (<b>C</b>) Average body weights of different groups at day 7. The results are expressed as the means ± SD from at least 7 individuals. Symbols of a, b, and c indicate significant differences between each two groups (Student’s <span class="html-italic">t</span>-test, <span class="html-italic">p</span> &lt; 0.05); (<b>D</b>) The effect of <span class="html-italic">NlAKTIP</span> RNAi on the adult female body size.</p>
Full article ">Figure 4
<p>The effect of <span class="html-italic">NlAKTIP</span> RNAi on BHP eclosion and ovary development. CK: female fed on D-97 (untreated diet); dsGFP: female fed on 0.5 μg/μL dsGFP control; 0.02: female fed on 0.02 μg/μL dsAKTIP; 0.1: female fed on 0.1μg/μL dsAKTIP; 0.5: female fed on 0.5 μg/μL dsAKTIP. (<b>A</b>) The eclosion rate of BPH. The results were from the same bugs measured over time, and expressed as the means ± SD from 20 individuals with three replications. The eclosion rate was compared by Tukey’s test at each sampling time. Different letters of a, b, c, d and e on the bars indicate significant differences among treatments (<span class="html-italic">p</span> &lt; 0.05); (<b>B</b>) The effect of <span class="html-italic">NlAKTIP</span> RNAi on ovarian development.</p>
Full article ">Figure 5
<p>Survival rate of the different groups fed with RNAi. CK: female fed on D-97 (untreated diet); dsGFP: female fed on 0.5 μg/μL dsGFP control; 0.02: female fed on 0.02 μg/μL dsAKTIP; 0.1: female fed on 0.1 μg/μL dsAKTIP; 0.5: female fed on 0.5 μg/μL dsAKTIP. The results were from the same bugs measured over time, and expressed as the means ± SD from 20 individuals with three replications. The eclosion rate was compared by Tukey’s test at each sampling time. Different letters of a, b and c on the bars indicate significant differences among treatments (<span class="html-italic">p</span> &lt; 0.05).</p>
Full article ">
740 KiB  
Review
The Current Role of Omega-3 Fatty Acids in the Management of Atrial Fibrillation
by Georgios A. Christou, Konstantinos A. Christou, Panagiotis Korantzopoulos, Evangelos C. Rizos, Dimitrios N. Nikas and John A. Goudevenos
Int. J. Mol. Sci. 2015, 16(9), 22870-22887; https://doi.org/10.3390/ijms160922870 - 22 Sep 2015
Cited by 20 | Viewed by 6305
Abstract
Background: The main dietary source of omega-3 polyunsaturated fatty acids (n-3 PUFA) is fish, which contains eicosapentaenoic acid (EPA) and docosahexaenoic acid (DHA). In the present manuscript, we aimed to review the current evidence regarding the clinical role of n-3 PUFA in the [...] Read more.
Background: The main dietary source of omega-3 polyunsaturated fatty acids (n-3 PUFA) is fish, which contains eicosapentaenoic acid (EPA) and docosahexaenoic acid (DHA). In the present manuscript, we aimed to review the current evidence regarding the clinical role of n-3 PUFA in the prevention of atrial fibrillation (AF) and the possible underlying mechanisms. Methods: A literature search based on PubMed listings was performed using “Omega-3 fatty acids” and “atrial fibrilation” as key search terms. Results: n-3 PUFA have been shown to attenuate structural atrial remodeling, prolong atrial effective refractory period through the prevention of reentry and suppress ectopic firing from pulmonary veins. Dietary fish intake has been found to have no effect on the incidence of AF in the majority of studies. Circulating DHA has been consistently reported to be inversely associated with AF risk, whereas EPA has no such effect. The majority of studies investigating the impact of n-3 PUFA supplementation on the incidence of AF following cardiac surgery reported no benefit, though most of them did not use n-3 PUFA pretreatment for adequate duration. Studies using adequate four-week pretreatment with n-3 PUFA before cardioversion of AF showed a reduction of the AF incidence. Conclusions: Although n-3 PUFA have antiarrhythmogenic properties, their clinical efficacy on the prevention of AF is not consistently supported. Further well-designed studies are needed to overcome the limitations of the existing studies and provide robust conclusions. Full article
(This article belongs to the Special Issue Omega-3 Fatty Acids in Health and Diseases)
4330 KiB  
Article
The Role of PTP1B O-GlcNAcylation in Hepatic Insulin Resistance
by Yun Zhao, Zhuqi Tang, Aiguo Shen, Tao Tao, Chunhua Wan, Xiaohui Zhu, Jieru Huang, Wanlu Zhang, Nana Xia, Suxin Wang, Shiwei Cui and Dongmei Zhang
Int. J. Mol. Sci. 2015, 16(9), 22856-22869; https://doi.org/10.3390/ijms160922856 - 22 Sep 2015
Cited by 27 | Viewed by 6963
Abstract
Protein tyrosine phosphatase 1B (PTP1B), which can directly dephosphorylate both the insulin receptor and insulin receptor substrate 1 (IRS-1), thereby terminating insulin signaling, reportedly plays an important role in insulin resistance. Accumulating evidence has demonstrated that O-GlcNAc modification regulates functions of several [...] Read more.
Protein tyrosine phosphatase 1B (PTP1B), which can directly dephosphorylate both the insulin receptor and insulin receptor substrate 1 (IRS-1), thereby terminating insulin signaling, reportedly plays an important role in insulin resistance. Accumulating evidence has demonstrated that O-GlcNAc modification regulates functions of several important components of insulin signal pathway. In this study, we identified that PTP1B is modified by O-GlcNAcylation at three O-GlcNAc sites (Ser104, Ser201, and Ser386). Palmitate acid (PA) impaired the insulin signaling, indicated by decreased phosphorylation of both serine/threonine-protein kinase B (Akt) and glycogen synthase kinase 3 beta (GSK3?) following insulin administration, and upregulated PTP1B O-GlcNAcylation in HepG2 cells. Compared with the wild-type, intervention PTP1B O-GlcNAcylation by site-directed gene mutation inhibited PTP1B phosphatase activity, resulted in a higher level of phosphorylated Akt and GSK3?, recovered insulin sensitivity, and improved lipid deposition in HepG2 cells. Taken together, our research showed that O-GlcNAcylation of PTP1B can influence insulin signal transduction by modulating its own phosphatase activity, which participates in the process of hepatic insulin resistance. Full article
(This article belongs to the Special Issue Glycosylation and Glycoproteins)
Show Figures

Figure 1

Figure 1
<p>PTP1B is modified by <span class="html-italic">O</span>-GlcNAcylation. (<b>A</b>) To detect whether PTP1B is <span class="html-italic">O</span>-GlcNAcylated, PTP1B was immunoprecipitated from 500 μL lysate of HepG2 cells with 5 μL PTP1B antibody and analyzed by western blot with RL-2 and CTD110.6 antibody. Input was used as positive control. IgG was a negative control; (<b>B</b>) Cell lysate was immunoprecipitated with WGA agarose beads followed by PTP1B antibody; (<b>C</b>) HepG2 cells were incubated for 24 h under low (5 mmol/L) or high (25 mmol/L) glucose conditions and treated with or without the O-GlcNAcase inhibitor PUGNAc. Then PTP1B was immunoprecipitated and analyzed by western blot with RL-2 antibody. IP, immunoprecipitation; WB, western blot. Data show mean ± SEM of three independent experiments. (<span class="html-italic">n</span> = 3, <b>*</b> <span class="html-italic">p</span> &lt; 0.05, significantly different from respective controls).</p>
Full article ">Figure 2
<p><span class="html-italic">O</span>-GlcNAcylation of PTP1B is increased in insulin resistance. Human HepG2 cells were treated with palmitate (0/0.2/0.4 mmol/L) for 24 h before being stimulated with insulin for 20 min. (<b>A</b>) Proteins were extracted and the phosphorylation of Akt and GSK3β was measured by western blot analysis; (<b>B</b>) <span class="html-italic">O</span>-GlcNAcylation of total cell lysate was analyzed; (<b>C</b>) <span class="html-italic">O</span>-GlcNAcylation of PTP1B was evaluated by immunoprecipitation followed by western blot analysis; (<b>D</b>) mice insulin resistance model and glucose tolerance test; (<b>E</b>) hepatic tissues were obtained from three groups of mice fed a normal or a high fat diet, respectively. <span class="html-italic">O</span>-GlcNAcylation of PTP1B and expression of OGT were measured. Similar results were obtained in two other experiments. (<span class="html-italic">n</span> = 3, <b>*</b> <span class="html-italic">p</span> &lt; 0.05, significantly different from respective controls).</p>
Full article ">Figure 3
<p>PTP1B is <span class="html-italic">O</span>-GlcNAc modified at three sites. (<b>A</b>) ETD MS/MS site mapping of the human PTP1B <span class="html-italic">O</span>-GlcNAc modification sites; (<b>B</b>) Schematic diagram shows full-length PTP1B domain structure and <span class="html-italic">O</span>-GlcNAc sites (Ser104, Ser201, and Ser386); C (Cys215) and A (Arg221), two residues which are critical for the catalytic activity of PTP1B; (<b>C</b>) We constructed site-directed mutants (Ser104 mutated to alanine, Ser201 mutated to alanine and aspartic acid), then HepG2 cells were transfected with pcDNA3.1/myc-His (−) vectors containing the indicated site mutations for 24 h before treating with 0.2 mM palmitate acid for 18 h. Then cells were immunoprecipitated with an anti-myc antibody followed by immunoblotting with an anti-<span class="html-italic">O</span>-GlcNAc antibody (RL-2); (<b>D</b>) PTP1B phosphatase activity was analyzed by protein phosphatase assay kit according to the manufacturer’s instruction. Data show mean ± SEM of three independent experiments. (<span class="html-italic">n</span> = 3, <b>*</b> <span class="html-italic">p</span> &lt; 0.05, significantly different from respective controls).</p>
Full article ">Figure 4
<p>Intervention PTP1B <span class="html-italic">O</span>-GlcNAcylation can recover insulin sensitivity and improve lipid metabolism. Cells were first transfected with wild-type and different site-directed mutations and treated with 0.2 mM palmitate, then incubated for 20 min with 100 nM insulin. (<b>A</b>) The protein levels and phosphorylation of Akt and GSK3β were measured by western blot analysis; (<b>B</b>) 50 μL of medium was sampled for measurement of glucose concentration using a Glucose Colorimetric/Fluorometric Assay Kit. The primary medium was used as the control; (<b>C</b>) Lipid deposition was determined by Oil red O staining. Scale bars 50 μm. Data show mean ± SD of three independent experiments. <b>*</b> and <sup>#</sup> mean <span class="html-italic">p</span> &lt; 0.05, significantly different from respective controls.</p>
Full article ">
1046 KiB  
Review
Targeting Glutamine Induces Apoptosis: A Cancer Therapy Approach
by Lian Chen and Hengmin Cui
Int. J. Mol. Sci. 2015, 16(9), 22830-22855; https://doi.org/10.3390/ijms160922830 - 22 Sep 2015
Cited by 137 | Viewed by 22477
Abstract
Glutamine metabolism has been proved to be dysregulated in many cancer cells, and is essential for proliferation of most cancer cells, which makes glutamine an appealing target for cancer therapy. In order to be well used by cells, glutamine must be transported to [...] Read more.
Glutamine metabolism has been proved to be dysregulated in many cancer cells, and is essential for proliferation of most cancer cells, which makes glutamine an appealing target for cancer therapy. In order to be well used by cells, glutamine must be transported to cells by specific transporters and converted to glutamate by glutaminase. There are currently several drugs that target glutaminase under development or clinical trials. Also, glutamine metabolism restriction has been proved to be effective in inhibiting tumor growth both in vivo and vitro through inducing apoptosis, growth arrest and/or autophagy. Here, we review recent researches about glutamine metabolism in cancer, and cell death induced by targeting glutamine, and their potential roles in cancer therapy. Full article
(This article belongs to the Collection Programmed Cell Death and Apoptosis)
Show Figures

Graphical abstract

Graphical abstract
Full article ">Figure 1
<p>Glutamine metabolism and potent targets for cancer therapy. After transporting into cytosol by LAT1 (<span class="html-small-caps">l</span>-type amino acid transporters 1), ASCT2 (system ASC amino acid transporters 2) and other transporters, glutamine is catalyzed by glutaminase and converts to glutamate and ammonia. It then provides macromolecular material for ammonia acid and lipid syntheses. Glutamine is also used to exchange EAAs, which could activate mTOR and promote cell growth. Glutamate is also used to exchange extracellular cysteine for GSH production. GLS is a key enzyme for glutamine metabolism, which can be inhibited by several inhibitors including 968, BPTES and CB-839, accompanying with other inhibitors of glutamine metabolism are shown in red circle. GLS, glutaminase; GDH, glutamate dehydrogenase; TA, transaminase; OAA, oxaloacetate; BCH, 2-aminobicyclo-(2,2,1)-heptane-2-carboxylic acid; GPNA, γ-<span class="html-small-caps">l</span>-glutamylp-nitroanilide; EGCG, epigallocatechin gallate; EAAs, essential ammonia acids; mTOR, mammalian target of rapamycin; BPTES, bis-2-(5-phenylacetamido-1,2,4-thiadiazol-2-yl)ethyl sulfide 3; 968, 5-(3-bromo-4-(dimethylamino) phenyl)-2,2-dimethyl-2,3,5,6-tetrahydrobenzo[a]phenanthridin-4(1H)-one; CB-839, <span class="html-italic">N</span>-(5-(4-(6-((2-(3-(trifluoromethoxy)phenyl)acetyl)amino)-3-pyridazinyl)butyl)-1,3,4-thiadiazol-2-yl)-2-pyridineacetamide. ┴, inhibiting effect; bold black arrow, main metabolic pathway and transportation of glutamine; black arrow, metabolic pathways of glutamine and glucose.</p>
Full article ">Figure 2
<p>Glutamine consumption is increased in most tumors. During tumorigenesis, glucose derived lactate is increased, and at the same time, contribution of glucose to TCA is decreased. Accompanied with glucose metabolism change, glutamine metabolism is up-regulated to compensate energy and macromolecular for cell proliferation and growth. <span class="html-italic">p53</span> is mutated, while <span class="html-italic">MYC</span> is overexpressed, which promotes glutamine metabolism by upregulating GLS1 activity during tumorigenesis. GLS1 is highly expressed in many tumors and promotes tumor proliferation. In contrast, GLS2 expression is reduced in some tumors. GLS, glutaminase; TCA, tricarboxylic acid cycle. Bold arrow, increased glutamine metabolism, decreased glucose metabolism and mutated <span class="html-italic">MYC</span>; dashed line, tumorigenesis procedure.</p>
Full article ">Figure 3
<p>Glutamine deprivation induces cell death or growth arrest. Glutamine deprivation makes cells sensitive to Fas (CD95) ligand, TNF-α and heat shock-mediated apoptosis. Glutamine deprivation induces apoptosis through extrinsic or intrinsic pathway, which is dependent on cell type and cell condition. Cyt c, cytochrome c; C-PARP, cleaved-PARP; t-Bid, truncated Bid; ΔΨ, mitochondrial membrane potential; GADD, growth arrest and DNA damage-induced genes; ROS, reactive oxygen species; JNK, c-Jun N-terminal kinase; HSP70, heat shock protein 70. ┴, inhibiting effect; bold arrow, decreased p62 and ΔΨ after glutamine deprivation.</p>
Full article ">
693 KiB  
Review
Pharmacogenetics of BCR/ABL Inhibitors in Chronic Myeloid Leukemia
by Marialuisa Polillo, Sara Galimberti, Claudia Baratè, Mario Petrini, Romano Danesi and Antonello Di Paolo
Int. J. Mol. Sci. 2015, 16(9), 22811-22829; https://doi.org/10.3390/ijms160922811 - 21 Sep 2015
Cited by 33 | Viewed by 8774
Abstract
Chronic myeloid leukemia was the first haematological neoplasia that benefited from a targeted therapy with imatinib nearly 15 years ago. Since then, several studies have investigated the role of genes, their variants (i.e., polymorphisms) and their encoded proteins in the pharmacokinetics [...] Read more.
Chronic myeloid leukemia was the first haematological neoplasia that benefited from a targeted therapy with imatinib nearly 15 years ago. Since then, several studies have investigated the role of genes, their variants (i.e., polymorphisms) and their encoded proteins in the pharmacokinetics and pharmacodynamics of BCR-ABL1 tyrosine kinase activity inhibitors (TKIs). Transmembrane transporters seem to influence in a significant manner the disposition of TKIs, especially that of imatinib at both cellular and systemic levels. In particular, members of the ATP-binding cassette (ABC) family (namely ABCB1 and ABCG2) together with solute carrier (SLC) transporters (i.e., SLC22A1) are responsible for the differences in drug pharmacokinetics. In the case of the newer TKIs, such as nilotinib and dasatinib, the substrate affinity of these drugs for transporters is variable but lower than that measured for imatinib. In this scenario, the investigation of genetic variants as possible predictive markers has led to some discordant results. With the partial exception of imatinib, these discrepancies seem to limit the application of discovered biomarkers in the clinical settings. In order to overcome these issues, larger prospective confirmative trials are needed. Full article
(This article belongs to the Special Issue Pharmacogenetics and Personalized Medicine)
Show Figures

Graphical abstract

Graphical abstract
Full article ">
899 KiB  
Article
Chemically Bonding of Amantadine with Gardenamide A Enhances the Neuroprotective Effects against Corticosterone-Induced Insults in PC12 Cells
by Jiaqiang Zhao, Lizhi Peng, Wenhua Zheng, Rikang Wang, Lei Zhang, Jian Yang and Heru Chen
Int. J. Mol. Sci. 2015, 16(9), 22795-22810; https://doi.org/10.3390/ijms160922795 - 21 Sep 2015
Cited by 11 | Viewed by 6081
Abstract
Two amantadine (ATD)-gardenamide A (GA) ligands have been designed and synthesized. The bonding of ATD with GA through a methylene carbonyl brigde (L1) enhances the neuroprotective effect against corticosterone (CORT)-induced impairments in PC12 cells; while the bonding through a succinyl brigde [...] Read more.
Two amantadine (ATD)-gardenamide A (GA) ligands have been designed and synthesized. The bonding of ATD with GA through a methylene carbonyl brigde (L1) enhances the neuroprotective effect against corticosterone (CORT)-induced impairments in PC12 cells; while the bonding through a succinyl brigde (L2) does not. L1 reduces the level of reactive oxygen species (ROS) and cell apoptosis generated by CORT. It restores CORT-changed cell morphology to a state that is closed to normal PC12 cells. One mechanism of L1 to attenuate CORT-induced cell apoptosis is through the adjustment of both caspase-3 and Bcl-2 proteins. Like GA, both nNOS and eNOS might be involved in the neuroprotective mechanism of L1. All the evidences suggest that L1 may be a potential agent to treat depression. Full article
(This article belongs to the Section Biochemistry)
Show Figures

Graphical abstract

Graphical abstract
Full article ">Figure 1
<p>Neuroprotection of amantadine (ATD), gardenamide A (GA), <b>L1</b> and <b>L2</b> against CORT-induced toxicity in PC12 cells. PC12 cells were treated with ATD, GA, <b>L1</b> and <b>L2</b> (at a dose of 3, 10 and 30 μM), respectively for 2 h and then incubated with 800 μM CORT for another 24 h. Cells viability was determined by MTT assay. <sup>##</sup> <span class="html-italic">p</span> &lt; 0.01 <span class="html-italic">vs.</span> control group; <b>*</b> <span class="html-italic">p</span> &lt; 0.05, <b>**</b> <span class="html-italic">p</span> &lt; 0.01 <span class="html-italic">vs.</span> CORT group (<span class="html-italic">n</span> = 6).</p>
Full article ">Figure 2
<p><b>L1</b> inhibited CORT-induced ROS production. (<b>A</b>) Representative images taken by a fluorescence microscope. The images shown were representative of three experiments; (<b>B</b>) Histogram showing the ROS level in PC12 cells. PC12 cells were pretreated with or without <b>L1</b> for 2 h (at dose of 3, 10 and 30 μM, respectively), and then treated with or without 800 μM CORT for 24 h. <b>**</b> <span class="html-italic">p</span> &lt; 0.01 <span class="html-italic">vs.</span> control group; <sup>##</sup> <span class="html-italic">p</span> &lt; 0.01 <span class="html-italic">vs.</span> CORT-treated group (<span class="html-italic">n</span> = 6).</p>
Full article ">Figure 3
<p><b>L1</b> inhibited CORT-induced morphologic changes and apoptosis in PC12 cells. (<b>A</b>) <b>L1</b> restored CORT-induced morphologic changes. Representative images were taken by a fluorescence microscope. PC12 cells were pretreated with or without <b>L1</b> for 2 h (at dose of 3, 10 and 30 μM, respectively) and then treated with or without 800 μM CORT for 24 h. Cell morphology was significantly damaged by CORT exposure, which was markedly attenuated by F1. The images shown were representative of three experiments; (<b>B</b>) Representative scatter diagrams. <span class="html-italic">X</span>-axis: The intensity of Annexin V-PE; <span class="html-italic">Y</span>-axis: The intensity of Annexin V-PE. PC12 cells were pre-treated with <b>L1</b> for 2 h (at dose of 3, 10 and 30 μM, respectively) before the treatment of 800 μM CORT for another 24 h. Cells were stained with Annexin-V and PI. The apoptosis of PC12 was detected by flow cytometry.</p>
Full article ">Figure 4
<p>Effect of <b>L1</b> on caspase-3 (35 kDa) and cleaved caspase-3 (19 kDa). kDa: kilodaltons. PC12 cells were treated with <b>L1</b> (10 μM) for 2 h before exposed to CORT (800 µM) for 24 h. The levels of caspase-3 and cleaved caspase-3 expression were measured using Western Blot. The density of each lane was presented as mean ± standard deviation for at least three individual experiments. <sup>##</sup> <span class="html-italic">p</span> &lt; 0.01 <span class="html-italic">vs.</span> control group; <b>**</b> <span class="html-italic">p</span> &lt; 0.01 <span class="html-italic">vs.</span> CORT pretreated group. Blots were quantified using Image J software.</p>
Full article ">Figure 5
<p>Effect of <b>L1</b> on Bcl-2. PC12 cells were treated with <b>L1</b> (10 μM) for 2 h before exposed to CORT (800 µM) for 24 h. The expression level of Bcl-2 was measured using Western Blot. The density of each lane was presented as mean ± standard deviation for at least three individual experiments. <sup>##</sup> <span class="html-italic">p</span> &lt; 0.01 <span class="html-italic">vs</span> control group; <b>**</b> <span class="html-italic">p</span> &lt; 0.01 <span class="html-italic">vs</span> CORT pretreated group. Blots were quantified using Image J software.</p>
Full article ">Figure 6
<p>Neuroprotection of <b>L1</b> was inhibited by 7-NI and <span class="html-small-caps">l</span>-NIO. PC12 cells were pretreated with 7-NI (50 μM), and l-NIO (100 μM) for 30 min before the treatment of <b>L1</b> (30 µM) for 2 h, and then incubated with CORT (800 μM) for another 24 h. 7-NI: 7-nitroindazole; <span class="html-small-caps">l</span>-NIO: <span class="html-italic">N</span>5-(1-imino-3-butenyl)-<span class="html-small-caps">l</span>-ornithine. Cells viability were determined by MTT assay. <sup>##</sup> <span class="html-italic">p</span> &lt; 0.01 <span class="html-italic">vs.</span> control group; <b>**</b> <span class="html-italic">p</span> &lt; 0.01, <sup>&amp;&amp;</sup> <span class="html-italic">p</span> &lt; 0.01, <span class="html-italic">vs.</span> CORT group (<span class="html-italic">n</span> = 6).</p>
Full article ">Figure 7
<p>Synthesis of <b>L1</b> and <b>L2</b>. Reagents and conditions: (a) Et<sub>3</sub>N/DCM, 0 °C → r.t., 68.5%; (b) GA, <span class="html-italic">n</span>-BuLi, THF, r.t., 37.6%; (c) Pyridine, r.t., 89.0%; (d) EDCI/HOBt/DIPEA, THF, r.t., 40.6%.</p>
Full article ">
1021 KiB  
Article
Enantioselective Pharmacokinetics of ?-Lipoic Acid in Rats
by Ryota Uchida, Hinako Okamoto, Naoko Ikuta, Keiji Terao and Takashi Hirota
Int. J. Mol. Sci. 2015, 16(9), 22781-22794; https://doi.org/10.3390/ijms160922781 - 21 Sep 2015
Cited by 34 | Viewed by 6475
Abstract
?-Lipoic acid (LA) is widely used for nutritional supplements as a racemic mixture, even though the R enantiomer is biologically active. After oral administration of the racemic mixture (R-?-lipoic acid (RLA) and S-?-lipoic acid (SLA) mixed at the ratio of [...] Read more.
?-Lipoic acid (LA) is widely used for nutritional supplements as a racemic mixture, even though the R enantiomer is biologically active. After oral administration of the racemic mixture (R-?-lipoic acid (RLA) and S-?-lipoic acid (SLA) mixed at the ratio of 50:50) to rats, RLA showed higher plasma concentration than SLA, and its area under the plasma concentration-time curve from time zero to the last (AUC) was significantly about 1.26 times higher than that of SLA. However, after intravenous administration of the racemic mixture, the pharmacokinetic profiles, initial concentration (C0), AUC, and half-life (T1/2) of the enantiomers were not significantly different. After oral and intraduodenal administration of the racemic mixture to pyrolus-ligated rats, the AUCs of RLA were significantly about 1.24 and 1.32 times higher than that of SLA, respectively. In addition, after intraportal administration the AUC of RLA was significantly 1.16 times higher than that of SLA. In conclusion, the enantioselective pharmacokinetics of LA in rats arose from the fraction absorbed multiplied by gastrointestinal availability (FaFg) and hepatic availability (Fh), and not from the total clearance. Full article
(This article belongs to the Section Biochemistry)
Show Figures

Figure 1

Figure 1
<p>Structure of <span class="html-italic">R</span>-α-lipoic acid (<b>A</b>) and <span class="html-italic">S</span>-α-lipoic acid (<b>B</b>). Chiral center shown with asterisk (*).</p>
Full article ">Figure 2
<p>Representative chromatograms for α-lipoic acid chiral separation in plasma. Chromatograms shown with solid and dotted line are for α-lipoic acid and α-lipoic acid-d5 (internal standard), respectively. Blank plasma (<b>A</b>); blank plasma spiked with α-lipoic acid (5 ng of each enantiomer/mL, <b>B</b>); and blank plasma spiked with α-lipoic acid (1250 ng of each enantiomer/mL, <b>C</b>).</p>
Full article ">Figure 3
<p>Plasma concentration-time profiles of α-lipoic acid after oral (<b>A</b>) and intravenous (<b>B</b>) administration of the racemic mixture. Data are shown as mean ± standard deviation (<span class="html-italic">n</span> = 4).</p>
Full article ">Figure 4
<p>Plasma concentration-time profiles of α-lipoic acid after oral (<b>A</b>) and intraduodenal (<b>B</b>) administration of the racemic mixture to pylorus ligated rats. Data are shown as mean ± standard deviation (<span class="html-italic">n</span> = 4).</p>
Full article ">Figure 5
<p>Plasma concentration-time profiles of α-lipoic acid after intraportal administration of the racemic mixture of LA to rats. Data are shown as mean ± standard deviation (<span class="html-italic">n</span> = 4).</p>
Full article ">
1309 KiB  
Review
Interaction of DNA with Simple and Mixed Ligand Copper(II) Complexes of 1,10-Phenanthrolines as Studied by DNA-Fiber EPR Spectroscopy
by Makoto Chikira, Chew Hee Ng and Mallayan Palaniandavar
Int. J. Mol. Sci. 2015, 16(9), 22754-22780; https://doi.org/10.3390/ijms160922754 - 21 Sep 2015
Cited by 48 | Viewed by 9962
Abstract
The interaction of simple and ternary Cu(II) complexes of 1,10-phenanthrolines with DNA has been studied extensively because of their various interesting and important functions such as DNA cleavage activity, cytotoxicity towards cancer cells, and DNA based asymmetric catalysis. Such functions are closely related [...] Read more.
The interaction of simple and ternary Cu(II) complexes of 1,10-phenanthrolines with DNA has been studied extensively because of their various interesting and important functions such as DNA cleavage activity, cytotoxicity towards cancer cells, and DNA based asymmetric catalysis. Such functions are closely related to the DNA binding modes of the complexes such as intercalation, groove binding, and electrostatic surface binding. A variety of spectroscopic methods have been used to study the DNA binding mode of the Cu(II) complexes. Of all these methods, DNA-fiber electron paramagnetic resonance (EPR) spectroscopy affords unique information on the DNA binding structures of the complexes. In this review we summarize the results of our DNA-fiber EPR studies on the DNA binding structure of the complexes and discuss them together with the data accumulated by using other measurements. Full article
(This article belongs to the Special Issue Low Molecular Weight DNA and RNA Binding Agents)
Show Figures

Graphical abstract

Graphical abstract
Full article ">Figure 1
<p>Coordinate systems: <b>B</b>, static magnetic field; (X<sub>f</sub>, Y<sub>f</sub>, Z<sub>f</sub>), DNA-fiber axes; (<span class="html-italic">g</span><sub>||</sub>, <span class="html-italic">g</span><math display="inline"> <semantics> <mo>⊥</mo> </semantics> </math>), <span class="html-italic">g</span> tensor axes; Ф, the angle between <b>B</b> and Z<sub>f</sub>; θ, the angle between <span class="html-italic">g</span><sub>||</sub> axis and <span class="html-italic">Z</span><sub>f</sub>.</p>
Full article ">Figure 2
<p>DNA fiber EPR spectra calculated for a planar Cu(II) complex. (<b>a</b>) θ<sub>0</sub> = 0°; (<b>b</b>) θ<sub>0</sub> = 45°; (<b>c</b>) θ<sub>0</sub> = 90°; Δθ = 20°; <span class="html-italic">g</span><sub>||</sub> = 2.20, <span class="html-italic">g</span><math display="inline"> <semantics> <mrow> <mo>⊥</mo> <mo> </mo> </mrow> </semantics> </math> = 2.05; <span class="html-italic">A</span><sub>||</sub> =180.0 G, <math display="inline"> <semantics> <mrow> <msub> <mi>A</mi> <mo>⊥</mo> </msub> </mrow> </semantics> </math> = 10.0 G, <math display="inline"> <semantics> <mrow> <msub> <mi>A</mi> <mrow> <mi>N</mi> <mo>|</mo> <mo>|</mo> </mrow> </msub> </mrow> </semantics> </math> = 10.0 G, <math display="inline"> <semantics> <mrow> <msub> <mi>A</mi> <mrow> <mi>N</mi> <mo>⊥</mo> </mrow> </msub> </mrow> </semantics> </math> = 10.0 G; Δ<span class="html-italic">B</span><sub>||</sub> = 25.0 G, Δ<math display="inline"> <semantics> <mrow> <msub> <mi>B</mi> <mo>⊥</mo> </msub> </mrow> </semantics> </math> = 30.0 G; Microwave frequency = 9.1 GHz. (Δ<span class="html-italic">B</span><sub>||</sub> and Δ<math display="inline"> <semantics> <mrow> <msub> <mi>B</mi> <mo>⊥</mo> </msub> </mrow> </semantics> </math> are anisotropic line widths for the <span class="html-italic">g</span><sub>||</sub> and <span class="html-italic">g</span><math display="inline"> <semantics> <mrow> <mo>⊥</mo> <mo> </mo> </mrow> </semantics> </math>directions, respectively).</p>
Full article ">Figure 3
<p>1,10-phenanthroline (phen) and its methyl derivatives.</p>
Full article ">Figure 4
<p>EPR spectra of [Cu(phen)(H<sub>2</sub>O)<sub>3</sub>]<sup>2+</sup> (<b>a</b>) in frozen solution (20 mM, pH 7.0) at −150 °C, <b>S<sub>1</sub></b>: <span class="html-italic">g</span><sub>||</sub> = 2.317, <span class="html-italic">A</span><sub>||</sub> = 0.0167 cm<sup>−1</sup>, <b>S<sub>2</sub></b>: <span class="html-italic">g</span><sub>||</sub> = 2.260, <span class="html-italic">A</span><sub>||</sub> = 0.0172 cm<sup>−1</sup>; (<b>b</b>) in DNA pellet at −150 °C; and (<b>c</b>) on A-form DNA fibers at room temperature, [DNAbp]/[Cu(II)] = 25; (<b>d</b>) observed and (<b>e</b>) calculated EPR spectra of [Cu(phen)(H<sub>2</sub>O)<sub>3</sub>]<sup>2+</sup> on B-form DNA fibers at room temperature. [DNA-bp]/[Cu(II)] = 25, [<b>G</b>]/[<b>I</b>] = 2. Other parameters used for the simulation: species <b>I</b>: θ<sub>0</sub> = 6°, Δθ = 12°, Δ<span class="html-italic">B</span><sub>||</sub> <span class="html-italic">=</span> 40 G, Δ<math display="inline"> <semantics> <mrow> <msub> <mi>B</mi> <mo>⊥</mo> </msub> </mrow> </semantics> </math> = 30 G, species <b>G</b>: θ<sub>0</sub> = 30°, Δθ = 30°, Δ<span class="html-italic">B</span><sub>||</sub> <span class="html-italic">=</span> 40, Δ<math display="inline"> <semantics> <mrow> <msub> <mi>B</mi> <mo>⊥</mo> </msub> </mrow> </semantics> </math> = 40 G, [<b>G</b>]/[<b>I</b>] = 2. For both <b>I</b> and <b>G</b>, <span class="html-italic">g</span><sub>||</sub> <span class="html-italic">=</span> 2.290, <span class="html-italic">g</span> <math display="inline"> <semantics> <mrow> <mo>⊥</mo> <mo> </mo> </mrow> </semantics> </math> = 2.08, <span class="html-italic">A</span><sub>||</sub> = 0.0154 cm<sup>−1</sup>, <math display="inline"> <semantics> <mrow> <msub> <mi>A</mi> <mo>⊥</mo> </msub> </mrow> </semantics> </math> = 0.0010 cm<sup>−1</sup>, <span class="html-italic">A<sub>N</sub></span><sub>||</sub> <span class="html-italic">=</span> 0.0010 cm<sup>−1</sup>, <math display="inline"> <semantics> <mrow> <msub> <mi>A</mi> <mrow> <mi>N</mi> <mo>⊥</mo> </mrow> </msub> </mrow> </semantics> </math> = 0.0010 cm<sup>−1</sup> [<a href="#B27-ijms-16-22754" class="html-bibr">27</a>].</p>
Full article ">Figure 5
<p>EPR spectra of [Cu(2,9-dmp)(H<sub>2</sub>O)<sub>3</sub>]<sup>2+</sup> on B-form DNA fibers at (<b>a</b>) room temperature and (<b>b</b>) −150 °C. [DNA-bp]/[Cu(II)] = 30 [<a href="#B27-ijms-16-22754" class="html-bibr">27</a>].</p>
Full article ">Figure 6
<p>Optimized structure of (<b>a</b>) [Cu(phen)(H<sub>2</sub>O)<sub>3</sub>]<sup>2+</sup> and (<b>b</b>) [Cu(2,9-dmp)(H<sub>2</sub>O)<sub>3</sub>]<sup>2+</sup>. The color of the atoms: orange, Cu; blue, N; red, O; gray, C; white, H.</p>
Full article ">Figure 7
<p>Ternary [Cu(phen)(AA)]<sup>+</sup> complexes with amino acids (AA).</p>
Full article ">Figure 8
<p>Observed (<b>a</b>) and calculated (<b>b</b>) EPR spectra of [Cu(phen)(Lys)]<sup>2+</sup> on B-form DNA fibers at room temperature. [DNA-bp]/[Cu(II)] = 30, species <b>I</b>: <span class="html-italic">g</span><sub>||</sub> = 2.23, <span class="html-italic">g</span><math display="inline"> <semantics> <mrow> <mo>⊥</mo> <mo> </mo> </mrow> </semantics> </math> = 2.07, <span class="html-italic">A</span><sub>||</sub> = 0.0177 cm<sup>−1</sup>, <math display="inline"> <semantics> <mrow> <msub> <mi>A</mi> <mo>⊥</mo> </msub> </mrow> </semantics> </math> = 0.0015 cm<sup>−1</sup>, <span class="html-italic">A<sub>N</sub></span><sub>||</sub> = 0.0010 cm<sup>−1</sup>, <math display="inline"> <semantics> <mrow> <msub> <mi>A</mi> <mrow> <mi>N</mi> <mo>⊥</mo> </mrow> </msub> </mrow> </semantics> </math> = 0.0010 cm<sup>−1</sup>, θ = 3°, Δθ = 15°, Δ<span class="html-italic">B</span><sub>||</sub> = 25 G, Δ<math display="inline"> <semantics> <mrow> <msub> <mi>B</mi> <mo>⊥</mo> </msub> </mrow> </semantics> </math> = 30 G. Species <b>G</b>: <span class="html-italic">g</span><sub>||</sub> = 2.235, <span class="html-italic">g</span> <math display="inline"> <semantics> <mrow> <mo>⊥</mo> <mo> </mo> </mrow> </semantics> </math> = 2.07, <span class="html-italic">A</span><sub>||</sub> = 0.0172 cm<sup>−1</sup>, <math display="inline"> <semantics> <mrow> <msub> <mi>A</mi> <mo>⊥</mo> </msub> </mrow> </semantics> </math> = 0.0013 cm<sup>−1</sup>, <span class="html-italic">A<sub>N</sub></span><sub>||</sub> = 0.0010 cm<sup>−1</sup>, <math display="inline"> <semantics> <mrow> <msub> <mi>A</mi> <mrow> <mi>N</mi> <mo>⊥</mo> </mrow> </msub> </mrow> </semantics> </math> = 0.0010 cm<sup>−1</sup>, θ = 30°, Δθ = 30°, Δ<span class="html-italic">B</span><sub>||</sub> = 45 G, Δ<math display="inline"> <semantics> <mrow> <msub> <mi>B</mi> <mo>⊥</mo> </msub> </mrow> </semantics> </math> = 45 G. [<b>G</b>]/[<b>I</b>] = 2 [<a href="#B27-ijms-16-22754" class="html-bibr">27</a>].</p>
Full article ">Figure 9
<p><span class="html-italic">N</span>,<span class="html-italic">N</span>′-dialkyl-1,10-phenanthroline-2,9-dimethanamine (L). <span class="html-italic">R</span> = methyl (<b>1</b>); <span class="html-italic">n</span>-propyl (<b>2</b>); isopropyl (<b>3</b>); <span class="html-italic">sec</span>-butyl (<b>4</b>); <span class="html-italic">tert</span>-butyl group (<b>5</b>). Numbers in the parentheses correspond to the respective Cu(II) complexes.</p>
Full article ">Figure 10
<p>EPR spectra of <b>5</b> on B-form DNA-fibers at (<b>a</b>) room temperature and (<b>b</b>) −150 °C [<a href="#B28-ijms-16-22754" class="html-bibr">28</a>]. S3 is the overlapped <span class="html-italic">g</span><sub>||</sub> signal of S<sub>1</sub> and S<sub>2</sub>.</p>
Full article ">Figure 11
<p>EPR spectra of [Cu(phen)<sub>2</sub>(H<sub>2</sub>O)]<sup>2+</sup> on DNA fibers at room temperature: (<b>a</b>) A-form; (<b>b</b>) B-form [<a href="#B28-ijms-16-22754" class="html-bibr">28</a>].</p>
Full article ">Figure 12
<p>ORTEP view of ternary Copper(II)-phen-edda Complex [Cu(phen)(edda)] [<a href="#B25-ijms-16-22754" class="html-bibr">25</a>].</p>
Full article ">Figure 13
<p>EPR spectra of [Cu(phen)(edda)] (<b>a</b>) in frozen solution at −150 °C; (<b>b</b>) in DNA-pellet at −150 °C; and (<b>c</b>) in A-form DNA fiber at room temperature. Ф is the angle between the fiber axis and the static magnetic field [<a href="#B25-ijms-16-22754" class="html-bibr">25</a>].</p>
Full article ">Figure 14
<p>EPR spectra of [Cu(phen)(edda)] in B-form DNA fiber at (<b>a</b>) room temperature and (<b>b</b>) −150 °C [<a href="#B25-ijms-16-22754" class="html-bibr">25</a>].</p>
Full article ">Figure 15
<p>Ternary Cu(II) complexes of cationic Schiff base and diimines. The numbers correspond to the respective Cu(II) complexes [<a href="#B60-ijms-16-22754" class="html-bibr">60</a>].</p>
Full article ">Figure 16
<p>B-form DNA-fiber EPR spectra of (<b>a</b>) <b>1</b>, (<b>b</b>) <b>2</b> and (<b>c</b>) <b>3</b> at room temperature [<a href="#B60-ijms-16-22754" class="html-bibr">60</a>]. Φ is the angle between the static magnetic field and the DNA double-helical axis. The DNA fibers were prepared using the buffer solution (20 mM HEPES, 30 mM NaCl (pH 7.4)). [DNA-bp]/[complex] = 20.</p>
Full article ">Figure 17
<p>Proposed structural change in ternary Cu(II) complexes of cationic Schiff base and diimines on binding to DNA [<a href="#B60-ijms-16-22754" class="html-bibr">60</a>]. (<b>A</b>) Structure of the complex in crystal; (<b>B</b>) Structure of the complex intercalated to DNA.</p>
Full article ">Figure 18
<p>Observed (<b>a</b>) and calculated (<b>b</b>) EPR spectra of [Cu(bpy)(H<sub>2</sub>O)<sub>3</sub>] on B-form DNA fibers at room temperature. [DNA-bp]/[Cu(II)] = 25, species <b>A</b>: θ = 40°, Δθ = 20°; species <b>B</b>: randomly oriented. For both <b>A</b> and <b>B</b>, <span class="html-italic">g</span><sub>||</sub> = 2.280, <span class="html-italic">g</span><math display="inline"> <semantics> <mrow> <mo>⊥</mo> <mo> </mo> </mrow> </semantics> </math> = 2.08, <span class="html-italic">A</span><sub>||</sub> = 0.0149 cm<sup>−1</sup>, <math display="inline"> <semantics> <mrow> <msub> <mi>A</mi> <mo>⊥</mo> </msub> </mrow> </semantics> </math> = 0.0010 cm<sup>−1</sup><span class="html-italic">A</span><sub>N||</sub> = 0.0010 cm<sup>−1</sup>, <math display="inline"> <semantics> <mrow> <msub> <mi>A</mi> <mrow> <mi>N</mi> <mo>⊥</mo> </mrow> </msub> </mrow> </semantics> </math> = 0.0010 cm<sup>−1</sup>, Δ<span class="html-italic">B</span><sub>||</sub> = 40 G, Δ<math display="inline"> <semantics> <mrow> <msub> <mi>B</mi> <mo>⊥</mo> </msub> </mrow> </semantics> </math> = 40 G [<a href="#B27-ijms-16-22754" class="html-bibr">27</a>].</p>
Full article ">
1323 KiB  
Article
Effects of Non-Natural Amino Acid Incorporation into the Enzyme Core Region on Enzyme Structure and Function
by H. Edward Wong and Inchan Kwon
Int. J. Mol. Sci. 2015, 16(9), 22735-22753; https://doi.org/10.3390/ijms160922735 - 21 Sep 2015
Cited by 6 | Viewed by 6916
Abstract
Techniques to incorporate non-natural amino acids (NNAAs) have enabled biosynthesis of proteins containing new building blocks with unique structures, chemistry, and reactivity that are not found in natural amino acids. It is crucial to understand how incorporation of NNAAs affects protein function because [...] Read more.
Techniques to incorporate non-natural amino acids (NNAAs) have enabled biosynthesis of proteins containing new building blocks with unique structures, chemistry, and reactivity that are not found in natural amino acids. It is crucial to understand how incorporation of NNAAs affects protein function because NNAA incorporation may perturb critical function of a target protein. This study investigates how the site-specific incorporation of NNAAs affects catalytic properties of an enzyme. A NNAA with a hydrophobic and bulky sidechain, 3-(2-naphthyl)-alanine (2Nal), was site-specifically incorporated at six different positions in the hydrophobic core of a model enzyme, murine dihydrofolate reductase (mDHFR). The mDHFR variants with a greater change in van der Waals volume upon 2Nal incorporation exhibited a greater reduction in the catalytic efficiency. Similarly, the steric incompatibility calculated using RosettaDesign, a protein stability calculation program, correlated with the changes in the catalytic efficiency. Full article
(This article belongs to the Special Issue Protein Engineering)
Show Figures

Graphical abstract

Graphical abstract
Full article ">Figure 1
<p>Confirmation of <span class="html-italic">in vivo</span> 2Nal incorporation by MALDI-TOF/MS analysis. The MS spectra of a tryptic digest (residues 133–147) for (<b>A</b>) mDHFR<sup>WT</sup>; (<b>B</b>) mDHFR<sup>F134Z</sup>; and (<b>C</b>) mDHFR<sup>V135Z</sup>. The peak corresponding to the 2Nal-containing digest is indicated by the arrow (<b>B</b>,<b>C</b>). The counterpart mDHFR<sup>WT</sup> fragment with the native residue is marked by an arrow (<b>A</b>). The residue numbering corresponds to PDB ID: 2W3M. The horizontal bar indicates the mass difference between the 2Nal-containing fragment and corresponding mDHFR<sup>WT</sup> fragment with the native residue. a.u. denotes arbitrary units.</p>
Full article ">
3582 KiB  
Article
The Use of a Liposomal Formulation Incorporating an Antimicrobial Peptide from Tilapia as a New Adjuvant to Epirubicin in Human Squamous Cell Carcinoma and Pluripotent Testicular Embryonic Carcinoma Cells
by Yu-Li Lo, Hsin-Pin Lee and Wei-Chen Tu
Int. J. Mol. Sci. 2015, 16(9), 22711-22734; https://doi.org/10.3390/ijms160922711 - 18 Sep 2015
Cited by 13 | Viewed by 6357
Abstract
This study aims to explore the effects and mechanisms of hepcidin, a potential antimicrobial peptide from Tilapia, and epirubicin (Epi), an antineoplastic agent, on the generation of reactive oxygen species (ROS) and link the ROS levels to the reversal mechanisms of multidrug resistance [...] Read more.
This study aims to explore the effects and mechanisms of hepcidin, a potential antimicrobial peptide from Tilapia, and epirubicin (Epi), an antineoplastic agent, on the generation of reactive oxygen species (ROS) and link the ROS levels to the reversal mechanisms of multidrug resistance (MDR) by epirubicin and hepcidin in human squamous cell carcinoma SCC15 and human embryonal carcinoma NT2D1 cells. The cells, pretreated with hepcidin, epirubicin, or a combination of these compounds in PEGylated liposomes, were used to validate the molecular mechanisms involved in inhibiting efflux transporters and inducing apoptosis as evaluated by cytotoxicity, intracellular accumulation, mRNA levels, cell cycle distribution, and caspase activity of this combination. We found that hepcidin significantly enhanced the cytotoxicity of epirubicin in liposomes. The co-incubation of epirubicin with hepcidin in liposomes intensified the ROS production, including hydrogen peroxide and superoxide free radicals. Hepcidin significantly increased epirubicin intracellular uptake into NT2D1 and SCC15 cells, as supported by the diminished mRNA expressions of MDR1, MDR-associated protein (MRP) 1, and MRP2. Hepcidin and/or epirubicin in liposomes triggered apoptosis, as verified by the reduced mitochondrial membrane potential, increased sub-G1 phase of cell cycle, incremental populations of apoptosis using annexin V/PI assay, and chromatin condensation. As far as we know, this is the first example showing that PEGylated liposomal TH1-5 and epirubicin gives rise to cell death in human squamous carcinoma and testicular embryonic carcinoma cells through the reduced epirubicin efflux via ROS-mediated suppression of P-gp and MRPs and concomitant initiation of mitochondrial apoptosis pathway. Hence, hepcidin in PEGylated liposomes may function as an adjuvant to anticancer drugs, thus demonstrating a novel strategy for reversing MDR. Full article
(This article belongs to the Special Issue Bioactivity of Marine Natural Products)
Show Figures

Graphical abstract

Graphical abstract
Full article ">Figure 1
<p>A schematic diagram of the formation of PEGylated liposomes containing epirubicin (Epi) and/or hepcidin 1-5 (TH1-5).</p>
Full article ">Figure 2
<p>The effect of TH1-5 at different concentrations on the cell viability of (<b>A</b>) HeLa; (<b>B</b>) SCC-15; and (<b>C</b>) NT2D1 cells. Data are presented as means ± standard deviation (S.D.) from three independent experiments. Each experiment was conducted in triplicate. <b>**</b> <span class="html-italic">p</span> &lt; 0.01; <b>***</b> <span class="html-italic">p</span> &lt; 0.001 compared to the control (CTR).</p>
Full article ">Figure 3
<p>The effect of TH1-5 on the cytotoxicity of Epi in (<b>A</b>) SCC15 and (<b>C</b>) NT2D1 cells. ●: Epi alone; ▽: Epi plus TH1-5. In addition, the effect of different treatments on the cell viability of (<b>B</b>) SCC15 and (<b>D</b>) NT2D1 cells. Each experiment was conducted in triplicate. Data are presented as means ± S.D. from three independent experiments. <b>*</b> <span class="html-italic">p</span> &lt; 0.05 compared to CTR; <sup>+</sup> <span class="html-italic">p</span> &lt; 0.05 compared to Epi; <sup>Ψ</sup> <span class="html-italic">p</span> &lt; 0.05 compared to TH1-5; <sup>#</sup> <span class="html-italic">p</span> &lt; 0.05 compared to Epi+TH1-5; <sup>&amp;</sup> <span class="html-italic">p</span> &lt; 0.05 compared to Lip-Epi; <sup>Φ</sup> <span class="html-italic">p</span> &lt; 0.05 compared with Lip-TH1-5.</p>
Full article ">Figure 3 Cont.
<p>The effect of TH1-5 on the cytotoxicity of Epi in (<b>A</b>) SCC15 and (<b>C</b>) NT2D1 cells. ●: Epi alone; ▽: Epi plus TH1-5. In addition, the effect of different treatments on the cell viability of (<b>B</b>) SCC15 and (<b>D</b>) NT2D1 cells. Each experiment was conducted in triplicate. Data are presented as means ± S.D. from three independent experiments. <b>*</b> <span class="html-italic">p</span> &lt; 0.05 compared to CTR; <sup>+</sup> <span class="html-italic">p</span> &lt; 0.05 compared to Epi; <sup>Ψ</sup> <span class="html-italic">p</span> &lt; 0.05 compared to TH1-5; <sup>#</sup> <span class="html-italic">p</span> &lt; 0.05 compared to Epi+TH1-5; <sup>&amp;</sup> <span class="html-italic">p</span> &lt; 0.05 compared to Lip-Epi; <sup>Φ</sup> <span class="html-italic">p</span> &lt; 0.05 compared with Lip-TH1-5.</p>
Full article ">Figure 4
<p>The effect of Epi and/or TH1-5 in free or liposomal formulations for 24 h on (<b>A</b>,<b>B</b>) hydrogen peroxide (H<sub>2</sub>O<sub>2</sub>) and (<b>C</b>,<b>D</b>) superoxide (O<sub>2</sub><sup>−</sup>) production in (<b>A</b>,<b>C</b>) SCC15 and (<b>B</b>,<b>D</b>) NT2D1 cells. Means ± S.D. from three independent experiments are shown. In (<b>A</b>,<b>B</b>), mean DCF fluorescence intensity of cell control was normalized as 100%; In (<b>C</b>,<b>D</b>), mean EtBr fluorescence intensity of cell control was normalized as 100%. Data are presented as means ± S.D. from three independent experiments. <b>*</b> <span class="html-italic">p</span> &lt; 0.05 compared to CTR; <sup>+</sup> <span class="html-italic">p</span> &lt; 0.05 compared to Epi; <sup>Ψ</sup> <span class="html-italic">p</span> &lt; 0.05 compared to TH1-5; <sup>#</sup> <span class="html-italic">p</span> &lt; 0.05 compared to Epi+TH1-5; <sup>&amp;</sup> <span class="html-italic">p</span> &lt; 0.05 compared to Lip-Epi; <sup>Φ</sup> <span class="html-italic">p</span> &lt; 0.05 compared with Lip-TH1-5.</p>
Full article ">Figure 5
<p>The effect of different treatments on the expression ratio of the MDR pump-related genes including MDR1, MRP1, and MRP2 in (<b>A</b>) SCC15 and (<b>B</b>) NT2D1 cells. Each experiment was conducted in triplicate. <b>*</b> <span class="html-italic">p</span> &lt; 0.05 compared to CTR; <sup>+</sup> <span class="html-italic">p</span> &lt; 0.05 compared to Epi; <sup>Ψ</sup> <span class="html-italic">p</span> &lt; 0.05 compared to TH1-5; <sup>#</sup> <span class="html-italic">p</span> &lt; 0.05 compared to Epi+TH1-5; <sup>&amp;</sup> <span class="html-italic">p</span> &lt; 0.05 compared to Lip-Epi; <sup>Φ</sup> <span class="html-italic">p</span> &lt; 0.05 compared with Lip-TH1-5.</p>
Full article ">Figure 6
<p>The effect of different treatments on the intracellular accumulation of fluorescent Epi in (<b>A</b>,<b>B</b>) SCC15 and (<b>C</b>,<b>D</b>) NT2D1 cells. The cells were pretreated with TH1-5 and/or Epi in free or liposomal formulations for 24 h. Three-dimensional view of cell number <span class="html-italic">versus</span> fluorescence intensity of epirubicin in (<b>A</b>) SCC15 or (<b>C</b>) NT2D1 cells is shown. The representative plots of flow cytometric analysis are displayed. In (<b>B</b>,<b>D</b>), the mean fluorescence intensity of epirubicin was normalized as 100%. Mean fluorescence intensity levels of other treatments were compared to the value of Epi. Data are presented as means ± S.D. from three independent experiments. <b>*</b> <span class="html-italic">p</span> &lt; 0.05 compared to CTR; <sup>+</sup> <span class="html-italic">p</span> &lt; 0.05 compared to Epi; <sup>Ψ</sup> <span class="html-italic">p</span> &lt; 0.05 compared to TH1-5; <sup>#</sup> <span class="html-italic">p</span> &lt; 0.05 compared to Epi+TH1-5; <sup>&amp;</sup> <span class="html-italic">p</span> &lt; 0.05 compared to Lip-Epi; <sup>Φ</sup> <span class="html-italic">p</span> &lt; 0.05 compared with Lip-TH1-5.</p>
Full article ">Figure 7
<p>The effect of different treatments on the mitochondrial membrane potential of (<b>A</b>) SCC15 and (<b>B</b>) NT2D1 cells. Additionally, the effect of different treatments on the cell cycle distribution of (<b>C</b>) SCC15 and (<b>D</b>) NT2D1 cells. Data are presented as means ± S.D. from three independent experiments. <b>*</b> <span class="html-italic">p</span> &lt; 0.05 compared to CTR; <sup>+</sup> <span class="html-italic">p</span> &lt; 0.05 compared to Epi; <sup>Ψ</sup> <span class="html-italic">p</span> &lt; 0.05 compared to TH1-5; <sup>#</sup> <span class="html-italic">p</span> &lt; 0.05 compared to Epi+TH1-5; <sup>&amp;</sup> <span class="html-italic">p</span> &lt; 0.05 compared to Lip-Epi; <sup>Φ</sup> <span class="html-italic">p</span> &lt; 0.05 compared with Lip-TH1-5.</p>
Full article ">Figure 8
<p>Quantitative analysis of cell apoptosis and necrosis induced by different treatments in (<b>A</b>) SCC15 and (<b>B</b>) NT2D1 cells. The cells were incubated with different treatments for 24h and stained with Annexin-V (AnnV) and propidium iodide (PI). Viable, apoptotic, and necrotic cells were then analyzed and quantified by a flow cytometer using an AnnV/PI staining kit. The percentage of early (AnnV<sup>+</sup>PI<sup>−</sup>) or late apoptotic (AnnV<sup>+</sup>PI<sup>+</sup>) are shown. Data are presented as means ± S.D. from three independent experiments.</p>
Full article ">Figure 8 Cont.
<p>Quantitative analysis of cell apoptosis and necrosis induced by different treatments in (<b>A</b>) SCC15 and (<b>B</b>) NT2D1 cells. The cells were incubated with different treatments for 24h and stained with Annexin-V (AnnV) and propidium iodide (PI). Viable, apoptotic, and necrotic cells were then analyzed and quantified by a flow cytometer using an AnnV/PI staining kit. The percentage of early (AnnV<sup>+</sup>PI<sup>−</sup>) or late apoptotic (AnnV<sup>+</sup>PI<sup>+</sup>) are shown. Data are presented as means ± S.D. from three independent experiments.</p>
Full article ">Figure 9
<p>The effect of different treatments on the expression ratios of the apoptosis-related genes encoding Bax, Bcl-2, and p53 in (<b>A</b>) SCC15 and (<b>C</b>) NT2D1 cells, as measured by quantitative real-time PCR. Each experiment was conducted in triplicate. The effect of different treatments on the ratio of Bax: Bcl-2 mRNA expressions in (<b>B</b>) SCC15 and (<b>D</b>) NT2D1 cells. ●: ratio of Bax: Bcl-2 expression; <b>*</b> <span class="html-italic">p</span> &lt; 0.05 compared to CTR; <sup>+</sup> <span class="html-italic">p</span> &lt; 0.05 compared to Epi; <sup>Ψ</sup> <span class="html-italic">p</span> &lt; 0.05 compared to TH1-5; <sup>#</sup> <span class="html-italic">p</span> &lt; 0.05 compared to Epi+TH1-5; <sup>&amp;</sup> <span class="html-italic">p</span> &lt; 0.05 compared to Lip-Epi; <sup>Φ</sup> <span class="html-italic">p</span> &lt; 0.05 compared with Lip-TH1-5.</p>
Full article ">Figure 10
<p>(<b>A</b>) The effect of different treatments on the expression ratio of the apoptosis-related genes encoding Caspase-3, Caspase-8, and Caspase-9 in (<b>A</b>) SCC15 and (<b>C</b>) NT2D1. The effect of different treatments on the activity levels of Caspase-3, Caspase-8, and Caspase-9 in (<b>B</b>) SCC15 and (<b>D</b>) NT2D1. The Caspase-Glo 3/7, Caspase-Glo 8, and Caspase-Glo 9 reagent was added directly to cells and incubated at room temperature before recording luminescence with a luminometer. Each experiment was conducted in triplicate. <b>*</b> <span class="html-italic">p</span> &lt; 0.05 compared to CTR; <sup>+</sup> <span class="html-italic">p</span> &lt; 0.05 compared to Epi; <sup>Ψ</sup> <span class="html-italic">p</span> &lt; 0.05 compared to TH1-5; <sup>#</sup> <span class="html-italic">p</span> &lt; 0.05 compared to Epi+TH1-5; <sup>&amp;</sup> <span class="html-italic">p</span> &lt; 0.05 compared to Lip-Epi; <sup>Φ</sup> <span class="html-italic">p</span> &lt; 0.05 compared with Lip-TH1-5.</p>
Full article ">Figure 11
<p>Nuclear chromatin condensation in NT2D1 cells by different treatments; after treatment with TH1-5 and/or Epi in free or liposomal formulations for 24 h, cells were mixed with acridine orange (AO). Apoptosis cells were distinguished through chromosomes using Nikon fluorescence microscopy. The images were visualized using an inverted microscope (Eclipse TS-100) equipped with a fluorescence image capture device (C-SHG; Nikon) controlled with an Image-Pro Plus software. (<b>A</b>) CTR; (<b>B</b>) Liposome; (<b>C</b>) Epi; (<b>D</b>) Lip-Epi; (<b>E</b>) TH1-5; (<b>F</b>) Lip-TH1-5; (<b>G</b>) Epi+TH1-5; (<b>H</b>) Lip-Epi+TH1-5.</p>
Full article ">Figure 12
<p>Proposed pathway for reversing pump and non-pump MDR in SCC15 and NT2D1 cells.</p>
Full article ">
2480 KiB  
Article
Transcriptome Analysis Revealed the Embryo-Induced Gene Expression Patterns in the Endometrium from Meishan and Yorkshire Pigs
by Jiangnan Huang, Ruize Liu, Lijie Su, Qian Xiao and Mei Yu
Int. J. Mol. Sci. 2015, 16(9), 22692-22710; https://doi.org/10.3390/ijms160922692 - 18 Sep 2015
Cited by 15 | Viewed by 5912
Abstract
The expression patterns in Meishan- and Yorkshire-derived endometrium during early (gestational day 15) and mid-gestation (gestational days 26 and 50) were investigated, respectively. Totally, 689 and 1649 annotated genes were identified to be differentially expressed in Meishan and Yorkshire endometrium during the three [...] Read more.
The expression patterns in Meishan- and Yorkshire-derived endometrium during early (gestational day 15) and mid-gestation (gestational days 26 and 50) were investigated, respectively. Totally, 689 and 1649 annotated genes were identified to be differentially expressed in Meishan and Yorkshire endometrium during the three gestational stages, respectively. Hierarchical clustering analysis identified that, of the annotated differentially expressed genes (DEGs), 73 DEGs were unique to Meishan endometrium, 536 DEGs were unique to Yorkshire endometrium, and 228 DEGs were common in Meishan and Yorkshire endometriums. Subsequently, DEGs in each of the three types of expression patterns were grouped into four distinct categories according to the similarities in their temporal expression patterns. The expression patterns identified from the microarray analysis were validated by quantitative RT-PCR. The functional enrichment analysis revealed that the common DEGs were enriched in pathways of steroid metabolic process and regulation of retinoic acid receptor signaling. These unique DEGs in Meishan endometrium were involved in cell cycle and adherens junction. The DEGs unique to Yorkshire endometrium were associated with regulation of Rho protein signal transduction, maternal placenta development and cell proliferation. This study revealed the different gene expression patterns or pathways related to the endometrium remodeling in Meishan and Yorkshire pigs, respectively. These unique DEGs in either Meishan or Yorkshire endometriums may contribute to the divergence of the endometrium environment in the two pig breeds. Full article
(This article belongs to the Section Biochemistry)
Show Figures

Graphical abstract

Graphical abstract
Full article ">Figure 1
<p>Venn diagram illustration of endometrial genes changed between days 15 and 26 of gestation and days 26 and 50 of gestation in Meishan and Yorkshire pigs. M15, Meishan pigs on day 15 of gestation. M26, Meishan pigs on day 26 of gestation. M50, Meishan pigs on day 50 of gestation. Y15, Yorkshire pigs on day 15 of gestation. Y26, Yorkshire pigs on day 26 of gestation. Y50, Yorkshire pigs on day 50 of gestation. DEGs as defined by FDR &lt; 0.05 and FC ≥ 2.</p>
Full article ">Figure 2
<p>Dynamic progression of the common DEGs in the Meishan and Yorkshire endometrium. (<b>A</b>) Unsupervised hierarchical clustering of the 228 annotated common DEGs in the Meishan and Yorkshire endometrium. The common DEGs were clustered into four groups. Red region, genes up-regulated in the endometrium; green region, genes down-regulated in the endometrium. M15, Meishan pigs on day 15 of gestation; M26, Meishan pigs on day 26 of gestation; M50, Meishan pigs on day 50 of gestation; Y15, Yorkshire pigs on day 15 of gestation; Y26, Yorkshire pigs on day 26 of gestation; Y50, Yorkshire pigs on day 50 of gestation; (<b>B</b>) Functional categories distribution of the common DEGs in the Meishan and Yorkshire endometrium.</p>
Full article ">Figure 3
<p>The network of the common DEGs in Meishan and Yorkshire endometrium on gestational day 15, 26 and 50.The genes are represented as diamond. Biological processes are represented as circles. The lines represent the potential connections between the different genes belonging to the different biological process. Red nodes represent genes that have intensive expression on gestational day 15. Blue nodes represent genes represent genes that have intensive expression on gestational day 50. Green nodes represent genes that have intensive expression on gestational day 26 and 50. Purple nodes represent genes represent genes that have intensive expression on gestational day 26.</p>
Full article ">Figure 4
<p>Dynamic of unique DEGs in Meishan endometriums. (<b>A</b>) Unsupervised hierarchical clustering of the 73 DEGs unique to Meishan endometrium. DEGs were clustered into four groups. Red region, genes up-regulated in the endometrium, green region, genes down-regulated in the endometrium. M15, Meishan pigs on day 15 of gestation; M26, Meishan pigs on day 26 of gestation; M50, Meishan pigs on day 50 of gestation; (<b>B</b>) Functional categories distribution of the unique DEGs in the Meishan endometrium.</p>
Full article ">Figure 5
<p>The network of the DEGs unique to Meishan endometrium on gestational days 15, 26 and 50. The genes are represented as diamond. Biological processes are represented as circles. The lines represent the potential connections between different genes belonging to different biological process. Red nodes represent genes up-regulated on gestational day 26. Green nodes represent genes highly expressed on gestational day 15.</p>
Full article ">Figure 6
<p>Dynamic progression of the unique DEGs in Yorkshire endometrium. (<b>A</b>) Unsupervised hierarchical clustering of 536 differentially expressed genes unique to Yorkshire endometrium. DEGs were clustered into four groups. Red region, genes up-regulated in the endometrium; green region, genes down-regulated in the endometrium. Y15, Yorkshire pigs on day 15 of gestation; Y26, Yorkshire pigs on day 26 of gestation; Y50, Yorkshire pigs on day 50 of gestation; (<b>B</b>) Functional categories distribution of unique DEGs in the Yorkshire endometrium.</p>
Full article ">Figure 7
<p>The network of the DEGs unique to Yorkshire endometrium on gestational days 15, 26 and 50. The genes are represented as circles. Biological processes are represented as diamonds. The lines represent the potential regulation relationships between genes or connections between different genes belonging to different biological process. Red nodes represent genes that have intensive expression on gestational day 26 and 50. Blue nodes represent genes that have intensive expression on gestational day 26. Green nodes represent genes that have intensive expression on gestational day 15. Purple nodes represent genes that have intensive expression on gestational day 50.</p>
Full article ">Figure 8
<p>Validation of the expression levels of 13 representative genes by quantitative RT-PCR. The <span class="html-italic">x</span>-axis represents the different stages and breeds and the <span class="html-italic">y</span>-axis shows the fold changes in expression (** <span class="html-italic">p</span> &lt; 0.01, * <span class="html-italic">p</span> &lt; 0.05). (<b>A</b>) <span class="html-italic">HMOX1</span> gene; (B) <span class="html-italic">PRLR</span> gene; (<b>C</b>) <span class="html-italic">HSD17B2</span> gene; (<b>D</b>) <span class="html-italic">THBS1</span> gene; (<b>E</b>) <span class="html-italic">STAT1</span> gene; (<b>F</b>) <span class="html-italic">LIF</span> gene; (<b>G</b>) <span class="html-italic">BMP4</span> gene; (<b>H</b>) <span class="html-italic">MSX1</span> gene; (<b>I</b>) <span class="html-italic">IGFBP3</span> gene; (<b>J</b>) <span class="html-italic">STC1</span> gene; (<b>K</b>) <span class="html-italic">ITGB3</span> gene; (<b>L</b>) <span class="html-italic">MMP7</span> gene; (<b>M</b>) <span class="html-italic">S100A9</span> gene.</p>
Full article ">
2262 KiB  
Article
Poncirin Induces Apoptosis in AGS Human Gastric Cancer Cells through Extrinsic Apoptotic Pathway by up-Regulation of Fas Ligand
by Venu Venkatarame Gowda Saralamma, Arulkumar Nagappan, Gyeong Eun Hong, Ho Jeong Lee, Silvia Yumnam, Suchismita Raha, Jeong Doo Heo, Sang Joon Lee, Won Sup Lee, Eun Hee Kim and Gon Sup Kim
Int. J. Mol. Sci. 2015, 16(9), 22676-22691; https://doi.org/10.3390/ijms160922676 - 18 Sep 2015
Cited by 36 | Viewed by 9606
Abstract
Poncirin, a natural bitter flavanone glycoside abundantly present in many species of citrus fruits, has various biological benefits such as anti-oxidant, anti-microbial, anti-inflammatory and anti-cancer activities. The anti-cancer mechanism of Poncirin remains elusive to date. In this study, we investigated the anti-cancer effects [...] Read more.
Poncirin, a natural bitter flavanone glycoside abundantly present in many species of citrus fruits, has various biological benefits such as anti-oxidant, anti-microbial, anti-inflammatory and anti-cancer activities. The anti-cancer mechanism of Poncirin remains elusive to date. In this study, we investigated the anti-cancer effects of Poncirin in AGS human gastric cancer cells (gastric adenocarcinoma). The results revealed that Poncirin could inhibit the proliferation of AGS cells in a dose-dependent manner. It was observed Poncirin induced accumulation of sub-G1 DNA content, apoptotic cell population, apoptotic bodies, chromatin condensation, and DNA fragmentation in a dose-dependent manner in AGS cells. The expression of Fas Ligand (FasL) protein was up-regulated dose dependently in Poncirin-treated AGS cells Moreover, Poncirin in AGS cells induced activation of Caspase-8 and -3, and subsequent cleavage of poly(ADP-ribose) polymerase (PARP). Inhibitor studies’ results confirm that the induction of caspase-dependent apoptotic cell death in Poncirin-treated AGS cells was led by the Fas death receptor. Interestingly, Poncirin did not show any effect on mitochondrial membrane potential (??m), pro-apoptotic proteins (Bax and Bak) and anti-apoptotic protein (Bcl-xL) in AGS-treated cells followed by no activation in the mitochondrial apoptotic protein caspase-9. This result suggests that the mitochondrial-mediated pathway is not involved in Poncirin-induced cell death in gastric cancer. These findings suggest that Poncirin has a potential anti-cancer effect via extrinsic pathway-mediated apoptosis, possibly making it a strong therapeutic agent for human gastric cancer. Full article
Show Figures

Graphical abstract

Graphical abstract
Full article ">Figure 1
<p>Growth inhibition by Poncirin in AGS human gastric cancer cells (<b>A</b>) Chemical structure of Poncirin; (<b>B</b>) AGS cells were incubated at indicated concentrations of Poncirin for 24 h. The cell viability was analyzed by 3-(4,5-dimethylthiazol-2-yl)-2,5-diphenyltetrazolium bromide (MTT) assay. The data are shown as means ± standard deviation (SD) of three independent experiments (* <span class="html-italic">p</span> &lt; 0.05 and ** <span class="html-italic">p</span> &lt; 0.01 <span class="html-italic">vs.</span> control).</p>
Full article ">Figure 2
<p>Induction of apoptosis by Poncirin in AGS cells. AGS cells were incubated at indicated concentrations of Poncirin for 24 h. (<b>A</b>) Cell cycle analysis and sub-G1 DNA content determination by flow cytometry (M1-Sub-G1, M2-G0/G1, M3-S, M4-G2M phase of cell) (<b>B</b>) DAPI staining showing nuclear condensation and fragmentation. White arrows showing bright blue regions indicate nuclear condensation in AGS cells. The data are shown as means ± SD of three independent experiments. (* <span class="html-italic">p</span> &lt; 0.05 and ** <span class="html-italic">p</span> &lt; 0.01 <span class="html-italic">vs.</span> control).</p>
Full article ">Figure 3
<p>Poncirin induces dose dependent apoptosis in AGS cells. AGS cells were incubated at indicated concentrations of Poncirin for 24 h. (<b>A</b>,<b>B</b>) Annexin V-Propidium Iodide staining followed by apoptosis detection by flow cytometry; and (<b>C</b>) DNA fragmentation test of untreated and Poncirin-treated AGS cells indicates internucleosomal cleavage associated with apoptosis. The data are shown as means ± SD of three independent experiments (* <span class="html-italic">p</span> &lt; 0.05 and ** <span class="html-italic">p</span> &lt; 0.01 <span class="html-italic">vs.</span> control).</p>
Full article ">Figure 4
<p>Activation of caspases, subsequent cleavage of PARP and up-regulation of Fas ligand in the Poncirin treated AGS cells. AGS cells were incubated at indicated concentrations of Poncirin for 24 h. Western blot analysis was conducted to determine the effects of Poncirin on the caspase activation, and PARP cleavage and Fas ligand up-regulation was measured by protein expression. β-Actin served as a loading control (* <span class="html-italic">p</span> &lt; 0.05 and ** <span class="html-italic">p</span> &lt; 0.01 <span class="html-italic">vs.</span> control group).</p>
Full article ">Figure 5
<p>Poncirin activates extrinsic apoptosis pathway in AGS cells. (<b>A</b>) Cell viability of AGS cells with or without z-VAD (z-VAD-fmk), AGS cells were treated with 10 µM of z-VAD-fmk for 1 h before Poncirin treatment. The cell viability was determined by MTT assay; and (<b>B</b>) caspase-8 and caspase-3 protein expression was determined by Western blotting. β-Actin served as a loading control; and (<b>C</b>) AGS cells were pretreated with 500 ng/mL of ZB4 monoclonal antibody for 1 h and followed by Poncirin treatment for 24 h. Extent of apoptosis was measured by Annexin V-Propidium Iodide Apoptosis Detection by flow cytometry. (*** <span class="html-italic">p</span> &lt; 0.01, ** <span class="html-italic">p</span> &lt; 0.05 <span class="html-italic">vs.</span> Poncirin-treated group).</p>
Full article ">Figure 5 Cont.
<p>Poncirin activates extrinsic apoptosis pathway in AGS cells. (<b>A</b>) Cell viability of AGS cells with or without z-VAD (z-VAD-fmk), AGS cells were treated with 10 µM of z-VAD-fmk for 1 h before Poncirin treatment. The cell viability was determined by MTT assay; and (<b>B</b>) caspase-8 and caspase-3 protein expression was determined by Western blotting. β-Actin served as a loading control; and (<b>C</b>) AGS cells were pretreated with 500 ng/mL of ZB4 monoclonal antibody for 1 h and followed by Poncirin treatment for 24 h. Extent of apoptosis was measured by Annexin V-Propidium Iodide Apoptosis Detection by flow cytometry. (*** <span class="html-italic">p</span> &lt; 0.01, ** <span class="html-italic">p</span> &lt; 0.05 <span class="html-italic">vs.</span> Poncirin-treated group).</p>
Full article ">Figure 6
<p>Effects of Poncirin on MMP (ΔΨm), and mitochondrial apoptosis regulatory proteins in AGS cells (<b>A</b>).Western blot analysis for the effects of Poncirin on Bak, caspase-9, Bax and Bcl-xL. The results are from one representative of three independent experiments that showed a similar pattern; and (<b>B</b>) AGS cells were incubated at indicated concentrations of Poncirin for 6, 12 and 24 h. Cells were stained with DiOC6 (3,3′-dihexyloxacarbocyanine iodide) dye and analysis were done by flow cytometry.</p>
Full article ">Figure 6 Cont.
<p>Effects of Poncirin on MMP (ΔΨm), and mitochondrial apoptosis regulatory proteins in AGS cells (<b>A</b>).Western blot analysis for the effects of Poncirin on Bak, caspase-9, Bax and Bcl-xL. The results are from one representative of three independent experiments that showed a similar pattern; and (<b>B</b>) AGS cells were incubated at indicated concentrations of Poncirin for 6, 12 and 24 h. Cells were stained with DiOC6 (3,3′-dihexyloxacarbocyanine iodide) dye and analysis were done by flow cytometry.</p>
Full article ">Figure 7
<p>Schematic diagram showing the mechanisms underlying the anti-cancer effects of Poncirin. Poncirin induced apoptosis by up-regulating FasL, and then activated caspase-8 and -3, which subsequently activated cleavage of PARP and DNA fragmentation. Poncirin does not alter MMP (ΔΨm) and mitochondrial regulatory proteins in AGS cells. Taken together, this study suggests that Poncirin induced apoptosis through extrinsic pathways in AGS cells, which is independent of mitochondrial apoptotic pathway. (→ indicates activation, <math display="inline"> <semantics> <mo>⊥</mo> </semantics> </math> indicates inhibition, --- indicates indirect or multiple pathways, <b>×</b> indicates pathway blocked).</p>
Full article ">
1634 KiB  
Article
SOCS3 Methylation Predicts a Poor Prognosis in HBV Infection-Related Hepatocellular Carcinoma
by Xin Zhang, Qingshan You, Xiaolei Zhang and Xiangmei Chen
Int. J. Mol. Sci. 2015, 16(9), 22662-22675; https://doi.org/10.3390/ijms160922662 - 18 Sep 2015
Cited by 27 | Viewed by 5678
Abstract
Suppressor of cytokine signaling 3 (SOCS3) plays crucial roles in JAK/STAT signaling pathway inhibition in hepatocellular carcinoma (HCC). However, the methylation status of SOCS3 in HBV infection-related HCC and the relationship between SOCS3 methylation and the clinical outcome remain unknown. Here, [...] Read more.
Suppressor of cytokine signaling 3 (SOCS3) plays crucial roles in JAK/STAT signaling pathway inhibition in hepatocellular carcinoma (HCC). However, the methylation status of SOCS3 in HBV infection-related HCC and the relationship between SOCS3 methylation and the clinical outcome remain unknown. Here, we reported that in HCC tumor tissues, two regions of the CpG island (CGI) in the SOCS3 promoter were subjected to methylation analysis and only the region close to the translational start site of SOCS3 was hypermethylated. In HCC tumor tissues, SOCS3 showed an increased methylation frequency and intensity compared with that in the adjacent non-tumor tissues. Moreover, SOCS3 expression was significantly down-regulated in HCC cell lines and tumor tissues, and this was inversely correlated with methylation. Kaplan–Meier curve analysis revealed that in patients with an hepatitis B virus (HBV) infection background, SOCS3 hypermethylation was significantly correlated with a poor clinical outcome of HCC patients. Our findings indicated that SOCS3 hypermethylation has already happened in non-tumor tissues and increased in both frequency and intensity in tumor tissues. This suggests that the methylation of SOCS3 could predict a poor prognosis in HBV infection-related HCC patients. Full article
(This article belongs to the Special Issue Molecular Classification of Human Cancer: Diagnosis and Treatment)
Show Figures

Figure 1

Figure 1
<p>The methylation statuses of two loci of the <span class="html-italic">SOCS3</span> promoter in HCC tissues and cell lines. (<b>A</b>) Schematic representation of the two detected CGI loci of the <span class="html-italic">SOCS3</span> gene. The transcriptional start site for <span class="html-italic">SOCS3</span> gene is defined as +1. Shaded boxes are exons of <span class="html-italic">SOCS3</span>. “▼” represents the restriction enzyme cutting site; (<b>B</b>) The methylation statuses in the located regions of Primer 1 and Primer 2 in 20 pairs of tumors tissues and the adjacent non-tumor tissues; and (<b>C</b>) The methylation status of <span class="html-italic">SOCS3</span> at region 2 in eight HCC cell lines.</p>
Full article ">Figure 1 Cont.
<p>The methylation statuses of two loci of the <span class="html-italic">SOCS3</span> promoter in HCC tissues and cell lines. (<b>A</b>) Schematic representation of the two detected CGI loci of the <span class="html-italic">SOCS3</span> gene. The transcriptional start site for <span class="html-italic">SOCS3</span> gene is defined as +1. Shaded boxes are exons of <span class="html-italic">SOCS3</span>. “▼” represents the restriction enzyme cutting site; (<b>B</b>) The methylation statuses in the located regions of Primer 1 and Primer 2 in 20 pairs of tumors tissues and the adjacent non-tumor tissues; and (<b>C</b>) The methylation status of <span class="html-italic">SOCS3</span> at region 2 in eight HCC cell lines.</p>
Full article ">Figure 2
<p>The <span class="html-italic">mRNA</span> expression of <span class="html-italic">SOCS3</span> in HCC cell lines. (<b>A</b>) The <span class="html-italic">mRNA</span> expression levels of <span class="html-italic">SOCS3</span> in eight cell lines; and (<b>B</b>) the normalized <span class="html-italic">mRNA</span> expression levels of <span class="html-italic">SOCS3</span> in cell lines Huh-7, Hep3B, and SK-Hep1 after treatment with 5-Aza-2ʹ-deoxycytidine for three days.</p>
Full article ">Figure 3
<p>The methylation statuses of <span class="html-italic">SOCS3</span> at region 2 in HCC tumor and adjacent non-tumor tissues. (<b>A</b>) The methylation status in 127 enlarged paired tumor tissues and non-tumor tissues; and (<b>B</b>) the methylation status in tumor tissues and adjacent non-tumor tissues with different virus infection backgrounds.</p>
Full article ">Figure 4
<p><span class="html-italic">SOCS3</span> <span class="html-italic">mRNA</span> expression levels in tumor and non-tumor tissues. (<b>A</b>) <span class="html-italic">SOCS3</span> <span class="html-italic">mRNA</span> expression level in 32 pairs of HCC tumor and non-tumor tissues; and (<b>B</b>) <span class="html-italic">SOCS3</span> expression level in hypermethylated HCC tissues (intensity ≥ 40%) and unmethylated tissues (intensity &lt; 3%).</p>
Full article ">Figure 5
<p>Kaplan–Meier survival plots for <span class="html-italic">SOCS3</span> methylation in HCC patients. Overall survival after surgery according to <span class="html-italic">SOCS3</span> methylation status in (<b>A</b>) general HCC patients and (<b>B</b>) HBV infection-related HCC patients.</p>
Full article ">
1149 KiB  
Review
?-3 Fatty Acids and Cardiovascular Diseases: Effects, Mechanisms and Dietary Relevance
by Hanne K. Maehre, Ida-Johanne Jensen, Edel O. Elvevoll and Karl-Erik Eilertsen
Int. J. Mol. Sci. 2015, 16(9), 22636-22661; https://doi.org/10.3390/ijms160922636 - 18 Sep 2015
Cited by 91 | Viewed by 18579
Abstract
?-3 fatty acids (n-3 FA) have, since the 1970s, been associated with beneficial health effects. They are, however, prone to lipid peroxidation due to their many double bonds. Lipid peroxidation is a process that may lead to increased oxidative stress, a [...] Read more.
?-3 fatty acids (n-3 FA) have, since the 1970s, been associated with beneficial health effects. They are, however, prone to lipid peroxidation due to their many double bonds. Lipid peroxidation is a process that may lead to increased oxidative stress, a condition associated with adverse health effects. Recently, conflicting evidence regarding the health benefits of intake of n-3 from seafood or n-3 supplements has emerged. The aim of this review was thus to examine recent literature regarding health aspects of n-3 FA intake from fish or n-3 supplements, and to discuss possible reasons for the conflicting findings. There is a broad consensus that fish and seafood are the optimal sources of n-3 FA and consumption of approximately 2–3 servings per week is recommended. The scientific evidence of benefits from n-3 supplementation has diminished over time, probably due to a general increase in seafood consumption and better pharmacological intervention and acute treatment of patients with cardiovascular diseases (CVD). Full article
(This article belongs to the Special Issue Omega-3 Fatty Acids in Health and Diseases)
Show Figures

Figure 1

Figure 1
<p>Overview of the pathways involved in the production of eicosanoids and specialized pro-resolving mediators from eicosapentaenoic acid (EPA). The figure is adapted from [<a href="#B16-ijms-16-22636" class="html-bibr">16</a>,<a href="#B17-ijms-16-22636" class="html-bibr">17</a>]. Products derived through the lipoxygenase (LOX) pathway are 5-, 12- and 15-HEPE, along with the leukotrienes A to E (LTA, LTB, LTC, LTD and LTE). Through the cyclooxygenase (COX) pathway, the prostaglandins D to I (PGD, PGE, PGF, PGG, PGH and PGI) and thromboxanes A and B (TXA and TXB) are produced. Aspirin-acetylated COX-2 catalyzes the production of aspirin-triggered resolvins E1 (18<span class="html-italic">R</span>-Rv1) and E2 (18<span class="html-italic">R</span>-Rv2), while the regular resolvins E1 (18<span class="html-italic">S</span>-Rv1) and E2 (18<span class="html-italic">S</span>-Rv2) are catalyzed by cytochrome P-450 (CYP-450). HpEPE: hydroperoxyeicosapentaenoic acids; HEPE: hydroxyeicosapentaenoic acids.</p>
Full article ">Figure 2
<p>Overview of the pathways involved in the production of specialized pro-resolving mediators from docosahexaenoic acid (DHA). The figure is adapted from [<a href="#B17-ijms-16-22636" class="html-bibr">17</a>]. Through the lipoxygenase (LOX) pathway, LOX-12 catalyzes the production of maresin-1 (Mar-1), while 15-LOX catalyzes the formation of neuroprotectin D1 (NPD1), protectin DX (PDX) and resolvins D1 (17<span class="html-italic">S</span>-RvD1) to D6 (17<span class="html-italic">S</span>-RvD6). Aspirin-acetylated cyclooxygenase-2 (COX-2) and/or cytochrome P-450 (CYP-450) catalyzes the formation of aspirin-triggered resolvins D1 (17<span class="html-italic">R</span>-RvD1) to D4 (17<span class="html-italic">R</span>-RvD4), along with aspirin-triggered protectin D1 (AT-PD1).</p>
Full article ">Figure 3
<p>Leukotriene A<sub>5</sub>.</p>
Full article ">Figure 4
<p>Prostaglandin G<sub>3</sub>.</p>
Full article ">Figure 5
<p>Illustration of the lipid peroxidation process. Triggered by energy, reactive oxygen species (ROS) and/or transition metals, an unstable hydrogen atom is abstracted from a fatty acid (LH), forming an alkyl radical (L•) and a hydrogen radical (H•). The alkyl radical reacts with oxygen, forming a peroxyl radical (LOO•) that further reacts with another fatty acid, forming a lipid peroxide (LOOH) and a new alkyl radical. The lipid peroxide is easily degraded into an alkoxyl radical (LO•) and a hydroxyl radical (OH•). The alkoxyl radical may either react with a new fatty acid, forming a hydroxylated fatty acid (LOH), or decompose into smaller, volatile compounds, such as aldehydes, ketones or alcohols.</p>
Full article ">
1710 KiB  
Article
Biliverdin Reductase A (BVRA) Mediates Macrophage Expression of Interleukin-10 in Injured Kidney
by Zhizhi Hu, Guangchang Pei, Pengge Wang, Juan Yang, Fengmin Zhu, Yujiao Guo, Meng Wang, Ying Yao, Rui Zeng, Wenhui Liao and Gang Xu
Int. J. Mol. Sci. 2015, 16(9), 22621-22635; https://doi.org/10.3390/ijms160922621 - 18 Sep 2015
Cited by 19 | Viewed by 8515
Abstract
Biliverdin reductase A is an enzyme, with serine/threonine/tyrosine kinase activation, converting biliverdin (BV) to bilirubin (BR) in heme degradation pathway. It has been reported to have anti-inflammatory and antioxidant effect in monocytes and human glioblastoma. However, the function of BVRA in polarized macrophage [...] Read more.
Biliverdin reductase A is an enzyme, with serine/threonine/tyrosine kinase activation, converting biliverdin (BV) to bilirubin (BR) in heme degradation pathway. It has been reported to have anti-inflammatory and antioxidant effect in monocytes and human glioblastoma. However, the function of BVRA in polarized macrophage was unknown. This study aimed to investigate the effect of BVRA on macrophage activation and polarization in injured renal microenvironment. Classically activated macrophages (M1macrophages) and alternative activation of macrophages (M2 macrophages) polarization of murine bone marrow derived macrophage was induced by GM-CSF and M-CSF. M1 polarization was associated with a significant down-regulation of BVRA and Interleukin-10 (IL-10), and increased secretion of TNF-?. We also found IL-10 expression was increased in BVRA over-expressed macrophages, while it decreased in BVRA knockdown macrophages. In contrast, BVRA over-expressed or knockdown macrophages had no effect on TNF-? expression level, indicating BVRA mediated IL-10 expression in macrophages. Furthermore, we observed in macrophages infected with recombinant adenoviruses BVRA gene, which BVRA over-expressed enhanced both INOS and ARG-1 mRNA expression, resulting in a specific macrophage phenotype. Through in vivo study, we found BVRA positive macrophages largely existed in mice renal ischemia perfusion injury. With the treatment of the regular cytokines GM-CSF, M-CSF or LPS, excreted in the injured renal microenvironment, IL-10 secretion was significantly increased in BVRA over-expressed macrophages. In conclusion, the BVRA positive macrophage is a source of anti-inflammatory cytokine IL-10 in injured kidney, which may provide a potential target for treatment of kidney disease. Full article
(This article belongs to the Section Biochemistry)
Show Figures

Figure 1

Figure 1
<p>Macrophage polarization was induced successfully <span class="html-italic">in vitro</span>. Macrophages’ morphology was observed by light microscope, (M0) control macrophages (untreated macrophages); (M1) macrophages stimulated with GM-CSF; (M2) macrophages stimulated with M-CSF (<b>A</b>). Original magnification ×400. INOS (<b>B</b>), ARG-1(<b>C</b>), IL-10 and TNF-α (<b>D</b>) mRNA expression were detected by qRT-PCR. IL-10 and TNF-α (<b>E</b>) protein expression were detected by ELISA. <span class="html-italic">n</span> = 4, <b>**</b> <span class="html-italic">p</span> &lt; 0.01, <b>***</b> <span class="html-italic">p</span> &lt; 0.001. M0: Macrophages with no treatment; M1: Macrophages treated with GM-CSF; M2: Macrophages treated with M-CSF.</p>
Full article ">Figure 2
<p>BVRA expression increased in M2 macrophage, compared to M1 macrophage. Macrophages cultured for seven days and further stimulated with GM-CSF and M-CSF for 24 h. BVRA positive macrophages (CD45+F4/80+CD11b+BVRA+) were analyzed by FACS (<b>A</b>); BVRA mRNA expression were analyzed by qRT-PCR (<b>B</b>); BVRA protein expression were analyzed by Western blotting (<b>C</b>). <span class="html-italic">n</span> = 4, <b>***</b> <span class="html-italic">p</span> &lt; 0.001, <b>**</b> <span class="html-italic">p</span> &lt; 0.01. M0: Macrophages with no treatment; M1: Macrophages treated with GM-CSF; M2: Macrophages treated with M-CSF.</p>
Full article ">Figure 3
<p>BVRA over-expressed macrophages showed increased IL-10 expression. Macrophages cultured for seven days and transfected with AV-BVRA for 48 h, Western blotting was used to detect the transfection efficiency (<b>A</b>) (<span class="html-italic">p</span> &lt; 0.05), IL-10 (<b>B</b>) and TNF-α (<b>C</b>) mRNA expression were detected by qRT-PCR; IL-10 (<b>D</b>) and TNF-α (<b>E</b>) protein expression were detected by ELISA. <span class="html-italic">n</span> = 4, <b>***</b> <span class="html-italic">p</span> &lt; 0.001, <b>**</b> <span class="html-italic">p</span> &lt; 0.01, <b>*</b> <span class="html-italic">p</span> &lt; 0.05. NS: no statistical significance. Control: Macrophages with no virus; AVBVRA: Macrophages transfected with AV-BVRA; AV: Macrophages transfected with AV-negative control.</p>
Full article ">Figure 4
<p>BVRA knockdown macrophages showed decreased IL-10 expression. Macrophages cultured for seven days and transfected with LV-BVRA for 72 h, Western blotting was used to detect the efficiency of knockdown (<b>A</b>) (<span class="html-italic">p</span> &lt; 0.001), IL-10 (<b>B</b>) and TNF-α (<b>C</b>) mRNA expression were detected by qRT-PCR; IL-10 (<b>D</b>) and TNF-α (<b>E</b>) protein expression were detected by ELISA. <span class="html-italic">n</span> = 4, <b>***</b> <span class="html-italic">p</span> &lt; 0.001, <b>**</b> <span class="html-italic">p</span> &lt;0.01, <b>*</b> <span class="html-italic">p</span> &lt; 0.05. NS: no statistical significance. Control: Macrophages with no virus; LVBVRA: Macrophages transfected with LV-BVRA; LV: Macrophages transfected with LV-negative control.</p>
Full article ">Figure 5
<p>BVRA over-expressed macrophages showed increased INOS and ARG-1 expression levels. INOS (<b>A</b>) and ARG-1 (<b>B</b>) mRNA expression were detected by qRT-PCR in over-expressed BVRA macrophages; <span class="html-italic">n</span> = 4, <b>***</b> <span class="html-italic">p</span> &lt; 0.001, <b>**</b> <span class="html-italic">p</span> &lt; 0.01. Control: Macrophages with no virus; AVBVRA: Macrophages transfected with AV-BVRA; AV: Macrophages transfected with AV-negative control.</p>
Full article ">Figure 6
<p>BVRA positive macrophages existed in mice renal ischemia reperfusion injury. Paraffin embedded sham mice renal tissue showed BVRA staining in red (<b>A</b>), F4/80 staining of macrophages in green (<b>B</b>) and DAPI counterstain in blue. BVRA positive macrophages were merged in yellow (<b>C</b>); Paraffin embedded mice ischemia reperfusion injury renal tissue showed BVRA staining in red (<b>D</b>); F4/80 staining of macrophages in green (<b>E</b>) and DAPI counterstain in blue. BVRA positive macrophages were merged in yellow (<b>F</b>) (red arrow). Original magnification 800×; (<b>G</b>) Representative CD45+F4/80+CD11b+BVRA cells expression by FACS in the kidney and bone marrow of the sham group and the group 10 days after renal ischemia reperfusion injury. <span class="html-italic">n</span> = 4, <b>***</b> <span class="html-italic">p</span> &lt; 0.001.</p>
Full article ">Figure 7
<p>GM-CSF, M-CSF, or LPS increased IL-10 expression in BVRA positive macrophages. (<b>A</b>) IL-10 mRNA expression were detected by qRT-PCR in AV-BVRA macrophages stimulated with GM-CSF; (<b>B</b>) IL-10 mRNA expression were detected by qRT-PCR in AV-BVRA macrophages stimulated with M-CSF; (<b>C</b>) IL-10 mRNA expression were detected by qRT-PCR in AV-BVRA macrophages stimulated with LPS; (<b>D</b>) IL-10 protein expression were detected by ELISA in AV-BVRA macrophages stimulated with GM-CSF; (<b>E</b>) IL-10 protein expression were detected by ELISA in AV-BVRA macrophages stimulated with M-CSF; (<b>F</b>) IL-10 protein expression were detected by ELISA in AV-BVRA macrophages stimulated with LPS. <span class="html-italic">n</span> = 4, <b>***</b> <span class="html-italic">p</span> &lt; 0.001, <b>**</b> <span class="html-italic">p</span> &lt; 0.01. AVBVRA: macrophages transfected with AV-BVRA; AV+GM-CSF: macrophages transfected with AV-negative control virus and stimulated with GM-CSF; AVBVRA+GM-CSF: Macrophages transfected with AV-BVRA virus and stimulated with GM-CSF; AV+M-CSF: Macrophages transfected with AV-negative control virus and stimulated with M-CSF; AVBVRA+M-CSF: Macrophages transfected with AV-BVRA virus and stimulated with M-CSF; AV+LPS: Macrophages transfected with AV-negative control virus and stimulated with LPS; AVBVRA+LPS: Macrophages transfected with AV-BVRA virus and stimulated with LPS.</p>
Full article ">
1728 KiB  
Article
Identification and Characterization of CYP9A40 from the Tobacco Cutworm Moth (Spodoptera litura), a Cytochrome P450 Gene Induced by Plant Allelochemicals and Insecticides
by Rui-Long Wang, Christian Staehelin, Qing-Qing Xia, Yi-Juan Su and Ren-Sen Zeng
Int. J. Mol. Sci. 2015, 16(9), 22606-22620; https://doi.org/10.3390/ijms160922606 - 18 Sep 2015
Cited by 56 | Viewed by 6393
Abstract
Cytochrome P450 monooxygenases (P450s) of insects play crucial roles in the metabolism of endogenous and dietary compounds. Tobacco cutworm moth (Spodoptera litura), an important agricultural pest, causes severe yield losses in many crops. In this study, we identified CYP9A40, a [...] Read more.
Cytochrome P450 monooxygenases (P450s) of insects play crucial roles in the metabolism of endogenous and dietary compounds. Tobacco cutworm moth (Spodoptera litura), an important agricultural pest, causes severe yield losses in many crops. In this study, we identified CYP9A40, a novel P450 gene of S. litura, and investigated its expression profile and potential role in detoxification of plant allelochemicals and insecticides. The cDNA contains an open reading frame encoding 529 amino acid residues. CYP9A40 transcripts were found to be accumulated during various development stages of S. litura and were highest in fifth and sixth instar larvae. CYP9A40 was mainly expressed in the midgut and fat body. Larval consumption of xenobiotics, namely plant allelochemicals (quercetin and cinnamic acid) and insecticides (deltamethrin and methoxyfenozide) induced accumulation of CYP9A40 transcripts in the midgut and fat body. Injection of dsCYP9A40 (silencing of CYP9A40 by RNA interference) significantly increased the susceptibility of S. litura larvae to the tested plant allelochemicals and insecticides. These results indicate that CYP9A40 expression in S. litura is related to consumption of xenobiotics and suggest that CYP9A40 is involved in detoxification of these compounds. Full article
(This article belongs to the Section Biochemistry)
Show Figures

Figure 1

Figure 1
<p>Alignment of the amino acid sequences deduced from <span class="html-italic">CYP9A40</span> (<span class="html-italic">Spodoptera litura</span>) with <span class="html-italic">CYP9A1</span> (<span class="html-italic">Heliothis virescens</span>), <span class="html-italic">CYP9A17</span> (<span class="html-italic">Helicoverpa armigera</span>) and <span class="html-italic">CYP9A19</span> (<span class="html-italic">Bombyx mori</span>). Predicted substrate recognition sites (SRSs) are highlighted. Conserved motifs (WXXXR, AGXXT, EXXR, PXRF and FXXGXXXCXG) are also marked on the boxes. Conserved amino acid residues are indicated below: “*” means a single, fully conserved residue; “:” indicates a strongly and “.” a weakly conserved residue.</p>
Full article ">Figure 2
<p>Phylogenetic analysis of <span class="html-italic">CYP9A40</span> of <span class="html-italic">S. litura</span> and related P450s from various insects. The phylogenetic tree was constructed from generated alignments using the neighbor-joining (NJ) method of the Mega 4.0 software (MEGA, Tempe, AZ, USA). The values on the branches indicate the percentage frequencies at which the phylogram topology was representative for 1000 bootstrap replicates. The scale bar indicates 0.05 amino acid substitutions per site.</p>
Full article ">Figure 3
<p>Gene expression levels of <span class="html-italic">S. litura</span> CYP9A40 at different development stages (<b>A</b>) and in different tissues (<b>B</b>) relative to that in eggs and hemolymph respectively as determined by qRT-PCR analysis. Data shown are means ± SE. Different letters above bars indicate significant differences (<span class="html-italic">p</span> &lt; 0.05) according to one-way ANOVA followed by the Duncan’s multiple range test.</p>
Full article ">Figure 4
<p>Effect of quercetin, cinnamic acid, deltamethrin and methoxyfenozide on the accumulation of <span class="html-italic">CYP9A40</span> transcripts in the midgut of fifth instar larvae in response to uptake of plant allelochemicals and insecticides for 48 h. Control larvae were fed on artificial diet without xenobiotic compounds. Transcript levels were determined by qRT-PCR. Data shown are means ± SE. Different letters above bars indicate significant differences (<span class="html-italic">p</span> &lt; 0.05) according to one-way ANOVA followed by the Duncan’s multiple range test.</p>
Full article ">Figure 5
<p>Changes in the susceptibility of fifth instar larvae to different xenobiotics after injection of dsCYP9A40. Control larvae were subjected to injection with the same amounts of dsGFP. Data shown are means ± SE obtained from four biological repeats. (<b>A</b>) qRT-PCR analysis of <span class="html-italic">CYP9A40</span> transcript levels 24 h after delivery of dsCYP9A40 and dsGFP, respectively. Expression of <span class="html-italic">CYP9A40</span> was considerably silenced by RNAi as marked by two asterisks (Student’s <span class="html-italic">t</span>-test, <span class="html-italic">p</span> &lt; 0.01); (<b>B</b>) Effects of uptake of plant allelochemicals and insecticides on mortality of larvae. Larvae were fed on artificial diet supplemented with indicated xenobiotics for 24 h. Mortality of larvae injected with dsCYP9A40 was elevated in response to all four xenobiotics. Asterisks above bars indicate a significant increase in mortality of dsCYP9A40-injected larvae compared to those injected with dsGFP (Student’s <span class="html-italic">t</span>-test, * <span class="html-italic">p</span> &lt; 0.05, ** <span class="html-italic">p</span> &lt; 0.01).</p>
Full article ">
2667 KiB  
Article
Expression of PD-1 Molecule on Regulatory T Lymphocytes in Patients with Insulin-Dependent Diabetes Mellitus
by Valentina Perri, Benedetta Russo, Antonino Crinò, Riccardo Schiaffini, Ezio Giorda, Marco Cappa, Maria Manuela Rosado and Alessandra Fierabracci
Int. J. Mol. Sci. 2015, 16(9), 22584-22605; https://doi.org/10.3390/ijms160922584 - 18 Sep 2015
Cited by 41 | Viewed by 6920
Abstract
Type 1 diabetes is caused by autoreactive T cells that destroy pancreatic beta cells. Animal models suggested that a CD4+CD25+ population has a regulatory function capable of preventing activation and effector functions of autoreactive T cells. However, the role of [...] Read more.
Type 1 diabetes is caused by autoreactive T cells that destroy pancreatic beta cells. Animal models suggested that a CD4+CD25+ population has a regulatory function capable of preventing activation and effector functions of autoreactive T cells. However, the role of CD4+CD25high T cells in autoimmunity and their molecular mechanisms remain the subject of investigation. We therefore evaluated T regulatory cell frequencies and their PD-1 expression in the peripheral blood of long-standing diabetics under basal conditions and after CD3/CD28 stimulation. Under basal conditions, the percentages of T regulatory cells were significantly higher while that of T effector cells were significantly lower in patients than in controls. The ratio of regulatory to effector T cells was higher in patients than that in controls, suggesting that T regulatory cells were functional in patients. Percentages of total PD-1+, PD-1low and PD-1high expressing T regulatory cells did not change in patients and in controls. After stimulation, a defect in T regulatory cell proliferation was observed in diabetics and the percentages of total PD-1+, PD-1low and PD-1high expressing cells were lower in patients. Our data suggest a defective activation of T regulatory cells in long-standing diabetics due to a lower expression of PD-1 on their surface. Full article
(This article belongs to the Special Issue Molecular Research on Obesity and Diabetes)
Show Figures

Figure 1

Figure 1
<p>T cell phenotype and percentages of PD-1<sup>+</sup> Tregs in healthy controls and in T1D patients after four days of culture under standard basal conditions. Previously frozen PBMC samples from healthy control donors and from T1D patients were stained with antibodies to CD3, CD4, CD25 and CD127 and analyzed by Flow cytometric analysis (FACS) to determine the relative frequency of CD3<sup>+</sup> (<b>A</b>); CD4<sup>+</sup> (<b>B</b>); CD8<sup>+</sup> (<b>C</b>); Treg (<b>D</b>); Teff (<b>E</b>) cells and the ratio of Treg and Teff percentages (<b>F</b>); Graphs (<b>G</b>–<b>I</b>) show the frequency after four days of culture of total PD-1<sup>+</sup>, PD-1<sup>high</sup> and PD-1<sup>low</sup> Treg subfractions respectively in healthy controls and T1D patients. In all graphs, horizontal lines represent the mean frequency and each symbol represents an individual: black circle represents the normal and square dot the diabetic. Frequencies refer to analyzed events within flow-cytometry gates as shown in representative dot plots in <a href="#app1-ijms-16-22584" class="html-app">Figure S2</a>.</p>
Full article ">Figure 2
<p>T cell, Teff, Treg proliferative responses and the Treg/Teff ratio after CD3/CD28 stimulation in healthy controls and in T1D patients. 5-chloromethylfluorescein diacetate (CMFDA)-labeled PBMC from healthy controls and from T1D patients were stimulated with CD3/CD28-coated beads for four days (upper panels, A–E and M) and six days (bottom panels, F–L and N). Graphs show the frequency of CD3<sup>+</sup>, CD4<sup>+</sup>, CD8<sup>+</sup>, Teff, Treg proliferating cells after 4 (<b>A</b>–<b>E</b>) and 6 days (<b>F</b>–<b>I</b>,<b>L</b>) and Treg/Teff ratio after four days (<b>M</b>) and six days (<b>N</b>) of culture in healthy controls and T1D patients. Proliferation was calculated as percentages of CMFDA-low cells within the total subset after CD3/CD28 stimulation over the percentages of CMFDA-low in RPMI unstimulated cultures. In all graphs, horizontal lines represent the mean frequency and each symbol represents an individual: black circle represents the normal and square dot the diabetic.</p>
Full article ">Figure 3
<p>Percentages of PD-1<sup>+</sup> Tregs after CD3/CD28 stimulation in healthy controls and in T1D patients. The graphs show the frequency of total PD-1<sup>+</sup>, PD-1<sup>high</sup>, and PD-1<sup>low</sup> subfractions after four days (<b>A</b>–<b>C</b>) and six days (<b>D</b>–<b>F</b>) of stimulation.</p>
Full article ">Figure 4
<p>Analysis of CD8<sup>+</sup>CD25<sup>+</sup> subsets after CD3/CD28 stimulation in healthy controls and in T1D patients. <b>Upper</b> panel graphs show the percentages of CD8<sup>+</sup>CD25<sup>+</sup> cells after four days (<b>A</b>) and six days (<b>B</b>) of stimulation in healthy controls and in T1D patients; <b>Bottom</b> panel graphs show the percentages of CD8<sup>+</sup>CD25<sup>+</sup> PD-1<sup>+</sup> cells after four days (<b>C</b>) and six days (<b>D</b>).</p>
Full article ">Figure 5
<p>IL-10 secretion after four and six days of CD3/CD28 stimulation in PBMC of T1D patients compared to healthy controls. Ratio of increase of IL-10 concentrations (expressed as picograms/milliliter (pg/mL) was calculated in CD3/CD28-stimulated over unstimulated supernatants. Graphs show a significant reduction of IL-10 secretion in T1D patients compared to healthy controls, both, after four days (<b>A</b>) (Kolmogorov-Smirnov test <span class="html-italic">p</span> &gt; 0.10; unpaired <span class="html-italic">t</span> test with Welch’s correction <span class="html-italic">p</span> = 0.0275) and six days (<b>B</b>) (Kolmogorov-Smirnov test <span class="html-italic">p</span> &lt; 0.05; Mann Whitney test <span class="html-italic">p</span> = 0.0147) of CD3/CD28 stimulation.</p>
Full article ">
Previous Issue
Next Issue
Back to TopTop