[go: up one dir, main page]

Next Issue
Volume 25, July-1
Previous Issue
Volume 25, June-1
 
 
molecules-logo

Journal Browser

Journal Browser

Molecules, Volume 25, Issue 12 (June-2 2020) – 235 articles

Cover Story (view full-size image): 
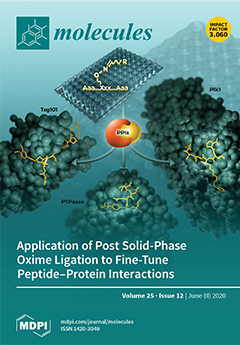
Oxime ligation represents a form of post solid-phase diversification that is highly suited to optimizing antagonists against therapeutically relevant protein–protein interactions (PPIs). Using as examples the tumor susceptibility gene 101 (Tsg101), protein tyrosine phosphatases (PTPases), and the polo-like kinase 1 (Plk1), we demonstrate how this technique provides a facile and empirical means of identifying protein–peptide interactions that may substantially increase binding affinities and selectivity. View this paper.
  • Issues are regarded as officially published after their release is announced to the table of contents alert mailing list.
  • You may sign up for e-mail alerts to receive table of contents of newly released issues.
  • PDF is the official format for papers published in both, html and pdf forms. To view the papers in pdf format, click on the "PDF Full-text" link, and use the free Adobe Reader to open them.
Order results
Result details
Section
Select all
Export citation of selected articles as:
20 pages, 2195 KiB  
Article
Metabolomics of Myrcia bella Populations in Brazilian Savanna Reveals Strong Influence of Environmental Factors on Its Specialized Metabolism
by Luiz Leonardo Saldanha, Pierre-Marie Allard, Adlin Afzan, Fernanda Pereira de Souza Rosa de Melo, Laurence Marcourt, Emerson Ferreira Queiroz, Wagner Vilegas, Cláudia Maria Furlan, Anne Lígia Dokkedal and Jean-Luc Wolfender
Molecules 2020, 25(12), 2954; https://doi.org/10.3390/molecules25122954 - 26 Jun 2020
Cited by 14 | Viewed by 3710
Abstract
Environmental conditions influence specialized plant metabolism. However, many studies aiming to understand these modulations have been conducted with model plants and/or under controlled conditions, thus not reflecting the complex interaction between plants and environment. To fully grasp these interactions, we investigated the specialized [...] Read more.
Environmental conditions influence specialized plant metabolism. However, many studies aiming to understand these modulations have been conducted with model plants and/or under controlled conditions, thus not reflecting the complex interaction between plants and environment. To fully grasp these interactions, we investigated the specialized metabolism and genetic diversity of a native plant in its natural environment. We chose Myrcia bella due to its medicinal interest and occurrence in Brazilian savanna regions with diverse climate and soil conditions. An LC-HRMS-based metabolomics approach was applied to analyze 271 samples harvested across seven regions during the dry and rainy season. Genetic diversity was assessed in a subset of 40 samples using amplified fragment length polymorphism. Meteorological factors including rainfall, temperature, radiation, humidity, and soil nutrient and mineral composition were recorded in each region and correlated with chemical variation through multivariate analysis (MVDA). Marker compounds were selected using a statistically informed molecular network and annotated by dereplication against an in silico database of natural products. The integrated results evidenced different chemotypes, with variation in flavonoid and tannin content mainly linked to soil conditions. Different levels of genetic diversity and distance of populations were found to be correlated with the identified chemotypes. These observations and the proposed analytical workflow contribute to the global understanding of the impact of abiotic factors and genotype on the accumulation of given metabolites and, therefore, could be valuable to guide further medicinal exploration of native species. Full article
Show Figures

Figure 1

Figure 1
<p>Summary of the workflow used in this study. (<b>a</b>) Strategy followed for sample harvesting and environmental monitoring in different regions of the Brazilian savanna. (<b>b</b>) Multivariate data analysis was used to analyze the chemical and genetic data and to correlate compounds with significant variation (markers) to environmental factors. (<b>c</b>) A multi-informative molecular network was then generated by merging metabolomics multivariate data (VIP values) in the molecular network to identify chemotype markers. Compounds were annotated by spectral matching against in silico fragmentation databases, following a taxonomically informed reranking process.</p>
Full article ">Figure 2
<p>Multivariate data analysis of UHPLC-ToF-HRMS fingerprinting data of 271 <span class="html-italic">Myrcia bella</span> extracts collected in seven regions of Cerrado. (<b>a</b>) O2PLS score plot highlighting the identified chemotypes (CI, CII, and CIII). (<b>b</b>) Geographical map summarizing the location of the harvesting site. The black lines delineate regions sharing the same chemotype. (<b>c</b>) O2PLS loading plot exhibiting the correlation of the environmental factors with given metabolites (numbers in black). List of abbreviations: Fe = soil iron; Al = soil aluminum; Mn = soil manganese; K = soil potassium; Cu = soil copper; P = soil phosphorus; Mg = soil magnesium; Zn = soil zinc; Ca = soil calcium; SB = soil sum of basis; pH = soil pH; V = soil bases saturation; CEC = cation exchange capacity; Temp. (mean) = mean air temperature; Temp. (max) = maximum air temperature. BT = Bonito; CG = Campo Grande; S = Selvíria; TL = Três Lagoas; PNE = Parque Nacional das Emas; PT = Pratânia; JBB = Jardim Botânico de Bauru. GO = Goiás; SP = São Paulo; MS = Mato Grosso do Sul.</p>
Full article ">Figure 3
<p>Selected clusters (MN<sub>1</sub>–MN<sub>5</sub>) from the statistically informed molecular network. VIP values greater than 1 (represented in red in the VIP plot) from the O2PLS model were integrated into the molecular network and can be visualized through the node size. Larger nodes indicate features with VIP values greater than 1. Dotted line boxes indicate putatively annotated compounds (ISDB-DNP in silico annotations), and full lines indicate dereplicated compounds for which identity was confirmed by comparing the spectroscopic data with compounds isolated from <span class="html-italic">Myrcia bella</span>. Green, orange, or purple colors indicate the chemical classes of the compounds. Flavonoid, tannin, and carboxylic acid chemical class clusters with representative structures are depicted.</p>
Full article ">Figure 4
<p>Multivariate data analysis of the AFLP markers data of <span class="html-italic">Myrcia bella</span> samples from different regions of Cerrado. (<b>a</b>) PCA score plot derived from 40 samples. (<b>b</b>) HCA plot derived from the generated PCA score plot. Both PCA and HCA highlighted the presence of two main genotype clusters. List of abbreviations: CG = Campo Grande; S = Selvíria; TL = Três Lagoas; PNE = Parque Nacional das Emas; PT = Pratânia; JBB = Jardim Botânico de Bauru.</p>
Full article ">
16 pages, 2537 KiB  
Article
The Lipoxin Receptor/FPR2 Agonist BML-111 Protects Mouse Skin Against Ultraviolet B Radiation
by Renata M. Martinez, Victor Fattori, Priscila Saito, Ingrid C. Pinto, Camilla C. A. Rodrigues, Cristina P. B. Melo, Allan J. C. Bussmann, Larissa Staurengo-Ferrari, Julia Rojo Bezerra, Josiane A. Vignoli, Marcela M. Baracat, Sandra R. Georgetti, Waldiceu A Verri Jr. and Rubia Casagrande
Molecules 2020, 25(12), 2953; https://doi.org/10.3390/molecules25122953 - 26 Jun 2020
Cited by 21 | Viewed by 3575
Abstract
Excessive exposure to UV, especially UVB, is the most important risk factor for skin cancer and premature skin aging. The identification of the specialized pro-resolving lipid mediators (SPMs) challenged the preexisting paradigm of how inflammation ends. Rather than a passive process, the resolution [...] Read more.
Excessive exposure to UV, especially UVB, is the most important risk factor for skin cancer and premature skin aging. The identification of the specialized pro-resolving lipid mediators (SPMs) challenged the preexisting paradigm of how inflammation ends. Rather than a passive process, the resolution of inflammation relies on the active production of SPMs, such as Lipoxins (Lx), Maresins, protectins, and Resolvins. LXA4 is an SPM that exerts its action through ALX/FPR2 receptor. Stable ALX/FPR2 agonists are required because SPMs can be quickly metabolized within tissues near the site of formation. BML-111 is a commercially available synthetic ALX/FPR2 receptor agonist with analgesic, antioxidant, and anti-inflammatory properties. Based on that, we aimed to determine the effect of BML-111 in a model of UVB-induced skin inflammation in hairless mice. We demonstrated that BML-111 ameliorates the signs of UVB-induced skin inflammation by reducing neutrophil recruitment and mast cell activation. Reduction of these cells by BML-111 led to lower number of sunburn cells formation, decrease in epidermal thickness, collagen degradation, cytokine production (TNF-α, IL-1β, IL-6, TGF, and IL-10), and oxidative stress (observed by an increase in total antioxidant capacity and Nrf2 signaling pathway), indicating that BML-111 might be a promising drug to treat skin disorders. Full article
(This article belongs to the Special Issue Natural and Artificial Photoprotective Agent)
Show Figures

Figure 1

Figure 1
<p>BML-111 reduces neutrophil recruitment in a dose-dependent manner and in an ALX/FPR2-sensitive manner. The effect of BML-111 in MPO activity was determined in samples dissected 12 h after the radiation (<b>A</b>–<b>C</b>). (<b>A</b>) Dose–response curve to determine the effect of BML-111. (<b>B</b>) Time–response curve to evaluate whether BML-111 presents a time-dependent effect. (<b>C</b>) Dose–response curve for BOC, an ALX/FPR2 antagonist. Results are expressed as mean ± SEM and are representative of two independent experiments. One-way ANOVA followed by Tukey’s post-test * <span class="html-italic">p</span> &lt; 0.05 compared to non-irradiated group, # <span class="html-italic">p</span> &lt; 0.05 compared to irradiated vehicle-treated group, ## <span class="html-italic">p</span> &lt; 0.05 compared to BML-111 group.</p>
Full article ">Figure 2
<p>BML-111 reduces skin edema and the increase in epidermal thickness induced by UVB radiation. The skin edema (<b>A</b>) were determined in samples dissected 12 h after the radiation. The epidermal thickness was determined in samples dissected 12 h after the radiation and stained with hematoxylin and eosin (H&amp;E). Representative images of non-irradiated control (<b>B</b>), irradiated treated with vehicle (<b>C</b>), irradiated treated with 0.1 mg/kg of BML-111 (<b>D</b>), irradiated treated with BOC and BML-111 (<b>E</b>), and irradiated treated with BOC (<b>F</b>) groups are presented. Epidermal thickness of experimental groups is presented in μm (<b>G</b>). Original magnification 40×; 100 μm. Results are expressed as mean ± SEM and are representative of two independent experiments. One-way ANOVA followed by Tukey’s post-test * <span class="html-italic">p</span> &lt; 0.05 compared to non-irradiated group, # <span class="html-italic">p</span> &lt; 0.05 compared to irradiated vehicle-treated group, ## <span class="html-italic">p</span> &lt; 0.05 compared to BML-111 group.</p>
Full article ">Figure 3
<p>UVB-induced sunburn cells are reduced by BML-111. The number of sunburn cells was determined in samples dissected 12 h after the radiation and stained with H&amp;E. Representative images of non-irradiated control (<b>A</b>), irradiated treated with vehicle (<b>B</b>), irradiated treated with 0.1 mg/kg of BML-111 (<b>C</b>), irradiated treated with BOC and BML-111 (<b>D</b>), and irradiated treated with BOC (<b>E</b>) groups are presented. Quantitative analysis of sunburn cells in experimental groups is presented per field in (<b>F</b>). Original magnification 100×; 100 μm. Results are expressed as mean ± SEM and are representative of two independent experiments. One-way ANOVA followed by Tukey’s post-test * <span class="html-italic">p</span> &lt; 0.05 compared to non-irradiated group, # <span class="html-italic">p</span> &lt; 0.05 compared to irradiated vehicle-treated group, ## <span class="html-italic">p</span> &lt; 0.05 compared to BML-111 group.</p>
Full article ">Figure 4
<p>BML-111 reduces UVB irradiation-induced increase of mast cell count. Mast cells count was determined in samples dissected 12 h after the radiation and stained with toluidine blue. Representative images of non-irradiated control (<b>A</b>), irradiated treated with vehicle (<b>B</b>), irradiated treated with 0.1 mg/kg of BML-111 (<b>C</b>), irradiated treated with BOC and BML-111 (<b>D</b>), and irradiated treated with BOC (<b>E</b>) groups are presented. Mast cells count of experimental groups is presented per field in (<b>F</b>). Original magnification 40×; 100 μm. Results are expressed as mean ± SEM and are representative of two independent experiments. One-way ANOVA followed by Tukey’s post-test * <span class="html-italic">p</span> &lt; 0.05 compared to non-irradiated group, # <span class="html-italic">p</span> &lt; 0.05 compared to irradiated vehicle-treated group, ## <span class="html-italic">p</span> &lt; 0.05 compared to BML-111 group.</p>
Full article ">Figure 5
<p>BML-111 prevents UVB irradiation-induced collagen degradation. Degradation of collagen was determined in samples dissected 12 h after the radiation and stained with Masson’s trichrome. Representative images of non-irradiated control (<b>A</b>), irradiated treated with vehicle (<b>B</b>), irradiated treated with 0.1 mg/kg of BML-111 (<b>C</b>), irradiated treated with BOC and BML-111 (<b>D</b>), and irradiated treated with BOC (<b>E</b>) groups are presented. Quantitative analysis of collagen degradation of experimental groups is presented as percentage of staining in panel (<b>F</b>). Original magnification 10×; 100 μm. Results are expressed as mean ± SEM and are representative of two independent experiments. One-way ANOVA followed by Tukey’s post-test * <span class="html-italic">p</span> &lt; 0.05 compared to non-irradiated group, # <span class="html-italic">p</span> &lt; 0.05 compared to irradiated vehicle-treated group, ## <span class="html-italic">p</span> &lt; 0.05 compared to BML-111 group.</p>
Full article ">Figure 6
<p>BML-111 reduces cytokine production during UVB-induced skin inflammation<b>.</b> Skin samples were dissected 4 h after the radiation to determine the levels of IL-1β (<b>A</b>), TNF-α (<b>B</b>), IL-6 (<b>C</b>), TGF (<b>D</b>), and 12 h after the radiation to determine the levels of IL-10 (<b>E</b>) by ELISA. Results are expressed as mean ± SEM and are representative of two independent experiments. One-way ANOVA followed by Tukey’s post-test * <span class="html-italic">p</span> &lt; 0.05 compared to non-irradiated group, # <span class="html-italic">p</span> &lt; 0.05 compared to irradiated vehicle-treated group, ## <span class="html-italic">p</span> &lt; 0.05 compared to BML-111 group.</p>
Full article ">Figure 7
<p>UVB-induced antioxidant capacity is restored by BML-111. Total antioxidant capacity (FRAP (<b>A</b>), ABTS (<b>B</b>)) were determined in samples dissected 12 h after the radiation. For the catalase assay (<b>C</b>) and nitroblue tetrazolium (NBT) assay (<b>D</b>) samples were dissected 2 h after radiation. Results are expressed as mean ± SEM and are representative of two independent experiments. One-way ANOVA followed by Tukey’s post-test * <span class="html-italic">p</span> &lt; 0.05 compared to non-irradiated group, # <span class="html-italic">p</span> &lt; 0.05 compared to irradiated vehicle-treated group, ## <span class="html-italic">p</span> &lt; 0.05 compared to BML-111 group.</p>
Full article ">Figure 8
<p>BML-111 increases mRNA expression of Nrf2 signaling pathway and reduces gp91<sup>phox<b>.</b></sup> Skin samples were dissected 4 h after the radiation to determine the mRNA expression of Nrf2 (<b>A</b>), Nqo1 (<b>B</b>), Ho-1 (<b>C</b>), and gp91<sup>phox</sup> (<b>D</b>) by RT-qPCR. Results are expressed as mean ± SEM and are representative of two independent experiments. One-way ANOVA followed by Tukey’s post-test * <span class="html-italic">p</span> &lt; 0.05 compared to non-irradiated group, # <span class="html-italic">p</span> &lt; 0.05 compared to irradiated vehicle-treated group, ## <span class="html-italic">p</span> &lt; 0.05 compared to BML-111 group.</p>
Full article ">
26 pages, 5650 KiB  
Article
Localization of (+)-Catechin in Picea abies Phloem: Responses to Wounding and Fungal Inoculation
by Tuula Jyske, Katsushi Kuroda, Susanna Keriö, Andrey Pranovich, Riikka Linnakoski, Noriko Hayashi, Dan Aoki and Kazuhiko Fukushima
Molecules 2020, 25(12), 2952; https://doi.org/10.3390/molecules25122952 - 26 Jun 2020
Cited by 12 | Viewed by 3296
Abstract
To understand the positional and temporal defense mechanisms of coniferous tree bark at the tissue and cellular levels, the phloem topochemistry and structural properties were examined after artificially induced bark defense reactions. Wounding and fungal inoculation with Endoconidiophora polonica of spruce bark were [...] Read more.
To understand the positional and temporal defense mechanisms of coniferous tree bark at the tissue and cellular levels, the phloem topochemistry and structural properties were examined after artificially induced bark defense reactions. Wounding and fungal inoculation with Endoconidiophora polonica of spruce bark were carried out, and phloem tissues were frequently collected to follow the temporal and spatial progress of chemical and structural responses. The changes in (+)-catechin, (−)-epicatechin, stilbene glucoside, and resin acid distribution, and accumulation patterns within the phloem, were mapped using time-of-flight secondary ion mass spectrometry (cryo-ToF-SIMS), alongside detailed structural (LM, TEM, SEM) and quantitative chemical microanalyses of the tissues. Our results show that axial phloem parenchyma cells of Norway spruce contain (+)-catechins, the amount of which locally increases in response to fungal inoculation. The preformed, constitutive distribution and accumulation patterns of (+)-catechins closely follow those of stilbene glucosides. Phloem phenolics are not translocated but form a layered defense barrier with oleoresin compounds in response to pathogen attack. Our results suggest that axial phloem parenchyma cells are the primary location for (+)-catechin storage and synthesis in Norway spruce phloem. Chemical mapping of bark defensive metabolites by cryo-ToF-SIMS, in addition to structural and chemical microanalyses of the defense reactions, can provide novel information on the local amplitudes and localizations of chemical and structural defense mechanisms and pathogen–host interactions of trees. Full article
(This article belongs to the Special Issue Tannin Analysis, Chemistry, and Functions)
Show Figures

Figure 1

Figure 1
<p>Saplings in the greenhouse experiment (<b>A</b>) used to study the wounding and fungal inoculation-induced responses in terms of the amounts and localization of (+)-catechin, stilbene glucosides, and resin acids within the phloem. Stem section containing the inoculation site (<b>B</b>) and a schematic presentation of tissue positions from which the specimens for chemical and anatomical analyses of the phloem were collected.</p>
Full article ">Figure 2
<p>A positive ToF-SIMS spectrum of the frozen-hydrated, non-treated, control Norway spruce phloem of a sapling. Arrows indicate the peaks generated from (+)-catechin and abietic acid (<span class="html-italic">m</span>/<span class="html-italic">z</span> of 291).</p>
Full article ">Figure 3
<p>Positive ToF-SIMS images at the radial-longitudinal surface of the phloem in an older, non-treated, healthy Norway spruce tree from the cambium and non-collapsed phloem on the left (<b>1</b>) to the inner (<b>2</b>), middle (<b>3</b>–<b>4</b>), and outer (<b>5</b>) regions of the collapsed phloem, and the outermost collapsed phloem and periderm (<b>6</b>) on the right. Total secondary ions (<b>A</b>–<b>F</b>), <span class="html-italic">m</span>/<span class="html-italic">z</span> at 184 (<b>G</b>–<b>L</b>), 245 (<b>M</b>–<b>R</b>), and 291 (<b>S</b>–<b>X</b>) represent tissue structures, membranes of living cells, trans-astringin, and (+)-catechin, respectively.</p>
Full article ">Figure 4
<p>Relative ion intensity of (+)-catechin at <span class="html-italic">m</span>/<span class="html-italic">z</span> 291 as detected by ToF-SIMS in the regions of interest (ROI) in a non-treated, healthy tree. Axial phloem parenchyma (blue bars) and intermediate areas (gray bars) composed of sieve cells and ray parenchyma at the radial-longitudinal phloem surface of an older Norway spruce tree from the cambium and non-collapsed phloem on the left (<b>1</b>) to the inner (<b>2</b>), middle (<b>3</b>–<b>4</b>), and outer (<b>5</b>) regions of the collapsed phloem, with the outermost collapsed phloem and periderm (<b>6</b>) on the right. The black line represents the relative ion intensity of (+)-catechin in the total image area in each phloem region. The phloem regions are the same as those shown in <a href="#molecules-25-02952-f003" class="html-fig">Figure 3</a>. The relative ion intensities were computed per mL of the total ion counts in each image or ROI. The ion intensities of (+)-catechin were statistically higher in the axial parenchyma than in the intermediate spaces (<span class="html-italic">p</span> &lt; 0.001).</p>
Full article ">Figure 5
<p>Constitutive radial changes in (+)-catechin and stilbene glucoside amounts (sum of astringin and isorhapontin) across the mature Norway spruce phloem of an older and a younger non-treated tree, as analyzed by GC-FID. Each data point represents a tangential section (250–450 μm thick) representative of different phloem zones: C, cambium; NColP, noncollapsed phloem; ColP, collapsed phloem; P, periderm.</p>
Full article ">Figure 6
<p>Bright field microscopy images of transverse surface of phloem in saplings of Norway spruce 23 days after inoculation: control saplings (<b>A</b>–<b>D</b>), wounded saplings (<b>E</b>–<b>H</b>), and fungus-inoculated saplings (<b>I</b>–<b>L</b>). The uppermost panels (<b>A,E,I</b>) show overview of phloem; panels B, F, and J show the tissues in innermost phloem (tangential rows of axial phloem parenchyma, sieve cells); the panels C, G, and K show the outermost phloem; and panels D, H, and L show the details of cellular properties. Scale bars on each figure.</p>
Full article ">Figure 7
<p>Amounts of (+)-catechin (<b>A</b>), (−)-epicatechin (<b>B</b>), stilbene glucosides piceid (<b>C</b>), astringin (<b>D</b>), isorhapontin (<b>E</b>), total stilbenes (<b>F</b>), abietic acid (<b>G</b>), and total resin acids (H) in the phloem and bark of Norway spruce saplings during the 23-day period after treatment onset, as analyzed by GC-MS. The treatments were: control (“C”), wounding (“W”), and inoculation with fungi (“F”). Samples were at 5 and 10 mm from the treated location (wound/inoculation).</p>
Full article ">Figure 8
<p>Positive ToF-SIMS images of Norway spruce phloem from the inoculation site (on the left) upwards along the sapling stem (to the right). The outer bark is at the upper side of each image. Images of <span class="html-italic">m</span>/<span class="html-italic">z</span> at 184 (<b>A</b>), 302 (B), 245 (<b>C</b>), and 291 (<b>D</b>) represent living cells, abietic acid, stilbene glucoside astringin, and (+)-catechin, respectively. Total ion images (<b>E</b>) represent the structures of the sample surface. The colors of the pixels correspond to the ion intensities of the compounds on the specimen’s surface. Specifically, abietic acid, (+)-catechin, and stilbenes were absent from dark areas, showed mid-range concentrations in blue and green areas, and had the highest concentrations in yellow and red areas.</p>
Full article ">Figure 9
<p>Ion intensities of <span class="html-italic">m</span>/<span class="html-italic">z</span> at 184 (<b>A</b>), 245 (<b>B</b>), 291 (<b>C</b>), and 302 (<b>D</b>) representing living cell membranes, stilbene glucoside astringin, (+)-catechin, and abietic acid, respectively, obtained from ToF-SIMS spectra of the radial-longitudinal surface of a frozen-hydrated, fungus-inoculated Norway spruce sapling. The specimen is the same as that shown in <a href="#molecules-25-02952-f008" class="html-fig">Figure 8</a>. The ion intensity values of three consecutive pixels were averaged, and the results are shown as a function of the distance (µm) from the inoculation site.</p>
Full article ">Figure 10
<p>Positive ToF-SIMS images at the tangential-radial surface of wounded Norway spruce phloem from the xylem (on left) to the outer bark (on right) at different distance from the cambium (µm) The specimen location is 4 mm upwards from the wounding site on the sapling stem. Secondary ions at <span class="html-italic">m</span>/<span class="html-italic">z</span> 184 (A), 245 (<b>B</b>), and 291 (<b>C</b>) represent the membranes of living cells, stilbene glucoside astringin, and (+)-catechin, respectively. The total secondary ions (<b>D</b>) represent the tissue structures. The color of the pixels corresponds to the ion intensities of the compounds on the specimen surface. Specifically, (+)-catechin and stilbene glucosides were absent from dark areas, showed mid-range concentrations in blue areas, and had the highest concentrations in green and yellow areas. K areas showed mid-range concentrations in blue areas, had the highest concentrations in green and yellow areas.</p>
Full article ">Figure 11
<p>Ion intensities at <span class="html-italic">m</span>/<span class="html-italic">z</span> 184, 245, and 291 representing the membranes of living cells (<b>A</b>), stilbene glucoside astringin (<b>B</b>), and (+)-catechin, as detected by ToF-SIMS from the tangential-radial surface of frozen-hydrated Norway spruce phloem at different distance (µm) from the xylem to the cambium (the cambium location is 0 on the x-axis) and from the cambium to the outer bark of a wounded sapling. The ion counts are for the images shown in <a href="#molecules-25-02952-f010" class="html-fig">Figure 10</a><b>.</b></p>
Full article ">
15 pages, 3155 KiB  
Article
Mechanochemical Preparation of Pd(II) and Pt(II) Composites with Carbonaceous Materials and Their Application in the Suzuki-Miyaura Reaction at Several Energy Inputs
by Mohamed M.A. Soliman, Andreia F. Peixoto, Ana P.C. Ribeiro, Maximilian N. Kopylovich, Elisabete C.B.A. Alegria and Armando J.L. Pombeiro
Molecules 2020, 25(12), 2951; https://doi.org/10.3390/molecules25122951 - 26 Jun 2020
Cited by 5 | Viewed by 2829
Abstract
Pd(II) and Pt(II) composites with activated carbon (AC), graphene oxide, and multiwalled carbon nanotubes were prepared by ball milling and used as catalysts for the Suzuki-Miyaura reaction, under several energy inputs (mechanical grinding, conventional heating, and microwave irradiation). The catalytic composites were characterized [...] Read more.
Pd(II) and Pt(II) composites with activated carbon (AC), graphene oxide, and multiwalled carbon nanotubes were prepared by ball milling and used as catalysts for the Suzuki-Miyaura reaction, under several energy inputs (mechanical grinding, conventional heating, and microwave irradiation). The catalytic composites were characterized by ICP-MS, BET, XPS analyses, TEM, and SEM. The average particle size of the prepared composites was estimated to be in the range of 6–30 nm, while the loadings of Pd and Pt did not significantly affect the surface area of the AC support due to the tendency to agglomerate as observed by the TEM analysis. The Pd/AC composites exhibit high mechanochemical catalytic activity in cross-coupling of bromobenzene and phenylboronic acid with molar yields up to 80% with TON and TOF of 222 and 444 h−1, respectively, achieved with Pd(4.7 wt%)-AC catalyst under the liquid assisted grinding for 0.5 h at ambient conditions, using cyclohexene as an additive. Full article
(This article belongs to the Special Issue Green Organometallic Chemistry)
Show Figures

Graphical abstract

Graphical abstract
Full article ">Figure 1
<p>TEM images of AC-Pd1 (<b>a</b>), AC-Pd2 (<b>b</b>) and AC-Pt2 (<b>c</b>).</p>
Full article ">Figure 2
<p>SEM images of AC-Pd1 (<b>a</b>,<b>b</b>), AC-Pd2 (<b>c</b>,<b>d</b>), 10 µm scale (<b>a</b>,<b>c</b>) and 2000× magnification (<b>b</b>,<b>d</b>).</p>
Full article ">Figure 3
<p>Particle size distribution in the AC-Pd2 sample.</p>
Full article ">Figure 4
<p>XPS profiles of the catalysts in the Pd 3d and Pt 4f regions.</p>
Full article ">Figure 5
<p>N<sub>2</sub> adsorption-desorption isotherms of synthesized AC-Pd1 (<b>a</b>), AC-Pd2 (<b>b</b>), AC-Pt1 (<b>c</b>), and AC-Pt2 (<b>d</b>) composites.</p>
Full article ">Figure 6
<p>Cross-coupling Suzuki-Miyaura reaction of bromobenzene and phenylboronic, catalyzed by AC-Pd1, AC-Pd2, AC-Pt1, and AC-Pt2 composites. Reaction conditions: 2.5 mg catalyst, 0.6 mmol PhB(OH)<sub>2</sub>, 0.5 mmol PhBr, 1.0 mmol K<sub>2</sub>CO<sub>3</sub>, 2 mL EtOH, Ball mill: 10 milling spheres, 500 rpm, rotation interval (5 min) during 10 or 30 min.</p>
Full article ">Figure 7
<p>Conventional and microwave (MW) irradiation heating methods vs. time on the Suzuki-Miyaura (SM) reaction.</p>
Full article ">Scheme 1
<p>Suzuki-Miyaura reaction of bromobenzene and phenylboronic acid (typical reaction conditions)<b>.</b></p>
Full article ">
14 pages, 1659 KiB  
Article
Structure-Activity Relationships for the Anaesthetic and Analgaesic Properties of Aromatic Ring-Substituted Ketamine Esters
by Ivaylo V. Dimitrov, Martyn G. Harvey, Logan J. Voss, James W. Sleigh, Michael J. Bickerdike and William A. Denny
Molecules 2020, 25(12), 2950; https://doi.org/10.3390/molecules25122950 - 26 Jun 2020
Cited by 4 | Viewed by 3964
Abstract
A series of benzene ring substituted ketamine N-alkyl esters were prepared from the corresponding substituted norketamines. Few of the latter have been reported since they have not been generally accessible via known routes. We report a new general route to many of [...] Read more.
A series of benzene ring substituted ketamine N-alkyl esters were prepared from the corresponding substituted norketamines. Few of the latter have been reported since they have not been generally accessible via known routes. We report a new general route to many of these norketamines via the Neber (oxime to α-aminoketone) rearrangement of readily available substituted 2-phenycyclohexanones. We explored the use of the substituents Cl, Me, OMe, CF3, and OCF3, with a wide range of lipophilic and electronic properties, at all available benzene ring positions. The 2- and 3-substituted compounds were generally more active than 4-substituted compounds. The most generally acceptable substituent was Cl, while the powerful electron-withdrawing substituents CF3 and OCF3 provided fewer effective analogues. Full article
Show Figures

Graphical abstract

Graphical abstract
Full article ">Figure 1
<p>Ketamine, tiletamine.</p>
Full article ">Figure 2
<p>Known norketamine analogues.</p>
Full article ">Scheme 1
<p>Synthesis of ketamine alkyl esters; Reagents and conditions: (i) Br(CH<sub>2</sub>)<sub>2</sub>CO<sub>2</sub><span class="html-italic"><sup>i</sup></span>Pr, K<sub>2</sub>CO<sub>3</sub>, KI, MeCN, reflux 12–48h; (ii) Br(CH<sub>2</sub>)<sub>4</sub>CO<sub>2</sub>Me, KI, MeCN, reflux 12–48h.</p>
Full article ">Scheme 2
<p>Synthesis of ring-substituted norketamines <b>21, 22, 30b,c, e–i, k–p.</b> R = : <b>a</b>, H; <b>b</b>, 2-F; <b>c</b>, 3-Cl; <b>d</b>, 4-Cl; <b>e</b>, 2-Me; <b>f</b>, 3-Me; <b>g</b>, 4-Me; <b>h</b>, 2-OMe; <b>i</b>, 3-OMe; <b>j</b>, 4-OMe; <b>k</b>, 2-CF<sub>3</sub>; <b>l</b>, 3-CF<sub>3</sub>, <b>m</b>, 4-CF<sub>3</sub>; <b>n</b>, 2-OCF<sub>3</sub>; <b>o</b>, 3-OCF<sub>3</sub>; <b>p</b>, 4-OCF<sub>3</sub>; Reagents and conditions: (i) NH<sub>2</sub>NMe<sub>2</sub>, EtOH, reflux 18 h; (ii) (a) MeI, MeCN, 40 °C for 2 h then 70 °C for 3 h; (iii) NaOEt, EtOH, reflux, 1 h.</p>
Full article ">Scheme 3
<p>Synthesis of nortiletamine; Reagents and Conditions: (i) BzCl, pyridine, n-hexane-CH<sub>2</sub>Cl<sub>2</sub> (10:1), 4 h r.t., then TFAA, CH<sub>2</sub>Cl<sub>2</sub>, r.t. 12 h, 89%; (ii) thiophene, <span class="html-italic">n</span>-BuLi, MeAlCl, THF, r.t. 30 min, then <b>32</b>, reflux, 3 h, 66%; (iii) NaOH (5% in MeOH), r.t. 12 h; (iv) Jones reagent, 84%.</p>
Full article ">
18 pages, 2414 KiB  
Article
Properties of Dicationic Disiloxane Ionic Liquids
by Vladimir G. Krasovskiy, Gennady I. Kapustin, Olga B. Gorbatsevich, Lev M. Glukhov, Elena A. Chernikova, Anatoly A. Koroteev and Leonid M. Kustov
Molecules 2020, 25(12), 2949; https://doi.org/10.3390/molecules25122949 - 26 Jun 2020
Cited by 8 | Viewed by 2875
Abstract
A number of dicationic ionic liquids with a disiloxane linker between imidazolium cations and bis(trifluoromethylsulfonyl)imide anion were synthesized and characterized. Melting points, viscosity, and volatility in a vacuum were measured; the thermal and hydrolytic stability of ionic liquids were also studied. The dependence [...] Read more.
A number of dicationic ionic liquids with a disiloxane linker between imidazolium cations and bis(trifluoromethylsulfonyl)imide anion were synthesized and characterized. Melting points, viscosity, and volatility in a vacuum were measured; the thermal and hydrolytic stability of ionic liquids were also studied. The dependence of the properties on the structure of substituents in the cation of the ionic liquid was demonstrated. Full article
(This article belongs to the Section Green Chemistry)
Show Figures

Graphical abstract

Graphical abstract
Full article ">Figure 1
<p>Di(chloroalkyl)tetramethyldisiloxanes and substituted imidazoles used for the synthesis of ionic liquids.</p>
Full article ">Figure 2
<p>Composition of the reaction mixture (after 6 h at 60 °C) at different initial molar ratios of symmetric disiloxanes (<b>a</b>—II/I, <b>b</b>—I/II) according to GLC data (numbers I–III correspond to the structures in <a href="#molecules-25-02949-f001" class="html-fig">Figure 1</a>).</p>
Full article ">Figure 3
<p>Temperature dependences of kinematic viscosity of IL 4–6, 8, and 10–12.</p>
Full article ">Figure 4
<p><sup>29</sup>Si NMR spectra of chloride IL 7 (<b>a</b>), IL 9 (<b>b</b>), and IL 8 (<b>c</b>).</p>
Full article ">Figure 4 Cont.
<p><sup>29</sup>Si NMR spectra of chloride IL 7 (<b>a</b>), IL 9 (<b>b</b>), and IL 8 (<b>c</b>).</p>
Full article ">Scheme 1
<p>The synthesis of disiloxane dicationic ionic liquids 1–12.</p>
Full article ">Scheme 2
<p>Synthesis of an asymmetric linker–1′,1′,3′,3′-tetramethyl-1′-(chloromethyl)-3′-(3-chloropropyl)disiloxane.</p>
Full article ">Scheme 3
<p>Mechanism of the formation of an asymmetric disiloxane in the presence of a solid strongly acidic cation exchange resin (CER).</p>
Full article ">Scheme 4
<p>Bonds polarity in the cation of a disiloxane dicationic chloride IL.</p>
Full article ">Scheme 5
<p>Hydrolysis of the Si-C-bond in the cation of a disiloxane dicationic IL.</p>
Full article ">Scheme 6
<p>Protolysis side-reactions leading to impossibility of direct synthesis of ILs 7 and 9.</p>
Full article ">Scheme 7
<p>Silanol formation during hydrolysis of a siloxane linker in the IL cation.</p>
Full article ">
37 pages, 9207 KiB  
Review
Near-Infrared Spectroscopy in Bio-Applications
by Krzysztof B. Beć, Justyna Grabska and Christian W. Huck
Molecules 2020, 25(12), 2948; https://doi.org/10.3390/molecules25122948 - 26 Jun 2020
Cited by 213 | Viewed by 20905
Abstract
Near-infrared (NIR) spectroscopy occupies a specific spot across the field of bioscience and related disciplines. Its characteristics and application potential differs from infrared (IR) or Raman spectroscopy. This vibrational spectroscopy technique elucidates molecular information from the examined sample by measuring absorption bands resulting [...] Read more.
Near-infrared (NIR) spectroscopy occupies a specific spot across the field of bioscience and related disciplines. Its characteristics and application potential differs from infrared (IR) or Raman spectroscopy. This vibrational spectroscopy technique elucidates molecular information from the examined sample by measuring absorption bands resulting from overtones and combination excitations. Recent decades brought significant progress in the instrumentation (e.g., miniaturized spectrometers) and spectral analysis methods (e.g., spectral image processing and analysis, quantum chemical calculation of NIR spectra), which made notable impact on its applicability. This review aims to present NIR spectroscopy as a matured technique, yet with great potential for further advances in several directions throughout broadly understood bio-applications. Its practical value is critically assessed and compared with competing techniques. Attention is given to link the bio-application potential of NIR spectroscopy with its fundamental characteristics and principal features of NIR spectra. Full article
Show Figures

Graphical abstract

Graphical abstract
Full article ">Figure 1
<p>(<b>a</b>,<b>b</b>) Vibrational potential, vibrational levels and transitions of diatomic (i.e., one-dimensional) oscillator in (<b>a</b>) harmonic approximation, and (<b>b</b>) its real (anharmonic) nature, (<b>c</b>,<b>d</b>) comparison of infrared (IR) (<b>c</b>) and near-infrared (NIR) (<b>d</b>) spectra of the same sample (wood of Douglas fir species). The symbols denote: <span class="html-italic">V</span>—the potential energy; <span class="html-italic">q</span>—vibrational coordinate; <span class="html-italic">k</span>—force constant; <span class="html-italic">n</span>—vibrational quantum number. Panels (<b>c</b>,<b>d</b>) reproduced with permission from Springer Open, Ref. [<a href="#B16-molecules-25-02948" class="html-bibr">16</a>].</p>
Full article ">Figure 2
<p>Dissection of the PLS regression vectors developed by Henn et al. [<a href="#B33-molecules-25-02948" class="html-bibr">33</a>] for prediction of blood constituents from NIR absorbance (<b>I.A</b>) and IR difference (<b>II.A</b>) spectra of a 5-component model mixture in artificial dialysate solutions. Relative (to the maximum value) intensity of the regression vector for glucose (<b>B</b>) and urea (<b>C</b>), lactate (<b>D</b>), phosphate (<b>E</b>) and creatinine (<b>F</b>). Adapted in agreement with CC BY 4.0 license, Ref. [<a href="#B35-molecules-25-02948" class="html-bibr">35</a>].</p>
Full article ">Figure 3
<p>The structure of PLS regression coefficients vectors for simultaneous determination of HSA (<b>a</b>,<b>d</b>), γ-globulin (<b>b</b>,<b>e</b>), and glucose (<b>c</b>,<b>f</b>) concentrations from NIR spectra of model solutions developed by Kasemsumran et al. Ref. [<a href="#B36-molecules-25-02948" class="html-bibr">36</a>]. Reproduced with permission from Royal Chemical Society, Ref. [<a href="#B36-molecules-25-02948" class="html-bibr">36</a>].</p>
Full article ">Figure 4
<p>UV-vis-NIR spectrum of AuNRs suspension in water (<b>A</b>). Spectra of gold nanorods (AuNRs) dispersed in serum containing media (SCM) with 0–30% of fetal bovine serum (FBS) and different incubation times (<b>B</b>). Spectra of bovine serum albumin (BSA)/AuNRs samples (<b>C</b>). Reproduced in agreement with CC BY 4.0 license from Ref. [<a href="#B46-molecules-25-02948" class="html-bibr">46</a>].</p>
Full article ">Figure 5
<p>NIR image presenting the distribution of total hemoglobin (tHb) and tissue oxygen saturation (stO2) concentrations on both left and right breast acquired from a 56-year-old subject. Reproduced in compliance with CC BY license from Ref. [<a href="#B53-molecules-25-02948" class="html-bibr">53</a>].</p>
Full article ">Figure 6
<p>NIR spectra of <span class="html-italic">Rosmarini folium</span> samples measured on benchtop (NIRFlex N-500) and handheld (microPHAZIR and MicroNIR 2200) spectrometers. Reproduced with permission from Royal Society of Chemistry, Ref. [<a href="#B75-molecules-25-02948" class="html-bibr">75</a>].</p>
Full article ">Figure 7
<p>A visual assessment and evaluation of the chemical sensitivity profiles of NIR spectrometers (reference benchtop vs. handheld) by two-dimensional correlation spectroscopy (2D-COS).</p>
Full article ">Figure 8
<p>PLS regression coefficients plots for the best performing calibration models for verbenalin and verbascoside content in <span class="html-italic">Verbena officinalis</span> samples. The models were constructed for NIR spectra measured on NIRFlex N-500 (benchtop) and microPhazir (miniaturized) spectrometers. Reproduced with permission from Elsevier, Ref. [<a href="#B77-molecules-25-02948" class="html-bibr">77</a>].</p>
Full article ">Figure 9
<p>The analysis of NIR images of medicinal plants. PCA score image (t1) of <span class="html-italic">Echinacea sp</span>. leaf powders based on color amplitudes (<b>a</b>). The corresponding score plot (PC1 vs. PC3) shows minimal separation of the pixel clusters (<b>b</b>). (EAL—<span class="html-italic">E. angustifolia</span> leaf, EPL—<span class="html-italic">E. purpurea</span> leaf, EPaL—<span class="html-italic">E. pallida</span> leaf). Reproduced in compliance with CC BY license from Ref. [<a href="#B80-molecules-25-02948" class="html-bibr">80</a>].</p>
Full article ">Figure 10
<p>PCA scores plot of NIR spectra of yolk measured over the development time of <span class="html-italic">Oryzias latipes</span> embryo (<b>a</b>). Δ indicates the data collected from the first to the tenth day and ⚪ denotes data collected at the day before hatching. Loadings plot of PC-1 (<b>b</b>). Reproduced from Ref. [<a href="#B83-molecules-25-02948" class="html-bibr">83</a>] in agreement with CC BY 4.0 license.</p>
Full article ">Figure 11
<p>Insight into origins of the NIR spectrum available from quantum chemical calculation on the example of a short chain fatty acid (vinyl acetic acid). Note, all bands are presented in common intensity scale (two inside panels present scaled-up intensity). This demonstrates well the convoluted nature of NIR spectra, which results from strongly overlapping numerous weak bands. Reproduced with permission from Ref. [<a href="#B91-molecules-25-02948" class="html-bibr">91</a>]. Copyright (2017) American Chemical Society.</p>
Full article ">Figure 12
<p>The analysis of mode contribution for the NIR spectrum of thymol (solution; 100 mg mL<sup>−1</sup> CCl<sub>4</sub>) based on the simulated data. (<b>A</b>) Experimental and simulated outlines. (<b>B</b>) Contributions of selected modes as described on the figure. Reproduced with permission from Ref. [<a href="#B96-molecules-25-02948" class="html-bibr">96</a>].</p>
Full article ">Figure 13
<p>Simulated spectra of the carbohydrate-hydration shell system on the example of glucose and fructose. The color bars represent the relative spectral contributions (color scale: yellow—high; black—none) from: pure vibrations of hydration shell (h.s.); pure vibrations of carbohydrate (c.); cooperative vibrations of carbohydrate and hydration shell (coop). Reproduced in compliance with CC BY 4.0 license from Ref. [<a href="#B104-molecules-25-02948" class="html-bibr">104</a>].</p>
Full article ">Figure 14
<p>(<b>a</b>) Schematic illustration of the neurovascular unit and the changes in cerebral hemodynamics and oxygenation induced by neural activity. (<b>b</b>) Exemplary illustration of a possible NIRS montage on the human head and the assumed banana-shaped course of detected light of “short-separation channels” and of “long-separation channels”. fNIRS, functional near-infrared spectroscopy; CMRO2, cerebral metabolic rate of oxygen; increase; decrease. Reproduced in compliance with CC BY 4.0 license from Ref. [<a href="#B113-molecules-25-02948" class="html-bibr">113</a>].</p>
Full article ">Figure 15
<p>Discrimination between terrain types and different types of vegetation based on a cost-effective UAV NIR spectroscopy. (<b>a</b>) Reference NIR spectral signatures associated to the elements of terrain and vegetation; (<b>b</b>) the reference Vis (RGB) multispectral image; (<b>c</b>,<b>d</b>) classification maps derived from NIR spectral analysis using different methods of classification for image generation. Adopted in agreement with CC BY 4.0 license, from Ref. [<a href="#B128-molecules-25-02948" class="html-bibr">128</a>].</p>
Full article ">
14 pages, 1647 KiB  
Article
The Effect of Growth Medium Strength on Minimum Inhibitory Concentrations of Tannins and Tannin Extracts against E. coli
by Sara Štumpf, Gregor Hostnik, Mateja Primožič, Maja Leitgeb, Juha-Pekka Salminen and Urban Bren
Molecules 2020, 25(12), 2947; https://doi.org/10.3390/molecules25122947 - 26 Jun 2020
Cited by 35 | Viewed by 6861
Abstract
In this study the effect of growth medium strength on the minimum inhibitory concentration (MIC) of different tannins and tannin extracts against Escherichia coli was systematically investigated for the first time. Three pure compounds (vescalagin, castalagin and gallic acid) and five extracts (chestnut, [...] Read more.
In this study the effect of growth medium strength on the minimum inhibitory concentration (MIC) of different tannins and tannin extracts against Escherichia coli was systematically investigated for the first time. Three pure compounds (vescalagin, castalagin and gallic acid) and five extracts (chestnut, quebracho, mimosa, Colistizer and tannic acid) were studied. Broth microdilution was assayed and bacteria were grown using different growth medium strengths varying from half to double the concentration recommended by the producer. MICs were determined using the iodonitrotetrazolium chloride (INT) dye or turbidity measurements. It was observed that MIC values depend on the growth medium strength. With an increase in the growth medium concentration MIC values rose roughly linearly for all samples, while their relative order remained unchanged, indicating that a direct interaction of tannins with growth medium nutrients represents the likely source of their antimicrobial activity. Understanding the effect of growth medium strength can finally yield a plausible explanation for the observed variation in MIC values reported in the scientific literature as well as provide help in planning proper applications of tannins in the livestock production. Full article
(This article belongs to the Special Issue Tannin Analysis, Chemistry, and Functions)
Show Figures

Graphical abstract

Graphical abstract
Full article ">Figure 1
<p>Chemical structures of (<b>a</b>) diastereoisomers castalagin (R<sub>1</sub> = H, R<sub>2</sub> = OH) and vescalagin (R<sub>1</sub> = OH, R<sub>2</sub> = H), (<b>b</b>) gallic acid, (<b>c</b>) decagalloylglucose, one of the gallotannins typically present in tannic acid.</p>
Full article ">Figure 2
<p>A comparison of MIC values, determined by measurement of the OD and by addition of the INT dye at (<b>a</b>) half the concentration of <span class="html-italic">E. coli</span> growth medium recommended by the producer, (<b>b</b>) the concentration of <span class="html-italic">E. coli</span> growth medium recommended by the producer, (<b>c</b>) one and a half the concentration of <span class="html-italic">E. coli</span> growth medium recommended by the producer and (<b>d</b>) double the concentration of <span class="html-italic">E. coli</span> growth medium recommended by the producer. Error bars represent 95% confidence interval.</p>
Full article ">Figure 3
<p>Dependence of the normalized MIC on the <span class="html-italic">E. coli</span> growth medium concentration, determined by (<b>a</b>) measuring OD and (<b>b</b>) using INT dye. MIC values were normalized with respect to the growth medium concentration recommended by the producer.</p>
Full article ">
13 pages, 3070 KiB  
Communication
Hybrid Quinoline-Sulfonamide Complexes (M2+) Derivatives with Antimicrobial Activity
by Dumitrela Diaconu, Violeta Mangalagiu, Dorina Amariucai-Mantu, Vasilichia Antoci, Cristian Levente Giuroiu and Ionel I. Mangalagiu
Molecules 2020, 25(12), 2946; https://doi.org/10.3390/molecules25122946 - 26 Jun 2020
Cited by 12 | Viewed by 3794
Abstract
Two new series of hybrid quinoline-sulfonamide complexes (M2+: Zn2+, Cu2+, Co2+ and Cd2+) derivatives (QSC) were designed, synthesized and tested for their antimicrobial activity. The synthesis is straightforward and efficient, involving two [...] Read more.
Two new series of hybrid quinoline-sulfonamide complexes (M2+: Zn2+, Cu2+, Co2+ and Cd2+) derivatives (QSC) were designed, synthesized and tested for their antimicrobial activity. The synthesis is straightforward and efficient, involving two steps: acylation of aminoquinoline followed by complexation with metal acetate (Cu2+, Co2+ and Cd2+) or chloride (Zn2+). The synthesized QSC compounds were characterized by FTIR and NMR spectroscopy and by X-ray diffraction on single crystal. The QSC compounds were preliminary screened for their antibacterial and antifungal activity and the obtained results are very promising. In this respect, the hybrid N-(quinolin-8-yl)-4-chloro-benzenesulfonamide cadmium (II), considered as leading structure for further studies, has an excellent antibacterial activity against Staphylococcus aureus ATCC25923 (with a diameters of inhibition zones of 21 mm and a minimum inhibitory concentration (MIC) of 19.04 × 10⁻⁵ mg/mL), a very good antibacterial activity against Escherichia coli ATCC25922 (with a diameters of inhibition zones of 19 mm and a MIC of 609 × 10−5 mg/mL), and again an excellent antifungal activity against Candida albicans ATCC10231 (with a diameters of inhibition zones of 25 mm and a MIC of 19.04 × 10⁻⁵ mg/mL). Full article
Show Figures

Graphical abstract

Graphical abstract
Full article ">Figure 1
<p>FT-IR spectra of sulfonamide ligand 3a, zinc (II) complex (4a), copper (II) complex (4b), cobalt (II) complex (4c) and cadmium (II) complex (4d).</p>
Full article ">Figure 2
<p><sup>1</sup>H-NMR spectra for sulfonamide ligand (<b>3a</b>) and its complexes (<b>4a</b>–<b>d</b>). At the bottom part of the image is represented a detail of aromatic zone (7–11 ppm).</p>
Full article ">Figure 3
<p><sup>13</sup>C{<sup>1</sup>H}-NMR spectra detail (110–160 ppm) for sulfonamide ligand (<b>3a</b>), Zn (II) and Cd (II) complexes.</p>
Full article ">Figure 4
<p>(<b>A</b>) Molecular structure of [Co(<span class="html-italic">N</span>-(quinoline-8-yl)-4-chloro-benzenesulfonamide)<sub>2</sub>] <b>4c</b> complex. (<b>B</b>) Molecular structure of [Cu(<span class="html-italic">N</span>-(quinoline-8-yl)-4-chloro-benzenesulfonamide)<sub>2</sub>] <b>4b</b> complex.</p>
Full article ">Figure 5
<p>(<b>A</b>) The antibacterial activity for <b>QBSC</b> compounds <b>4a</b> (CD 75Zn), <b>4b</b> (CD 75Cu), <b>4c</b> (CD 75Co) and <b>4d</b> (CD 75Cd) against <span class="html-italic">S. aureus</span> (C+: positive control; C−: negative control). (<b>B</b>) The antibacterial activity for <b>QBSC</b> compounds <b>4a</b> (CD 75Zn), <b>4b</b> (CD 75Cu), <b>4c</b> (CD 75Co) and <b>4d</b> (CD 75Cd) against <span class="html-italic">E. coli</span> (C+: positive control; C−: negative control). (<b>C</b>) The antifungal activity for <b>QBSC</b> compounds <b>4a</b> (CD 75Zn), <b>4b</b> (CD 75Cu), <b>4c</b> (CD 75Co) and <b>4d</b> (CD 75Cd) against <span class="html-italic">C. albicans</span> (C+: positive control; C−: negative control).</p>
Full article ">Scheme 1
<p>Design in the class of hybrid quinoline-sulfonamide complexes derivatives.</p>
Full article ">Scheme 2
<p>Reaction pathways to obtain hybrid quinoline-sulfonamide complexes derivatives.</p>
Full article ">
20 pages, 2120 KiB  
Article
Optimising the Hydraulic Retention Time in a Pilot-Scale Microbial Electrolysis Cell to Achieve High Volumetric Treatment Rates Using Concentrated Domestic Wastewater
by Daniel D. Leicester, Jaime M. Amezaga, Andrew Moore and Elizabeth S. Heidrich
Molecules 2020, 25(12), 2945; https://doi.org/10.3390/molecules25122945 - 26 Jun 2020
Cited by 29 | Viewed by 4429
Abstract
Bioelectrochemical systems (BES) have the potential to deliver energy-neutral wastewater treatment. Pilot-scale tests have proven that they can operate at low temperatures with real wastewaters. However, volumetric treatment rates (VTRs) have been low, reducing the ability for this technology to compete with activated [...] Read more.
Bioelectrochemical systems (BES) have the potential to deliver energy-neutral wastewater treatment. Pilot-scale tests have proven that they can operate at low temperatures with real wastewaters. However, volumetric treatment rates (VTRs) have been low, reducing the ability for this technology to compete with activated sludge (AS). This paper describes a pilot-scale microbial electrolysis cell (MEC) operated in continuous flow for 6 months. The reactor was fed return sludge liquor, the concentrated filtrate of anaerobic digestion sludge that has a high chemical oxygen demand (COD). The use of a wastewater with increased soluble organics, along with optimisation of the hydraulic retention time (HRT), resulted in the highest VTR achieved by a pilot-scale MEC treating real wastewater. Peak HRT was 0.5-days, resulting in an average VTR of 3.82 kgCOD/m3∙day and a 55% COD removal efficiency. Finally, using the data obtained, a direct analysis of the potential savings from the reduced loading on AS was then made. Theoretical calculation of the required tank size, with the estimated costs and savings, indicates that the use of an MEC as a return sludge liquor pre-treatment technique could result in an industrially viable system. Full article
Show Figures

Graphical abstract

Graphical abstract
Full article ">Figure 1
<p>A simple diagram to represent wastewater flowing around the cassette style electrodes.</p>
Full article ">Figure 2
<p>Current density, chemical oxygen demand (COD) removal efficiency and COD volumetric treatment rates (VTRs) with comparison to Log (HRT).</p>
Full article ">Figure 3
<p>A graph to represent how the influent COD affects the VTR. Data collected during HRT optimisation is shown in red (3 L/h), and data collected from RSL recirculation can be seen in blue (3 L/h) and green (1.5 L/h).</p>
Full article ">Figure 4
<p>A theoretical tank design required for the actual flow rate found at Howdon Wastewater Treatment Plant (NWL). Values have been calculated based on experimental values from <a href="#sec2dot4-molecules-25-02945" class="html-sec">Section 2.4</a>.</p>
Full article ">Figure 5
<p>Current density (left) and hydrogen production (right) during start-up, batch mode and continuous flow in each individual electrode. Continuous flow started on day 39.</p>
Full article ">Figure 6
<p>The pilot-scale MEC, showing the electrodes in the ‘cassette’ style design.</p>
Full article ">
15 pages, 1826 KiB  
Communication
Data and Text Mining Help Identify Key Proteins Involved in the Molecular Mechanisms Shared by SARS-CoV-2 and HIV-1
by Olga Tarasova, Sergey Ivanov, Dmitry A. Filimonov and Vladimir Poroikov
Molecules 2020, 25(12), 2944; https://doi.org/10.3390/molecules25122944 - 26 Jun 2020
Cited by 11 | Viewed by 3893
Abstract
Viruses can be spread from one person to another; therefore, they may cause disorders in many people, sometimes leading to epidemics and even pandemics. New, previously unstudied viruses and some specific mutant or recombinant variants of known viruses constantly appear. An example is [...] Read more.
Viruses can be spread from one person to another; therefore, they may cause disorders in many people, sometimes leading to epidemics and even pandemics. New, previously unstudied viruses and some specific mutant or recombinant variants of known viruses constantly appear. An example is a variant of coronaviruses (CoV) causing severe acute respiratory syndrome (SARS), named SARS-CoV-2. Some antiviral drugs, such as remdesivir as well as antiretroviral drugs including darunavir, lopinavir, and ritonavir are suggested to be effective in treating disorders caused by SARS-CoV-2. There are data on the utilization of antiretroviral drugs against SARS-CoV-2. Since there are many studies aimed at the identification of the molecular mechanisms of human immunodeficiency virus type 1 (HIV-1) infection and the development of novel therapeutic approaches against HIV-1, we used HIV-1 for our case study to identify possible molecular pathways shared by SARS-CoV-2 and HIV-1. We applied a text and data mining workflow and identified a list of 46 targets, which can be essential for the development of infections caused by SARS-CoV-2 and HIV-1. We show that SARS-CoV-2 and HIV-1 share some molecular pathways involved in inflammation, immune response, cell cycle regulation. Full article
Show Figures

Figure 1

Figure 1
<p>KEGG pathways enriched in the genes associated with the human proteins found by our analysis. Each color represents an individual pathway. The size of each box reflects the number of proteins involved in that particular pathway. The number of proteins involved in each pathway is given in brackets.</p>
Full article ">Figure 2
<p>KEGG pathways enriched in the genes associated with human proteins involved in both SARS-CoV-2–host and Dengue–host interactions. Each color represents an individual pathway. The size of each box reflects the number of proteins involved in that particular pathway. The number of proteins involved in each pathway is given in brackets.</p>
Full article ">Figure 3
<p>The Toll-like receptor signaling pathway includes the highest number of the proteins identified, related to immune system pathways and appearing in both SARS-CoV-2 and HIV-1 infections.</p>
Full article ">Figure 4
<p>The distribution of diseases and pathological conditions by the number of protein targets associated with them.</p>
Full article ">Figure 5
<p>General scheme of the data extraction and analysis.</p>
Full article ">
15 pages, 1758 KiB  
Article
Tannin-Rich Plants as Natural Manipulators of Rumen Fermentation in the Livestock Industry
by G. M. Fagundes, G. Benetel, K. C. Santos, K. C. Welter, F. A. Melo, J. P. Muir and I. C. S. Bueno
Molecules 2020, 25(12), 2943; https://doi.org/10.3390/molecules25122943 - 26 Jun 2020
Cited by 16 | Viewed by 3003
Abstract
Condensed tannins (CTs) are plant anti-herbivore compounds with antimicrobial activity that can be used in ruminant diets as ruminal microbiome manipulators. However, not all CTs from fodder legumes are bioactive due to their wide structural diversity. The aim of our study was to [...] Read more.
Condensed tannins (CTs) are plant anti-herbivore compounds with antimicrobial activity that can be used in ruminant diets as ruminal microbiome manipulators. However, not all CTs from fodder legumes are bioactive due to their wide structural diversity. The aim of our study was to investigate the effect of 10 CT-containing plants (Flemingia macrophylla, Leucaena leucocephala, Stylosanthes guianensis, Gliricidia sepium, Cratylia argentea, Cajanus cajan, Desmodium ovalifolium, Macrotiloma axilare, D. paniculatum, and Lespedeza procumbens) on in vitro fermentation kinetics of Nelore beef cattle. Polyethylene glycol (PEG), a specific CT-binding agent, was added to neutralize condensed tannin. Tifton and alfalfa hay were used as controls lacking CT. The experimental layout included a randomized complete block with factorial design and four blocks. The data were subjected to analysis of variance followed by Duncan’s test to determine differences (p < 0.05) among treatment means. The addition of PEG in browse incubations resulted in increased gas production, fermentation rate, short-chain fatty acid (SCFA) and N-NH3 release. Within our study, Lespedeza procumbens, Desmodium paniculatum, Leucaena leucocephala, Desmodium ovalifolium, and Flemingia macrophylla showed superior bioactivity compared to other species evaluated, suggesting a natural alternative for replacing ionophores to modify ruminal fermentation. Condensed tannins from L. pocumbens, D. paniculatum, L. leucocephala, D. ovalifolium, and F. macrophylla have the potential to modify rumen fermentation in beef cattle. Full article
(This article belongs to the Special Issue Tannin Analysis, Chemistry, and Functions)
Show Figures

Figure 1

Figure 1
<p>Cumulative gas production curves of <span class="html-italic">Cratylia argentea</span>, <span class="html-italic">Cajanus cajan</span>, <span class="html-italic">Desmodium ovalifolium</span>, and <span class="html-italic">Desmodium paniculatum</span> incubated at the end of 96 h.</p>
Full article ">Figure 2
<p>Cumulative gas production curves of <span class="html-italic">Flemingia macrophylla</span>, <span class="html-italic">Gliricidia sepium</span>, <span class="html-italic">Lespedeza procumbens</span>, and <span class="html-italic">Leucaena leucocephala</span> incubated at the end of 96 h.</p>
Full article ">Figure 3
<p>Cumulative gas production curves of <span class="html-italic">Macrotiloma axilare</span> and <span class="html-italic">Stylosanthes guianensis</span> incubated at the end of 96 h.</p>
Full article ">Figure 4
<p>Gas production curves of legumes forages incubated at the end of 96 h.</p>
Full article ">Figure 4 Cont.
<p>Gas production curves of legumes forages incubated at the end of 96 h.</p>
Full article ">
16 pages, 3249 KiB  
Article
Characterization, Classification and Authentication of Turmeric and Curry Samples by Targeted LC-HRMS Polyphenolic and Curcuminoid Profiling and Chemometrics
by Nerea Núñez, Oscar Vidal-Casanella, Sonia Sentellas, Javier Saurina and Oscar Núñez
Molecules 2020, 25(12), 2942; https://doi.org/10.3390/molecules25122942 - 26 Jun 2020
Cited by 18 | Viewed by 4324
Abstract
The importance of monitoring bioactive substances as food features to address sample classification and authentication is increasing. In this work, targeted liquid chromatography coupled to high-resolution mass spectrometry (LC-HRMS) polyphenolic and curcuminoid profiles were evaluated as chemical descriptors to deal with the characterization [...] Read more.
The importance of monitoring bioactive substances as food features to address sample classification and authentication is increasing. In this work, targeted liquid chromatography coupled to high-resolution mass spectrometry (LC-HRMS) polyphenolic and curcuminoid profiles were evaluated as chemical descriptors to deal with the characterization and classification of turmeric and curry samples. The profiles corresponding to bioactive substances were obtained by TraceFinderTM software using accurate mass databases with 53 and 24 polyphenolic and curcuminoid related compounds, respectively. For that purpose, 21 turmeric and 9 curry samples commercially available were analyzed in triplicate by a simple liquid–solid extraction procedure using dimethyl sulfoxide as extracting solvent. The obtained results demonstrate that the proposed profiles were excellent chemical descriptors for sample characterization and classification by principal component analysis (PCA) and partial least squares-discriminant analysis (PLS-DA), achieving 100% classification rates. Curcuminoids and some specific phenolic acids such as trans-cinnamic, ferulic and sinapic acids, helped on the discrimination of turmeric samples; polyphenols, in general, were responsible for the curry sample distinction. Besides, the combination of both polyphenolic and curcuminoid profiles was necessary for the simultaneous characterization and classification of turmeric and curry samples. Discrimination among turmeric species such as Curcuma longa vs. Curcuma zedoaria, as well as among different Curcuma longa varieties (Alleppey, Madras and Erode) was also accomplished. Full article
(This article belongs to the Collection Bioactive Compounds)
Show Figures

Figure 1

Figure 1
<p>Reversed-phase liquid chromatography coupled to high-resolution mass spectrometry (LC-HRMS) total ion chromatograms and extracted ion chromatograms of curcumin (<span class="html-italic">m/z</span> 367.1187, retention time, RT, 13.5 min and RT 14.1 min—tautomeric forms), dmc (<span class="html-italic">m/z</span> 337.1081, RT 13.2 min) and bdmc (<span class="html-italic">m/z</span> 307.0975, RT 12.8 min) for (<b>a</b>) a turmeric (Biospirit brand) sample and (<b>b</b>) a curry (Hacendado brand) sample.</p>
Full article ">Figure 2
<p>Principal component analysis (PCA) score plots of (<b>a</b>) principal component 1 (PC1) vs. PC2 and (<b>b</b>) PC1 vs. PC2 vs. PC4 when using corrected targeted LC-HRMS polyphenolic and curcuminoid profiles as sample chemical descriptors. A total of 4 PCs were used to build the model.</p>
Full article ">Figure 3
<p>Partial least square regression-discriminant analysis (PLS-DA) score (above) and loading (below) plots of (<b>a</b>) latent variable 1 (LV1) vs. LV2 and (<b>b</b>) LV1 vs. LV2 vs. LV3 when using corrected targeted LC-HRMS polyphenolic and curcuminoid profiles as sample chemical descriptors. A total of 4 LVs were used to build the model. Enlargements of loadings plots including full description names is provided in <a href="#app1-molecules-25-02942" class="html-app">Figure S2 (Supplementary Materials)</a>.</p>
Full article ">Figure 4
<p>Partial least square regression-discriminant analysis (PLS-DA) score plots of LV1 vs. LV2 when using corrected targeted LC-HRMS polyphenolic and curcuminoid profiles as sample chemical descriptors for (<b>a</b>) classification of <span class="html-italic">Curcuma longa</span> vs. <span class="html-italic">Curcuma zedoaria</span> turmeric samples, and (<b>b</b>) when also considering all the different <span class="html-italic">Curcuma longa</span> varieties. A total of 4 LVs were used to build the model.</p>
Full article ">Figure 5
<p>Y predicted 1 vs. samples scores plot for turmeric vs. curry samples. Filled and empty symbols correspond to calibration and validation sets, respectively. The number of LVs employed to generate each classificatory model and sample classification rate are also indicated.</p>
Full article ">
4 pages, 174 KiB  
Editorial
Special Issue “Pharmaceutical Residues in the Environment”
by Jolanta Kumirska
Molecules 2020, 25(12), 2941; https://doi.org/10.3390/molecules25122941 - 26 Jun 2020
Cited by 7 | Viewed by 2845
Abstract
Pharmaceuticals, due to their pseudo-persistence and biological activity as well as their extensive use in human and veterinary medicine, are a class of environmental contaminants that is of emerging concern [...] Full article
(This article belongs to the Special Issue Pharmaceutical Residues in the Environment)
22 pages, 1947 KiB  
Review
Anion and Cation Dynamics in Polyhydroborate Salts: NMR Studies
by Alexander V. Skripov, Alexei V. Soloninin, Olga A. Babanova and Roman V. Skoryunov
Molecules 2020, 25(12), 2940; https://doi.org/10.3390/molecules25122940 - 26 Jun 2020
Cited by 25 | Viewed by 4898
Abstract
Polyhydroborate salts represent the important class of energy materials attracting significant recent attention. Some of these salts exhibit promising hydrogen storage properties and/or high ionic conductivities favorable for applications as solid electrolytes in batteries. Two basic types of thermally activated atomic jump motion [...] Read more.
Polyhydroborate salts represent the important class of energy materials attracting significant recent attention. Some of these salts exhibit promising hydrogen storage properties and/or high ionic conductivities favorable for applications as solid electrolytes in batteries. Two basic types of thermally activated atomic jump motion are known to exist in these materials: the reorientational (rotational) motion of complex anions and the translational diffusion of cations or complex anions. The present paper reviews recent progress in nuclear magnetic resonance (NMR) studies of both reorientational and diffusive jump motion in polyhydroborate salts. The emphasis is put on sodium and lithium closo-borates exhibiting high ionic conductivity and on borohydride-based systems showing extremely fast reorientational motion down to low temperatures. For these systems, we discuss the effects of order–disorder phase transitions on the parameters of reorientations and diffusive jumps, as well as the mechanism of low-temperature rotational tunneling. Full article
(This article belongs to the Special Issue Advances in Hydrogen Storage Materials for Energy Utilization)
Show Figures

Graphical abstract

Graphical abstract
Full article ">Figure 1
<p>The behavior of the <sup>1</sup>H spin–lattice relaxation rates in LiLa(BH<sub>4</sub>)<sub>3</sub>Cl [<a href="#B52-molecules-25-02940" class="html-bibr">52</a>], LiLa(BH<sub>4</sub>)<sub>3</sub>Br, and LiLa(BH<sub>4</sub>)<sub>3</sub>I [<a href="#B53-molecules-25-02940" class="html-bibr">53</a>] at low temperatures. The relaxation rates measured at different resonance frequencies are shown as functions of the inverse temperature. For LiLa(BH<sub>4</sub>)<sub>3</sub>Br and LiLa(BH<sub>4</sub>)<sub>3</sub>I, only the results at 14 MHz are included in the figure. The curves show the simultaneous fits of the two-peak model to the data for LiLa(BH<sub>4</sub>)<sub>3</sub>Cl (black lines) and the model with a Gaussian distribution of activation energies to the data for LiLa(BH<sub>4</sub>)<sub>3</sub>Br and LiLa(BH<sub>4</sub>)<sub>3</sub>I (green and red lines, respectively).</p>
Full article ">Figure 2
<p>(<b>a</b>) Schematic view of the local coordination of each BH<sub>4</sub><sup>−</sup> anion in Li<sub>2</sub>(bIm)BH<sub>4</sub>. This coordination allows facile reorientations of three H atoms (as depicted by the dashed ellipse) around the single B-H bond axis [<a href="#B60-molecules-25-02940" class="html-bibr">60</a>]. (<b>b</b>) Low-temperature proton spin–lattice relaxation rates measured at 14, 28, and 90 MHz as functions of the inverse temperature. Solid lines show the simultaneous fit of the model with rotational tunneling to the data. Reprinted with permission from [<a href="#B60-molecules-25-02940" class="html-bibr">60</a>]. Copyright 2019 American Chemical Society.</p>
Full article ">Figure 3
<p>Effects of the order–disorder phase transitions in Na<sub>2</sub>B<sub>12</sub>H<sub>12</sub> [<a href="#B17-molecules-25-02940" class="html-bibr">17</a>] and NaCB<sub>11</sub>H<sub>12</sub> [<a href="#B71-molecules-25-02940" class="html-bibr">71</a>] on the <sup>1</sup>H and <sup>23</sup>Na spin–lattice relaxation rates. The black solid lines show the simultaneous fits of the standard model to the <sup>1</sup>H data in the ordered (low-<span class="html-italic">T</span>) phases. The vertical bars indicate the phase transition temperatures for Na<sub>2</sub>B<sub>12</sub>H<sub>12</sub> (blue) and NaCB<sub>11</sub>H<sub>12</sub> (green).</p>
Full article ">Figure 4
<p>Schematic view of carbon-substituted hydroborate anions: (<b>a</b>) icosahedral <span class="html-italic">closo</span>-[CB<sub>11</sub>H<sub>12</sub>]<sup>−</sup>, (<b>b</b>) bicapped-square-antiprismatic <span class="html-italic">closo</span>-[1-CB<sub>9</sub>H<sub>10</sub>], and (<b>c</b>) nest-like <span class="html-italic">nido</span>-[7-CB<sub>10</sub>H<sub>13</sub>]<sup>−</sup>. Green spheres: B atoms, blue spheres: C atoms, and gray spheres: H atoms.</p>
Full article ">Figure 5
<p>Proton spin–lattice relaxation rates measured at 14 and 28 MHz and <sup>23</sup>Na spin–lattice relaxation rates measured at 23 MHz as functions of the inverse temperature for the mixed-anion solid solution Na<sub>2</sub>(CB<sub>9</sub>H<sub>10</sub>) (CB<sub>11</sub>H<sub>12</sub>). The black solid lines show the simultaneous fit of the two-peak model with Gaussian distributions of the activation energies to the <sup>1</sup>H spin–lattice relaxation data in the range 98–435 K; the black dashed and dotted lines represent the contributions of the two components. The red solid line shows the fit of the two-peak model to the <sup>23</sup>Na spin–lattice relaxation data in the range 138–349 K; the red dashed lines represent the contributions of the two components. Reprinted with permission from reference [<a href="#B79-molecules-25-02940" class="html-bibr">79</a>]. Copyright 2019 Elsevier.</p>
Full article ">Figure 6
<p>Proton spin–lattice relaxation rates measured at the resonance frequencies of 14 and 28 MHz in the nanoconfined NaCB<sub>11</sub>H<sub>12</sub>/SBA-15 system (average pore diameter of 8 nm) [<a href="#B99-molecules-25-02940" class="html-bibr">99</a>]. The black solid lines show the simultaneous fit of the two-peak model to the data. For comparison, the red line shows the behavior of the proton spin–lattice relaxation rate in bulk NaCB<sub>11</sub>H<sub>12</sub> [<a href="#B71-molecules-25-02940" class="html-bibr">71</a>].</p>
Full article ">
16 pages, 2804 KiB  
Article
PbS Quantum Dots Decorating TiO2 Nanocrystals: Synthesis, Topology, and Optical Properties of the Colloidal Hybrid Architecture
by Carlo Nazareno Dibenedetto, Teresa Sibillano, Rosaria Brescia, Mirko Prato, Leonardo Triggiani, Cinzia Giannini, Annamaria Panniello, Michela Corricelli, Roberto Comparelli, Chiara Ingrosso, Nicoletta Depalo, Angela Agostiano, Maria Lucia Curri, Marinella Striccoli and Elisabetta Fanizza
Molecules 2020, 25(12), 2939; https://doi.org/10.3390/molecules25122939 - 26 Jun 2020
Cited by 2 | Viewed by 3802
Abstract
Fabrication of heterostructures by merging two or more materials in a single object. The domains at the nanoscale represent a viable strategy to purposely address materials’ properties for applications in several fields such as catalysis, biomedicine, and energy conversion. In this case, solution-phase [...] Read more.
Fabrication of heterostructures by merging two or more materials in a single object. The domains at the nanoscale represent a viable strategy to purposely address materials’ properties for applications in several fields such as catalysis, biomedicine, and energy conversion. In this case, solution-phase seeded growth and the hot-injection method are ingeniously combined to fabricate TiO2/PbS heterostructures. The interest in such hybrid nanostructures arises from their absorption properties that make them advantageous candidates as solar cell materials for more efficient solar light harvesting and improved light conversion. Due to the strong lattice mismatch between TiO2 and PbS, the yield of the hybrid structure and the control over its properties are challenging. In this study, a systematic investigation of the heterostructure synthesis as a function of the experimental conditions (such as seeds’ surface chemistry, reaction temperature, and precursor concentration), its topology, structural properties, and optical properties are carried out. The morphological and chemical characterizations confirm the formation of small dots of PbS by decorating the oleylamine surface capped TiO2 nanocrystals under temperature control. Remarkably, structural characterization points out that the formation of heterostructures is accompanied by modification of the crystallinity of the TiO2 domain, which is mainly ascribed to lattice distortion. This result is also confirmed by photoluminescence spectroscopy, which shows intense emission in the visible range. This originated from self-trapped excitons, defects, and trap emissive states. Full article
Show Figures

Graphical abstract

Graphical abstract
Full article ">Figure 1
<p>Seeded-growth under high (<b>A</b>) and low (<b>B</b>) supersaturation condition. Homogenous nucleation represents the upper-limit to heterogeneous nucleation. At low supersaturation, the overall interfacial energy (Δγ = γ<sub>nuclei/solution</sub> + γ<sub>i</sub> – γ<sub>seed/solution</sub>, with γ<sub>i</sub> = interfacial tension) defines the topology of the hybrid structure that, under high interfacial strain, may result in segregated phases (Δγ &lt; 0) or island-like structures (Δγ &gt; 0, Volmer-Weber growth mode). The grey dodecahedral shape NP represents the TiO<sub>2</sub> NC seeds while the orange structures represent the PbS NCs.</p>
Full article ">Figure 2
<p>TEM micrographs (scale bar 20 nm) of oleic acid (OA)-capped TiO<sub>2</sub> NCs before (<b>A</b>) and after (B-C) injection of (<b>B</b>) [Pb<sup>2+</sup>] = 0.01M, [HMDS] = 0.002 M at 120 °C and (<b>C</b>) [Pb<sup>2+</sup>] = 0.005M, [HMDS] = 0.001 M at 100 °C. (<b>D</b>–<b>F</b>) oleylamine (Olam)-capped TiO<sub>2</sub> NCs after injection of [Pb<sup>2+</sup>] = 0.005M, [HMDS] = 0.001 M at 120 °C (<b>D</b>), 100 °C (<b>E</b>), and 80 °C (<b>F</b>). Dashed red and white circles in the picture used to highlight homogenously nucleated PbS NCs and TiO<sub>2</sub>/PbS hybrid NCs, respectively.</p>
Full article ">Figure 3
<p>FTIR spectra in the ATR mode of oleic acid (OA)-capped (<b>a</b>–<b>a1</b>) and oleylamine (Olam)-capped TiO<sub>2</sub> NCs (<b>b</b>–<b>b1</b>).</p>
Full article ">Figure 4
<p>HAADF-STEM images (scale bar 10 nm) of (<b>A</b>) TiO<sub>2</sub> seed NCs and (<b>B</b>) TiO<sub>2</sub>/PbS hybrid nanostructures. (<b>C</b>,<b>D</b>) XPS spectrum of TiO<sub>2</sub>/PbS hybrid NCs in the 130–170 eV range: raw data (scattered plot) and fitting curve of the S 2p (C, light blue line) and of the Pb 4f (<b>D</b>), based on two contributions Pb1 (D, green line) and Pb2 (D, violet line). (<b>E</b>) XRD spectra of TiO<sub>2</sub> NCs (red line) and TiO<sub>2</sub>/PbS hybrid (blue line) together with the Bragg hkl reflections positions for TiO<sub>2</sub> anatase (bottom markers, crystal system: tetragonal, PDF2-ICDD code: 842186) and PbS (upper panel, crystal system: cubic, PDF2-ICDD code: 00-005-0592) crystal structures. The XRD spectra of the two samples are reported, and shifted for the sake of clarity. Filled square and empty circle symbols are ascribed to TiO<sub>2</sub> anatase and PbS peaks, respectively.</p>
Full article ">Figure 5
<p>(<b>A</b>) UV-Vis-NIR absorbance spectra and (<b>B</b>) steady state emission spectra (λ<sub>ex</sub>= 375 nm) in the visible spectral range of the Olam-capped TiO<sub>2</sub> seeds (red line) and TiO<sub>2</sub>/PbS hybrid structures (blue line). Each sample has been suitably diluted in order to show the same absorbance value at 375 nm.</p>
Full article ">
12 pages, 1077 KiB  
Article
Mechanical Properties and Weibull Scaling Laws of Unknown Spider Silks
by Gabriele Greco and Nicola M. Pugno
Molecules 2020, 25(12), 2938; https://doi.org/10.3390/molecules25122938 - 26 Jun 2020
Cited by 14 | Viewed by 3086
Abstract
Spider silks present extraordinary mechanical properties, which have attracted the attention of material scientists in recent decades. In particular, the strength and the toughness of these protein-based materials outperform the ones of many man-made fibers. Unfortunately, despite the huge interest, there is an [...] Read more.
Spider silks present extraordinary mechanical properties, which have attracted the attention of material scientists in recent decades. In particular, the strength and the toughness of these protein-based materials outperform the ones of many man-made fibers. Unfortunately, despite the huge interest, there is an absence of statistical investigation on the mechanical properties of spider silks and their related size effects due to the length of the fibers. Moreover, several spider silks have never been mechanically tested. Accordingly, in this work, we measured the mechanical properties and computed the Weibull parameters for different spider silks, some of them unknown in the literature. We also measured the mechanical properties at different strain rates for the dragline of the species Cupiennius salei. For the same species, we measured the strength and Weibull parameters at different fiber lengths. In this way, we obtained the spider silk scaling laws directly and according to Weibull’s prediction. Both length and strain rates affect the mechanical properties of spider silk, as rationalized by Weibull’s statistics. Full article
(This article belongs to the Special Issue Silk Fibroin Materials)
Show Figures

Figure 1

Figure 1
<p>Mechanical properties of the spider silk of <span class="html-italic">Cupiennius salei</span> at different strain rates: (<b>a</b>) strain at break, (<b>b</b>) strength, (<b>c</b>) Young’s modulus, and (<b>d</b>) toughness modulus.</p>
Full article ">Figure 2
<p>(<b>a</b>) The diameter of the dragline vs the length of the sample. (<b>b</b>) Strength of the dragline vs the length of the sample. (<b>c</b>) Linear regression plot of the strength data set used to compute the Weibull parameters. (<b>d</b>) Weibull’s probability density distribution of the strength at different lengths. (<b>e</b>) Shape parameter vs length of the sample. (<b>f</b>) Plot of Equation (6) with linear regression to compute the Weibull fractal dimension.</p>
Full article ">
10 pages, 890 KiB  
Communication
Controlling the Size and Pattern Pitch of Ni(OH)2 Nanoclusters Using Dip-Pen Nanolithography to Improve Water Oxidation
by Zorik Shamish, Moshe Zohar, Dror Shamir and Ariela Burg
Molecules 2020, 25(12), 2937; https://doi.org/10.3390/molecules25122937 - 26 Jun 2020
Cited by 8 | Viewed by 2544
Abstract
We use dip-pen nanolithography to accurately pattern Ni(OH)2 nanoclusters on a metachemical surface with an exceptionally large surface area. The distance between the nanoclusters can be manipulated to control the oxygen-evolution reaction current and overpotential, thereby improving the efficiency of the water-splitting [...] Read more.
We use dip-pen nanolithography to accurately pattern Ni(OH)2 nanoclusters on a metachemical surface with an exceptionally large surface area. The distance between the nanoclusters can be manipulated to control the oxygen-evolution reaction current and overpotential, thereby improving the efficiency of the water-splitting process while using minute amounts of the catalyst. Full article
Show Figures

Graphical abstract

Graphical abstract
Full article ">Figure 1
<p>The patterned MSC<math display="inline"><semantics> <msub> <mrow/> <mi>Ni</mi> </msub> </semantics></math> surface. (<b>a</b>) A MATLAB analysis of an AFM scan of the MCS<math display="inline"><semantics> <msub> <mrow/> <mi>Ni</mi> </msub> </semantics></math> Type 2 electrode (patterning conditions were <math display="inline"><semantics> <mrow> <mn>0.3</mn> </mrow> </semantics></math> ppm of Ni(OH)<sub>2</sub> ink, 80% humidity, 20 <math display="inline"><semantics> <msup> <mrow/> <mo>∘</mo> </msup> </semantics></math>C). The patterning was performed with an M-type cantilever. (<b>b</b>) A single cluster patterned on the electrode. The measured RMS roughness parameter of the pre-pattern indium tin oxide (ITO) surface is <math display="inline"><semantics> <mrow> <msub> <mi>S</mi> <mi>q</mi> </msub> <mo>=</mo> <mn>2.572</mn> </mrow> </semantics></math> nm.</p>
Full article ">Figure 2
<p>The patterned MCS<math display="inline"><semantics> <msub> <mrow/> <mi>Ni</mi> </msub> </semantics></math> Type 2 surface. (<b>a</b>) SEM image and (<b>b</b>) EDS mapping of the MSC<math display="inline"><semantics> <msub> <mrow/> <mi>Ni</mi> </msub> </semantics></math> nano clusters of Ni(OH)<sub>2</sub> on the ITO surface.</p>
Full article ">Figure 3
<p>Linear sweep voltammetry of MCS<math display="inline"><semantics> <msub> <mrow/> <mi>Ni</mi> </msub> </semantics></math> as a working electrode in <math display="inline"><semantics> <mrow> <mn>0.20</mn> </mrow> </semantics></math> M NaClO<sub>4</sub>, 1000 mV/s. The two types of electrode are indicated by line color (black: Type 1, red: Type 2) and the two pH values are indicated by line pattern (solid: pH <math display="inline"><semantics> <mrow> <mn>12.5</mn> </mrow> </semantics></math>, dashed: pH <math display="inline"><semantics> <mrow> <mn>11.0</mn> </mrow> </semantics></math>, Ar atmosphere).</p>
Full article ">Figure 4
<p>Current as a function of the square of the scan rate of the two types of MCS<math display="inline"><semantics> <msub> <mrow/> <mi>Ni</mi> </msub> </semantics></math> electrodes (black: Type 1, red: Type 2), at two pH values (circular data points, solid line: pH <math display="inline"><semantics> <mrow> <mn>12.5</mn> </mrow> </semantics></math>, square data points, dashed line: pH <math display="inline"><semantics> <mrow> <mn>11.0</mn> </mrow> </semantics></math>, Ar atmosphere).</p>
Full article ">Figure 5
<p>SEM image of the ITO<math display="inline"><semantics> <msub> <mrow/> <mi>Ni</mi> </msub> </semantics></math> surface.</p>
Full article ">
13 pages, 3615 KiB  
Article
Bio-Based Hydrogels Composed of Humic Matter and Pectins of Different Degree of Methyl-Esterification
by Assunta Nuzzo, Pierluigi Mazzei, Davide Savy, Vincenzo Di Meo and Alessandro Piccolo
Molecules 2020, 25(12), 2936; https://doi.org/10.3390/molecules25122936 - 25 Jun 2020
Cited by 7 | Viewed by 2509
Abstract
We prepared humo-pectic hydrogels through ionotropic gelation by crosslinking natural pectins of different degree of methyl-esterification with either humic substances (HS) extracted from cow manure compost or humic-like substances (HULIS) from depolymerized lignocellulose biorefinery waste. The hydrogels were characterized by solid-state 13C-NMR [...] Read more.
We prepared humo-pectic hydrogels through ionotropic gelation by crosslinking natural pectins of different degree of methyl-esterification with either humic substances (HS) extracted from cow manure compost or humic-like substances (HULIS) from depolymerized lignocellulose biorefinery waste. The hydrogels were characterized by solid-state 13C-NMR spectroscopy, scanning electron microscopy, spectroscopic magnetic resonance imaging and rheological analyses. Their ability to work as controlled release systems was tested by following the release kinetics of a previously incorporated model phenolic compound, like phloroglucinol. Our results indicated that the release properties of hydrogels were influenced by the molecular composition of HS and HULIS and by the different degrees of methyl-esterification of pectins. The hydrogel made by the high methoxyl pectin and HS showed the fastest rate of phloroglucinol release, and this was attributed not only to its morphological structure and crosslinking density but also to the least formation of ionic interactions between phloroglucinol and the polysaccharidic chains. Our study suggests that the efficiency of novel humo-pectic hydrogels as sustainable carriers of agroproducts to crops is related to a careful choice of the characteristics of their components. Full article
(This article belongs to the Special Issue Molecular Characterization of Biopolymers and Biobased Bioplastics)
Show Figures

Figure 1

Figure 1
<p><sup>13</sup>C CPMAS NMR spectra of hydrogels based on low methyl-esterified pectin (H-LMP), high methyl-esterified pectin (H-HMP), or on their combination with either humic substances extracted from cow manure compost (H-LMP-HS and H-HMP-HS) or humic-like substances from depolymerized lignocellulose biorefinery residues (H-LMP-HULIS and H-HMP-HULIS).</p>
Full article ">Figure 2
<p>SEM micrographs of freeze-dried hydrogels: (<b>A</b>) H-LMP, (<b>B</b>) H-HMP, (<b>C</b>) H-LMP-HS, (<b>D</b>) H-HMP-HS, (<b>E</b>) H-LMP-HULIS, (<b>F</b>) H-HMP-HULIS.</p>
Full article ">Figure 3
<p>MRI images showing a representative central slice of each hydrogel after the addition of 150 μL of water necessary to saturate samples: (<b>A</b>) H-LMP, (<b>B</b>) H-HMP, (<b>C</b>) H-LMP-HS, (<b>D</b>) H-HMP-HS, (<b>E</b>) H-LMP-HULIS, (<b>F</b>) H-HMP-HULIS. The MRI images show the spatial distribution of water within the structure of samples, varying the color from blue to green and pale red as a function of increasing water content.</p>
Full article ">Figure 4
<p>Diffusion coefficients (Diff) obtained from MRI experiments for the different hydrogels after the addition of 150 μL of water necessary to saturate samples. Error bars indicate standard error (n = 3), and different letters indicate significant differences by the Tukey’s test at <span class="html-italic">p</span> ≤ 0.05.</p>
Full article ">Figure 5
<p>Storage G′ (full circles) and loss G″ (empty circles) moduli as a function of applied frequency.</p>
Full article ">Figure 6
<p>Percent of phloroglucinol released with time from hydrogels in aqueous medium.</p>
Full article ">
16 pages, 2361 KiB  
Article
Acetone Prospect as an Additive to Allow the Use of Castor and Sunflower Oils as Drop-In Biofuels in Diesel/Acetone/Vegetable Oil Triple Blends for Application in Diesel Engines
by Laura Aguado-Deblas, Jesus Hidalgo-Carrillo, Felipa M. Bautista, Diego Luna, Carlos Luna, Juan Calero, Alejandro Posadillo, Antonio A. Romero and Rafael Estevez
Molecules 2020, 25(12), 2935; https://doi.org/10.3390/molecules25122935 - 25 Jun 2020
Cited by 17 | Viewed by 4017
Abstract
The present paper investigates the feasibility of using acetone (ACE) in triple blends with fossil diesel (D) and straight vegetable oils (SVOs) as alternative fuel for diesel engines. In this respect, ACE is selected as an oxygenated additivedue to its favorable propertiesto be [...] Read more.
The present paper investigates the feasibility of using acetone (ACE) in triple blends with fossil diesel (D) and straight vegetable oils (SVOs) as alternative fuel for diesel engines. In this respect, ACE is selected as an oxygenated additivedue to its favorable propertiesto be mixed with vegetable oils and fossil diesel. In fact, the very low kinematic viscosity allows reduces the high viscosity of SVOs. ACE’s oxygen content, low autoignition temperature, and very low cloud point and pour point values highlight its possibilities as an additive in D/ACE/SVO triple blends. Moreover, ACE can be produced through a renewable biotechnological process, an acetone–butanol–ethanol (ABE) fermentation from cellulosic biomass. The SVOs tested were castor oil (CO), which is not suitable for human consumption, and sunflower oil (SO), used as a standard reference for waste cooking oil. The viscosity measurement of the ACE/SVO double blend was considered crucial to choose the optimum proportion, which better fulfilled the specifications established by European standard EN 590. Moreover, some of the most significant physicochemical properties of D/ACE/SVO triple blends, such as kinematic viscosity, cloud point, pour point, and calorific value, were determined to assess their suitability as fuels. The blends were evaluated in a conventional diesel generator through the study of the following parameters: engine power, smoke emissions, and fuel consumption. Despite the low calorific value of ACE limits its ratio in the mixtures due to engine knocking problems, the experimental results reveal an excellent performance for the blends containing up to 16-18% of ACE and 22-24% of SVO. These blends produce similar engine power as to fossil diesel, but with slightly higher fuel consumption. Considerable reductions in emissions of air pollutants, as well as excellent cold flow properties are also obtained with these triple blends. In summary, the use of these biofuels could achieve a substitution of fossil diesel up to 40%, independently on the SVO employed. Full article
(This article belongs to the Special Issue Value-Added Agrifood Waste)
Show Figures

Figure 1

Figure 1
<p>Kinematic viscosity values at 40 °C of diesel/acetone/sunflower oil and diesel/acetone/castor oil triple blends. The measure error is represented as standard deviation, using error bars.</p>
Full article ">Figure 2
<p>Generated power (W) at different demanded power values (1–5 kW) for: (<b>a</b>) diesel/acetone/sunflower oil; (<b>b</b>) diesel/acetone/castor oil blends. The errors in measurements are less than 3%.</p>
Full article ">Figure 3
<p>Smoke emissions (Bosch number) at different demanded power values (1–5 kW) for: (<b>a</b>) diesel/acetone/sunflower oil; (<b>b</b>) diesel/acetone/castor oil blends. The measure errors are represented as standard deviation using error bars.</p>
Full article ">Figure 4
<p>Fuel consumption values (L/h) at different demanded power values (1, 3, 5 kW) for: (<b>a</b>) diesel/acetone/sunflower oil; (<b>b</b>) diesel/acetone/castor oil blends. The measure errors are represented as standard deviation using error bars.</p>
Full article ">Figure 5
<p>Schematic summary of mechanical and environmental characterization of diesel engine-electrogenerator set.</p>
Full article ">
22 pages, 4589 KiB  
Article
Synthesis, Cyclooxygenases Inhibition Activities and Interactions with BSA of N-substituted 1H-pyrrolo[3,4-c]pyridine-1,3(2H)-diones Derivatives
by Edward Krzyżak, Dominika Szkatuła, Benita Wiatrak, Tomasz Gębarowski and Aleksandra Marciniak
Molecules 2020, 25(12), 2934; https://doi.org/10.3390/molecules25122934 - 25 Jun 2020
Cited by 9 | Viewed by 2887
Abstract
Inhibition of cyclooxygenase is the way of therapeutic activities for anti-inflammatory pharmaceuticals. Serum albumins are the major soluble protein able to bind and transport a variety of exogenous and endogenous ligands, including hydrophobic pharmaceuticals. In this study, a novel N-substituted 1H [...] Read more.
Inhibition of cyclooxygenase is the way of therapeutic activities for anti-inflammatory pharmaceuticals. Serum albumins are the major soluble protein able to bind and transport a variety of exogenous and endogenous ligands, including hydrophobic pharmaceuticals. In this study, a novel N-substituted 1H-pyrrolo[3–c]pyridine-1,3(2H)-diones derivatives were synthesized and biologically evaluated for their inhibitory activity against cyclooxygenases and interactions with BSA. In vitro, COX-1 and COX-2 inhibition assays were performed. Interaction with BSA was studied by fluorescence spectroscopy and circular dichroism measurement. The molecular docking study was conducted to understand the binding interaction of compounds in the active site of cyclooxygenases and BSA. The result of the COX-1 and COX-2 inhibitory studies revealed that all the compounds potentially inhibited COX-1 and COX-2. The IC50 value was found similar to meloxicam. The intrinsic fluorescence of BSA was quenched by tested compounds due to the formation of A/E–BSA complex. The results of the experiment and molecular docking confirmed the main interaction forces between studied compounds and BSA were hydrogen bonding and van der Waals force. Full article
(This article belongs to the Section Medicinal Chemistry)
Show Figures

Graphical abstract

Graphical abstract
Full article ">Figure 1
<p>Lead and investigated compounds (<b>A</b>–<b>E</b>) of this study.</p>
Full article ">Figure 2
<p>Effect of tested compounds on the viability of NHDF cells; * <span class="html-italic">p</span> &lt; 0.05—significant difference compared to control.</p>
Full article ">Figure 3
<p>2D interaction (<b>A</b>–<b>E</b>) with COX-1 (<b>left</b>) and COX-2 (<b>right</b>) (green—hydrogen bonds, violet—π-sigma, pink—other hydrophobic).</p>
Full article ">Figure 4
<p>Docking poses of <b>A</b> (green), <b>C</b> (blue-left), <b>D</b> (blue-right) and meloxicam (red) inside COX-1 active site (<b>left</b>) and COX-2 active site (<b>right</b>).</p>
Full article ">Figure 5
<p>Fluorescence spectra of body surface area (BSA) solution in presence of (<b>A</b>–<b>E</b>) (T-298 K, λ<sub>ex</sub> = 280 nm). The concentration of (<b>A</b>–<b>E</b>) was: 0, 0.2, 0.4, 0.6, 0.8, 1.0, 1.2, 1.4, 1.6, 1.8, 2.0, and 5.0 µM.</p>
Full article ">Figure 6
<p>Stern–Volmer plots (<b>top</b>), double logarithm regression plots (<b>middle</b>), and modified double logarithm regression plots (<b>bottom</b>) for quenching of BSA by <b>A–E</b>.</p>
Full article ">Figure 7
<p>Circular Dichroism (CD) spectra of BSA in the absence and presence of (<b>A</b>–<b>E</b>) and (<b>C</b>). BSA to analyzed compounds molar ratios were changing from 1:0 to 1:10.</p>
Full article ">Figure 8
<p>2D interaction of (<b>A</b>–<b>E</b>) with BSA in the binding site I (<b>left</b>) and site II (<b>right</b>) (green—hydrogen bonds, violet—π-sigma, pink—other hydrophobic).</p>
Full article ">Figure 8 Cont.
<p>2D interaction of (<b>A</b>–<b>E</b>) with BSA in the binding site I (<b>left</b>) and site II (<b>right</b>) (green—hydrogen bonds, violet—π-sigma, pink—other hydrophobic).</p>
Full article ">Scheme 1
<p>Synthetic scheme of the studied compounds.</p>
Full article ">
10 pages, 886 KiB  
Article
Metabolomic Signature Discriminates Normal Human Cornea from Keratoconus—A Pilot GC/MS Study
by Anna Wojakowska, Monika Pietrowska, Piotr Widlak, Dariusz Dobrowolski, Edward Wylęgała and Dorota Tarnawska
Molecules 2020, 25(12), 2933; https://doi.org/10.3390/molecules25122933 - 25 Jun 2020
Cited by 16 | Viewed by 3281
Abstract
The molecular etiology of keratoconus (KC), a pathological condition of the human cornea, remains unclear. The aim of this work was to perform profiling of metabolites and identification of features discriminating this pathology from the normal cornea. The combination of gas chromatography and [...] Read more.
The molecular etiology of keratoconus (KC), a pathological condition of the human cornea, remains unclear. The aim of this work was to perform profiling of metabolites and identification of features discriminating this pathology from the normal cornea. The combination of gas chromatography and mass spectrometry (GC/MS) techniques has been applied for profiling and identification of metabolites in corneal buttons from 6 healthy controls and 7 KC patients. An untargeted GC/MS-based approach allowed the detection of 377 compounds, including 46 identified unique metabolites, whose levels enabled the separation of compared groups of samples in unsupervised hierarchical cluster analysis. There were 13 identified metabolites whose levels differentiated between groups of samples. Downregulation of several carboxylic acids, fatty acids, and steroids was observed in KC when compared to the normal cornea. Metabolic pathways associated with compounds that discriminated both groups were involved in energy production, lipid metabolism, and amino acid metabolism. An observed signature may reflect cellular processes involved in the development of KC pathology, including oxidative stress and inflammation. Full article
(This article belongs to the Section Analytical Chemistry)
Show Figures

Figure 1

Figure 1
<p>Separation of normal (HC) and keratoconus (KC) samples of human cornea samples by the principal component analysis (<b>A</b>) and hierarchical cluster analysis (<b>B</b>).</p>
Full article ">Figure 2
<p>Metabolic pathways associated with 13 metabolites showing significantly different abundances between keratoconus and healthy cornea. Presented are over-representation (fold enrichment) and its statistical significance (uncorrected <span class="html-italic">p</span>-value) of metabolic pathway estimated by the metabolite set enrichment analysis (MSEA); the top 20 pathways are represented.</p>
Full article ">
11 pages, 351 KiB  
Article
Validation of the 2H-SNIF NMR and IRMS Methods for Vinegar and Vinegar Analysis: An International Collaborative Study
by Federica Camin, Marco Simoni, Armin Hermann, Freddy Thomas and Matteo Perini
Molecules 2020, 25(12), 2932; https://doi.org/10.3390/molecules25122932 - 25 Jun 2020
Cited by 8 | Viewed by 3398
Abstract
This paper presents the results of a collaborative study involving seven laboratories and concerning two samples of wine vinegar, one of apple vinegar and four of balsamic vinegar. The aim of the study was to define standard deviations of repeatability (sr) and reproducibility [...] Read more.
This paper presents the results of a collaborative study involving seven laboratories and concerning two samples of wine vinegar, one of apple vinegar and four of balsamic vinegar. The aim of the study was to define standard deviations of repeatability (sr) and reproducibility (sR) for vinegar and balsamic vinegar stable isotope ratios of H (D/H), C (δ13C) and O (δ18O), in order to establish them as fully recognized official standards. Acetic acid was extracted and subjected to (D/H)CH3 and δ13C analysis. δ18O analysis was performed on whole samples. The grape must solution remained after distillation of balsamic vinegar was fermented and the resulting ethanol was subjected to (D/H)I, (D/H)II, R and δ13C analysis. The sr and sR were 0.6 ppm and 1.1 ppm for (D/H)CH3, 0.14‰ and 0.25‰ for δ13C of acetic acid, 0.1‰ and 0.17‰ for δ18O of water, 0.19 ppm and 0.64 ppm for ethanol (D/H)I, 1.14 and 1.31 ppm for (D/H)II, 0.09 and 0.11‰ for δ13C of ethanol. These data are in line with those in the literature or reported in corresponding official methods, and sr and sR of balsamic vinegar are in line with those of vinegar and must. Full article
(This article belongs to the Special Issue Isotopic Techniques for Food Science)
Show Figures

Figure 1

Figure 1
<p>Diagram of the distillation device [from Thomas and Jamin, 2009].</p>
Full article ">
29 pages, 2394 KiB  
Review
Green and Sustainable Valorization of Bioactive Phenolic Compounds from Pinus By-Products
by Pedro Ferreira-Santos, Elisa Zanuso, Zlatina Genisheva, Cristina M. R. Rocha and José A. Teixeira
Molecules 2020, 25(12), 2931; https://doi.org/10.3390/molecules25122931 - 25 Jun 2020
Cited by 87 | Viewed by 7214
Abstract
In Europe, pine forests are one of the most extended forests formations, making pine residues and by-products an important source of compounds with high industrial interest as well as for bioenergy production. Moreover, the valorization of lumber industry residues is desirable from a [...] Read more.
In Europe, pine forests are one of the most extended forests formations, making pine residues and by-products an important source of compounds with high industrial interest as well as for bioenergy production. Moreover, the valorization of lumber industry residues is desirable from a circular economy perspective. Different extraction methods and solvents have been used, resulting in extracts with different constituents and consequently with different bioactivities. Recently, emerging and green technologies as ultrasounds, microwaves, supercritical fluids, pressurized liquids, and electric fields have appeared as promising tools for bioactive compounds extraction in alignment with the Green Chemistry principles. Pine extracts have attracted the researchers’ attention because of the positive bioproperties, such as anti-inflammatory, antimicrobial, anti-neurodegenerative, antitumoral, cardioprotective, etc., and potential industrial applications as functional foods, food additives as preservatives, nutraceuticals, pharmaceuticals, and cosmetics. Phenolic compounds are responsible for many of these bioactivities. However, there is not much information in the literature about the individual phenolic compounds of extracts from the pine species. The present review is about the reutilization of residues and by-products from the pine species, using ecofriendly technologies to obtain added-value bioactive compounds for industrial applications. Full article
Show Figures

Figure 1

Figure 1
<p>Pine valorization under biorefinery concept.</p>
Full article ">Figure 2
<p>General chemical/nutritional composition of pine by-products.</p>
Full article ">Figure 3
<p>Principles of efficient process for obtaining natural extracts. Adapted from Chemat et al. [<a href="#B8-molecules-25-02931" class="html-bibr">8</a>].</p>
Full article ">Figure 4
<p>Polyphenol groups according to their chemical structure.</p>
Full article ">
13 pages, 1795 KiB  
Article
Purification of Aqueous Media by Biochars: Feedstock Type Effect on Silver Nanoparticles Removal
by Agnieszka Tomczyk, Katarzyna Szewczuk-Karpisz, Zofia Sokołowska, Milena Kercheva and Emil Dimitrov
Molecules 2020, 25(12), 2930; https://doi.org/10.3390/molecules25122930 - 25 Jun 2020
Cited by 15 | Viewed by 2631
Abstract
Due to the harmful effects of nanoparticles in the environment, their effective removal from aqueous media is of great importance. This paper described the research on the silver nanoparticles (Ag-NPs) sorption on biochars obtained from different feedstock types. The sorbents were produced through [...] Read more.
Due to the harmful effects of nanoparticles in the environment, their effective removal from aqueous media is of great importance. This paper described the research on the silver nanoparticles (Ag-NPs) sorption on biochars obtained from different feedstock types. The sorbents were produced through pyrolysis (double-barrel method) of the vineyard (BV), paulownia tree (BP), and tobacco (BT). BV exhibited the highest specific surface area, porosity, value of variable surface charge, and content of surface acidic functional groups among the used biochars. The pseudo-second order model best described the obtained adsorption kinetics, whereas the Freundlich model accounted for the registered adsorption data. The Ag-NPs removal was highly efficient in the case of BV, especially in the nanoparticle concentration range 50–500 mg/L. Thus, this biochar can be considered as an ecofriendly, effective, low-cost organic adsorbent, potentially used in the aqueous media purification. Full article
(This article belongs to the Section Green Chemistry)
Show Figures

Graphical abstract

Graphical abstract
Full article ">Figure 1
<p>Characteristics of Ag-NPs: (<b>A</b>) particle number (in billions) vs. particle diameter and (<b>B)</b> UV–VIS absorption spectrum.</p>
Full article ">Figure 2
<p>FTIR spectra of biochars: (<b>A</b>) vineyard (BV); (<b>B</b>) paulownia tree (BP), and (<b>C</b>) tobacco (BT).</p>
Full article ">Figure 3
<p>Pseudo-second order adsorption kinetics of Ag-NPs on biochars.</p>
Full article ">Figure 4
<p>Freundlich adsorption isotherms of Ag-NPs on biochars.</p>
Full article ">Figure 5
<p>The SEM images of BV before (<b>A</b>) and after (<b>B</b>) adsorption (white color: Ag-NPs) and the results of EDS analysis (<b>C</b>) of the selected biochar after adsorption (blue color: carbon, green color: oxygen, pink color: silver).</p>
Full article ">
19 pages, 3422 KiB  
Article
The (+)-Brevipolide H Displays Anticancer Activity against Human Castration-Resistant Prostate Cancer: The Role of Oxidative Stress and Akt/mTOR/p70S6K-Dependent Pathways in G1 Checkpoint Arrest and Apoptosis
by Yi-Hua Sheng, Wohn-Jenn Leu, Ching-Nung Chen, Jui-Ling Hsu, Ying-Tung Liu, Lih-Ching Hsu, Duen-Ren Hou and Jih-Hwa Guh
Molecules 2020, 25(12), 2929; https://doi.org/10.3390/molecules25122929 - 25 Jun 2020
Cited by 4 | Viewed by 2986
Abstract
Because conventional chemotherapy is not sufficiently effective against prostate cancer, various examinations have been performed to identify anticancer activity of naturally occurring components and their mechanisms of action. The (+)-brevipolide H, an α-pyrone-based natural compound, induced potent and long-term anticancer effects in human [...] Read more.
Because conventional chemotherapy is not sufficiently effective against prostate cancer, various examinations have been performed to identify anticancer activity of naturally occurring components and their mechanisms of action. The (+)-brevipolide H, an α-pyrone-based natural compound, induced potent and long-term anticancer effects in human castration-resistant prostate cancer (CRPC) PC-3 cells. Flow cytofluorometric analysis with propidium iodide staining showed (+)-brevipolide H-induced G1 arrest of cell cycle and subsequent apoptosis through induction of caspase cascades. Since Akt/mTOR pathway has been well substantiated in participating in cell cycle progression in G1 phase, its signaling and downstream regulators were examined. Consequently, (+)-brevipolide H inhibited the signaling pathway of Akt/mTOR/p70S6K. The c-Myc inhibition and downregulation of G1 phase cyclins were also attributed to (+)-brevipolide H action. Overexpression of myristoylated Akt significantly rescued mTOR/p70S6K and downstream signaling under (+)-brevipolide H treatment. ROS and Ca2+, two key mediators in regulating intracellular signaling, were determined, showing that (+)-brevipolide H interactively induced ROS production and an increase of intracellular Ca2+ levels. The (+)-Brevipolide H also induced the downregulation of anti-apoptotic Bcl-2 family proteins (Bcl-2 and Bcl-xL) and loss of mitochondrial membrane potential, indicating the contribution of mitochondrial dysfunction to apoptosis. In conclusion, the data suggest that (+)-brevipolide H displays anticancer activity through crosstalk between ROS production and intracellular Ca2+ mobilization. In addition, suppression of Akt/mTOR/p70S6K pathway associated with downregulation of G1 phase cyclins contributes to (+)-brevipolide H-mediated anticancer activity, which ultimately causes mitochondrial dysfunction and cell apoptosis. The data also support the biological significance and, possibly, clinically important development of natural product-based anticancer approaches. Full article
Show Figures

Graphical abstract

Graphical abstract
Full article ">Figure 1
<p>Effect of (+)-brevipolide H on cell proliferation in PC-3 cells. (<b>A</b>) PC-3 cells were incubated in the absence or presence of (+)-brevipolide H for 96 h. After treatment, the cells were fixed and stained for SRB assay. (<b>B</b>) The cells were stained with CFSE and incubated in the absence or presence of (+)-brevipolide H for 24 or 48 h. Cell proliferation was detected using FACScan flow cytometer. Proliferation index was calculated by using ModFit LT<sup>TM</sup> 3.3 to quantify the inhibition of cell proliferation. Data are expressed as mean ± SEM of three independent experiments; * <span class="html-italic">p</span> &lt; 0.05, ** <span class="html-italic">p</span> &lt; 0.01, and *** <span class="html-italic">p</span> &lt; 0.001 compared with the respective control.</p>
Full article ">Figure 2
<p>Effect of (+)-brevipolide H on cell cycle distribution in PC-3 cells. The cells were incubated in the absence or presence of (+)-brevipolide H for 24 or 48 h and then stained with propidium iodide. The distribution of cell population was examined using FACScan flow cytometric analysis. Quantitative data of cell population at both apoptotic sub-G1 and G0/G1 were analyzed with BD CellQuest<sup>TM</sup> Pro Software. Data are expressed as mean ± SEM of three independent experiments; * <span class="html-italic">p</span> &lt; 0.05 compared with the respective control.</p>
Full article ">Figure 3
<p>Effect of (+)-brevipolide H on the expression of cell cycle related proteins. (<b>A</b>) PC-3 cells were incubated in the absence or presence of (+)-brevipolide H for the indicated concentrations and times. The cells were then collected and lysed for the detection of protein expression by Western blot analysis. Quantitative data of the relative expression under 9-h treatment are expressed as mean ± SEM of three independent experiments using Bio-Rad Image Lab<sup>TM</sup> Software (Bio-Rad, Hercules, CA, USA). The * <span class="html-italic">p</span> &lt; 0.05, ** <span class="html-italic">p</span> &lt; 0.01, and *** <span class="html-italic">p</span> &lt; 0.001 compared with the control. (<b>B</b>) PC-3 cells were starved at fetal bovine serum (FBS)-free medium for 24 h and then incubated in FBS-containing (10%) medium in the absence or presence of (+)-brevipolide H (15 µM) for 3 h. The confocal immunofluorescence microscopic examination was performed. <span class="html-italic">Bar</span>, 20 µm.</p>
Full article ">Figure 4
<p>Effect of (+)-brevipolide H on the expressions of Akt/mTOR/p70S6K pathway proteins. (<b>A</b>) PC-3 cells were incubated in the absence or presence of (+)-brevipolide H for the indicated concentrations and times. The cells were then collected and lysed for the detection of protein expression by Western blot analysis. Quantitative data under the 9-h treatment are expressed as mean ± SEM of three independent experiments using Bio-Rad Image Lab<sup>TM</sup> Software; * <span class="html-italic">p</span> &lt; 0.05, ** <span class="html-italic">p</span> &lt; 0.01, and *** <span class="html-italic">p</span> &lt; 0.001 compared with the control. (<b>B</b>) PC-3 cells were transfected with control vector or Myr-Akt and treated without or with 15 µM (+)-brevipolide H for 9 h. The protein expression was examined using Western blot analysis. Quantitative data of the relative protein expression were analyzed using Bio-Rad Image Lab<sup>TM</sup> Software.</p>
Full article ">Figure 5
<p>Effect of (+)-brevipolide H on ROS production in PC-3 cells. The cells were treated in the absence or presence of (+)-brevipolide H (5 to 15 µM), NAC (1 mM), and BAPTA (5 µM) for 1 h. ROS production was detected using FACScan flow cytometric analysis. Quantitative data of ROS generation were analyzed using BD CellQuest<sup>TM</sup> Pro Software. Data are expressed as mean ± SEM of three independent experiments; * <span class="html-italic">p</span> &lt; 0.05 and *** <span class="html-italic">p</span> &lt; 0.001 compared with (+)-brevipolide H-free control and <sup>#</sup> <span class="html-italic">p</span> &lt; 0.05, <sup>##</sup> <span class="html-italic">p</span> &lt; 0.01 and <sup>###</sup> <span class="html-italic">p</span> &lt; 0.001 compared with respective (+)-brevipolide H group.</p>
Full article ">Figure 6
<p>Effect of (+)-brevipolide H and NAC on the intracellular Ca<sup>2+</sup> levels in PC-3 cells. The cells were incubated in the absence or presence of (+)-brevipolide H (5 to 15 µM) and NAC (1 mM) for 1 h. Intracellular Ca<sup>2+</sup> levels were detected using FACScan flow cytometric analysis. Quantitative data were analyzed using BD CellQuest<sup>TM</sup> Pro Software. Data are expressed as mean ± SEM of three independent experiments; ** <span class="html-italic">p</span> &lt; 0.01 and *** <span class="html-italic">p</span> &lt; 0.001 compared with (+)-brevipolide H-free control and <sup>#</sup> <span class="html-italic">p</span> &lt; 0.05 compared with respective (+)-brevipolide H group.</p>
Full article ">Figure 7
<p>Effect of (+)-brevipolide H on the expressions of Bcl-2 family of proteins and mitochondrial membrane potential in PC-3 cells. (<b>A</b>) The cells were incubated in the absence or presence of (+)-brevipolide H for the indicated concentrations and times. The cells were then collected and lysed for the detection of protein expression by Western blot analysis. Quantitative data under the 9-h treatment are expressed as mean ± SEM of three independent experiments using Bio-Rad Image Lab<sup>TM</sup> Software; * <span class="html-italic">p</span> &lt; 0.05 and *** <span class="html-italic">p</span> &lt; 0.001 compared with the respective control. (<b>B</b>) The cells were incubated in the absence or presence of (+)-brevipolide H for 24 h and then stained with JC-1 to monitor mitochondrial membrane potential. Quantitative data were analyzed using BD CellQuest<sup>TM</sup> Pro Software and expressed as mean ± SEM of three independent experiments; *** <span class="html-italic">p</span> &lt; 0.001 compared with the control.</p>
Full article ">Figure 8
<p>Signaling pathway of (+)-brevipolide H in PC-3 cells. The (+)-brevipolide H displays anticancer activity through mitochondrial stress in which the interplay between ROS production and increased cytosolic Ca<sup>2+</sup> levels takes place. The inhibition of both Bcl-2 and Bcl-xL plays a crucial role on mitochondrial dysfunction. Akt/mTOR/p70S6K pathway was suppressed followed by the downregulation of cyclin D1 and cyclin E in (+)-brevipolide H-induced G1 checkpoint arrest. The cellular stress may ultimately induce apoptosis.</p>
Full article ">
11 pages, 1974 KiB  
Article
Antifungal Agent 4-AN Changes the Genome-Wide Expression Profile, Downregulates Virulence-Associated Genes and Induces Necrosis in Candida albicans Cells
by Aleksandra Martyna, Maciej Masłyk, Monika Janeczko, Elżbieta Kochanowicz, Bartłomiej Gielniewski, Aleksandra Świercz, Oleg M. Demchuk and Konrad Kubiński
Molecules 2020, 25(12), 2928; https://doi.org/10.3390/molecules25122928 - 25 Jun 2020
Cited by 4 | Viewed by 2511
Abstract
In the light of the increasing occurrence of antifungal resistance, there is an urgent need to search for new therapeutic strategies to overcome this phenomenon. One of the applied approaches is the synthesis of small-molecule compounds showing antifungal properties. Here we present a [...] Read more.
In the light of the increasing occurrence of antifungal resistance, there is an urgent need to search for new therapeutic strategies to overcome this phenomenon. One of the applied approaches is the synthesis of small-molecule compounds showing antifungal properties. Here we present a continuation of the research on the recently discovered anti-Candida albicans agent 4-AN. Using next generation sequencing and transcriptional analysis, we revealed that the treatment of C. albicans with 4-AN can change the expression profile of a large number of genes. The highest upregulation was observed in the case of genes involved in cell stress, while the highest downregulation was shown for genes coding sugar transporters. Real-time PCR analysis revealed 4-AN mediated reduction of the relative expression of genes engaged in fungal virulence (ALS1, ALS3, BCR1, CPH1, ECE1, EFG1, HWP1, HYR1 and SAP1). The determination of the fractional inhibitory concentration index (FICI) showed that the combination of 4-AN with amphotericin B is synergistic. Finally, flow cytometry analysis revealed that the compound induces mainly necrosis in C. albicans cells. Full article
(This article belongs to the Section Medicinal Chemistry)
Show Figures

Figure 1

Figure 1
<p>Chemical structure of 4-AN.</p>
Full article ">Figure 2
<p>Heat maps of gene-expression log values in the response to 4-AN treatment of 104 differentially expressed genes. Left heat map presents 26 upregulated genes in 4-AN treat cells, while right heat map depicts 78 downregulated genes.</p>
Full article ">Figure 3
<p>Distribution of 4-AN-responsive genes. The genes were assigned to functional categories according to the candida genome database (<a href="http://www.candidagenome.org" target="_blank">http://www.candidagenome.org</a>). The average gene-expression ratio in cells treated with 4-AN vs control cells is presented.</p>
Full article ">Figure 4
<p>Relative expression of the selected genes in response to the 4-AN action detected by real-time PCR.</p>
Full article ">Figure 5
<p>Flow cytometry analysis of <span class="html-italic">C. albicans</span> cells treated with 4-AN and amphotericin B (AmpB) (control).</p>
Full article ">
26 pages, 1666 KiB  
Review
Sustainable Palm Oil—The Role of Screening and Advanced Analytical Techniques for Geographical Traceability and Authenticity Verification
by Umi Salamah Ramli, Noor Idayu Tahir, Nurul Liyana Rozali, Abrizah Othman, Nor Hayati Muhammad, Syahidah Akmal Muhammad, Azmil Haizam Ahmad Tarmizi, Norfadilah Hashim, Ravigadevi Sambanthamurthi, Rajinder Singh, Mohamad Arif Abd Manaf and Ghulam Kadir Ahmad Parveez
Molecules 2020, 25(12), 2927; https://doi.org/10.3390/molecules25122927 - 25 Jun 2020
Cited by 9 | Viewed by 9682
Abstract
Palm oil production from oil palm (Elaeis guineensis Jacq.) is vital for the economy of Malaysia. As of late, sustainable production of palm oil has been a key focus due to demand by consumer groups, and important progress has been made in [...] Read more.
Palm oil production from oil palm (Elaeis guineensis Jacq.) is vital for the economy of Malaysia. As of late, sustainable production of palm oil has been a key focus due to demand by consumer groups, and important progress has been made in establishing standards that promote good agricultural practices that minimize impact on the environment. In line with the industrial goal to build a traceable supply chain, several measures have been implemented to ensure that traceability can be monitored. Although the palm oil supply chain can be highly complex, and achieving full traceability is not an easy task, the industry has to be proactive in developing improved systems that support the existing methods, which rely on recorded information in the supply chain. The Malaysian Palm Oil Board (MPOB) as the custodian of the palm oil industry in Malaysia has taken the initiative to assess and develop technologies that can ensure authenticity and traceability of palm oil in the major supply chains from the point of harvesting all the way to key downstream applications. This review describes the underlying framework related to palm oil geographical traceability using various state-of-the-art analytical techniques, which are also being explored to address adulteration in the global palm oil supply chain. Full article
Show Figures

Figure 1

Figure 1
<p>Scheme of palm oil traceability process from the plantation to the mill and export terminals.</p>
Full article ">Figure 2
<p>Reporter view showing the sludge palm oil (SPO) fingerprint across a range of samples. 10% SPO + lab-pressed crude palm oil (CPO) and 10% SPO + Mill 2 Dispatch Tank (M2DT) are most similar to the pure SPO fingerprint. 1% SPO + M2DT CPO and 1% SPO + lab-pressed CPO share similarities with both pure SPO and diluted SPO headspace [<a href="#B83-molecules-25-02927" class="html-bibr">83</a>].</p>
Full article ">
17 pages, 4165 KiB  
Article
DNA Photocleavage in the Near-Infrared Wavelength Range by 2-Quinolinium Dicarbocyanine Dyes
by Effibe O. Ahoulou, Kaitlyn K. Drinkard, Kanchan Basnet, Anna St. Lorenz, Oleh Taratula, Maged Henary and Kathryn B. Grant
Molecules 2020, 25(12), 2926; https://doi.org/10.3390/molecules25122926 - 25 Jun 2020
Cited by 10 | Viewed by 3802
Abstract
Here, we report the syntheses of two pentamethine cyanine dyes containing quinolinium rings and substituted with either hydrogen (3) or bromine (4) at the meso carbon. The electron withdrawing bromine atom stabilizes dye 4 in aqueous buffer, allowing complex [...] Read more.
Here, we report the syntheses of two pentamethine cyanine dyes containing quinolinium rings and substituted with either hydrogen (3) or bromine (4) at the meso carbon. The electron withdrawing bromine atom stabilizes dye 4 in aqueous buffer, allowing complex formation to occur between the dye and double-helical DNA. UV–visible, CD, and fluorescence spectra recorded at low DNA concentrations suggest that dye 4 initially binds to the DNA as a high-order aggregate. As the ratio of DNA to dye is increased, the aggregate is converted to monomeric and other low-order dye forms that interact with DNA in a non-intercalative fashion. The brominated dye 4 is relatively unreactive in the dark, but, under 707–759 nm illumination, generates hydroxyl radicals that cleave DNA in high yield (pH 7.0, 22 °C). Dye 4 is also taken up by ES2 ovarian carcinoma cells, where it is non-toxic under dark conditions. Upon irradiation of the ES2 cells at 694 nm, the brominated cyanine reduces cell viability from 100 ± 10% to 14 ± 1%. Our results suggest that 2-quinolinium-based carbocyanine dyes equipped with stabilizing electron withdrawing groups may have the potential to serve as sensitizing agents in long-wavelength phototherapeutic applications. Full article
Show Figures

Graphical abstract

Graphical abstract
Full article ">Figure 1
<p>UV–visible spectra recorded over 30 min for 10 µM of dyes <b>4</b> and <b>3</b> in: (<b>A</b>,<b>B</b>) DMSO; (<b>C</b>,(<b>D</b>) 10 mM sodium phosphate buffer pH 7.0; and (<b>E</b>,<b>F</b>) 10 mM sodium phosphate buffer pH 7.0 and 150 µM bp CT DNA (22 °C).</p>
Full article ">Figure 2
<p>Ethidium bromide stained 1.5% agarose gel showing photo-cleavage of pUC19 plasmid DNA upon irradiation with a 741-nm LED lamp (0.3 W/cm<sup>2</sup>; spectral output 707–759 nm). Reactions contained 10 mM sodium phosphate buffer pH 7.0 and 38 µM bp DNA in the absence and presence of 25 µM of dyes <b>4</b> and <b>3</b> (60 min hν at 22 °C). Parallel control reactions containing dye were kept in the dark (lanes <b>4</b> and <b>5</b>). Abbreviations: L, linear; N, nicked; S, supercoiled.</p>
Full article ">Figure 3
<p>A representative agarose gel showing photo-cleavage as a function of time for 38 µM bp pUC19 DNA in 10 mM sodium phosphate buffer pH 7.0 (22 °C). Individual reactions in the presence and absence of 24 µM of dye <b>4</b> were irradiated with a 741-nm LED lamp (0.3 W/cm<sup>2</sup>; spectral output 707–759 nm) for time intervals ranging from 0 to 120 min. Data points are averaged over 2–3 trials. Errors represent standard deviation. Abbreviations: N, nicked; S, supercoiled.</p>
Full article ">Figure 4
<p>Representative agarose gels showing photocleavage of 38 µM bp pUC19 DNA in the presence of dye <b>4</b> concentrations ranging: (<b>A</b>) 0–12 µM; and (<b>B</b>) 0–48 µM (10 mM sodium phosphate buffer pH 7.0, 10 °C). Reactions were either irradiated with a 741-nm LED lamp (0.3 W/cm<sup>2</sup>; spectral output 707–759 nm) for 60 min or kept in the dark. Data points are averaged over 2–3 trials. Errors represent standard deviation. Abbreviations: N, nicked; S, supercoiled.</p>
Full article ">Figure 5
<p>UV–visible absorption titration spectra at 22 °C of 20 µM of dye <b>4</b> in the presence of 10 mM sodium phosphate buffer pH 7.0 and CT DNA concentrations ranging: (<b>A</b>) 27–1117 µM bp; and (<b>B</b>) 657–2004 µM bp. All absorption spectra are corrected for sample dilution.</p>
Full article ">Figure 6
<p>Double <span class="html-italic">y</span>-axis plots superimposing CD titration spectra (showing DNA CD and dye <b>4</b> induced circular dichroism (ICD) signals) vs. corresponding UV–visible absorption (Abs.) titration spectra (22 °C). Samples contained 10 mM sodium phosphate buffer pH 7.0 in the presence of 20 µM of dye <b>4</b> and/or CT DNA. Absorption spectra are from <a href="#molecules-25-02926-f005" class="html-fig">Figure 5</a>A. (<b>A</b>): CD and absorption spectra are plotted from 400 to 800 nm. (<b>B</b>): The CD and absorption data in (<b>A</b>) re-plotted from 200 to 800 nm and 300 to 800 nm, respectively.</p>
Full article ">Figure 7
<p>Double <span class="html-italic">y</span>-axis plots superimposing dye <b>4</b> fluorescence emission spectra (Em) with dye <b>4</b> UV–visible absorption (Abs) (22 °C). Samples contained 10 mM sodium phosphate buffer pH 7.0, 10 µM of dye (Em) or 20 µM of dye (Abs) and: (<b>A</b>) 1117 µM bp of CT DNA, where the emission spectra were recorded at the excitation wavelengths (Ex) 532 and 640 nm (dye <b>4</b>); 529, 602, 628, and 697 nm (dye <b>4</b> with DNA); and (<b>B</b>) 38–1117 µM bp of CT DNA, where the emission spectra were recorded at an excitation wavelength (Ex) of 529 nm. The absorption spectra are from <a href="#molecules-25-02926-f005" class="html-fig">Figure 5</a>A and in (<b>B</b>) are re-plotted from 500 to 580 nm for clarity.</p>
Full article ">Figure 8
<p>UV–visible absorption spectra recorded for: dye <b>4</b> without CT DNA (blue lines); dye <b>4</b> with CT DNA (black lines); pentamidine (P) with CT DNA (green lines); and dye <b>4</b> with DNA pre-equilibrated for one min with pentamidine (red lines). All samples contained 10 mM sodium phosphate buffer pH 7.0 and one or more of the following: 10 µM of dye <b>4</b>, 150 μM bp of CT DNA, and 10 µM of pentamidine.</p>
Full article ">Figure 9
<p>(<b>A</b>) A representative superimposed fluorescence microscopy image reveals intracellular dye localization (red) in ES-2 ovarian clear cell adenocarcinoma cells after incubation with 0.5 μg/mL of dye <b>4</b> for 24 h followed by staining nuclei with Hoechst 33342 (blue). Inset: The enlarged area of one cell within the fluorescence microscopy image. (<b>B</b>) ES2 cancer cell viability for: Cells, no treatment; Light, cells exposed to a 694-nm laser (~1.3 W/cm<sup>2</sup>) for 5 min; (<b>4</b>), cells incubated with dye <b>4</b> (0.5 μg/mL = 0.9 μM) for 24 h under dark conditions; and (<b>4</b>) + Light, cells incubated with dye <b>4</b> (0.5 μg/mL) for 24 h and exposed to a 694-nm laser (1.3 W/cm<sup>2</sup>) for 5 min. * <span class="html-italic">p</span> &lt; 0.05 when compared with non-treated cells. Error bars represent standard deviation.</p>
Full article ">Scheme 1
<p>Syntheses of 2-quinolinium pentamethine carbocyanine dyes <b>3</b> and <b>4</b>.</p>
Full article ">Scheme 2
<p>Possible mechanism for accounting for dye <b>4</b>-sensitized hydroxyl radical formation [<a href="#B20-molecules-25-02926" class="html-bibr">20</a>,<a href="#B21-molecules-25-02926" class="html-bibr">21</a>].</p>
Full article ">
18 pages, 2747 KiB  
Article
Protective Effects of Some Grapevine Polyphenols against Naturally Occurring Neuronal Death
by Laura Lossi, Adalberto Merighi, Vittorino Novello and Alessandra Ferrandino
Molecules 2020, 25(12), 2925; https://doi.org/10.3390/molecules25122925 - 25 Jun 2020
Cited by 2 | Viewed by 2336
Abstract
The interest in the biological properties of grapevine polyphenols (PPs) in neuroprotection is continuously growing in the hope of finding translational applications. However, there are several concerns about the specificity of action of these molecules that appear to act non-specifically on the permeability [...] Read more.
The interest in the biological properties of grapevine polyphenols (PPs) in neuroprotection is continuously growing in the hope of finding translational applications. However, there are several concerns about the specificity of action of these molecules that appear to act non-specifically on the permeability of cellular membranes. Naturally occurring neuronal death (NOND) during cerebellar maturation is a well characterized postnatal event that is very useful to investigate the death and rescue of neurons. We here aimed to establish a baseline comparative study of the potential to counteract NOND of certain grapevine PPs of interest for the oenology. To do so, we tested ex vivo the neuroprotective activity of peonidin- and malvidin-3-O-glucosides, resveratrol, polydatin, quercetin-3-O-glucoside, (+)-taxifolin, and (+)-catechin. The addition of these molecules (50 μM) to organotypic cultures of mouse cerebellum explanted at postnatal day 7, when NOND reaches a physiological peak, resulted in statistically significant (two-tailed Mann–Whitney test—p < 0.001) reductions of the density of dead cells (propidium iodide+ cells/mm2) except for malvidin-3-O-glucoside. The stilbenes were less effective in reducing cell death (to 51–60%) in comparison to flavanols, (+)-taxifolin and quercetin 3-O-glucoside (to 69–72%). Thus, molecules with a -OH group in ortho position (taxifolin, quercetin 3-O-glucoside, (+)-catechin, and peonidin 3-O-glucoside) have a higher capability to limit death of cerebellar neurons. As NOND is apoptotic, we speculate that PPs act by inhibiting executioner caspase 3. Full article
Show Figures

Graphical abstract

Graphical abstract
Full article ">Figure 1
<p>Limitation of naturally occurring neuronal death (NOND) in the postnatal cerebellum after ex vivo treatment with polyphenols (PPs). The nuclei of dead cells are strongly fluorescent in red after incubation with propidium iodide (PI). PI is a fluorescent intercalating DNA stain that is not membrane permeable. Thus, it only enters the nucleus of damaged cells and can therefore be used to differentiate dead cells (apoptotic, necrotic, etc.) from healthy cells based on membrane integrity. As 170 mM ethanol in which PPs are dissolved does not significantly alter cell death, it can be used as a baseline control (CTR) for the experiments to ascertain the effects of PPs onto NOND. The three panels are representative images of the experiments carried out with ethanol 170 mM (<b>A</b>) and with individual PPs, resveratrol 50 μM (<b>B</b>) and (+)-catechin 50 μM (<b>C</b>).</p>
Full article ">Figure 2
<p>Descriptive exploratory statistics (<b>A</b>) and inferential statistics (<b>B</b>) of the effects of different ethanol concentrations in culture medium onto cerebellar naturally occurring neuronal death (NOND). Dead cells were stained with propidium iodide and results are expressed as means of dead cells/area. Two-tailed Kruskal–Wallis test and Dunn’s multiple comparison test (plain medium vs ethanolic media) were applied, as data did not pass the D’Agostino and Pearson normality test. * 0.05 &gt; P &gt; 0.01, **** P &lt; 0.0001. Bars are 95% CI.</p>
Full article ">Figure 3
<p>Linear regression curve of the density of dead cells related to different ethanol concentrations in culture media. Dead cells were stained with propidium iodide and results are expressed as means of dead cells/area. The curve demonstrates a positive correlation between the concentration of ethanol in medium and the density of dead cells. Slope was significantly non-zero: F = 30.55, P value = 0.0312. Equation: Y (dead cells/mm<sup>2</sup>) = 0.09141 × (ethanol concentration) + 11.15. Bars indicate 95% CI.</p>
Full article ">Figure 4
<p>Descriptive exploratory statistics of the effect of different polyphenols (<b>A</b> = resveratrol; <b>B</b> = polydatin; <b>C</b> = Mv-3OG (malvidin 3-O-glucoside); <b>D</b> = aqueous medium-dissolved Mv-3OG; <b>E</b> =Pn-3OG (peonidin 3-O-glucoside); <b>F</b> = Q-3OG (quercetin 3-O-glucoside); <b>G</b> = (+)-catechin; <b>H</b> = taxifolin) on cerebellar naturally occurring neuronal death (NOND). Dead cells were stained with propidium iodide and results are expressed as means of dead cells/area with 95% CI. Scatter graphs show the dispersion and variability of data. Abbreviations: CTRL = control medium containing 170 mM ethanol; CTRL (w) = control medium (aqueous).</p>
Full article ">Figure 5
<p>Inferential statistics of the effects of different polyphenols (<b>A</b> = resveratrol; <b>B</b> = polydatin; <b>C</b> = Mv-3OG (malvidin 3-O-glucoside); <b>D</b> = aqueous medium-dissolved Mv-3OG; <b>E</b> =Pn-3OG (peonidin 3-O-glucoside); <b>F</b> = Q-3OG (quercetin 3-O-glucoside); <b>G</b> = (+)-catechin; <b>H</b> = taxifolin) on cerebellar naturally occurring neuronal death (NOND). Dead cells were stained with propidium iodide and results are expressed as means of dead cells/area. The two-tailed Mann-Whitney test was applied, as data did not pass the D’Agostino and Pearson normality test. *** 0.0001 &gt; P &gt; 0.001, **** P &lt; 0.0001. Bars are 95% CI. All PPs except Mv-3OG (C-D) reduced NOND in cerebellar slices. Abbreviations: CTRL = control medium containing 170 mM ethanol; CTRL (w) = control medium (aqueous).</p>
Full article ">Figure 6
<p>Chemical formulas of the PPs used to study neuroprotection in postnatal cerebellum.</p>
Full article ">
Previous Issue
Next Issue
Back to TopTop