[go: up one dir, main page]

Next Issue
Volume 25, January-2
Previous Issue
Volume 24, December-2
 
 
molecules-logo

Journal Browser

Journal Browser

Molecules, Volume 25, Issue 1 (January-1 2020) – 238 articles

Cover Story (view full-size image): 
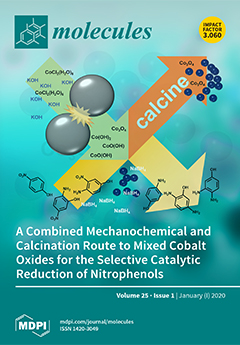
Nitroaromatics are widely used compounds in industrial processes, and as a result are among the most common anthropogenic pollutants. Their catalytic reduction to less toxic and synthetically useful aminophenols may be a viable remediation strategy. To date, the majority of work focuses on precisely tailored noble metal-based nanocatalysts. The cost of such systems hampers practical application. We report a facile route to bulk cobalt oxide-based materials, via a combined mechanochemical and calcination approach. Vibratory ball milling of CoCl2(H2O)6 with KOH, and subsequent calcination, afforded three cobalt oxide-based materials with different combinations of CoO(OH), Co(OH)2, and Co3O4. All three proved active for the reduction of 4-nitrophenol and related aminonitrophenols. View this paper.
  • Issues are regarded as officially published after their release is announced to the table of contents alert mailing list.
  • You may sign up for e-mail alerts to receive table of contents of newly released issues.
  • PDF is the official format for papers published in both, html and pdf forms. To view the papers in pdf format, click on the "PDF Full-text" link, and use the free Adobe Reader to open them.
Order results
Result details
Section
Select all
Export citation of selected articles as:
15 pages, 4164 KiB  
Article
Substrate Profiling of the Cobalt Nitrile Hydratase from Rhodococcus rhodochrous ATCC BAA 870
by Adelaide R. Mashweu, Varsha P. Chhiba-Govindjee, Moira L. Bode and Dean Brady
Molecules 2020, 25(1), 238; https://doi.org/10.3390/molecules25010238 - 6 Jan 2020
Cited by 16 | Viewed by 7237
Abstract
The aromatic substrate profile of the cobalt nitrile hydratase from Rhodococcus rhodochrous ATCC BAA 870 was evaluated against a wide range of nitrile containing compounds (>60). To determine the substrate limits of this enzyme, compounds ranging in size from small (90 Da) to [...] Read more.
The aromatic substrate profile of the cobalt nitrile hydratase from Rhodococcus rhodochrous ATCC BAA 870 was evaluated against a wide range of nitrile containing compounds (>60). To determine the substrate limits of this enzyme, compounds ranging in size from small (90 Da) to large (325 Da) were evaluated. Larger compounds included those with a bi-aryl axis, prepared by the Suzuki coupling reaction, Morita–Baylis–Hillman adducts, heteroatom-linked diarylpyridines prepared by Buchwald–Hartwig cross-coupling reactions and imidazo[1,2-a]pyridines prepared by the Groebke–Blackburn–Bienaymé multicomponent reaction. The enzyme active site was moderately accommodating, accepting almost all of the small aromatic nitriles, the diarylpyridines and most of the bi-aryl compounds and Morita–Baylis–Hillman products but not the Groebke–Blackburn–Bienaymé products. Nitrile conversion was influenced by steric hindrance around the cyano group, the presence of electron donating groups (e.g., methoxy) on the aromatic ring, and the overall size of the compound. Full article
(This article belongs to the Special Issue Nitrilases and Nitrile Hydratases)
Show Figures

Graphical abstract

Graphical abstract
Full article ">Figure 1
<p>Compounds showing 50% to 100% conversion.</p>
Full article ">Figure 2
<p>Compounds showing 16% to 50% conversion.</p>
Full article ">Figure 3
<p>Compounds showing 5% to 15% conversion.</p>
Full article ">Figure 4
<p>Compounds showing 0% to 5% conversion.</p>
Full article ">Figure 5
<p>MEP diagrams. Blue indicates electron deficient and red electron rich areas, respectively.</p>
Full article ">Figure 6
<p>Compounds <b>24s</b> and <b>28d</b> MEP and space filling models.</p>
Full article ">Figure 7
<p>Space filling models of 7-azaindole-4-carbonitrile <b>32</b>, and Groebke–Blackburn–Bienaymé multicomponent reaction products <b>17j</b> and <b>17d.</b></p>
Full article ">Figure 8
<p>MEP of <b>19</b> with comparison to 3-cyanopyridine (<b>26a</b>), and 4-methylbenzonitrile (<b>24b</b>).</p>
Full article ">Scheme 1
<p>Reactions catalysed by nitrile degrading enzymes.</p>
Full article ">Scheme 2
<p>Suzuki reaction followed by biocatalysis reaction. Conditions: (<b>i</b>) Pd(PPh<sub>3</sub>)<sub>4</sub>, Na<sub>2</sub>CO<sub>3</sub>, DME; (<b>ii</b>) NHase, Tris buffer pH 7.6, acetone, 30 °C.</p>
Full article ">Scheme 3
<p>Morita Baylis–Hillman reaction and biocatalysis reaction. Conditions: (<b>i</b>) DABCO; (<b>ii</b>) NHase, Tris buffer pH = 7.6, acetone, 30 °C.</p>
Full article ">Scheme 4
<p>Groebke–Blackburn–Bienaymé multicomponent reaction, followed by biocatalysis reaction. Conditions: (<b>i</b>) Montmorillonite K-10 clay, dioxane, 100 °C; (<b>ii</b>) NHase, Tris buffer pH = 7.6, acetone, 30 °C.</p>
Full article ">Scheme 5
<p>Buchwald–Hartwig reactions, followed by biocatalysis. Conditions: (<b>i</b>) and (<b>ii</b>) 4-chlorophenol, Pd<sub>2</sub>dba<sub>3</sub>, <span class="html-italic">rac</span>-BINAP, dioxane, NaO<span class="html-italic">t</span>Bu, 110 °C; (<b>iii</b>) 2-cyano-5-methylaniline, Pd<sub>2</sub>dba<sub>3</sub>, <span class="html-italic">rac</span>-BINAP, 1,4-dioxane, NaO<span class="html-italic">t</span>Bu, 110 °C; (<b>iv</b>) NHase, Tris buffer pH = 7.6, acetone, 30 °C.</p>
Full article ">
10 pages, 3913 KiB  
Article
Identification and Biological Evaluation of CK2 Allosteric Fragments through Structure-Based Virtual Screening
by Chunqiong Li, Xuewen Zhang, Na Zhang, Yue Zhou, Guohui Sun, Lijiao Zhao and Rugang Zhong
Molecules 2020, 25(1), 237; https://doi.org/10.3390/molecules25010237 - 6 Jan 2020
Cited by 10 | Viewed by 4873
Abstract
Casein kinase II (CK2) is considered as an attractive cancer therapeutic target, and recent efforts have been made to develop its ATP-competitive inhibitors. However, achieving selectivity with respect to related kinases remains challenging due to the highly conserved ATP-binding pocket of kinases. Allosteric [...] Read more.
Casein kinase II (CK2) is considered as an attractive cancer therapeutic target, and recent efforts have been made to develop its ATP-competitive inhibitors. However, achieving selectivity with respect to related kinases remains challenging due to the highly conserved ATP-binding pocket of kinases. Allosteric inhibitors, by targeting the much more diversified allosteric site relative to the highly conserved ATP-binding pocket, might be a promising strategy with the enhanced selectivity and reduced toxicity than ATP-competitive inhibitors. The previous studies have highlighted the traditional serendipitousity of discovering allosteric inhibitors owing to the complicate allosteric modulation. In this current study, we identified the novel allosteric inhibitors of CK2α by combing structure-based virtual screening and biological evaluation methods. The structure-based pharmacophore model was built based on the crystal structure of CK2α-compound 15 complex. The ChemBridge fragment library was searched by evaluating the fit values of these molecules with the optimized pharmacophore model, as well as the binding affinity of the CK2α-ligand complexes predicted by Alloscore web server. Six hits forming the holistic interaction mechanism with the αD pocket were retained after pharmacophore- and Alloscore-based screening for biological test. Compound 3 was found to be the most potent non-ATP competitive CK2α inhibitor (IC50 = 13.0 μM) with the anti-proliferative activity on A549 cancer cells (IC50 = 23.1 μM). Our results provide new clues for further development of CK2 allosteric inhibitors as anti-cancer hits. Full article
(This article belongs to the Special Issue Fragment Based Drug Discovery)
Show Figures

Figure 1

Figure 1
<p>The structures of reported CK2 inhibitors binding to Non-ATP binding pocket.</p>
Full article ">Figure 2
<p>The four pharmacophoric features (<b>a</b>) HBD32, HBD96, HY22 and HY39 identified by the active compounds; and (<b>b</b>) mapped with the key residues of CK2αD pocket.</p>
Full article ">Figure 3
<p>Virtual screening procedures.</p>
Full article ">Figure 4
<p>Docking poses of compound (<b>a</b>) <b>1</b> (cyan); (<b>b</b>) <b>2</b> (orange); (<b>c</b>) <b>3</b> (yellow); (<b>d</b>) <b>4</b> (green); (<b>e</b>) <b>5S</b> (purple) and R (pink); (<b>f</b>) <b>6</b> (magenta) in the αD site of CK2α.</p>
Full article ">Figure 5
<p>(<b>a</b>) Inhibitory activity of six compounds against CK2 at four concentrations; (<b>b</b>) Dose-dependent inhibitory effects of compound <b>3</b> and <b>4</b> against CK2 in the presence of 10 μM and 100 μM ATP.</p>
Full article ">Figure 6
<p>Superimposition of the docked conformation and the average structure from MD simulation: (<b>a</b>) compound <b>3</b> (yellow and pink, respectively); (<b>b</b>) compound <b>4</b> (green and cyan, respectively).</p>
Full article ">Figure 7
<p>Dose response curve for the inhibition of A549 cell proliferation by compound <b>3</b> and <b>4</b>.</p>
Full article ">
14 pages, 2587 KiB  
Article
Tracking Extracellular Matrix Remodeling in Lungs Induced by Breast Cancer Metastasis. Fourier Transform Infrared Spectroscopic Studies
by Karolina Chrabaszcz, Katarzyna Kaminska, Karolina Augustyniak, Monika Kujdowicz, Marta Smeda, Agnieszka Jasztal, Marta Stojak, Katarzyna M. Marzec and Kamilla Malek
Molecules 2020, 25(1), 236; https://doi.org/10.3390/molecules25010236 - 6 Jan 2020
Cited by 13 | Viewed by 5254
Abstract
This work focused on a detailed assessment of lung tissue affected by metastasis of breast cancer. We used large-area chemical scanning implemented in Fourier transform infrared (FTIR) spectroscopic imaging supported with classical histological and morphological characterization. For the first time, we differentiated and [...] Read more.
This work focused on a detailed assessment of lung tissue affected by metastasis of breast cancer. We used large-area chemical scanning implemented in Fourier transform infrared (FTIR) spectroscopic imaging supported with classical histological and morphological characterization. For the first time, we differentiated and defined biochemical changes due to metastasis observed in the lung parenchyma, atelectasis, fibrous, and muscle cells, as well as bronchi ciliate cells, in a qualitative and semi-quantitative manner based on spectral features. The results suggested that systematic extracellular matrix remodeling with the progress of the metastasis process evoked a decrease in the fraction of the total protein in atelectasis, fibrous, and muscle cells, as well as an increase of fibrillar proteins in the parenchyma. We also detected alterations in the secondary conformations of proteins in parenchyma and atelectasis and changes in the level of hydroxyproline residues and carbohydrate moieties in the parenchyma. The results indicate the usability of FTIR spectroscopy as a tool for the detection of extracellular matrix remodeling, thereby enabling the prediction of pre-metastatic niche formation. Full article
Show Figures

Graphical abstract

Graphical abstract
Full article ">Figure 1
<p>Comparison of false-color unsupervised hierarchical cluster analysis (UHCA) maps with hematoxylin and eosin (H&amp;E) microphotographs collected from lung cross-sections. UHCA classification of the most abundant tissue types in lungs: parenchyma (grey), atelectasis (green), fibrous/muscular tissue (blue), and bronchi ciliated cells (aqua) corresponds to tissue structure observed in the H&amp;E images. Magnified microphotographs after H&amp;E staining with marked tissue types are shown in <a href="#app1-molecules-25-00236" class="html-app">Figure S2 in Supplementary Materials</a>.</p>
Full article ">Figure 2
<p>The comparison of second derivative IR spectra extracted from UHCA analysis for lung parenchyma (averaged from <span class="html-italic">n</span> = 37 spectra) (<b>A</b>), bronchi ciliated cells (averaged from <span class="html-italic">n</span> = 23 spectra) (<b>B</b>), atelectasis (averaged from <span class="html-italic">n</span> = 43 spectra), (<b>C</b>) and fibrous/muscular tissue (averaged from <span class="html-italic">n</span> = 44 spectra) (<b>D</b>). Spectra are shown in the regions of 1700–1480 (<b>1</b>) and 1340–1000 cm<sup>−1</sup> (<b>2</b>). On week 5, bronchi ciliated cells were not found since atelectasis covers the entire area of the lungs.</p>
Full article ">Figure 3
<p>Box diagrams of integral intensities for the selected bands showing biochemical changes in parenchyma, atelectasis, and fibrous/muscular tissue in the metastasis progression in the lungs. Integration regions: total proteins [(1707–1608 cm<sup>−1</sup>) + (1589–1485 cm<sup>−1</sup>)], secondary structure of proteins [(1589–1485 cm<sup>−1</sup>)/(1707–1608 cm<sup>−1</sup>)], fibrillar proteins (1286–1193 cm<sup>−1</sup>), hydroxyproline residues (1187–1140 cm<sup>−1</sup>), carbohydrate moieties (1137–1015 cm<sup>−1</sup>). The bands’ assignment is given in <a href="#molecules-25-00236-t002" class="html-table">Table 2</a>.</p>
Full article ">
18 pages, 6272 KiB  
Article
Silk/Natural Rubber (NR) and 3,4-Dihydroxyphenylalanine (DOPA)-Modified Silk/NR Composites: Synthesis, Secondary Structure, and Mechanical Properties
by Hiromitsu Sogawa, Treratanakulwongs Korawit, Hiroyasu Masunaga and Keiji Numata
Molecules 2020, 25(1), 235; https://doi.org/10.3390/molecules25010235 - 6 Jan 2020
Cited by 8 | Viewed by 5081
Abstract
Silk composites with natural rubber (NR) were prepared by mixing degummed silk and NR latex solutions. A significant enhancement of the mechanical properties was confirmed for silk/NR composites compared to a NR-only product, indicating that silk can be applied as an effective reinforcement [...] Read more.
Silk composites with natural rubber (NR) were prepared by mixing degummed silk and NR latex solutions. A significant enhancement of the mechanical properties was confirmed for silk/NR composites compared to a NR-only product, indicating that silk can be applied as an effective reinforcement for rubber materials. Attenuated total reflection Fourier transform infrared (ATR-FTIR) and wide-angle X-ray diffraction (WAXD) analysis revealed that a β-sheet structure was formed in the NR matrix by increasing the silk content above 20 wt%. Then, 3,4-dihydroxyphenylalanine (DOPA)-modified silk was also blended with NR to give a DOPA-silk/NR composite, which showed superior mechanical properties to those of the unmodified silk-based composite. Not only the chemical structure but also the dominant secondary structure of silk in the composite was changed after DOPA modification. It was concluded that both the efficient adhesion property of DOPA residue and the secondary structure change improved the compatibility of silk and NR, resulting in the enhanced mechanical properties of the formed composite. The knowledge obtained herein should contribute to the development of the fabrication of novel silk-based elastic materials. Full article
(This article belongs to the Special Issue Silk Fibroin Materials)
Show Figures

Figure 1

Figure 1
<p>Sample preparation protocol of silk/NR composites and their appearance. Silk solution (80 g/L) (<b>a</b>) was mixed with NR latex (<b>b</b>) and stirred for 30 min at 25 °C. The mixture was poured into a silicon mold and dried for 24 h at 25 °C, to give silk/NR composites with different silk contents (<b>c</b>). The silk content was varied by changing the volume of silk solution, while keeping the other parameters constant.</p>
Full article ">Figure 2
<p>Stress-strain curves of (<b>a</b>) silk<sub>0</sub>/NR<sub>100</sub> (pure NR), (<b>b</b>) silk<sub>10</sub>/NR<sub>90</sub>, (<b>c</b>) silk<sub>20</sub>/NR<sub>80</sub>, and (<b>d</b>) silk<sub>40</sub>/NR<sub>60</sub>. Elongation rate: 10 mm/min. The inset focuses on the strain range between 0% and 100%.</p>
Full article ">Figure 3
<p>Mechanical properties of silk/NR composites with different silk contents: (<b>a</b>) Young’s modulus, (<b>b</b>) strain at break, (<b>c</b>) breaking strength, and (<b>d</b>) fracture energy. * Significant differences between groups at <span class="html-italic">p</span> &lt; 0.01.</p>
Full article ">Figure 4
<p>The strain dependence of <span class="html-italic">G’</span> of silk/NR composites with different silk contents. The frequency was fixed at 10 Hz.</p>
Full article ">Figure 5
<p>Cross-sectional SEM images of silk/NR composites with different silk contents. (<b>a</b>–<b>d</b>) As-prepared surface before stretching and (<b>e</b>–<b>h</b>) the fracture surface after stretching.</p>
Full article ">Figure 6
<p>ATR-FTIR spectra of silk/NR composites with different silk contents in the range of (<b>a</b>) 4000–800 cm<sup>–1</sup> and (<b>b</b>) 1700–1600 cm<sup>–1</sup>. The black dotted line (1650 cm<sup>−1</sup>) represents amide I absorption of the random coil structure of silk, while the brown dotted line (1625 cm<sup>−1</sup>) represents that of the β-sheet structure [<a href="#B54-molecules-25-00235" class="html-bibr">54</a>].</p>
Full article ">Figure 7
<p>One-dimensional WAXD profiles of silk/NR composites with different silk contents. A broad amorphous halo peak was observed for Silk<sub>0</sub>/NR<sub>100</sub> and Silk<sub>10</sub>/NR<sub>90</sub>. The amorphous halo and the Bragg reflections (020)/(210)/(040) in silkworm silk from <span class="html-italic">B. mori</span> were observed for Silk<sub>20</sub>/NR<sub>80</sub> and Silk<sub>40</sub>/NR<sub>60</sub> [<a href="#B55-molecules-25-00235" class="html-bibr">55</a>,<a href="#B56-molecules-25-00235" class="html-bibr">56</a>,<a href="#B57-molecules-25-00235" class="html-bibr">57</a>].</p>
Full article ">Figure 8
<p>Sample preparation protocol of the DOPA-silk/NR composite and its appearance. The 20 wt% DOPA-modified silk solution (20 g/L) (<b>a’</b>) was prepared from silk solution (<b>a</b>) and subsequently mixed with NR latex (<b>b</b>) and stirred for 30 min at 25 °C. The mixture was poured into a silicon mold and dried for 24 h at 25 °C, to give DOPA-silk<sub>20</sub>/NR<sub>80</sub> (<b>c</b>). The control sample, silk<sub>20</sub>/NR<sub>80</sub>-2, was prepared in the same manner without the addition of tyrosinase (<b>d</b>). Note that the silk concentration for the preparation of DOPA-silk<sub>20</sub>/NR<sub>80</sub> and silk<sub>20</sub>/NR<sub>80</sub>-2 differed from that of silk<sub>20</sub>/NR<sub>80</sub>.</p>
Full article ">Figure 9
<p>Stress-strain curves of (<b>a</b>) silk<sub>20</sub>/NR<sub>80</sub>-2 and (<b>b</b>) DOPA-silk<sub>20</sub>/NR<sub>80</sub>. The inset focuses on the strain range between 0 and 100%. The silk content and elongation rate were fixed at 20 wt% and 10 mm/min, respectively.</p>
Full article ">Figure 10
<p>Mechanical properties of silk<sub>20</sub>/NR<sub>80</sub>-2 and DOPA-silk<sub>20</sub>/NR<sub>80</sub>: (<b>a</b>) Young’s modulus, (<b>b</b>) strain at break, (<b>c</b>) breaking strength, and (<b>d</b>) fracture energy. The silk content was fixed at 20 wt%. * Significant differences between groups at <span class="html-italic">p</span> &lt; 0.01.</p>
Full article ">Figure 11
<p>The strain dependence of <span class="html-italic">G’</span> of silk<sub>20</sub>/NR<sub>80</sub>-2 and DOPA-silk<sub>20</sub>/NR<sub>80</sub>. The frequency was fixed at 10 Hz.</p>
Full article ">Figure 12
<p>Cross-sectional SEM images of silk<sub>20</sub>/NR<sub>80</sub>-2 and DOPA-silk<sub>20</sub>/NR<sub>80</sub>. (<b>a</b>,<b>c</b>) As-prepared surface before stretching and (<b>b</b>,<b>d</b>) the fracture surface after stretching.</p>
Full article ">Figure 13
<p>ATR-FTIR spectra of silk<sub>20</sub>/NR<sub>80</sub>-2 and DOPA-silk<sub>20</sub>/NR<sub>80</sub> in the range of (<b>a</b>) 4000–800 cm<sup>–1</sup> and (<b>b</b>) 1700–1600 cm<sup>–1</sup>. The black dotted line (1650 cm<sup>−1</sup>) represents the amide I absorption of the random coil structure of silk, while the brown dotted line (1625 cm<sup>−1</sup>) represents that of the β-sheet structure [<a href="#B54-molecules-25-00235" class="html-bibr">54</a>].</p>
Full article ">Figure 14
<p>1D WAXD profiles of silk<sub>20</sub>/NR<sub>80</sub>-2 and DOPA-silk<sub>20</sub>/NR<sub>80</sub> before and after the stretching treatment. (<b>a</b>) Before the stretching, the broad amorphous halo peak was observed for DOPA-silk<sub>20</sub>/NR<sub>80</sub>, whereas the amorphous halo and the Bragg reflections (020)/(210)/(040) in silkworm silk from <span class="html-italic">B. mori</span> were observed for silk<sub>20</sub>/NR<sub>80</sub>-2 [<a href="#B55-molecules-25-00235" class="html-bibr">55</a>,<a href="#B56-molecules-25-00235" class="html-bibr">56</a>,<a href="#B57-molecules-25-00235" class="html-bibr">57</a>]. (<b>b</b>) After approximately 350% and 760% stretching deformation for silk<sub>20</sub>/NR<sub>80</sub>-2 and DOPA-silk<sub>20</sub>/NR<sub>80</sub>, respectively, the peaks originated from the diffractions, (200)/(201)/(120), of the strain-induced crystallization of NR were detected. The assignment is based on a previous literature [<a href="#B66-molecules-25-00235" class="html-bibr">66</a>].</p>
Full article ">Scheme 1
<p>Tyrosinase-catalyzed DOPA modification of silk. Silk solution was mixed with tyrosinase (1300 U/mL) and PBS (0.1 M, pH 7.0) and stirred for 1 h at 25 °C. The reaction conversion and DOPA content were determined by amino acid analysis.</p>
Full article ">
17 pages, 3180 KiB  
Article
Can We Safely Obtain Formal Oxidation States from Centroids of Localized Orbitals?
by Martí Gimferrer, Gerard Comas-Vilà and Pedro Salvador
Molecules 2020, 25(1), 234; https://doi.org/10.3390/molecules25010234 - 6 Jan 2020
Cited by 15 | Viewed by 5171
Abstract
The use of centroids of localized orbitals as a method to derive oxidation states (OS) from first-principles is critically analyzed. We explore the performance of the closest-atom distance criterion to assign electrons for a number of challenging systems, including high-valent transition metal compounds, [...] Read more.
The use of centroids of localized orbitals as a method to derive oxidation states (OS) from first-principles is critically analyzed. We explore the performance of the closest-atom distance criterion to assign electrons for a number of challenging systems, including high-valent transition metal compounds, π-adducts, and transition metal (TM) carbenes. Here, we also introduce a mixed approach that combines the position of the centroids with Bader’s atomic basins as an alternative criterion for electron assignment. The closest-atom criterion performs reasonably well for the challenging systems, but wrongly considers O-H and N-H bonds as hydrides. The new criterion fixes this problem, but underperforms in the case of TM carbenes. Moreover, the OS assignment in dubious cases exhibit undesirable dependence on the particular choice for orbital localization. Full article
(This article belongs to the Special Issue Modern Computational Methods for Chemical Bonding and Reactivity)
Show Figures

Graphical abstract

Graphical abstract
Full article ">Figure 1
<p>Centroid position (see text) versus electronegativity ratio for the XH<sub>n</sub> set. OS assignment using closest-atom criterion.</p>
Full article ">Figure 2
<p>Centroid position relative to the bond critical point (see text) versus electronegativity ratio for the XH<sub>n</sub> set. OS assignment using basin-allegiance criterion.</p>
Full article ">Figure 3
<p>Relative occupation of frontier EFOs versus electronegativity ratio for the XH<sub>n</sub> set and OS assignment using EOS analysis.</p>
Full article ">Figure 4
<p>Pictorial representation of the zero-flux surface and position of the centroid of the NLMO σ N-O orbital for (CH3)<sub>3</sub>NO. In the case of PM, the distances from the centroid to N and O are 0.660 and 0.692 (in Å).</p>
Full article ">Figure 5
<p>TM-O σ-type NLMO isocontour plot (0.1) for TiO<sub>2</sub> (<b>a</b>), FeO<sub>4</sub><sup>2−</sup> (<b>b</b>), ReO<sub>4</sub><sup>−</sup> (<b>c</b>), OsO<sub>4</sub> (<b>d</b>), IrO<sub>4</sub><sup>+</sup> (<b>e</b>) and PtO<sub>4</sub><sup>2+</sup> (<b>f</b>,<b>g</b>). <span class="html-italic">bcp</span> and centroid represented by black and green dots, respectively. (distances in Å).</p>
Full article ">Figure 6
<p>Isocontour plot (0.1) of NLMO localized on the C<sub>7</sub>H<sub>7</sub> π-ligand for V(CO)<sub>3</sub>(C<sub>7</sub>H<sub>7</sub>) (<b>a</b>) and Mo(C<sub>7</sub>H<sub>7</sub>)(C<sub>5</sub>H<sub>5</sub>) (<b>b</b>). Orbital centroid represented by green dots.</p>
Full article ">Figure 7
<p>Isocontour plot (0.1) of NLMO localized on top (<b>a</b>) and bottom (<b>b</b>) π-ligands for Mn(C<sub>7</sub>H<sub>7</sub>)<sub>2</sub>. In each case, top three orbitals correspond to alpha spin, and bottom five to beta spin. Orbital centroid represented by green dots.</p>
Full article ">Figure 8
<p>TM carbenes analyzed in this work. Abbreviation: Aryl = 2,6-diisopropylphenyl, Aryl* = 2,6-dimethylphenyl, Cy = cyclohexyl and Mes = mesityl.</p>
Full article ">Figure 9
<p>Classification of the TM carbenes according to the relative occupation number of the σ and π EFOs on the TM and the carbene moiety. Data points corresponding to 1–4 (green circle) and 5–9 (orange circle).</p>
Full article ">Figure 10
<p>(<b>a</b>) Pictorial representation of a Fischer-type carbene, including the centroids of localized σ (red dot) and π (green dot) bond orbitals and relevant distances for CA (midpoint of the bond) and BA (<span class="html-italic">bcp</span>) criteria. (<b>b</b>) Classification of the TM carbenes according to the distance from the σ and π centroids to bond midpoint (CA) or <span class="html-italic">bcp</span> (BA). Data points corresponding to 1–4 (green circle) and 5–9 (orange circle).</p>
Full article ">
19 pages, 2183 KiB  
Article
Comparative Phytochemical Characterization, Genetic Profile, and Antiproliferative Activity of Polyphenol-Rich Extracts from Pigmented Tubers of Different Solanum tuberosum Varieties
by Luigi De Masi, Paola Bontempo, Daniela Rigano, Paola Stiuso, Vincenzo Carafa, Angela Nebbioso, Sonia Piacente, Paola Montoro, Riccardo Aversano, Vincenzo D’Amelia, Domenico Carputo and Lucia Altucci
Molecules 2020, 25(1), 233; https://doi.org/10.3390/molecules25010233 - 6 Jan 2020
Cited by 36 | Viewed by 5186
Abstract
Plants produce a vast array of biomolecules with beneficial effects for human health. In this study, polyphenol and anthocyanin-rich extracts (PAE) from pigmented tubers of Solanum tuberosum L. varieties “Blue Star”, “Magenta Love”, and “Double Fun” in comparison with the more extensively studied [...] Read more.
Plants produce a vast array of biomolecules with beneficial effects for human health. In this study, polyphenol and anthocyanin-rich extracts (PAE) from pigmented tubers of Solanum tuberosum L. varieties “Blue Star”, “Magenta Love”, and “Double Fun” in comparison with the more extensively studied “Vitelotte” were evaluated and compared for antiproliferative effects in human leukemia cells, and their phytochemical and genetic profiles were determined. In U937 cells, upon treatment with PAE, it was possible to reveal the expression of specific apoptotic players, such as caspase 8, 9, 3, and poly (ADP-ribose) polymerase (PARP), as well as the induction of monocyte and granulocyte differentiation. A liquid chromatography/electrospray ionization tandem mass spectrometry (LC-ESI-MS/MS) investigation revealed the presence of polyphenolic compounds in all the varieties of potatoes analyzed, among which caffeoyl and feruloyl quinic acid derivatives were the most abundant, as well as several acylated anthocyanins. Each pigmented variety was genotyped by DNA-based molecular markers, and flavonoid-related transcription factors were profiled in tubers in order to better characterize these outstanding resources and contribute to their exploitation in breeding. Interesting biological activities were observed for “Blue Star” and “Vitelotte” varieties with respect to the minor or no effect of the “Double Fun” variety. Full article
(This article belongs to the Section Natural Products Chemistry)
Show Figures

Graphical abstract

Graphical abstract
Full article ">Figure 1
<p>Polyphenol and anthocyanin-rich extracts (PAE) from <span class="html-italic">S. tuberosum</span> varieties restored the apoptotic program in U937 cancer cells, as compared to untreated U937 control cells (Ctr). (<b>A</b>) Western blot analysis of the indicated proteins in U937 cells after PAE treatment from “Magenta Love”, “Blue Star”, “Double Fun”, and “Vitelotte” varieties at 2.5 mg/mL for 24 h. Glyceraldehyde 3-phosphate dehydrogenase (GAPDH) detection was used as loading control. (<b>B</b>) Western blot analysis of the indicated protein in U937 cells after PAE treatment at 2.5 mg/mL for 24 h. Extracellular signal-regulated protein kinases 1 and 2 (ERKs 1/2) were used as loading control.</p>
Full article ">Figure 2
<p>PAE from <span class="html-italic">S. tuberosum</span> varieties induced hematological cancer cell differentiation. (<b>A</b>) Fluorescence-activated cell sorting (FACS) analysis of CD14 (left) and CD11c (right) expression in U937 cells upon PAE treatment from “Magenta Love”, “Blue Star”, “Double Fun”, and “Vitelotte” at 2.5 mg/mL for 24 h, as compared to untreated control cells (Ctrl). Error bars represent the standard deviation from two independent experiments carried out in duplicate. Isotype controls (ctrl) were used as negative control. (<b>B</b>) Oxidative stress markers evaluated in the media (NO) and homogenates (thiobarbituric acid reactive substances, TBARS) of U937 cells treated with 2.5 mg/mL of PAE for 24 h, as compared to untreated control cells (Ctr). (<b>C</b>) Morphological analysis of granulocytic differentiation in HL60 hematological cancer cell line after treatment with 1.25 mg/mL PAE for 6 days.</p>
Full article ">Figure 3
<p>LC-ESI-Orbitrap-MS profiles of polyphenol and anthocyanin-rich extracts from pigmented tubers in negative ion mode. Note: V = “Vitelotte”; DF = “Double Fun”; ML = “Magenta Love”; BS = “Blue Star”.</p>
Full article ">Figure 4
<p>Comparative genetic profiling of pigmented potato cultivars. Gene expression analysis in tubers of potato genotypes as monitored by absolute Real-Time Quantitative Reverse Transcription PCR (qRT-PCR). Each value represents the mean of three determinations (± SD). Means denoted by the same letter did not differ significantly at <span class="html-italic">p</span> ≤ 0.05 according to Tukey’s test.</p>
Full article ">
2 pages, 1886 KiB  
Correction
Correction: Zhao, X.W., et al. Dioscin Induces the Apoptosis of Human Cervical Carcinoma HeLa and SiHa Cells Through ROS-mediated DNA Damage, Cell Cycle Arrest and Mitochondrial Signaling Pathways. Molecules 2016, 21, 730
by Xinwei Zhao, Xufeng Tao, Lina Xu, Lianhong Yin, Yan Qi, Youwei Xu, Xu Han and Jinyong Peng
Molecules 2020, 25(1), 232; https://doi.org/10.3390/molecules25010232 - 6 Jan 2020
Cited by 1 | Viewed by 2326
Abstract
During the course of a review of our publications, an error in the title paper [...] Full article
Show Figures

Figure 1

Figure 1
<p>(<b>A</b>) Dioscin-caused apoptosis in HeLa cells by flow cytometric analysis with Annexin V-FITC and PI-staining; (<b>B</b>) Dioscin-caused apoptosis in SiHa cells by flow cytometric analysis with Annexin V-FITC and PI-staining. Data are presented as mean ± SD (<span class="html-italic">n</span> = 3). * <span class="html-italic">p</span> &lt; 0.05 and ** <span class="html-italic">p</span> &lt; 0.01 compared with control group.</p>
Full article ">
30 pages, 6408 KiB  
Article
Potential of Thai Herbal Extracts on Lung Cancer Treatment by Inducing Apoptosis and Synergizing Chemotherapy
by Juthathip Poofery, Patompong Khaw-on, Subhawat Subhawa, Bungorn Sripanidkulchai, Apichat Tantraworasin, Somcharoen Saeteng, Sopon Siwachat, Nirush Lertprasertsuke and Ratana Banjerdpongchai
Molecules 2020, 25(1), 231; https://doi.org/10.3390/molecules25010231 - 6 Jan 2020
Cited by 28 | Viewed by 8980
Abstract
The incidence of lung cancer has increased while the mortality rate has continued to remain high. Effective treatment of this disease is the key to survival. Therefore, this study is a necessity in continuing research into new effective treatments. In this study we [...] Read more.
The incidence of lung cancer has increased while the mortality rate has continued to remain high. Effective treatment of this disease is the key to survival. Therefore, this study is a necessity in continuing research into new effective treatments. In this study we determined the effects of three different Thai herbs on lung cancer. Bridelia ovata, Croton oblongifolius, and Erythrophleum succirubrum were extracted by ethyl acetate and 50% ethanol. The cytotoxicity was tested with A549 lung cancer cell line. We found four effective extracts that exhibited toxic effects on A549 cells. These extracts included ethyl acetate extracts of B. ovata (BEA), C. oblongifolius (CEA), and E. succirubrum (EEA), and an ethanolic extract of E. succirubrum (EE). Moreover, these effective extracts were tested in combination with chemotherapeutic drugs. An effective synergism of these treatments was found specifically through a combination of BEA with methotrexate, EE with methotrexate, and EE with etoposide. Apoptotic cell death was induced in A549 cells by these effective extracts via the mitochondria-mediated pathway. Additionally, we established primary lung cancer and normal epithelial cells from lung tissue of lung cancer patients. The cytotoxicity results showed that EE had significant potential to be used for lung cancer treatment. In conclusion, the four effective extracts possessed anticancer effects on lung cancer. The most effective extract was found to be E. succirubrum (EE). Full article
(This article belongs to the Special Issue Cytotoxic Activity of Plant Extracts)
Show Figures

Graphical abstract

Graphical abstract
Full article ">Figure 1
<p>Cytotoxicity of the herbal extracts against the human lung cancer A549 cell line. Percent cell viability of A549 cells is shown on the <span class="html-italic">Y</span>-axis. The cells were determined after treatment with (<b>A</b>) BEA, (<b>B</b>) CEA, (<b>C</b>) EEA, (<b>D</b>) BE, (<b>E</b>) CE, and (<b>F</b>) EE for 24, 48, and 72 h at indicated concentrations as shown on the <span class="html-italic">X</span>-axis. The data are reported as mean ± SD of three independent experiments and was carried out in triplicate, * <span class="html-italic">p</span> &lt; 0.05, ** <span class="html-italic">p</span> &lt; 0.01, *** <span class="html-italic">p</span> &lt; 0.001, and # <span class="html-italic">p</span> &lt; 0.001 for all incubation times compared to the control condition.</p>
Full article ">Figure 2
<p>Cytotoxic effect of the effective extracts against PBMCs. PBMCs were separated and treated with the effective extracts; (<b>A</b>) BEA, (<b>B</b>) CEA, (<b>C</b>) EEA, and (<b>D</b>) EE for 24, 48, and 72 h at various concentrations on the <span class="html-italic">X</span>-axis. The data are reported as mean ± SD of three independent experiments carried out in triplicate, * <span class="html-italic">p</span> &lt; 0.05, ** <span class="html-italic">p</span> &lt; 0.01, *** <span class="html-italic">p</span> &lt; 0.001 and # <span class="html-italic">p</span> &lt; 0.001 for all incubation times compared to the control condition.</p>
Full article ">Figure 3
<p>GC-MS chromatograms of the bioactive compounds are presented from the effective extracts. The four effective extracts were analyzed using Agilent Technology 7890A GC interfaced with Agilent technology 5975C (EI) MS. Their identification and characterization were based on their elution order in a DB-5MS column. The chemical structures of three major compounds in (<b>A</b>) BEA, (<b>B</b>) CEA, (<b>C</b>) EEA, and (<b>D</b>) EE are presented.</p>
Full article ">Figure 3 Cont.
<p>GC-MS chromatograms of the bioactive compounds are presented from the effective extracts. The four effective extracts were analyzed using Agilent Technology 7890A GC interfaced with Agilent technology 5975C (EI) MS. Their identification and characterization were based on their elution order in a DB-5MS column. The chemical structures of three major compounds in (<b>A</b>) BEA, (<b>B</b>) CEA, (<b>C</b>) EEA, and (<b>D</b>) EE are presented.</p>
Full article ">Figure 4
<p>The synergistic combination of chemotherapy drugs with the effective extracts against A549 cells. (<b>A</b>,<b>C</b>,<b>E</b>) The cytotoxicity plots show the percentage of cell viability of A549 cells on the <span class="html-italic">Y</span>-axis. The cells were treated with MTX or ETS alone, and combination of MTX + BEA, MTX + EE, and ETS + EE. The concentration of MTX, ETS, BEA, and EE were indicated at the <span class="html-italic">X</span>-axis which also showed CI values and their synergy interpretation of each combined concentration. The explanation of the synergy level and symbol are showed in the <a href="#molecules-25-00231-t006" class="html-table">Table 6</a>. The data are reported as mean ± SD of three independent experiments and was carried out in triplicate. (<b>B</b>,<b>D</b>,<b>F</b>) The combination index (CI) plots correspond to the cell viabilities of each combination and were interpreted by CompuSyn software analysis.</p>
Full article ">Figure 5
<p>The effective extracts induced an A549 cell apoptotic feature. Morphology of the A549 cells was determined and quantified after treatment with (<b>A</b>) BEA, (<b>B</b>) CEA, (<b>C</b>) EEA, and (<b>D</b>) EE for 24 h. Apoptotic bodies and condensed nuclei appeared after staining with propidium iodide. White arrows represent apoptotic cells, whereas blue arrows represent non-apoptotic cells. The number of cells with an apoptotic feature was shown in the bar graphs for 200 total cells counting. Significant results were compared with the control (without treatment) and are shown by * <span class="html-italic">p</span> &lt; 0.05, ** <span class="html-italic">p</span> &lt; 0.01.</p>
Full article ">Figure 6
<p>Effective extracts induced A549 cell apoptosis detected by flow cytometry. A549 cells were stained with annexin V-FITC and PI after treatment with the effective extracts for 24 h. Dot plots show annexin V-FITC+/PI− as early apoptotic cells and annexin V-FITC+/PI+ as late apoptotic cells. Early and late apoptotic cells accumulated as a percentage of cell apoptosis in the bar graphs of each extract; (<b>A</b>) BEA, (<b>B</b>) CEA, (<b>C</b>) EEA, and (<b>D</b>) EE. The data were reported as a mean ± SD of three independent experiments carried out in triplicate, * <span class="html-italic">p</span> &lt; 0.05 and ** <span class="html-italic">p</span> &lt; 0.01 compared to the control condition.</p>
Full article ">Figure 7
<p>The effective extracts induced ∆Ψm reduction in A549 cells. Histograms (upper) show the reduced fluorescence intensity of DiOC<sub>6</sub> after treatment with the effective extracts. The percent of the cells with ∆Ψm loss after cells which were treated by (<b>A</b>) BEA, (<b>B</b>) CEA, (<b>C</b>) EEA, and (<b>D</b>) EE are shown on the bar graphs (lower). The data are the mean ± SD of three independent experiments carried out in duplicate, * <span class="html-italic">p</span> &lt; 0.05 and ** <span class="html-italic">p</span> &lt; 0.01 with respect to the control condition.</p>
Full article ">Figure 8
<p>ROS generation in A549 cells after treatment with the effective extracts. The level of intracellular ROS was determined by DCFH-DA fluorescence dye. The increase of fluorescence intensity, which indicates that ROS are generated, is shown on the bar graphs after treatment with (<b>A</b>) BEA, (<b>B</b>) CEA, (<b>C</b>) EEA, and (<b>D</b>) EE for 4 h. H<sub>2</sub>O<sub>2</sub> 0.3% was used as a positive control for ROS production. The data were a mean ± SD of three independent experiments carried out in duplicate, * <span class="html-italic">p</span> &lt; 0.05, ** <span class="html-italic">p</span> &lt; 0.01 with respect to the control condition.</p>
Full article ">Figure 9
<p>The effect of the effective extracts on <span class="html-italic">Noxa</span> mRNA expression level. Quantitative RT-PCR of the mRNA expression of <span class="html-italic">Noxa</span> mRNA was measured by a 7500 Fast Real-time PCR system. A549 cells were treated with (<b>A</b>) BEA, (<b>B</b>) CEA, (<b>C</b>) EEA, and (<b>D</b>) EE at the indicated concentrations. The relative gene expression level was analyzed by 2<sup>−∆∆Ct</sup>, using <span class="html-italic">GAPDH</span> as a housekeeping gene. * <span class="html-italic">p</span> &lt; 0.05, ** <span class="html-italic">p</span> &lt; 0.01, treatment group vs. control un-treatment groups.</p>
Full article ">Figure 10
<p>The effect of the effective extracts on Noxa protein expression level. Representations of Noxa protein bands after A549 cells were treated with (<b>A</b>) BEA, (<b>B</b>) CEA, (<b>C</b>) EEA, and (<b>D</b>) EE at indicated concentrations as shown in different lanes. The density of each band was measured and calculated for the relative protein level using beta-actin as an internal control (bar graphs). * <span class="html-italic">p</span> &lt; 0.05, ** <span class="html-italic">p</span> &lt; 0.01, treatment group vs. control un-treatment groups.</p>
Full article ">
13 pages, 3680 KiB  
Article
Iron-Catalyzed C(sp2)–C(sp3) Cross-Coupling of Aryl Chlorobenzoates with Alkyl Grignard Reagents
by Elwira Bisz and Michal Szostak
Molecules 2020, 25(1), 230; https://doi.org/10.3390/molecules25010230 - 6 Jan 2020
Cited by 14 | Viewed by 6070
Abstract
Aryl benzoates are compounds of high importance in organic synthesis. Herein, we report the iron-catalyzed C(sp2)–C(sp3) Kumada cross-coupling of aryl chlorobenzoates with alkyl Grignard reagents. The method is characterized by the use of environmentally benign and sustainable iron salts [...] Read more.
Aryl benzoates are compounds of high importance in organic synthesis. Herein, we report the iron-catalyzed C(sp2)–C(sp3) Kumada cross-coupling of aryl chlorobenzoates with alkyl Grignard reagents. The method is characterized by the use of environmentally benign and sustainable iron salts for cross-coupling in the catalytic system, employing benign urea ligands in the place of reprotoxic NMP (NMP = N-methyl-2-pyrrolidone). It is notable that high selectivity for the cross-coupling is achieved in the presence of hydrolytically-labile and prone to nucleophilic addition phenolic ester C(acyl)–O bonds. The reaction provides access to alkyl-functionalized aryl benzoates. The examination of various O-coordinating ligands demonstrates the high activity of urea ligands in promoting the cross-coupling versus nucleophilic addition to the ester C(acyl)–O bond. The method showcases the functional group tolerance of iron-catalyzed Kumada cross-couplings. Full article
(This article belongs to the Special Issue Recent Advances in Iron Catalysis)
Show Figures

Graphical abstract

Graphical abstract
Full article ">Figure 1
<p>Structures of ligands used.</p>
Full article ">Scheme 1
<p>Iron-catalyzed C(sp<sup>2</sup>)–C(sp<sup>3</sup>) cross-coupling of aryl chlorobenzoates with alkyl Grignard reagents (this study).</p>
Full article ">Scheme 2
<p>The important transformations via substituted aryl esters, the products of this study.</p>
Full article ">Scheme 3
<p>Competition experiments. (<b>A</b>) Competition experiments between phenyl and methyl ester (OPh:OMe = 2.5:1.0) revealed that aryl esters are more reactive than their alkyl counterparts, which is consistent with the facility of oxidative addition. (<b>B</b>) Similarly, competition between electron-rich and electron-deficient aryl esters (4-MeO:4-F = 1.0:1.25) revealed that electron-deficient arenes are more reactive</p>
Full article ">
21 pages, 4028 KiB  
Article
Biocompatible Organic Coatings Based on Bisphosphonic Acid RGD-Derivatives for PEO-Modified Titanium Implants
by Lyudmila V. Parfenova, Elena S. Lukina, Zulfia R. Galimshina, Guzel U. Gil’fanova, Veta R. Mukaeva, Ruzil G. Farrakhov, Ksenia V. Danilko, Grigory S. Dyakonov and Evgeny V. Parfenov
Molecules 2020, 25(1), 229; https://doi.org/10.3390/molecules25010229 - 6 Jan 2020
Cited by 20 | Viewed by 4697
Abstract
Currently, significant attention is attracted to the problem of the development of the specific architecture and composition of the surface layer in order to control the biocompatibility of implants made of titanium and its alloys. The titanium surface properties can be tuned both [...] Read more.
Currently, significant attention is attracted to the problem of the development of the specific architecture and composition of the surface layer in order to control the biocompatibility of implants made of titanium and its alloys. The titanium surface properties can be tuned both by creating an inorganic sublayer with the desired morphology and by organic top coating contributing to bioactivity. In this work, we developed a composite biologically active coatings based on hybrid molecules obtained by chemical cross-linking of amino acid bisphosphonates with a linear tripeptide RGD, in combination with inorganic porous sublayer created on titanium by plasma electrolytic oxidation (PEO). After the addition of organic molecules, the PEO coated surface gets nobler, but corrosion currents increase. In vitro studies on proliferation and viability of fibroblasts, mesenchymal stem cells and osteoblast-like cells showed the significant dependence of the molecule bioactivity on the structure of bisphosphonate anchor and the linker. Several RGD-modified bisphosphonates of β-alanine, γ-aminobutyric and ε-aminocaproic acids with BMPS or SMCC linkers can be recommended as promising candidates for further in vivo research. Full article
(This article belongs to the Section Materials Chemistry)
Show Figures

Figure 1

Figure 1
<p>SEM images of the PEO coating: (<b>a</b>) Top view; (<b>b</b>) Cross-section.</p>
Full article ">Figure 2
<p>XRD pattern of the PEO coating with the labeled peaks and SemiQuant results.</p>
Full article ">Figure 3
<p>Survey XPS spectra of the Ti-PEO coating.</p>
Full article ">Figure 4
<p>Polarization curves in Ringer’s solution for the Ti samples, with PEO coating, and RGD modification.</p>
Full article ">Figure 5
<p>Electrochemical properties in Ringer’s solution for the Ti samples, with PEO coating, and RGD modification: (<b>a</b>) Corrosion potential E<sub>corr</sub>; (<b>b</b>) Corrosion current i<sub>corr</sub>; (<b>c</b>) Polarization resistance R<sub>p</sub>.</p>
Full article ">Figure 5 Cont.
<p>Electrochemical properties in Ringer’s solution for the Ti samples, with PEO coating, and RGD modification: (<b>a</b>) Corrosion potential E<sub>corr</sub>; (<b>b</b>) Corrosion current i<sub>corr</sub>; (<b>c</b>) Polarization resistance R<sub>p</sub>.</p>
Full article ">Figure 6
<p>Optical density showing viability and proliferation of fibroblasts (FLECH-104), human osteoblast-like cells (MG-63) and mesenchymal stem cells (MSC) cultured on the surface of Ti-PEO functionalized by RGD-derivatives (<b>15</b>–<b>22</b>) after 7 days (metal samples were kept for 1 h at room temperature in the solutions of compounds <b>15</b>–<b>22</b> with concentrations 1.3 × 10<sup>−3</sup>–1.8 × 10<sup>−3</sup> M/L and then dried).</p>
Full article ">Scheme 1
<p>Reagents and conditions: (<b>a</b>) MeSO<sub>3</sub>H, 4–5 h, 85–90 °C; (<b>b</b>) DMF, 3–16 h, 0→25 °C; (<b>c</b>) H<sub>2</sub>O: acetone = 1:1, pH = 8–9, 1 h, 38–40 °C; (<b>d</b>) H<sub>2</sub>O, pH = 7, 1–1.5 h, 38–40 °C.</p>
Full article ">
15 pages, 4170 KiB  
Article
Pterostilbene Suppresses both Cancer Cells and Cancer Stem-Like Cells in Cervical Cancer with Superior Bioavailability to Resveratrol
by Hee Jeong Shin, Jang Mi Han, Ye Seul Choi and Hye Jin Jung
Molecules 2020, 25(1), 228; https://doi.org/10.3390/molecules25010228 - 6 Jan 2020
Cited by 53 | Viewed by 5978
Abstract
Increasing studies have reported that cancer stem cells (CSCs) play critical roles in therapeutic resistance, recurrence, and metastasis of tumors, including cervical cancer. Pterostilbene, a dimethylated derivative of resveratrol, is a plant polyphenol compound with potential chemopreventive activity. However, the therapeutic effect of [...] Read more.
Increasing studies have reported that cancer stem cells (CSCs) play critical roles in therapeutic resistance, recurrence, and metastasis of tumors, including cervical cancer. Pterostilbene, a dimethylated derivative of resveratrol, is a plant polyphenol compound with potential chemopreventive activity. However, the therapeutic effect of pterostilbene against cervical CSCs remains unclear. In this study, we compared the anticancer effects of resveratrol and pterostilbene using both HeLa cervical cancer adherent and stem-like cells. Pterostilbene more effectively inhibited the growth and clonogenic survival, as well as metastatic ability of HeLa adherent cells than those of resveratrol. Moreover, the superior inhibitory effects of pterostilbene compared to resveratrol were associated with the enhanced activation of multiple mechanisms, including cell cycle arrest at S and G2/M phases, induction of ROS-mediated caspase-dependent apoptosis, and inhibition of matrix metalloproteinase (MMP)-2/-9 expression. Notably, pterostilbene exhibited a greater inhibitory effect on the tumorsphere-forming and migration abilities of HeLa cancer stem-like cells compared to resveratrol. This greater effect was achieved through more potent inhibition of the expression levels of stemness markers, such as CD133, Oct4, Sox2, and Nanog, as well as signal transducer and activator of transcription 3 signaling. These results suggest that pterostilbene might be a potential anticancer agent targeting both cancer cells and cancer stem-like cells of cervical cancer via the superior bioavailability to resveratrol. Full article
(This article belongs to the Special Issue Antitumor and Anti-HIV Agents from Natural Products)
Show Figures

Figure 1

Figure 1
<p>Chemical structures of resveratrol and pterostilbene.</p>
Full article ">Figure 2
<p>Growth inhibitory effects of resveratrol and pterostilbene on HeLa, CaSki, and SiHa cells. (<b>A</b>) The effects of resveratrol and pterostilbene on the growth of HeLa, CaSki, and SiHa adherent cells. The cells were treated with increasing concentrations of the two compounds (0–200 μM) for 72 h, and cell growth was measured by 3-(4,5-dimethylthiazol-2-yl)-2,5-diphenyltetrazolium bromide (MTT) assay. (<b>B</b>) The effects of resveratrol and pterostilbene on the colony forming ability of HeLa, CaSki, and SiHa adherent cells. The cells were incubated in the absence or presence of the two compounds (10 and 20 μM) for seven days. The cell colonies were detected by crystal violet staining. * <span class="html-italic">p</span> &lt; 0.05 versus the control.</p>
Full article ">Figure 3
<p>Effects of resveratrol and pterostilbene on the metastatic ability of HeLa cells. (<b>A</b>) The effects of resveratrol and pterostilbene on the migration of HeLa adherent cells. The migratory potential of HeLa cells was analyzed using a wound healing assay. The cells were incubated in the absence or presence of the two compounds (20 μM) for 48 h. The cells that migrated into the gap were counted using an optical microscope. Dotted white lines indicate the edge of the gap at 0 h. (<b>B</b>) The effects of resveratrol and pterostilbene on the invasion of HeLa adherent cells. The invasiveness of HeLa cells was analyzed using Matrigel-coated polycarbonate filters. The cells were incubated in the absence or presence of the two compounds (10 and 20 μM) for 48 h. The cells penetrating the filters were stained and counted using an optical microscope. * <span class="html-italic">p</span> &lt; 0.05 versus the control.</p>
Full article ">Figure 4
<p>Effects of resveratrol and pterostilbene on the cell cycle and apoptotic cell death of HeLa cells. (<b>A</b>) The cell cycle distribution of HeLa adherent cells was evaluated by flow cytometry after the treatment of the two compounds (40 μM) for 48 h. (<b>B</b>) HeLa adherent cells were treated with resveratrol and pterostilbene (40 μM) for 48 h. Apoptotic cells were determined by flow cytometry analysis following annexin V-FITC and propidium iodide (PI) dual labeling.</p>
Full article ">Figure 5
<p>Identification of molecular mechanisms underlying the growth and migration inhibitory effects of resveratrol and pterostilbene in HeLa cells. (<b>A</b>) The effects of resveratrol and pterostilbene on reactive oxygen species (ROS) generation in HeLa adherent cells. The cells were treated with resveratrol and pterostilbene (20 and 40 μM) for 48 h. Intracellular ROS levels were detected with 2′,7′-dichlorofluorescein diacetate (DCFH-DA). (<b>B</b>) The effects of resveratrol and pterostilbene on the expression of cleaved caspase-3, cleaved caspase-9, Bcl-2, Bcl-XL, p21, p53, cyclin E1, cyclin B1, MMP-2, and MMP-9 in HeLa adherent cells. The cells were treated with the two compounds (20 and 40 μM) for 48 h, and the protein levels were detected by Western blot analysis using specific antibodies. The levels of β-actin were used as an internal control. Arrowheads indicate true bands for the molecular markers. * <span class="html-italic">p</span> &lt; 0.05 versus the control.</p>
Full article ">Figure 6
<p>Effects of resveratrol and pterostilbene on the tumorsphere-forming ability and migration of cervical cancer stem cells (CSCs). (<b>A</b>) HeLa cancer stem-like cells were treated with the two compounds (10 and 20 μM) and incubated with the CSC culture media for eight days. The number of formed tumorspheres in each well was counted under a microscope. (<b>B</b>) HeLa cancer stem-like cells were seeded into laminin-coated culture plate and incubated with the CSC culture media in the absence or presence of resveratrol and pterostilbene (10 and 20 μM) for 24 h. The cells that migrated into the gap were counted under an optical microscope. White lines indicate the edge of the gap at 0 h. * <span class="html-italic">p</span> &lt; 0.05 versus the control.</p>
Full article ">Figure 7
<p>Effects of resveratrol and pterostilbene on the cell cycle and apoptotic cell death of cervical CSCs. (<b>A</b>) The cell cycle progression and (<b>B</b>) cellular apoptosis of HeLa cancer stem-like cells were measured by flow cytometry analysis after the treatment of resveratrol and pterostilbene (40 μM) for 48 h.</p>
Full article ">Figure 8
<p>Effects of resveratrol and pterostilbene on stemness markers and signal transducer and activator of transcription 3 (STAT3) signaling in cervical CSCs. (<b>A</b>,<b>B</b>) HeLa cancer stem-like cells were treated with resveratrol and pterostilbene (10 and 20 μM) for 48 h, and the protein levels were detected by Western blot analysis using specific antibodies. The levels of β-actin were used as an internal control. Arrowheads indicate true bands for the molecular markers. * <span class="html-italic">p</span> &lt; 0.05 versus the control.</p>
Full article ">
9 pages, 3201 KiB  
Article
Screening of Nanocellulose from Different Biomass Resources and Its Integration for Hydrophobic Transparent Nanopaper
by Yanran Qi, Hao Zhang, Dandan Xu, Zaixin He, Xiya Pan, Shihan Gui, Xiaohan Dai, Jilong Fan, Xiaoying Dong and Yongfeng Li
Molecules 2020, 25(1), 227; https://doi.org/10.3390/molecules25010227 - 6 Jan 2020
Cited by 23 | Viewed by 4715
Abstract
Petroleum-based plastics, such as PP, PE, PVC, etc., have become an important source of environmental pollution due to their hard degradation, posing a serious threat to the human health. Isolating nanocellulose from abundant biomass waste resources and further integrating the nanocellulose into hydrophobic [...] Read more.
Petroleum-based plastics, such as PP, PE, PVC, etc., have become an important source of environmental pollution due to their hard degradation, posing a serious threat to the human health. Isolating nanocellulose from abundant biomass waste resources and further integrating the nanocellulose into hydrophobic transparent film (i.e., nanopaper), to replace the traditional nondegradable plastic film, is of great significance for solving the problem of environmental pollution and achieving sustainable development of society. This study respectively extracted nanocellulose from the branches of Amorpha fruticosa Linn., wheat straw, and poplar residues via combined mechanical treatments of grinding and high-pressure homogenization. Among them, the nanocellulose derived from the Amorpha fruticosa has a finer structure, with diameter of about 10 nm and an aspect ratio of more than 500. With the nanocellulose as building block, we constructed hydrophilic nanopaper with high light transmittance (up to 90%) and high mechanical strength (tensile strength up to 110 MPa). After further hybridization by incorporating nano-silica into the nanopaper, followed by hydrophobic treatment, we built hydrophobic nanopaper with transmittance over 82% and a water contact angle of about 102° that could potentially replace transparent plastic film and has wide applications in food packaging, agricultural film, electronic device, and other fields. Full article
(This article belongs to the Special Issue Emerging Trends in Nanocelluloses)
Show Figures

Graphical abstract

Graphical abstract
Full article ">Figure 1
<p>Schematic illustration of nanocellulose derived from biomass resources (<b>a</b>), and its integration for hydrophobic transparent nanopaper (<b>b</b>).</p>
Full article ">Figure 2
<p>Morphology of nanocellulose derived from three different biomass resources: (<b>a–d</b>) from the shrub branch: (<b>a</b>) SEM morphology, (<b>b</b>) TEM image, (<b>c</b>) AFM image, and (<b>d</b>) the diameter distribution of the fibers from the AFM image; (<b>e</b>–<b>h</b>) from wheat straw: (<b>e</b>) SEM morphology, (<b>f</b>) TEM image, (<b>g</b>) AFM image, and (<b>h</b>) the diameter distribution of the fibers from the AFM image; (<b>i</b>–<b>l</b>) from poplar residue: (<b>i</b>) SEM morphology, (<b>j</b>) TEM image, (<b>k</b>) AFM image, and (<b>l</b>) the diameter distribution of the fibers from the AFM image.</p>
Full article ">Figure 3
<p>The transparent nanopaper: (<b>a</b>) digital photo of the nanopaper; (<b>b</b>) the transmittance and haze of the nanopaper; (<b>c</b>) the XRD patterns of the natural wood and nanocellulose; (<b>d</b>) the tensile stress of the nanopaper (tested three samples).</p>
Full article ">Figure 4
<p>Characterization of the hydrophobic nanopaper: (<b>a</b>) the suspending liquid of nanocellulose (i), nano-SiO<sub>2</sub> (ii), and the mixed nanocellulose-SiO<sub>2</sub> (iii); (<b>b</b>) the SEM morphology of the nano-SiO<sub>2</sub> dispersed on nanocellulose matrix; (<b>c</b>) the facial SEM morphology of the pure nanopaper; (<b>d</b>) the cross-sectional SEM morphology of the pure nanopaper; (<b>e</b>) the facial SEM morphology of the hybrid nanopaper; (<b>f</b>) the cross-sectional SEM morphology of the hybrid nanopaper; (<b>g</b>) the transparency and haze of the hydrophobic nanopaper; (<b>h</b>) FTIR spectra of the pure nanopaper and the hybrid hydrophobic nanopaper; (<b>i</b>) digital photo of water droplets on surfaces of the hydrophilic and hydrophobic nanopapers.</p>
Full article ">
13 pages, 3041 KiB  
Article
Chitosan-Based Bio-Composite Modified with Thiocarbamate Moiety for Decontamination of Cations from the Aqueous Media
by Nisar Ali, Adnan Khan, Muhammad Bilal, Sumeet Malik, Syed Badshah and Hafiz M. N. Iqbal
Molecules 2020, 25(1), 226; https://doi.org/10.3390/molecules25010226 - 6 Jan 2020
Cited by 72 | Viewed by 3784
Abstract
Herein, we report the development of chitosan (CH)-based bio-composite modified with acrylonitrile (AN) in the presence of carbon disulfide. The current work aimed to increase the Lewis basic centers on the polymeric backbone using single-step three-components (chitosan, carbon disulfide, and acrylonitrile) reaction. For [...] Read more.
Herein, we report the development of chitosan (CH)-based bio-composite modified with acrylonitrile (AN) in the presence of carbon disulfide. The current work aimed to increase the Lewis basic centers on the polymeric backbone using single-step three-components (chitosan, carbon disulfide, and acrylonitrile) reaction. For a said purpose, the thiocarbamate moiety was attached to the pendant functional amine (NH2) of chitosan. Both the pristine CH and modified CH-AN bio-composites were first characterized using numerous analytical and imaging techniques, including 13C-NMR (solid-form), Fourier-transform infrared spectroscopy (FTIR), elemental investigation, thermogravimetric analysis, and scanning electron microscopy (SEM). Finally, the modified bio-composite (CH-AN) was deployed for the decontamination of cations from the aqueous media. The sorption ability of the CH-AN bio-composite was evaluated by applying it to lead and copper-containing aqueous solution. The chitosan-based CH-AN bio-composite exhibited greater sorption capacity for lead (2.54 mmol g−1) and copper (2.02 mmol g−1) than precursor chitosan from aqueous solution based on Langmuir sorption isotherm. The experimental findings fitted better to Langmuir model than Temkin and Freundlich isotherms using linear regression method. Different linearization of Langmuir model showed different error functions and isothermal parameters. The nonlinear regression analysis showed lower values of error functions as compared with linear regression analysis. The chitosan with thiocarbamate group is an outstanding material for the decontamination of toxic elements from the aqueous environment. Full article
(This article belongs to the Special Issue Biocomposites – A Path Towards Circular Economy)
Show Figures

Graphical abstract

Graphical abstract
Full article ">Figure 1
<p>Infrared spectra of CH-based bio-composites, that is, pristine CH bio-composite (red line) and chemically modified CH-AN bio-composite (black line), along with zoomed area showing modification.</p>
Full article ">Figure 2
<p>Carbon NMR spectra in solid state of CH-based bio-composites, that is, pristine CH bio-composite (red line) and chemically modified CH-AN bio-composite (blue line).</p>
Full article ">Figure 3
<p>Thermogravcimetric (red line) and derivative curves (blue line) for pristine CH biopolymer. Thermogravcimetric and derivative curves for pristine CH biopolymer.</p>
Full article ">Figure 4
<p>Thermogravcimetric (red line) and derivative curves (blue line) for chemically modified CH-AN bio-composite.</p>
Full article ">Figure 5
<p>SEM images of CH-based bio-composites, that is, pristine CH bio-composite (<b>a</b>) and chemically modified CH-AN bio-composite (<b>b</b>).</p>
Full article ">Figure 6
<p>The proposed reaction mechanism for chitosan modification using acrylonitrile (AN) in the presence of carbon disulfide. Triethylamine was additionally supplemented to the suspension as a catalyst.</p>
Full article ">
21 pages, 2987 KiB  
Article
The Link between Polyphenol Structure, Antioxidant Capacity and Shelf-Life Stability in the Presence of Fructose and Ascorbic Acid
by Inbal Hanuka Katz, Eden Eran Nagar, Zoya Okun and Avi Shpigelman
Molecules 2020, 25(1), 225; https://doi.org/10.3390/molecules25010225 - 6 Jan 2020
Cited by 33 | Viewed by 6292
Abstract
Polyphenols play an important role in the sensorial and health-promoting properties of fruits and vegetables and display varying structure-dependent stability during processing and shelf-life. The current work aimed to increase the fundamental understanding of the link between the stability of polyphenols as a [...] Read more.
Polyphenols play an important role in the sensorial and health-promoting properties of fruits and vegetables and display varying structure-dependent stability during processing and shelf-life. The current work aimed to increase the fundamental understanding of the link between the stability of polyphenols as a function of their structure, presence of ascorbic acid and fructose and total antioxidant capacity (TAC), using a multi-component model system. Polyphenol extract, used as the multi-component model system, was obtained from freeze-dried, high polyphenol content strawberry (Fragaria × ananassa ‘Nerina’) and twenty-one compounds were identified using high-performance liquid chromatography-mass spectrometry (HPLC-MS). The TAC and the first-order degradation kinetics were obtained, linking the polyphenol stability to its chemical structure, with and without the presence of fructose and ascorbic acid. The TAC (measured by oxygen radical absorption capacity (ORAC) and ferric reducing antioxidant potential (FRAP) assays) was not dramatically affected by storage temperatures and formulation, while polyphenol stability was significantly and structure dependently affected by temperature and the presence of ascorbic acid and fructose. Anthocyanins and phenolic acids were more unstable in the presence of ascorbic acid, while flavonol stability was enhanced by its presence. Shelf life study performed at 37 °C revealed significantly higher stability of purified polyphenols vs. the stability of the same polyphenols in the strawberry extract (multi-component system). Full article
Show Figures

Figure 1

Figure 1
<p>UV-Vis elution profile of the strawberry (<span class="html-italic">Fragaria × ananassa</span> ‘Nerina’) polyphenolic extract by HPLC in 3 wavelengths (<b>A</b>—280 nm, <b>B</b>—360 nm and <b>C</b>—520 nm).</p>
Full article ">Figure 2
<p>Relative TAC of strawberry polyphenols during shelf-life experiment at 4 °C, 25 °C and 37 °C, in a citric buffer (pH = 3, 50 mM), by (<b>A</b>) ORAC and (<b>B</b>) FRAP methods (presented as percentages). * Error bars represent standard error (n = 2), in (<b>B</b>) the line represents a fit to first-order kinetics. * Small letters by the regression line represent significant differences (<span class="html-italic">p</span> &lt; 0.05) as a function of temperature.</p>
Full article ">Figure 3
<p>Relative concentration (quantified by HPLC at 520 nm) of the anthocyanins in the extract during shelf-life at different temperatures (4 °C, 25 °C and 37 °C, citric buffer pH = 3, 50 mM) (<b>A</b>) Cyanidin-3-<span class="html-italic">O</span>-glucoside, (<b>B</b>) Plargonidin-3-<span class="html-italic">O</span>-rutinoside, (<b>C</b>) Pelargonidin-3-<span class="html-italic">O</span>-malonylglucoside, (<b>D</b>) Pelargonidin-3-<span class="html-italic">O</span>-glucoside, (<b>E</b>) 5-Pyranopelargonidin-3-<span class="html-italic">O</span>-glucoside. * Error bars represent standard error (n = 2), the lines represent a fit to first-order kinetics. * Small letters near the regression line represent significant differences (<span class="html-italic">p</span> &lt; 0.05), according to the colors in the legend.</p>
Full article ">Figure 4
<p>Relative TAC of strawberry polyphenols during shelf-life experiment at 37 °C, in citric buffer pH = 3, 50 mM and different formulations: Str—strawberry, Fru—fructose (10%) and AA—ascorbic acid (0.022%). Measured using ORAC (<b>A</b>) and FRAP (<b>B</b>) methods. * Error bars represent standard error (n = 2), in (<b>B</b>) the line represents a fit to first-order kinetics.</p>
Full article ">Figure 5
<p>Relative concentration of polyphenols in the extract during shelf-life at 37 °C (citric buffer pH = 3, 50 mM) as function of the presence of ascorbic acid (AA, 0.022%) and fructose (Fru, 10%) (<b>A</b>) pelargonidin-3-<span class="html-italic">O</span>-glucoside, (<b>B</b>) kaempferol-3-<span class="html-italic">O</span>-malonylglucoside, (<b>C</b>) ferulic acid hexose derivative, (<b>D</b>) procyanidin B. * Error bars represent standard error (n = 2). * Small letters near the regression line represent significant differences (<span class="html-italic">p</span> &lt; 0.05), according to the colors in the legend.</p>
Full article ">Figure 6
<p>Principal component analysis (PCA) of degradation rate constants during shelf-life experiment at 37 °C of polyphenols and the TAC, in citric buffer pH = 3, 50 mM with different formulations: Str—strawberry, Fru—fructose and AA—ascorbic acid. Polyphenols were quantified using HPLC-MS and TAC was measured using FRAP. Degradation rates were calculated assuming first-rate order. * <span class="html-italic">p</span>-Coumaroyl hexoside and procyanidin B are overlapping in the PCA.</p>
Full article ">
15 pages, 2778 KiB  
Article
Chelerythrine Chloride Downregulates β-Catenin and Inhibits Stem Cell Properties of Non-Small Cell Lung Carcinoma
by Win Sen Heng and Shiau-Chuen Cheah
Molecules 2020, 25(1), 224; https://doi.org/10.3390/molecules25010224 - 6 Jan 2020
Cited by 33 | Viewed by 4319
Abstract
Plant secondary metabolites have been seen as alternatives to seeking new medicines for treating various diseases. Phytochemical scientists remain hopeful that compounds isolated from natural sources could help alleviate the leading problem in oncology—the lung malignancy that kills an estimated two million people [...] Read more.
Plant secondary metabolites have been seen as alternatives to seeking new medicines for treating various diseases. Phytochemical scientists remain hopeful that compounds isolated from natural sources could help alleviate the leading problem in oncology—the lung malignancy that kills an estimated two million people annually. In the present study, we characterized a medicinal compound benzophenanthridine alkaloid, called chelerythrine chloride for its anti-tumorigenic activities. Cell viability assays confirmed its cytotoxicity and anti-proliferative activity in non-small cell lung carcinoma (NSCLC) cell lines. Immunofluorescence staining of β-catenin revealed that there was a reduction of nuclear content as well as overall cellular content of β-catenin after treating NCI-H1703 with chelerythrine chloride. In functional characterizations, we observed favorable inhibitory activities of chelerythrine chloride in cancer stem cell (CSC) properties, which include soft agar colony-forming, migration, invasion, and spheroid forming abilities. Interesting observations in chelerythrine chloride treatment noted that its action abides to certain concentration-specific-targeting behavior in modulating β-catenin expression and apoptotic cell death. The downregulation of β-catenin implicates the downregulation of CSC transcription factors like SOX2 and MYC. In conclusion, chelerythrine chloride has the potential to mitigate cancer growth due to inhibitory actions toward the tumorigenic activity of CSC in lung cancer and it can be flexibly adjusted according to concentration to modulate specific targeting in different cell lines. Full article
(This article belongs to the Special Issue Cytotoxic Activity of Plant Extracts)
Show Figures

Figure 1

Figure 1
<p>Dose–response curves of chelerythrine chloride treatments in NCI-H1703, SK-LU-1, and human lung cancer stem cells (HLCSC). Representative dose–response curves show the kinetic response of (<b>A</b>) NCI-H1703, (<b>B</b>) SK-LU-1, and (<b>C</b>) HLCSC toward chelerythrine chloride in a span of 72 h treatments. Curves show dose–response of NCI-H1703, SK-LU-1, and HLCSC toward chelerythrine chloride after (<b>D</b>) 24, (<b>E</b>) 48, and (<b>F</b>) 72 h treatment. Dose–response kinetic curves in (<b>A</b>–<b>C</b>) were plotted from duplicate data obtained in a representative of two independent experiments. Dose–response curves in (<b>D</b>–<b>F</b>) were derived from means of CI at specified time-points from two independent experiments.</p>
Full article ">Figure 2
<p>Molecular implications of chelerythrine chloride treatment in lung cancer cell lines. NCI-H1703, SK-LU-1, and HLCSC were treated with GSK3i for 24 h and sequentially treated with various concentrations of chelerythrine chloride for 24 h. Subsequently, immunofluorescence stainings of β-catenin were compared among the cell lines. (<b>A</b>) Representative micrographs show immunofluorescence stainings for chelerythrine chloride treatment in NCI-H1703. (<b>B</b>) Representative micrographs show immunofluorescence stainings for chelerythrine chloride treatment in SK-LU-1. (<b>C</b>) Representative micrographs show immunofluorescence stainings for chelerythrine chloride treatment in HLCSC. Scale bars represent 100 μm. (<b>D</b>) Representative quantification shows cell number with positive nuclear β-catenin in an independent immunostaining experiment. Error bars are expressed as mean ± SD. Most responsive chelerythrine chloride-treated cell lines—NCI-H1703′s—protein lysates were resolved using Western blotting. (<b>E</b>) Representative Western blots show the effect of chelerythrine chloride treatment toward the expression of CSC-related transcription factors, namely β-catenin, MYC, and SOX2. Statistical significance was expressed as *** <span class="html-italic">p</span> &lt; 0.001.</p>
Full article ">Figure 3
<p>Chelerythrine chloride induces apoptosis and inhibits CSC functions. (<b>A</b>) Parallel estimations of cell viability, cytotoxicity and apoptosis were performed after 24 h treatment of chelerythrine chloride in NCI-H1703 at indicated concentrations using ApoTox-Glo triplex assay. (<b>B</b>) Representative micrographs show three weeks grown soft agar colonies of NCI-H1703 upon treatment of chelerythrine chloride at indicated concentrations. Scale bars represent 1000 μm. (<b>C</b>) Representative micrographs show spheroids’ morphological characteristics after 24 h treatment of chelerythrine chloride at indicated concentrations. Scale bars represent 200 μm. (<b>D</b>) Dose–response bar graph show comparison of cytotoxicity of various concentration of chelerythrine chloride between monolayer and spheroid models of NCI-H1703. (<b>E</b>) Estimations of migration and invasion of NCI-H1703 after 16 h of chelerythrine chloride treatment at indicated concentrations using real-time cell analyzer (RTCA). (<b>F</b>) Effect of corresponding treatment concentrations in (<b>E</b>) to cell viability is shown in bar graph. All data were obtained from mean of three independent experiments. Error bars are expressed as mean ± SD. Statistical significance was expressed as *** <span class="html-italic">p</span> &lt; 0.001 ** <span class="html-italic">p</span> &lt; 0.01; * <span class="html-italic">p</span> &lt; 0.05.</p>
Full article ">
19 pages, 24009 KiB  
Article
Hierarchical Structure of the Cocos nucifera (Coconut) Endocarp: Functional Morphology and its Influence on Fracture Toughness
by Stefanie Schmier, Naoe Hosoda and Thomas Speck
Molecules 2020, 25(1), 223; https://doi.org/10.3390/molecules25010223 - 6 Jan 2020
Cited by 30 | Viewed by 8840
Abstract
In recent years, the biomimetic potential of lignified or partially lignified fruit pericarps has moved into focus. For the transfer of functional principles into biomimetic applications, a profound understanding of the structural composition of the role models is important. The aim of this [...] Read more.
In recent years, the biomimetic potential of lignified or partially lignified fruit pericarps has moved into focus. For the transfer of functional principles into biomimetic applications, a profound understanding of the structural composition of the role models is important. The aim of this study was to qualitatively analyze and visualize the functional morphology of the coconut endocarp on several hierarchical levels, and to use these findings for a more precise evaluation of the toughening mechanisms in the endocarp. Eight hierarchical levels of the ripe coconut fruit were identified using different imaging techniques, including light and scanning electron microscopy as well as micro-computer-tomography. These range from the organ level of the fruit (H0) to the molecular composition (H7) of the endocarp components. A special focus was laid on the hierarchical levels of the endocarp (H3–H6). This investigation confirmed that all hierarchical levels influence the crack development in different ways and thus contribute to the pronounced fracture toughness of the coconut endocarp. By providing relevant morphological parameters at each hierarchical level with the associated toughening mechanisms, this lays the basis for transferring those properties into biomimetic technical applications. Full article
(This article belongs to the Special Issue Biological and Bio-inspired Materials)
Show Figures

Figure 1

Figure 1
<p>Hierarchical levels of the coconut fruit with illustrations of the important parameters of each level. (<b>A</b>) Photograph of an entire fruit cut in half in a longitudinal direction. (<b>B</b>) Computer tomography (CT)-reconstruction of an endocarp sample (scan resolution: 42 µm). (<b>C</b>) Light microscopy (LM) image of a polished thin section of the endocarp showing the cross section of a vascular bundle in the sclereid cell matrix. (<b>D</b>) SEM micrograph of a fractured endocarp surface showing details of the sclereid cell matrix. <a href="#molecules-25-00223-t001" class="html-table">Table 1</a> provides the corresponding morphological parameters. H0–H7: Eight hierarchical levels; cl: Cell lumen, cw: Cell wall, cwl: Cell wall layers, en: Endocarp, ex: Exocarp, me: Mesocarp, p: Pits, s: Seed, sc: Sclereids, scm: Sclereid matrix, t: Tracheids, vb: Vascular bundles.</p>
Full article ">Figure 2
<p>µCT reconstructions of a coconut fruit scanned at two resolutions: 150 µm (<b>A</b>–<b>C</b>) and 42 µm (<b>D</b>–<b>F</b>). Side view of the coconut endocarp showing the outer surface (<b>A</b>) and the course of the vascular bundles (<b>B</b>). Top view of the endocarp with highlighted vascular bundles (<b>C</b>). Top view of a smaller endocarp volume scanned at higher resolution showing the outer surface (<b>D</b>) and the course of the vascular bundles (<b>E</b>). The higher magnification also reveals smaller vascular bundles, which span a strongly branched network between the larger vascular bundles. In the enlarged side view of the smaller endocarp volume, the vascular bundles are observed running almost parallel to the outer surface of the endocarp (<b>F</b>). Images (<b>B</b>,<b>C</b>) are kindly provided by the Shimadzu Corporation.</p>
Full article ">Figure 3
<p>LM images from the coconut endocarp showing tracheids. In the cross section of a vascular bundle ((<b>A</b>), polished thin section), the polygonal shape of tracheid cross-sections is visible (<b>B</b>). Macerated endocarp cells stained with Toluidin blue, showing an intact tracheid cell (⟶) with a length of 627 µm between accumulated sclereid cells (<b>C</b>).</p>
Full article ">Figure 4
<p>LM images from the coconut endocarp showing sclereids. The cross section of a polished thin section shows a longitudinally cut vascular bundle within the brown tissue of the sclereid cells (<b>A</b>). Higher magnifications of the sclereid cell matrix reveal larger cells near the mesocarp side (<b>B</b>) than near the testa (<b>C</b>). Very long sclereids, the sclerenchyma fibers, are located in parallel to the vascular bundles (<b>D</b>). Macerated endocarp cells stained with Toluidin blue, showing sclereid cells with various shapes (<b>E</b>).</p>
Full article ">Figure 5
<p>Comparison of the width-to-length ratio of the sclereid cells along the endocarp cross section. It was observed that the width-to-length ratio decreased significantly from the mesocarp side to the testa side (one-way analysis of variance, F (2177) = 68.91, <span class="html-italic">p</span> &lt; 0.001 (***), Tukey HSD post-hoc testing).</p>
Full article ">Figure 6
<p>SEM images of vascular bundles from fracture surfaces. In the cross section, only the tracheids are visible in the mature endocarp (<b>A</b>) and have a polygonal cross section (<b>B</b>). From the former phloem cells, only fragments are left (arrows in (<b>B</b>)). In a longitudinally broken vascular bundle (<b>C</b>), scalariform thickenings of the tracheids are clearly visible (<b>D</b>). No pronounced perforation plates are visible at the ends of the tracheids (arrows in (<b>D</b>)).</p>
Full article ">Figure 7
<p>SEM images of sclereid cells from fracture surfaces. The cross-section shows the many cell wall layers that fill almost the entire cell lumen (<b>A</b>). The cell wall is traversed by pit canals (<b>B</b>), to which the lignified secondary cell wall layers (l2) align. In a sclereid cell oriented longitudinally to the direction of fracture, the crack has run into the cell wall and detached the outermost cell wall layers (<b>C</b>). When the primary cell wall (l1) and middle lamella is partly broken, the pit cavity becomes visible (<b>D</b>) and the bordered pits emerge from the fracture surface (<b>E</b>).</p>
Full article ">Figure 8
<p>LM image (<b>A</b>) and schematic drawing (<b>B</b>) of the pit canal system of a sclereid cell.</p>
Full article ">Figure 9
<p>Diagram of a bordered pit. Left side of the pit cavity: Observed structural features. Right side of the pit cavity: Hypothesized structuring in the vicinity of the pit cavity (for reasons of clarity not all individual cell wall layers-red lines- are traced to the pit cavity).</p>
Full article ">Figure 10
<p>Extrinsic and intrinsic toughening mechanisms found in the coconut endocarp. µCT reconstruction of a fractured sample in cross section; sample tested in compression in the study of Lauer et al. [<a href="#B9-molecules-25-00223" class="html-bibr">9</a>] (<b>A</b>). SEM images showing details of the tortuous crack path in the sclereid cell matrix (<b>B</b>) and in a single sclereid cell (<b>C</b>).</p>
Full article ">Figure 11
<p>SEM images of fracture surfaces broken in meridional/sagittal plane (<b>A</b>) and equatorial/transverse plane (<b>B</b>). Vascular bundles parallel to the fracture surface are marked red, the perpendicular ones are green, and the oblique ones are yellow. The detail of a broken sclereid cell matrix (<b>C</b>) highlights the four failure modes (modified after [<a href="#B5-molecules-25-00223" class="html-bibr">5</a>]: Cell tearing (a), middle lamella breakage (b), cell wall breakage (c), and pull-out of elongated cells (d).</p>
Full article ">
29 pages, 2709 KiB  
Review
Bioplatform Fabrication Approaches Affecting Chitosan-Based Interpolymer Complex Properties and Performance as Wound Dressings
by Hillary Mndlovu, Lisa C. du Toit, Pradeep Kumar, Yahya E. Choonara, Thashree Marimuthu, Pierre P. D. Kondiah and Viness Pillay
Molecules 2020, 25(1), 222; https://doi.org/10.3390/molecules25010222 - 6 Jan 2020
Cited by 23 | Viewed by 4993
Abstract
Chitosan can form interpolymer complexes (IPCs) with anionic polymers to form biomedical platforms (BMPs) for wound dressing/healing applications. This has resulted in its application in various BMPs such as gauze, nano/microparticles, hydrogels, scaffolds, and films. Notably, wound healing has been highlighted as a [...] Read more.
Chitosan can form interpolymer complexes (IPCs) with anionic polymers to form biomedical platforms (BMPs) for wound dressing/healing applications. This has resulted in its application in various BMPs such as gauze, nano/microparticles, hydrogels, scaffolds, and films. Notably, wound healing has been highlighted as a noteworthy application due to the remarkable physical, chemical, and mechanical properties enabled though the interaction of these polyelectrolytes. The interaction of chitosan and anionic polymers can improve the properties and performance of BMPs. To this end, the approaches employed in fabricating wound dressings was evaluated for their effect on the property–performance factors contributing to BMP suitability in wound dressing. The use of chitosan in wound dressing applications has had much attention due to its compatible biological properties. Recent advancement includes the control of the degree of crosslinking and incorporation of bioactives in an attempt to enhance the physicochemical and physicomechanical properties of wound dressing BMPs. A critical issue with polyelectrolyte-based BMPs is that their effective translation to wound dressing platforms has yet to be realised due to the unmet challenges faced when mimicking the complex and dynamic wound environment. Novel BMPs stemming from the IPCs of chitosan are discussed in this review to offer new insight into the tailoring of physical, chemical, and mechanical properties via fabrication approaches to develop effective wound dressing candidates. These BMPs may pave the way to new therapeutic developments for improved patient outcomes. Full article
(This article belongs to the Special Issue The Progresses on Polyelectrolytes and Polyelectrolyte Complexes)
Show Figures

Graphical abstract

Graphical abstract
Full article ">Figure 1
<p>Schematic representation of steps required to design a suitable biomedical platform that meets the ideal requirements for an effective wound dressing. The ideal performances highlighted in bold are amongst the in vitro and in vivo drawbacks of fabricated biomedical platforms (BMPs).</p>
Full article ">Figure 2
<p>Polyelectrolyte complexations: (<b>a</b>) Chitosan-based interpolymer complexes formed with anionic polymers via electrostatic interactions; (<b>b</b>) ionic and chemical crosslinkers of chitosan.</p>
Full article ">Figure 2 Cont.
<p>Polyelectrolyte complexations: (<b>a</b>) Chitosan-based interpolymer complexes formed with anionic polymers via electrostatic interactions; (<b>b</b>) ionic and chemical crosslinkers of chitosan.</p>
Full article ">Figure 3
<p>Schematic representation of the processing approaches of ionic polymers. (<b>a</b>) Order of mixing polymers; (<b>b</b>) bioactive incorporation into the interpolymer complex (IPC), and (<b>c</b>) crosslinking of the BMP.</p>
Full article ">Figure 4
<p>Physical and mechanical properties of the chitosan-based composites: (<b>I</b>) Swelling and (<b>II</b>) degradation kinetics of tetracycline hydrochloride (TH)/oxidised alginate (OAlg)/carboxymethyl chitosan (CMCS)/gelatine microspheres (GMs) gel with different concentrations of GMs as a function of time in PBS at 37 °C. Image reproduced with permission from Chen et al. [<a href="#B36-molecules-25-00222" class="html-bibr">36</a>]. (<b>III</b>) Gelling kinetics (of carboxymethy chitosan (CMCS)/alginate/chitosan oligosaccharides (CSOS) hydrogels at different CSOS concentration; (<b>IV</b>) Porosity observed in SEM images of CMCS/alginate (1:1) hydrogels with different concentration of CSOS: (<b>a</b>) no COS 0.1%, (<b>b</b>) CSOS, (<b>c</b>) 0.5% CSOS, and (<b>d</b>) 1.0% CSOS; (scale bar = 40 μm). Image reproduced with permission from Lv et al. [<a href="#B42-molecules-25-00222" class="html-bibr">42</a>].</p>
Full article ">Figure 5
<p>In vivo performance of chitosan-based composites. (<b>A</b>) Application of wound dressing platforms with improved properties and performance. The bilayered film/scaffold can be loaded with more than one drug due to the presence of two ionic polymers. The nano/microparticles could also be loaded with more than one drug, and the use of particles would enable the filling of the wound area. (<b>B</b>) The wound healing effect of the chitosan-collagen-alginate complex. Wound images were adjusted to the same scale, thereby allowing for a calculation of the wound area. The wound healing rate was calculated by employing the following equation: wound healing rate = (<span class="html-italic">S</span><sub>0</sub> − <span class="html-italic">St</span>)/<span class="html-italic">S</span><sub>0</sub> × 100%, where <span class="html-italic">S</span><sub>0</sub> represents the area of the original wound and <span class="html-italic">S<sub>t</sub></span> represents the area of the wound at the testing time (days). Image reproduced with permission from Xie et al. [<a href="#B48-molecules-25-00222" class="html-bibr">48</a>].</p>
Full article ">
17 pages, 2827 KiB  
Article
Synthesis, Structural Characterization, and Biological Activity of New Pyrazolo[4,3-e][1,2,4]triazine Acyclonucleosides
by Mariusz Mojzych, Zofia Bernat, Zbigniew Karczmarzyk, Joanna Matysiak and Andrzej Fruziński
Molecules 2020, 25(1), 221; https://doi.org/10.3390/molecules25010221 - 5 Jan 2020
Cited by 8 | Viewed by 3829
Abstract
A series of new pyrazolo[4,3-e][1,2,4]triazine acyclonucleosides 25 and 8 were prepared and evaluated for their anticancer activity against human cancer cell lines (MCF-7, K-562) and CDK2/E, as well as Abl protein kinases inhibitors. Lipophilicity of the compounds was determined [...] Read more.
A series of new pyrazolo[4,3-e][1,2,4]triazine acyclonucleosides 25 and 8 were prepared and evaluated for their anticancer activity against human cancer cell lines (MCF-7, K-562) and CDK2/E, as well as Abl protein kinases inhibitors. Lipophilicity of the compounds was determined using C-18 and immobilized artificial membrane (IAM) chromatography. In order to confirm the molecular structures and synthesis pathway of new acyclonucleosides, X-ray analysis was performed for model compound 3. Theoretical calculations at the DFT/B3LYP/6-311++G(d,p) level were used for the characterization of electronic structures of 18. The potential antiviral activity of acyclonucleosides 28 was tested in silico using molecular docking method. Full article
(This article belongs to the Section Medicinal Chemistry)
Show Figures

Figure 1

Figure 1
<p>Known acyclonucleosides.</p>
Full article ">Figure 2
<p>UV–Vis spectra of compounds <b>1</b> and <b>2</b> in aqueous methanol solution of different pH values.</p>
Full article ">Figure 3
<p>A view of the molecule (<b>3</b>), showing the atom-numbering scheme. Displacement ellipsoids are drawn at the 50% probability level.</p>
Full article ">Figure 4
<p>The molecules <b>1</b>–<b>8</b> with the vectors of dipole moment in the low-energy conformation obtained from calculations at the DFT/B3LYP/6-311++G(d,p) level.</p>
Full article ">Figure 5
<p>A view of the interaction of (<b>a</b>) <b>8</b> and (<b>b</b>) <b>Ac</b> with amino acids of binding site in TK.</p>
Full article ">Scheme 1
<p>Synthetic pathway to pyrazolo[4,3-<span class="html-italic">e</span>][1,2,4]triazine acyclonucleosides.</p>
Full article ">
25 pages, 1293 KiB  
Article
Synthesis of Novel Benzodifuranyl; 1,3,5-Triazines; 1,3,5-Oxadiazepines; and Thiazolopyrimidines Derived from Visnaginone and Khellinone as Anti-Inflammatory and Analgesic Agents
by Ameen Ali Abu-Hashem, Sami A Al-Hussain and Magdi E. A. Zaki
Molecules 2020, 25(1), 220; https://doi.org/10.3390/molecules25010220 - 5 Jan 2020
Cited by 39 | Viewed by 4766
Abstract
Novel (4-methoxy or 4,8-dimethoxy)-3-methyl-N-(6-oxo-2-thioxo-1,2,3, 6-tetrahydro- pyrimidin-4-yl) benzo [1,2-b: 5, 4-b’] difuran-2-carboxamide (5ab) has been synthesized by the reaction of visnagenone–ethylacetate (2a) or khellinone–ethylacetate (2b) with 6-aminothiouracil in dimethylformamide or refluxing of benzofuran-oxy-N [...] Read more.
Novel (4-methoxy or 4,8-dimethoxy)-3-methyl-N-(6-oxo-2-thioxo-1,2,3, 6-tetrahydro- pyrimidin-4-yl) benzo [1,2-b: 5, 4-b’] difuran-2-carboxamide (5ab) has been synthesized by the reaction of visnagenone–ethylacetate (2a) or khellinone–ethylacetate (2b) with 6-aminothiouracil in dimethylformamide or refluxing of benzofuran-oxy-N-(2-thioxopyrimidine) acetamide (4ab) in sodium ethoxide to give the same products (5a,b) in good yields. Thus, compounds 5ab are used as an initiative to prepare many new heterocyclic compounds such as 2-(4-(3-methylbenzodifuran- 2-carbox-amido) pyrimidine) acetic acid (6ab), N-(thiazolo[3, 2-a]pyrimidine)-3-methylbenzo- difuran-2-carboxamide (7ab), N-(2-thioxopyrimidine)-methylbenzodifuran-2-carbimidoylchloride (8a–b), N-(2-(methyl-thio) pyrimidine)-3-methylbenzodifuran-2-carbimidoylchloride (9a–b), N-(2, 6 -di(piperazine or morpholine)pyrimidine)-1-(3-methylbenzodifuran)-1-(piperazine or morpholine) methanimine(10a–d), 8-(methylbenzodifuran)-thiazolopyrimido[1,6-a][1,3,5]triazine-3,5-dione (11a –b), 8-(3-methyl benzodifuran)-thiazolopyrimido[6,1-d][1,3,5]oxadiazepine-trione (12a–b), and 2,10 -di(sub-benzylidene)-8-(3-methylbenzodifuran)-thiazolopyrimido[6,1-d][1,3,5]oxadiazepine-3,5,11- trione (13a–f). All new chemical structures were illustrated on the basis of elemental and spectral analysis (IR, NMR, and MS). The new compounds were screened as cyclooxygenase-1/ cyclooxygenase-2 (COX-1/COX-2) inhibitors and had analgesic and anti-inflammatory activities. The compounds 10ad and 13af had the highest inhibitory activity on COX-2 selectivity, with indices of 99–90, analgesic activity of 51–42% protection, and anti-inflammatory activity of 68%–59%. The inhibition of edema for the same compounds, 10ad and 13af, was compared with sodium diclofenac as a standard drug. Full article
(This article belongs to the Section Medicinal Chemistry)
Show Figures

Graphical abstract

Graphical abstract
Full article ">Figure 1
<p>Chemical structures of the phenyl-alkyl-amine hallucinogens 2,5-dimethoxy-4-bromo- phenethylamine (2C-B) and 2,5-dimethoxy-4-bromoamphetamine (DOB), 2-(8-iodo-2,3,6,7-tetra hydrobenzo[1,2-b:4,5-b`]difuran-4-yl) ethan-1-amine (2C-I-FLY), 2-(8-ethyl-2,3,6,7-tetrahydrobenzo [1,2-b:4,5-b`]difuran-4-yl)ethan-1-amine (2C-E-FLY), 2-[8-2-fluoroethyl)-2,3,6,7-tetrahydrobenzo[1,2- b:4,5-b`]difuran-4-yl]ethan-1-amine (2C-EF-FLY), also their benzodifuran and tetrahydrobenzodi- furan analogues.</p>
Full article ">Scheme 1
<p>Synthesis of <span class="html-italic">N</span>-(6-oxo-2-thioxo-1,2,3,6-tetrahydropyrimidin-4-yl) benzo [1,2-b: 5,4-b`] difuran-2-carboxamide.</p>
Full article ">Scheme 2
<p>Synthesis of <span class="html-italic">N</span>-(3,5-dioxo-2, 3-dihydro-5<span class="html-italic">H</span>-thiazolo [3, 2-a] pyrimidin-7-yl)-3-methyl benzo [1,2-b: 5,4-b`] difuran-2-carboxamide.</p>
Full article ">Scheme 3
<p>Synthesis of <span class="html-italic">N</span>-(2, 6-di (piperazin-1-yl or morpholino) pyrimidinyl)-1-((4-methoxy or 4, 8- dimethoxy)-3-methylbenzo [1,2-b: 5,4-b`] difuranyl)-1-(piperazin-1-yl or morpholino) methanimine.</p>
Full article ">Scheme 4
<p>Synthesis of 1,3,5-triazine and 1,3,5-oxadiazepine and substituted-benzylidene-3- methylbenzo [1,2-b:5,4-b`]difuran-2-yl)-5<span class="html-italic">H</span>,12a<span class="html-italic">H</span>-thiazolo[2’,3’:2,3]pyrimidine derivatives.</p>
Full article ">
10 pages, 2084 KiB  
Article
Improving the High-Frequency Response of PEI-Based Earphone with Sodium Copper Chlorophyllin
by Hao-Zhi Li, Jun-Jie Wu, Wei-Jen Lee and Chien-Sheng Chen
Molecules 2020, 25(1), 219; https://doi.org/10.3390/molecules25010219 - 5 Jan 2020
Cited by 2 | Viewed by 3665
Abstract
The polyetherimide diaphragm, sodium copper chlorophyllin (SCC), and copper ion coating composite used on earphones were observed to improve the high-frequency (10k–14k Hz) performance. This reinforcement phenomenon was expected to make the sound experience brighter and more diverse. By SEM observation, the mixed [...] Read more.
The polyetherimide diaphragm, sodium copper chlorophyllin (SCC), and copper ion coating composite used on earphones were observed to improve the high-frequency (10k–14k Hz) performance. This reinforcement phenomenon was expected to make the sound experience brighter and more diverse. By SEM observation, the mixed coating of SCC/Cu2+ on the polyethylenimine (PEI) diaphragm exhibited a planar blocky structure and was tightly bonded to the surface of the PEI polymer without the aid of colloids. The endothermic process of SCC and metal ion complexation was analyzed by isothermal titration calorimetry. The association ratios of SCC/Cu2+ and SCC/Ni2+ were 4/1 and 6/1, respectively, and the SCC/Cu2+ association yielded a stronger binding constant and more free energy. It was expected that the SCC/Cu2+(4/1) mixed liquid would be immobilized on the PEI polymer by multivalent interaction, including hydrogen-bonding networks between carboxyl groups of SCC and amine groups of PEI, and cross-linking of bridging copper ions. We used dimethylethylenediamine (DME) monomer instead of PEI polymer to analyze this multivalent interaction and observed a two-stage exothermic association of SCC/Cu2+(4/1) and DME with a total Gibbs free energy of 15.15 kcal/mol. We observed that the binding energy could be used to explain that the SCC/Cu2+ mixed formulation could be fixed on the surface of the PEI polymer and could enhance the strength of the PEI film. Compared with graphene films, which can continuously improve the performance of high and ultrasonic frequencies, this study was devoted to and was initiated for the purpose of applying porphyrin compounds to improve music performance. Full article
Show Figures

Graphical abstract

Graphical abstract
Full article ">Figure 1
<p>Binding isotherms for sodium copper chlorophyllin (SCC) titrated with copper and nickel ions. Titrations of (<b>A</b>) 0.76 mM SCC with 4.2 mM Cu(ClO<sub>4</sub>)<sub>2</sub> and (<b>B</b>) 0.76 mM SCC with 1.89 mM Ni(ClO<sub>4</sub>)<sub>2</sub> in H<sub>2</sub>O at 25 °C were performed using an isothermal titration calorimetry (ITC) microcalorimeter. The integrated fitted curves show the experimental points with a sequential binding site function for SCC/Cu(ClO<sub>4</sub>)<sub>2</sub> titration and with a one-site function for SCC/Ni(ClO<sub>4</sub>)<sub>2</sub> titration.</p>
Full article ">Figure 2
<p>Frequency response curves of PEI-earphone diaphragms made of SCC/Cu<sup>2+</sup> (<b>A</b>) and SCC/Ni<sup>2+</sup> (<b>B</b>) composites. Differences of sound pressure level, including SCC/Cu<sup>2+</sup>, SCC/Ni<sup>2+</sup>, SCC/Zn<sup>2+</sup>, and SCC/Ca<sup>2+</sup> composites on PEI diaphragms at 600 (<b>C</b>) and 800 (<b>D</b>) ppm. ΔSPL = [SPL]<sub>composites</sub>—[SPL]<sub>blank</sub>.</p>
Full article ">Figure 3
<p>Binding isotherms for complexation of Cu<sup>2+</sup>, SCC, and SCC/Cu<sup>2+</sup> with DME at 25 °C. Titrations of (<b>A</b>) 84.3 μM Cu(ClO<sub>4</sub>)<sub>2</sub> with 5.0 mM DME, (<b>B</b>) 84.3 μM SCC with 5.0 mM DME, and (<b>C</b>) 84.3 μM SCC/Cu<sup>2+</sup>(4/1) with 5.0 mM DME in H<sub>2</sub>O at 25 °C were performed using an ITC microcalorimeter.</p>
Full article ">Figure 4
<p>Proposed binding model for SCC/Cu<sup>2+</sup> with DME (<b>A</b>) and SCC/Cu<sup>2+</sup> on PEI polymer (<b>B</b>). Inset: structure for the complexation of EDTA/Cu<sup>2+</sup>.</p>
Full article ">Figure 5
<p>Scanning electron microscopy (SEM) images of coated SCC/Cu<sup>2+</sup>(4/1) on PEI film at 10,000× (<b>A</b>, side view) and 2000× (<b>B</b>, top view) magnification.</p>
Full article ">
14 pages, 1931 KiB  
Article
Convergent Synthesis of Thioether Containing Peptides
by Spyridon Mourtas, Christina Katakalou, Dimitrios Gatos and Kleomenis Barlos
Molecules 2020, 25(1), 218; https://doi.org/10.3390/molecules25010218 - 5 Jan 2020
Cited by 4 | Viewed by 5567
Abstract
Thioether containing peptides were obtained following three synthetic routes. In route A, halo acids esterified on 2-chlorotrityl(Cltr) resin were reacted with N-fluorenylmethoxycarbonyl (Fmoc) aminothiols. These were either cleaved from the resin to the corresponding (Fmoc-aminothiol)carboxylic acids, which were used as key building [...] Read more.
Thioether containing peptides were obtained following three synthetic routes. In route A, halo acids esterified on 2-chlorotrityl(Cltr) resin were reacted with N-fluorenylmethoxycarbonyl (Fmoc) aminothiols. These were either cleaved from the resin to the corresponding (Fmoc-aminothiol)carboxylic acids, which were used as key building blocks in solid phase peptide synthesis (SPPS), or the N-Fmoc group was deprotected and peptide chains were elongated by standard SPPS. The obtained N-Fmoc protected thioether containing peptides were then condensed either in solution, or on solid support, with the appropriate amino components of peptides. In route B, the thioether containing peptides were obtained by the reaction of N-Fmoc aminothiols with bromoacetylated peptides, which were synthesized on Cltr-resin, followed by removal of the N-Fmoc group and subsequent peptide elongation by standard SPPS. In route C, the thioether containing peptides were obtained by the condensation of a haloacylated peptide synthesized on Cltr-resin and a thiol-peptide synthesized either on 4-methoxytrityl(Mmt) or trityl(Trt) resin. Full article
(This article belongs to the Special Issue Cyclic Peptide Analogues and Non-peptide Mimetics)
Show Figures

Graphical abstract

Graphical abstract
Full article ">Figure 1
<p>Peptide bond isosteres: Y = CH<sub>2</sub> (a), NH (b), O (c) and S (d).</p>
Full article ">Figure 2
<p>Structure of thioether containing peptide <b>16</b> (synthesized by using route A), and <b>17</b> (synthesized by using route B).</p>
Full article ">Figure 3
<p>Structure of thiol-peptides <b>21</b> (ProTa (69-75) derivative) and <b>22</b> (Hirudine (11-18) derivative), synthesized on Trt-resins <b>19</b> (R′ = CH<sub>3</sub> (<b>21</b>); –CH<sub>2</sub>–Ph (<b>22</b>)).</p>
Full article ">Scheme 1
<p>Route A for convergent solid-phase peptide synthesis (CSPPS) of thioether containing peptides. Halo acids esterified on Cltr-resin were reacted with <span class="html-italic">N</span>-Fmoc aminothiols and peptide chains were elongated either by direct SPPS or CSPPS, or cleavage of the (Fmoc-aminothiol)carboxylic acids and their use in SPPS; R = H (n = 1–5), CH<sub>3</sub> (n = 1); R′ = H (m = 1–5), CH<sub>3</sub>, CH(CH<sub>3</sub>)<sub>2</sub>, CH<sub>2</sub>CH(CH<sub>3</sub>)<sub>2</sub>, CH(CH<sub>3</sub>)CH<sub>2</sub>CH<sub>3</sub>, CH<sub>2</sub>(C<sub>6</sub>H<sub>5</sub>) (m = 1); X = Cl, Br; Y = <span class="html-italic">O</span>-Cltr monomer (<b>10a</b>), <span class="html-italic">O</span>-Cltr-resin (<b>10b</b>).</p>
Full article ">Scheme 2
<p>Route B for CSPPS of thioether containing peptides. The thioether containing peptides were obtained by the reaction of <span class="html-italic">N</span>-Fmoc aminothiols with bromoacetylated peptides, which were synthesized on Cltr resin, followed by removal of the <span class="html-italic">N</span>-Fmoc group and peptide elongation; R = H (n = 1–5), CH<sub>3</sub> (n = 1); R′ = H (m = 1–5), CH<sub>3</sub>, CH(CH<sub>3</sub>)<sub>2</sub>, CH<sub>2</sub>CH(CH<sub>3</sub>)<sub>2</sub>, CH(CH<sub>3</sub>)CH<sub>2</sub>CH<sub>3</sub>, CH<sub>2</sub>(C<sub>6</sub>H<sub>5</sub>) (m = 1); X = Cl, Br.</p>
Full article ">Scheme 3
<p>Route C for CSPPS of thioether containing peptides. The thioether containing peptides were obtained by the condensation of a haloacylated peptide which was synthesized on Cltr-resin and a thiol-peptide which was synthesized either on Mmt-resin, or on Trt-resin; R = H (n = 1–5), CH<sub>3</sub> (n = 1); R′ = H (m = 1–5), CH<sub>3</sub>, CH(CH<sub>3</sub>)<sub>2</sub>, CH<sub>2</sub>CH(CH<sub>3</sub>)<sub>2</sub>, CH(CH<sub>3</sub>)CH<sub>2</sub>CH<sub>3</sub>, CH<sub>2</sub>(C<sub>6</sub>H<sub>5</sub>) (m = 1); X = Cl, Br.</p>
Full article ">Scheme 4
<p>Synthetic procedure of <b>26</b> by using route C.</p>
Full article ">Scheme 5
<p>Synthetic procedure of <b>30</b> by using route C. The reaction process was monitored by hplc analysis following the peaks of the desired product <b>30</b> and un-reacted <b>31</b> after their cleavage from the resin (see <a href="#app1-molecules-25-00218" class="html-app">Figure S5 in Supplementary Materials section</a>).</p>
Full article ">Scheme 6
<p>Diketopiperazine peptide derivative <b>35</b> formation of bromoacetylated-MUC-1 peptide.</p>
Full article ">
12 pages, 669 KiB  
Article
Chemical Composition, Antimicrobial, Antioxidant, and Antiproliferative Properties of Grapefruit Essential Oil Prepared by Molecular Distillation
by Weihui Deng, Ke Liu, Shan Cao, Jingyu Sun, Balian Zhong and Jiong Chun
Molecules 2020, 25(1), 217; https://doi.org/10.3390/molecules25010217 - 5 Jan 2020
Cited by 110 | Viewed by 9556
Abstract
Grapefruit essential oil has been proven to have wide range of bioactivities. However, bioactivity of its molecular distillate has not been well studied. In this study, a light phase oil was obtained by molecular distillation from cold-pressed grapefruit essential oil and GC-MS was [...] Read more.
Grapefruit essential oil has been proven to have wide range of bioactivities. However, bioactivity of its molecular distillate has not been well studied. In this study, a light phase oil was obtained by molecular distillation from cold-pressed grapefruit essential oil and GC-MS was used to identify its chemical composition. The antimicrobial activity of the light phase oil was tested by filter paper diffusion method, and the anticancer activity was determined by the Cell Counting Kit-8 (CCK-8) assay. Twenty-four components were detected with a total relative content of 99.74%, including 97.48% of terpenes and 1.66% of oxygenated terpenes. The light phase oil had the best antimicrobial effect on Bacillus subtilis, followed by Escherichia coli, Staphylococcus aureus and Salmonellaty phimurium. DPPH and ABTS assays demonstrated that the light phase oil had good antioxidant activity. The CCK-8 assay of cell proliferation showed that the light phase oil had a good inhibitory effect on the proliferation of HepG2 liver cancer cells and HCT116 colon cancer cells. Full article
(This article belongs to the Special Issue Plant Extracts: Biological and Pharmacological Activity)
Show Figures

Figure 1

Figure 1
<p>Total ion chromatogram of grapefruit light phase essential oil (LPEO).</p>
Full article ">Figure 2
<p>Effects on the viability of cancer cellsHepG2 and HCT116 as a function of LPEO concentration. Significant decreases in cell viability of cancer cells are seen at increasing LPEO concentrations compared to untreated controls (control group was set to 100%). **—Very significant at <span class="html-italic">p</span> &lt; 0.01, ***—Highly significant at <span class="html-italic">p</span> &lt; 0.001.</p>
Full article ">
16 pages, 3119 KiB  
Article
Two Natural Alkaloids Synergistically Induce Apoptosis in Breast Cancer Cells by Inhibiting STAT3 Activation
by Di Chen, Yangmin Ma, Zhiyu Guo, Li Liu, Yaru Yang, Yuru Wang, Bonan Pan, Luyang Wu, Yuyu Hui and Wenjuan Yang
Molecules 2020, 25(1), 216; https://doi.org/10.3390/molecules25010216 - 5 Jan 2020
Cited by 25 | Viewed by 4707
Abstract
Breast cancer has become a worldwide threat, and chemotherapy remains a routine treatment. Patients are forced to receive continuous chemotherapy and suffer from severe side effects and poor prognosis. Natural alkaloids, such as piperine (PP) and piperlongumine (PL), are expected to become a [...] Read more.
Breast cancer has become a worldwide threat, and chemotherapy remains a routine treatment. Patients are forced to receive continuous chemotherapy and suffer from severe side effects and poor prognosis. Natural alkaloids, such as piperine (PP) and piperlongumine (PL), are expected to become a new strategy against breast cancer due to their reliable anticancer potential. In the present study, cell viability, flow cytometry, and Western blot assays were performed to evaluate the suppression effect of PP and PL, alone or in combination. Data showed that PP and PL synergistically inhibited breast cancer cells proliferation at lower doses, while only weak killing effect was observed in normal breast cells, indicating a good selectivity. Furthermore, apoptosis and STAT3 signaling pathway-associated protein levels were analyzed. We demonstrated that PP and PL in combination inhibit STAT3 phosphorylation and regulate downstream molecules to induce apoptosis in breast cancer cells. Taken together, these results revealed that inactivation of STAT3 was a novel mechanism with treatment of PP and PL, suggesting that combination application of natural alkaloids may be a potential strategy for prevention and therapy of breast cancer. Full article
(This article belongs to the Section Chemical Biology)
Show Figures

Figure 1

Figure 1
<p>Piperine (PP) and piperlongumine (PL) inhibit the proliferation of breast cancer cells and normal breast cells. (<b>A</b>,<b>B</b>) Molecular structures of piperine and piperlongumine. (<b>C</b>,<b>D</b>) MDA-MB-231, MCF-7, and MCF-10A cells were treated with the indicated concentrations of PP and PL for 48 h, DMSO was used as a vehicle control, and cell viability was detected by MTT assay.</p>
Full article ">Figure 2
<p>Piperine and piperlongumine induce apoptosis in breast cancer cells and normal breast cells. (<b>A</b>,<b>C</b>) MDA-MB-231, MCF-7, and MCF-10A cells were treated with the indicated concentrations of PP and PL for 48 h and stained with Annexin V/PI. DMSO was used as a vehicle control. The apoptotic rate was then detected by flow cytometry assay. (<b>B</b>,<b>D</b>) The percentage of apoptotic cells in the treatment groups was calculated. * <span class="html-italic">p</span> &lt; 0.05, ** <span class="html-italic">p</span> &lt; 0.01, *** <span class="html-italic">p</span> &lt; 0.001 compared to the control group.</p>
Full article ">Figure 2 Cont.
<p>Piperine and piperlongumine induce apoptosis in breast cancer cells and normal breast cells. (<b>A</b>,<b>C</b>) MDA-MB-231, MCF-7, and MCF-10A cells were treated with the indicated concentrations of PP and PL for 48 h and stained with Annexin V/PI. DMSO was used as a vehicle control. The apoptotic rate was then detected by flow cytometry assay. (<b>B</b>,<b>D</b>) The percentage of apoptotic cells in the treatment groups was calculated. * <span class="html-italic">p</span> &lt; 0.05, ** <span class="html-italic">p</span> &lt; 0.01, *** <span class="html-italic">p</span> &lt; 0.001 compared to the control group.</p>
Full article ">Figure 3
<p>Piperine and piperlongumine synergistically inhibit the proliferation of breast cancer cells. MDA-MB-231, MCF-7, and MCF-10A cells were treated with the indicated concentrations of PP and PL for 72 h. DMSO was used as a vehicle control, and cell viability was detected by MTT assay.</p>
Full article ">Figure 4
<p>The combination of piperine and piperlongumine significantly induces apoptosis in breast cancer cells. (<b>A</b>) MDA-MB-231, MCF-7, and MCF-10A cells were treated with PP (50 μM, 100 μM) and PL (5 μM) alone or in combination for 48 h and then stained with Annexin V/PI. DMSO was used as a vehicle control, and the apoptotic rate was detected by flow cytometry assay. (<b>B</b>) The percentage of apoptotic cells in the treatment groups was calculated. * <span class="html-italic">p</span> &lt; 0.05, ** <span class="html-italic">p</span> &lt; 0.01, *** <span class="html-italic">p</span> &lt; 0.001 compared to the compared group; ns: Not significant.</p>
Full article ">Figure 5
<p>The combination of piperine and piperlongumine down-regulates Bcl-2 in breast cancer cells. (<b>A</b>) MDA-MB-231, MCF-7, and MCF-10A cells were treated with PP (50, 100 μM) and PL (5 μM) alone or in combination for 24 h. Cell lysates were then subjected to Western blot assay. Proteins levels of Bcl-2 and Bax were detected. β-actin was used as an internal control. (<b>B</b>) The relative protein expression in each treatment group was calculated. * <span class="html-italic">p</span> &lt; 0.05, ** <span class="html-italic">p</span> &lt; 0.01, *** <span class="html-italic">p</span> &lt; 0.001 compared to the compared group; ns: Not significant.</p>
Full article ">Figure 6
<p>The combination of piperine and piperlongumine inhibits STAT3 phosphorylation in breast cancer cells. (<b>A</b>) MDA-MB-231, MCF-7, and MCF-10A cells were treated with PP (50 μM, 100 μM) and PL (5 μM) alone or in combination for 24 h. Cell lysates were then subjected to Western blot assay. STAT3 pathway-related proteins, including p-STAT3, STAT3, p-JAK2, JAK2, and survivin, were detected. β-actin was used as an internal control. (<b>B</b>) The relative protein expression in each treatment group was calculated. * <span class="html-italic">p</span> &lt; 0.05, ** <span class="html-italic">p</span> &lt; 0.01, *** <span class="html-italic">p</span> &lt; 0.001 compared to the compared group; ns: Not significant.</p>
Full article ">
11 pages, 885 KiB  
Article
Optimization of Microwave-Assisted Extraction of Antioxidants from Bamboo Shoots of Phyllostachys pubescens
by Gualtiero Milani, Francesca Curci, Maria Maddalena Cavalluzzi, Pasquale Crupi, Isabella Pisano, Giovanni Lentini, Maria Lisa Clodoveo, Carlo Franchini and Filomena Corbo
Molecules 2020, 25(1), 215; https://doi.org/10.3390/molecules25010215 - 5 Jan 2020
Cited by 29 | Viewed by 4842
Abstract
Bamboo is a well-known medicinal plant in Southeast Asia that recently has attracted attention for its high polyphenol content and its medical and nutraceutical applications. In this work, polyphenols have been recovered for the first time by microwave-assisted extraction (MAE) from an unusual [...] Read more.
Bamboo is a well-known medicinal plant in Southeast Asia that recently has attracted attention for its high polyphenol content and its medical and nutraceutical applications. In this work, polyphenols have been recovered for the first time by microwave-assisted extraction (MAE) from an unusual Italian cultivar of Phyllostachys pubescens bamboo shoots. The effects of three independent variables, such as extraction time, temperature, and solid/liquid ratio, on polyphenol recovery yield were investigated and successfully optimized through the response surface methodology. We demonstrated that MAE is an excellent polyphenols extraction technique from bamboo shoots because the total phenolic content obtained under microwave irradiation optimal conditions (4 min at 105 °C with 6.25 mg/mL ratio) was about eight-fold higher than that obtained with the conventional extraction method. Furthermore, higher total flavonoid content was also obtained under MAE. Consistent with these results, MAE enhanced the extract antioxidant properties with significant improved DPPH, ABTS, and FRAP scavenging ability. Therefore, this innovative extraction process enhances the recovery of biologically active compounds from Phyllostachys pubescens bamboo shoots with a dramatic reduction of time and energy consumption, which paves the way for its industrial application in functional food production. Full article
(This article belongs to the Special Issue Green Extraction of Natural Products)
Show Figures

Graphical abstract

Graphical abstract
Full article ">Figure 1
<p>Response surface plots of the effect of (<b>A</b>) solid/liquid ratio and extraction temperature, (<b>B</b>) solid/liquid ratio and extraction time, (<b>C</b>) extraction temperature and time on polyphenol yield (TPC) obtained through MAE.</p>
Full article ">
17 pages, 4149 KiB  
Article
Astaxanthin Protects PC12 Cells against Homocysteine- and Glutamate-Induced Neurotoxicity
by Chi-Huang Chang, Kuan-Chou Chen, Kuo-Chun Liaw, Chiung-Chi Peng and Robert Y. Peng
Molecules 2020, 25(1), 214; https://doi.org/10.3390/molecules25010214 - 5 Jan 2020
Cited by 20 | Viewed by 4373
Abstract
Memory impairment has been shown to be associated with glutamate (Glu) excitotoxicity, homocysteine (Hcy) accumulation, and oxidative stress. We hypothesize that Glu and Hcy could damage neuronal cells, while astaxanthin (ATX) could be beneficial to alleviate the adverse effects. Using PC12 cell model, [...] Read more.
Memory impairment has been shown to be associated with glutamate (Glu) excitotoxicity, homocysteine (Hcy) accumulation, and oxidative stress. We hypothesize that Glu and Hcy could damage neuronal cells, while astaxanthin (ATX) could be beneficial to alleviate the adverse effects. Using PC12 cell model, we showed that Glu and Hcy provoked a huge amount of reactive oxygen species (ROS) production, causing mitochondrial damage at EC50 20 and 10 mm, respectively. The mechanisms of action include: (1) increasing calcium influx; (2) producing ROS; (3) initiating lipid peroxidation; (4) causing imbalance of the Bcl-2/Bax homeostasis; and (5) activating cascade of caspases involving caspases 12 and 3. Conclusively, the damages caused by Glu and Hcy to PC12 cells can be alleviated by the potent antioxidant ATX. Full article
Show Figures

Figure 1

Figure 1
<p>Chemical structure of astaxanthin and the effect of each compound of interest on the viability of PC12 cell line cultured for 24, 48, and 72 h. 24 h: empty bars; 48 h: gray bars; 72 h: dark net bars. PC12 cells were seeded onto a 24-well plate at 5 × 10<sup>4</sup> cells/mL and cultured in serum-free medium overnight, then treated with astaxanthin (ATX), homocysteine (Hcy), or glutamate (Glu). (<b>a</b>) Chemical structure of ATX (depicted from PubChem, <a href="https://pubchem.ncbi.nlm.nih.gov/" target="_blank">https://pubchem.ncbi.nlm.nih.gov/</a>). (<b>b</b>) ATX (0–100 μM). (<b>c</b>) Hcy (0–40 mM). (<b>d</b>) Glu (0–20 mM). Data are expressed as means ± SD (<span class="html-italic">n</span> = 3). * <span class="html-italic">p</span> &lt; 0.05; ** <span class="html-italic">p</span> &lt; 0.01; *** <span class="html-italic">p</span> &lt; 0.005 vs. control at the same time.</p>
Full article ">Figure 2
<p>Combined effect of target compounds on the viability of PC12 cell line. PC12 cells were seeded onto 24-well plates at 5 × 10<sup>4</sup> cells/mL and cultured in serum-free medium overnight, then treated with different combinations of ATX, Hcy and/or Glu separately. In all panels, empty bars: 24 h. In <a href="#molecules-25-00214-f002" class="html-fig">Figure 2</a>a, gray bars: 48 h; dark net bars: 72 h. In <a href="#molecules-25-00214-f002" class="html-fig">Figure 2</a>b–d, net dark bars: 48 h. (<b>a</b>) Glu (5–20 mM) plus Hcy (10 mM). (<b>b</b>) ATX (1–10 μM) plus Hcy (10 mM). (<b>c</b>) ATX (1–10 μM) plus Glu (20 mM). (<b>d</b>) ATX (1–10 μM) plus Hcy (10 mM) plus Glu (20 mM). Data are expressed as means ± SD (<span class="html-italic">n</span> = 3). *: compared to the control; 〒: vs. Hcy 10 mM at the same time; <span class="html-fig-inline" id="molecules-25-00214-i001"> <img alt="Molecules 25 00214 i001" src="/molecules/molecules-25-00214/article_deploy/html/images/molecules-25-00214-i001.png"/></span>: vs. 24 h at the same dose; ⊗: vs. Glu 20 mM at the same time; #: vs. Hcy 10 mM + Glu 20 mM at the same time. The significance of the difference was judged by confidence levels of * <span class="html-italic">p</span> &lt; 0.05; <sup>#</sup> <span class="html-italic">p</span> &lt; 0.05; <b><sup>〒</sup></b> <span class="html-italic">p</span> &lt; 0.05; <sup>⊗</sup> <span class="html-italic">p</span> &lt; 0.05; <sup><span class="html-fig-inline" id="molecules-25-00214-i001"> <img alt="Molecules 25 00214 i001" src="/molecules/molecules-25-00214/article_deploy/html/images/molecules-25-00214-i001.png"/></span> </sup><span class="html-italic">p</span> &lt; 0.05; ** <span class="html-italic">p</span> &lt; 0.01; <sup>##</sup> <span class="html-italic">p</span> &lt; 0.01; <sup>⊗⊗</sup> <span class="html-italic">p</span> &lt; 0.01; <sup><span class="html-fig-inline" id="molecules-25-00214-i001"> <img alt="Molecules 25 00214 i001" src="/molecules/molecules-25-00214/article_deploy/html/images/molecules-25-00214-i001.png"/></span><span class="html-fig-inline" id="molecules-25-00214-i001"> <img alt="Molecules 25 00214 i001" src="/molecules/molecules-25-00214/article_deploy/html/images/molecules-25-00214-i001.png"/></span> </sup><span class="html-italic">p</span> &lt; 0.01; *** <span class="html-italic">p</span> &lt; 0.005.</p>
Full article ">Figure 3
<p>Protective effect of astaxanthin against the calcium ion influx and oxidative stress induced by target compounds. PC12 cells were cultured in serum-free medium overnight, then treated with different combinations of ATX (5 μM), Hcy (10 mM), and/or Glu (20 mM). (<b>a</b>) Intracellular calcium ion level. (<b>b</b>) Reactive oxygen species (ROS) production. (<b>c</b>) Malondialdehyde (MDA) production. Data are expressed as means ± SD (<span class="html-italic">n</span> = 3). *: compared to the control; ⊗: vs. Glu 20 mM only; 〒: vs. Hcy 10 mM only; #: vs. Hcy 10 mM + Glu 20 mM. The significance of the difference was judged by confidence levels of * <span class="html-italic">p</span> &lt; 0.05; <sup>⊗</sup> <span class="html-italic">p</span> &lt; 0.05; <sup>〒</sup> <span class="html-italic">p</span> &lt; 0.05; <sup>#</sup> <span class="html-italic">p</span> &lt; 0.05; ** <span class="html-italic">p</span> &lt; 0.01; <sup>⊗⊗</sup> <span class="html-italic">p</span> &lt; 0.01; <sup>##</sup> <span class="html-italic">p</span> &lt; 0.01;<sup>〒〒</sup> <span class="html-italic">p</span> &lt; 0.01; *** <span class="html-italic">p</span> &lt; 0.005; <sup>###</sup> <span class="html-italic">p</span> &lt; 0.005.</p>
Full article ">Figure 4
<p>Western blot and quantified protein expression affected by different treatments. (<b>a</b>) Bax; (<b>b</b>) Bcl-2; and (<b>c</b>) Bcl-2/Bax. Western blot analysis quantified into bar diagram. Data are expressed as means ± SD (<span class="html-italic">n</span> = 3). *: vs. control; ⊗: vs. Glu 20 mM only; 〒: vs. Hcy 10 mM only; #: vs. Hcy 10 mM + Glu 20 mM. The significance of the difference was judged by confidence levels of * <span class="html-italic">p</span> &lt; 0.05; <sup>⊗</sup> <span class="html-italic">p</span> &lt; 0.05; <sup>〒</sup> <span class="html-italic">p</span> &lt; 0.05; <sup>#</sup> <span class="html-italic">p</span> &lt; 0.05; ** <span class="html-italic">p</span> &lt; 0.01; *** <span class="html-italic">p</span> &lt; 0.005.</p>
Full article ">Figure 5
<p>Caspase-12 expression affected by different treatments. (<b>a</b>) Western blot analysis; (<b>b</b>) quantified bar diagram. Data are expressed as means ± SD (<span class="html-italic">n</span> = 3). *: vs. control; ⊗: vs. Glu 20 mM only; 〒: vs. Hcy 10 mM only; #: vs. Hcy10 mM + Glu 20 mM. The significance of the difference was judged by confidence levels of * <span class="html-italic">p</span> &lt; 0.05; <sup>⊗</sup> <span class="html-italic">p</span> &lt; 0.05; <sup>〒</sup> <span class="html-italic">p</span> &lt; 0.05; <sup>#</sup> <span class="html-italic">p</span> &lt; 0.05; ** <span class="html-italic">p</span> &lt; 0.01; *** <span class="html-italic">p</span> &lt; 0.005.</p>
Full article ">Figure 6
<p>Caspase-3 expression affected by different treatments. (<b>a</b>) Western blot analysis; (<b>b</b>) quantified bar diagram. Data are expressed as means ± SD (<span class="html-italic">n</span> = 3). *: vs. control; ⊗: vs Glu 20 mM only; 〒: vs. Hcy 10 mM only; #: vs. Hcy10 mM + Glu 20 mM, The significance of the difference was judged by confidence levels of * <span class="html-italic">p</span> &lt; 0.05; <sup>⊗</sup> <span class="html-italic">p</span> &lt; 0.05; <sup>〒</sup> <span class="html-italic">p</span> &lt; 0.05; <sup>#</sup> <span class="html-italic">p</span> &lt; 0.05; ** <span class="html-italic">p</span> &lt; 0.01; *** <span class="html-italic">p</span> &lt; 0.005.</p>
Full article ">Figure 7
<p>Summary of the apoptotic pathways induced by glutamate and homocysteine. This figure shows how glutamate and homocysteine induce mitochondrial damages, while astaxanthin alleviates the upregulation of Ca<sup>2+</sup> influx, ROS, Bax, caspase-12, and caspase-3 and the downregulation of Bcl-2. ER: endoplasmic reticulum; mito: mitochondria; ROS: reactive oxygen species; MMP and Ψ<sub>m</sub>: mitochondrial membrane potential. Symbols expressed in larger characters are the experimental results, while symbols in smaller characters are pathway-linking items. PARP: Poly(ADP-ribose) polymerase; Apaf-1: (apoptotic protease activating factor 1).</p>
Full article ">
18 pages, 3058 KiB  
Article
Assessing Amphiphilic ABAB Zn(II) Phthalocyanines with Enhanced Photosensitization Abilities in In Vitro Photodynamic Therapy Studies Against Cancer
by Miguel Á. Revuelta-Maza, Marta Mascaraque, Patricia González-Jiménez, Arturo González-Camuñas, Santi Nonell, Ángeles Juarranz, Gema de la Torre and Tomás Torres
Molecules 2020, 25(1), 213; https://doi.org/10.3390/molecules25010213 - 4 Jan 2020
Cited by 11 | Viewed by 3594
Abstract
We have previously demonstrated that singlet oxygen photosensitization abilities of Zn(II) phthalocyanines (Zn(II)Pcs) are enhanced through α-functionalization with bulky fluorinated substituents (i.e., bis(trifluoromethyl)phenyl units) at facing positions of ABAB Zn(II)Pcs, where A and B refer to differently functionalized isoindoles. In this work, we [...] Read more.
We have previously demonstrated that singlet oxygen photosensitization abilities of Zn(II) phthalocyanines (Zn(II)Pcs) are enhanced through α-functionalization with bulky fluorinated substituents (i.e., bis(trifluoromethyl)phenyl units) at facing positions of ABAB Zn(II)Pcs, where A and B refer to differently functionalized isoindoles. In this work, we have prepared the Zn(II)Pc ABAB 1 endowed with hydrophilic triethylene glycol monomethyl ether (i.e., at the A isoindoles) to provide solubility in aqueous media, together with its A3B and A4 counterparts, and compared their ability to behave as photosensitizers for photodynamic therapy. All photophysical data, aggregation studies and preliminary in vitro biological assays in cell cultures of SCC-13 (squamous cell carcinoma) and HeLa (cervical cancer cells), have proved ABAB 1 as the best photosensitizer of the series. Full article
(This article belongs to the Special Issue Porphyrinoid Derivatives: Synthesis and Biological Applications)
Show Figures

Graphical abstract

Graphical abstract
Full article ">Figure 1
<p><sup>1</sup>H NMR spectra for <b>ABAB-1</b> (in CDCl<sub>3</sub>), <b>A<sub>3</sub>B-1</b> (in THF-d<sub>8</sub>) and <b>A<sub>4</sub>-1</b> (in DMSO-d<sub>6</sub>). Geometry optimization (MM2, SCIGRESS (FJ 2.8.1 EU 3.3.1)) for each molecule is shown.</p>
Full article ">Figure 2
<p>UV–Vis spectra of <b>ABAB-1</b>, <b>A<sub>3</sub>B-1</b>, and <b>A<sub>4</sub>-1</b> in different DMSO/water ratios.</p>
Full article ">Figure 3
<p>n-octanol/water partition experiments with <b>ABAB-1, A<sub>3</sub>B-1</b>, and <b>A<sub>4</sub>-1</b>.</p>
Full article ">Figure 4
<p>(<b>a</b>) Phototoxicity induced by <b>ABAB-1</b>, <b>A<sub>3</sub>B-1</b>, and <b>A<sub>4</sub>-1</b> in SCC-13 and HeLa cells. Cells were incubated with concentrations of 1·10<sup>−6</sup> for 5 h and then irradiated with red light at variable doses. The survival was dependent of red light dose; <b>A<sub>4</sub>-1</b> was the less sensible to light irradiation. Cell survival was evaluated by the MTT test 24 h after treatments. Each value corresponds to the mean obtained from three independent experiments ± SD. (* <span class="html-italic">p</span> &lt; 0.05; ** <span class="html-italic">p</span> &lt; 0.01; *** <span class="html-italic">p</span> &lt; 0.001). (<b>b</b>) Morphological changes observed in SCC-13 and HeLa cells 24 h after photodynamic treatment with the three Pcs (1·10<sup>−6</sup> M, 5 h incubation followed by 9 J/cm<sup>2</sup> of red light).</p>
Full article ">Figure 5
<p>Cellular localization of <b>ABAB-1</b>, <b>A<sub>3</sub>B-1</b>, and <b>A<sub>4</sub>-1</b> (red) in SCC-13 and HeLa cells when they are observed with a fluorescence microscopy (irradiated with green light at 545 nm) and without other cell dye. They appear with a vesicular morphology inside cells.</p>
Full article ">Scheme 1
<p>Synthesis of triethylene glycol monomethyl ether substituted <b>ABAB-1</b>, <b>A<sub>3</sub>B-1</b> and <b>A<sub>4</sub>-1</b> ZnPcs. (i) Zn(OAc)<sub>2</sub>, <span class="html-italic">o-</span>DCB/DMF (2:1), 150 °C, 15 h; (ii) TEG-Ts, K<sub>2</sub>CO<sub>3</sub>, DMF, 50 °C, overnight; (iii) Zn(OAc)<sub>2</sub>, pentanol, 1,8-diazabicyclo [5.4.0]undec-7-ene (DBU), 150 °C, 1h.</p>
Full article ">Figure A1
<p>Subcellular localization of organelles of SCC-13 and HeLa cells after incubation with known fluorescent probes. Phase contrast (PhC). Green fluorescence is from Golgi apparatus (Golgi), mitochondrial (Mito) and lysosomes (Lyso). A blue (450–490 nm) exciting lamp was used for organelles probes. Scale bar 10 µm.</p>
Full article ">
14 pages, 3424 KiB  
Article
Anti-Tumor Activity of Atractylenolide I in Human Colon Adenocarcinoma In Vitro
by Ka Woon Karen Chan, Hau Yin Chung and Wing Shing Ho
Molecules 2020, 25(1), 212; https://doi.org/10.3390/molecules25010212 - 4 Jan 2020
Cited by 14 | Viewed by 5050
Abstract
Atractylodes macrocephala is known to exhibit multi-arrays of biologic activity in vitro. However, detail of its anti-tumor activity is lacking. In this study, the effects of atractylenolide I (AT-I), a bio-active compound present in Atractylodes macrocephala rhizome was studied in the human colorectal [...] Read more.
Atractylodes macrocephala is known to exhibit multi-arrays of biologic activity in vitro. However, detail of its anti-tumor activity is lacking. In this study, the effects of atractylenolide I (AT-I), a bio-active compound present in Atractylodes macrocephala rhizome was studied in the human colorectal adenocarcinoma cell line HT-29. The results showed that AT-I induced apoptosis of human colon cancer cells through activation of the mitochondria-dependent pathway. The IC50 of AT-I was 277.6 μM, 95.7 μM and 57.4 μM, after 24, 48 and 72 h of incubation with HT-29, respectively. TUNEL and Annexin V-FITC/PI double stain assays showed HT-29 DNA fragmentation after cell treatment with various AT-I concentrations. Western blotting analysis revealed activation of both initiator and executioner caspases, including caspase 3, caspase 7, and caspase 9, as well as PARP, after HT-29 treatment with AT-I via downregulation of pro-survival Bcl-2, and upregulation of anti-survival Bcl-2 family proteins, including Bax, Bak, Bad, Bim, Bid and Puma. The studies show for the first time that AT-I is an effective drug candidate towards the HT-29 cell. Full article
(This article belongs to the Special Issue Anti-Cancer Drug: Discovery, Development and Combination)
Show Figures

Graphical abstract

Graphical abstract
Full article ">Figure 1
<p>The chemical structure of atractylenolide I.</p>
Full article ">Figure 2
<p>The anti-proliferative effect of various AT-1 concentrations on the HT-29 cell line, after treatment for 24, 48 and 72 h. Data are shown as mean ± SD, <span class="html-italic">n</span> = 6. Significant differences are indicated by ** <span class="html-italic">p</span> &lt; 0.01 and **** <span class="html-italic">p</span> &lt; 0.0001 as compared with the control group.</p>
Full article ">Figure 3
<p>The necrotic effects of various AT-I concentrations on the HT-29 cell line, after treatment for 24, 48 and 72 h, as determined by LDH activity in cell culture medium. The control group was not treated with AT-I, showing little LDH activity. Data are shown as mean ± SD, <span class="html-italic">n</span> = 6. Significant differences are indicated by **** <span class="html-italic">p</span> &lt; 0.0001 as compared with the control group.</p>
Full article ">Figure 4
<p>The effects of various concentrations of AT-I on apoptotic DNA fragmentation in HT-29 cells were assessed using the TUNEL assay and flow cytometry. Cells were treated with AT-I for 48 h and analyzed using flow cytometry. The control group was not treated with AT-I. (<b>a</b>) A dot plot to represent the number of events with fragmented DNA after treatment with various AT-I concentrations, as well as positive and negative controls. This is a representative of three independent experiments. (<b>b</b>) A bar chart to present the apoptotic index after treatment with various AT-I concentrations. Data are shown as mean ± SD, <span class="html-italic">n</span> = 3. Significant differences are indicated by ** <span class="html-italic">p</span> &lt; 0.01 and *** <span class="html-italic">p</span> &lt; 0.001 as compared with the control group.</p>
Full article ">Figure 5
<p>The effects of various concentrations of AT-I on apoptosis in HT-29 cells were assessed by Annexin V-FITC/PI double stain using flow cytometry. Cells were treated with AT-I for 48 h and analyzed using flow cytometry. The control group was not treated with AT-I. (<b>a</b>) A dot plot to represent number of apoptotic events after treatment with various AT-I concentrations, as well as positive and negative controls. This is a representative of three independent experiments. The top left quadrant represents dead cells (PI positive; Annexin V-FITC negative); the bottom left quadrant represents living cells (PI negative; Annexin V-FITC negative); the top right quadrant represents cells in late apoptosis phase (PI positive; Annexin V-FITC positive); the bottom right quadrant represents cells in early apoptosis phase (PI negative; Annexin V-FITC positive). (<b>b</b>) A bar chart to present the percentage of apoptotic cells after treatment with various AT-I concentrations. Data are shown as mean ± SD, <span class="html-italic">n</span> = 3. Significant differences are indicated by *** <span class="html-italic">p</span> &lt; 0.001 as compared with the control group.</p>
Full article ">Figure 5 Cont.
<p>The effects of various concentrations of AT-I on apoptosis in HT-29 cells were assessed by Annexin V-FITC/PI double stain using flow cytometry. Cells were treated with AT-I for 48 h and analyzed using flow cytometry. The control group was not treated with AT-I. (<b>a</b>) A dot plot to represent number of apoptotic events after treatment with various AT-I concentrations, as well as positive and negative controls. This is a representative of three independent experiments. The top left quadrant represents dead cells (PI positive; Annexin V-FITC negative); the bottom left quadrant represents living cells (PI negative; Annexin V-FITC negative); the top right quadrant represents cells in late apoptosis phase (PI positive; Annexin V-FITC positive); the bottom right quadrant represents cells in early apoptosis phase (PI negative; Annexin V-FITC positive). (<b>b</b>) A bar chart to present the percentage of apoptotic cells after treatment with various AT-I concentrations. Data are shown as mean ± SD, <span class="html-italic">n</span> = 3. Significant differences are indicated by *** <span class="html-italic">p</span> &lt; 0.001 as compared with the control group.</p>
Full article ">Figure 6
<p>The effects of various concentrations of AT-I on the expression levels of caspases and PARP in HT-29 cells were assessed by western blotting, after cells were treated with AT-I for 48 h. The control group was not treated with AT-I. Total protein concentration of each sample was determined and normalized. β-tubulin was used as a loading control in all western blot experiments. The intensity of each band was quantified by ImageJ image processing program. (<b>a</b>) Western blot images of pro-caspase 9, cleaved capase 9, pro-caspase 3, cleaved caspase 3, pro-caspase 7, cleaved caspase 7, pro-PARP, cleaved PARP, and β-tubulin. The images are representative of three independent experiments. (<b>b</b>) Each bar chart presents the percentage ratio of each investigated protein to β-tubulin. Data are shown as mean ± SD, <span class="html-italic">n</span> = 3. Significant differences are indicated by * <span class="html-italic">p</span> &lt; 0.1, ** <span class="html-italic">p</span> &lt; 0.01, *** <span class="html-italic">p</span> &lt; 0.001 as compared with the control group.</p>
Full article ">Figure 7
<p>The effects of various concentrations of AT-I on the expression levels of cleaved caspase 8 was assessed by western blotting, after cells were treated with AT-I for 48 h. The control group was not treated with AT-I. Total protein concentration of each sample was determined and normalized. β-tubulin was used as a loading control. The intensity of each band was quantified by ImageJ image processing program. (<b>a</b>) Western blot images of cleaved caspase 8 and β-tubulin. The images are representative of three independent experiments. (<b>b</b>) A bar chart presents the percentage ratio of cleaved caspase 8 to β-tubulin. Data are shown as mean ± SD, <span class="html-italic">n</span> = 3. Significant differences are indicated by * <span class="html-italic">p</span> &lt; 0.1, ** <span class="html-italic">p</span> &lt; 0.01, and **** <span class="html-italic">p</span> &lt; 0.0001 as compared with the control group.</p>
Full article ">Figure 8
<p>The effects of various concentrations of AT-I on the expression levels of the pro-apoptotic Bcl-2 family of proteins in HT-29 cells were assessed by western blotting, after cells were treated with AT-I for 48 h. The control group was not treated with AT-I. Total protein concentration of each sample was determined and normalized. β-tubulin was used as a loading control in all western blot experiments. The intensity of each band was quantified by ImageJ image processing program. (<b>a</b>) Western blot images of Bax, Bak, Bad, Puma, Bim, Bid and β-tubulin. The images are representative of three independent experiments. (<b>b</b>) Each bar chart presents the percentage ratio of each investigated protein to β-tubulin. Data are shown as mean ± SD, <span class="html-italic">n</span> = 3. Significant differences are indicated by * <span class="html-italic">p</span> &lt; 0.1, ** <span class="html-italic">p</span> &lt; 0.01 and *** <span class="html-italic">p</span> &lt; 0.001 as compared with the control group.</p>
Full article ">Figure 8 Cont.
<p>The effects of various concentrations of AT-I on the expression levels of the pro-apoptotic Bcl-2 family of proteins in HT-29 cells were assessed by western blotting, after cells were treated with AT-I for 48 h. The control group was not treated with AT-I. Total protein concentration of each sample was determined and normalized. β-tubulin was used as a loading control in all western blot experiments. The intensity of each band was quantified by ImageJ image processing program. (<b>a</b>) Western blot images of Bax, Bak, Bad, Puma, Bim, Bid and β-tubulin. The images are representative of three independent experiments. (<b>b</b>) Each bar chart presents the percentage ratio of each investigated protein to β-tubulin. Data are shown as mean ± SD, <span class="html-italic">n</span> = 3. Significant differences are indicated by * <span class="html-italic">p</span> &lt; 0.1, ** <span class="html-italic">p</span> &lt; 0.01 and *** <span class="html-italic">p</span> &lt; 0.001 as compared with the control group.</p>
Full article ">Figure 9
<p>The effects of various concentrations of AT-I on the expression levels of pro-survival Bcl-2 family proteins in HT-29 cells were assessed by western blotting, after cells were treated with AT-I for 48 h. The control group was not treated with AT-I. The total protein concentration of each sample was determined and normalized. β-tubulin was used as a loading control in all western blot experiments. The intensity of each band was quantified by the ImageJ image processing program. (<b>a</b>) Western blot images of Bcl-2, Bcl-xL, and β-tubulin. The images are representative of three independent experiments. (<b>b</b>) Each bar chart presents the percentage ratio of each investigated protein to β-tubulin. Data are shown as mean ± SD, <span class="html-italic">n</span> = 3. Significant differences are indicated by ** <span class="html-italic">p</span> &lt; 0.01 and **** <span class="html-italic">p</span> &lt; 0.0001 as compared with the control group.</p>
Full article ">
15 pages, 2008 KiB  
Article
Interactions of Paraoxonase-1 with Pharmacologically Relevant Carbamates
by Anita Bosak, Aljoša Bavec, Tilen Konte, Goran Šinko, Zrinka Kovarik and Marko Goličnik
Molecules 2020, 25(1), 211; https://doi.org/10.3390/molecules25010211 - 4 Jan 2020
Cited by 9 | Viewed by 3410
Abstract
Mammalian paraoxonase-1 hydrolyses a very broad spectrum of esters such as certain drugs and xenobiotics. The aim of this study was to determine whether carbamates influence the activity of recombinant PON1 (rePON1). Carbamates were selected having a variety of applications: bambuterol and physostigmine [...] Read more.
Mammalian paraoxonase-1 hydrolyses a very broad spectrum of esters such as certain drugs and xenobiotics. The aim of this study was to determine whether carbamates influence the activity of recombinant PON1 (rePON1). Carbamates were selected having a variety of applications: bambuterol and physostigmine are drugs, carbofuran is used as a pesticide, while Ro 02-0683 is diagnostic reagent. All the selected carbamates reduced the arylesterase activity of rePON1 towards the substrate S-phenyl thioacetate (PTA). Inhibition dissociation constants (Ki), evaluated by both discontinuous and continuous inhibition measurements (progress curves), were similar and in the mM range. The rePON1 displayed almost the same values of Ki constants for Ro 02-0683 and physostigmine while, for carbofuran and bambuterol, the values were approximately ten times lower and two times higher, respectively. The affinity of rePON1 towards the tested carbamates was about 3–40 times lower than that of PTA. Molecular modelling of rePON1-carbamate complexes suggested non-covalent interactions with residues of the rePON1 active site that could lead to competitive inhibition of its arylesterase activity. In conclusion, carbamates can reduce the level of PON1 activity, which should be kept in mind, especially in medical conditions characterized by reduced PON1 levels. Full article
(This article belongs to the Special Issue Enzymes Reacting with Organophosphorus Compounds)
Show Figures

Figure 1

Figure 1
<p>Structures of selected carbamates.</p>
Full article ">Figure 2
<p>The rates of hydrolysis of phenyl acetate (PA), <span class="html-italic">p</span>-nitrophenyl acetate (PNPA) and of <span class="html-italic">S</span>-phenyl thioacetate (PTA) by rePON1. Points represent average values of three independent experiments corrected for the spontaneous hydrolysis of the corresponding substrate. Solid lines are curves calculated by the Michaelis–Menten equation and the parameters given in <a href="#molecules-25-00211-t001" class="html-table">Table 1</a>.</p>
Full article ">Figure 3
<p>Inhibition of rePON1 hydrolysis of PTA by selected carbamates evaluated by linear regression from at least three experiments.</p>
Full article ">Figure 4
<p>Stability of the activity of the G2E6 variant of rePON1 diluted 3000, 6000, 1200 and 24,000 times.</p>
Full article ">Figure 5
<p>Progress curves for the hydrolysis of PTA by rePON1 in the absence (control) and in the presence of bambuterol (2 mM, 4 mM, 8 mM, 12 mM and 16 mM). The full lines represent theoretical curves calculated using Equation (3).</p>
Full article ">Figure 6
<p>Dependence on inhibitor concentration of normalized <span class="html-italic">k</span>/<span class="html-italic">k</span><sub>0</sub> values for carbofuran (<b>A</b>), physostigmine (<b>B</b>), Ro 02-0683 (<b>C</b>) and bambuterol (<b>D</b>). Lines represent theoretical curves calculated using Equation (5).</p>
Full article ">Figure 7
<p>Simulation of the dissociation complex of PON1 and Ro 02-0683 (<b>A</b>), bambuterol (<b>B</b>), physostigmine (<b>C</b>), and carbofuran (<b>D</b>). Interactions are presented with green (H-bonds), orange (cation-π interaction), and purple (hydrophobic interactions) dashed lines. Residues Tyr71, His134, Asn168, Phe222 and Val346 are singled out as important for the stabilisation of substrate PTA.</p>
Full article ">Figure 8
<p>Proposed transition states on two possible reaction pathways for hydrolysis of an aryl carbamate ester: (<b>a</b>) via an energetically less favoured addition-elimination (B<sub>Ac</sub>2) mechanism, or (<b>b</b>) via the energetically more favoured elimination-addition (E1cB) mechanism. The latter mechanism is not possible for carbamate esters lacking an N-H group.</p>
Full article ">Scheme 1
<p>The model of competitive inhibition at substrate unsaturated conditions.</p>
Full article ">
11 pages, 1396 KiB  
Article
Extraction of High Value Triterpenic Acids from Eucalyptus globulus Biomass Using Hydrophobic Deep Eutectic Solvents
by Nuno H. C. S. Silva, Eduarda S. Morais, Carmen S. R. Freire, Mara G. Freire and Armando J. D. Silvestre
Molecules 2020, 25(1), 210; https://doi.org/10.3390/molecules25010210 - 4 Jan 2020
Cited by 38 | Viewed by 5152
Abstract
Triterpenic acids (TTAs), known for their promising biological properties, can be found in different biomass sources and related by-products, such as Eucalyptus globulus bark, and have been extracted using organic volatile solvents such as dichloromethane. Recently, deep eutectic solvents (DES) have been identified [...] Read more.
Triterpenic acids (TTAs), known for their promising biological properties, can be found in different biomass sources and related by-products, such as Eucalyptus globulus bark, and have been extracted using organic volatile solvents such as dichloromethane. Recently, deep eutectic solvents (DES) have been identified as promising alternatives for the extraction of value-added compounds from biomass. In the present work, several hydrophobic DES were tested for the extraction of TTAs from E. globulus bark. Initial solubility studies revealed that DES based on menthol and thymol as the most promising solvents for these compounds given the highest solubilities obtained for ursolic acid (UA) at temperatures ranging from room temperature up to 90 °C. Accordingly, an eutectic mixture of menthol:thymol (1:2) was confirmed as the best candidate for the TTAs extraction from E. globulus outer bark, leading to extraction yields (weight of TTA per weight of biomass) at room temperature of 1.8 wt% for ursolic acid, 0.84 wt% for oleanolic acid and 0.30 wt% for betulinic acid. These values are significantly higher than those obtained with conventional organic solvents under similar conditions. The results obtained using these DES are promising for the recovery of TTAs for nutraceutical and pharmacological applications, while reinforcing the potential of DES as promising solvents to be applied in biorefinery processes. Full article
(This article belongs to the Special Issue Deep Eutectic Solvents)
Show Figures

Graphical abstract

Graphical abstract
Full article ">Figure 1
<p>Chemical structure of the three main triterpenic acids present in <span class="html-italic">Eucalyptus</span> species outer bark.</p>
Full article ">Figure 2
<p>Chemical structures the individual components of the deep eutectic solvents (DES) prepared, as well as other bio-based solvents used in this work.</p>
Full article ">Figure 3
<p>Solubility of ursolic acid (UA) in different solvents: limonene, α-pinene, γ-valerolactone, menthol, thymol, menthol:phenyl propionic acid (PPA) (Men:PPA), menthol:thymol (Men:Thy) at 60 °C; comparison with some volatile organic solvents: n-hexane and ethanol.</p>
Full article ">Figure 4
<p>Solubility of ursolic acid (UA) in menthol and thymol at 60 °C and in menthol:thymol natural deep eutectic solvents (NADES) in different proportions (1:1, 1:2, 2:1) at different temperatures (RT, 60, 75, 90 °C).</p>
Full article ">Figure 5
<p>Extraction yields of ursolic (UA), oleanolic (OA) and betulinic (BA) acids, using different ratios of biomass/solvent at 90 °C.</p>
Full article ">Figure 6
<p>Extraction yields of ursolic, oleanolic and betulinic acids, using Soxhlet extraction with dichloromethane, and simple solid–liquid extraction with the NADES menthol:thymol 1:2 (0.15 g biomass/g DES), at room temperature (RT), 60 and 90 °C.</p>
Full article ">
20 pages, 2693 KiB  
Article
Pharmacokinetic Comparison of Epinastine Using Developed Human Plasma Assays
by Seung-Hyun Jeong, Ji-Hun Jang, Hea-Young Cho and Yong-Bok Lee
Molecules 2020, 25(1), 209; https://doi.org/10.3390/molecules25010209 - 3 Jan 2020
Cited by 3 | Viewed by 4105
Abstract
The purpose of the study was to develop two new methods, HPLC-UV and UPLC-MS/MS, for quantifying epinastine in human plasma and to compare pharmacokinetic (PK) parameters obtained using them. Even in the same sample, there may be a difference in the quantitative value [...] Read more.
The purpose of the study was to develop two new methods, HPLC-UV and UPLC-MS/MS, for quantifying epinastine in human plasma and to compare pharmacokinetic (PK) parameters obtained using them. Even in the same sample, there may be a difference in the quantitative value of drug depending on the assay, so that minor changes in PK parameter values may affect drug dose and usage settings. Therefore, selection and establishment of analytical methods are very important in PK studies of drugs, and a comparison of PK parameters according to analytical methods will be vital. For this study of PK parameter change, we newly developed two methods, HPLC-UV and UPLC-MS/MS, which are most commonly used to quantify epinastine concentrations in human plasma. All developed methods satisfied the international guidelines and criteria for successful application to PK study of 20 mg epinastine hydrochloride tablets after oral administration to twenty-six humans. A comparison of these two methods for in vivo analysis of epinastine was performed for the first time. This comparison study confirmed that different dose and usage settings might be possible based on PK parameters calculated using other analyses. Such changes in calculated PK parameters according to analytical methods would be crucial in the clinic. Full article
(This article belongs to the Special Issue Method Development and Validation in Food and Pharmaceutical Analysis)
Show Figures

Graphical abstract

Graphical abstract
Full article ">Figure 1
<p>Positive product ion mass spectra in UPLC-MS/MS quantification; (<b>A</b>) epinastine; (<b>B</b>) bambuterol (IS). IS: internal standard.</p>
Full article ">Figure 2
<p>Representative chromatograms of epinastine and IS in MRM (multiple reaction monitoring) positive mode of UPLC-MS/MS (<b>A</b>) and HPLC-UV (<b>B</b>) method in human plasma.</p>
Full article ">Figure 3
<p>Chromatograms of blank plasma (<b>A</b> and <b>E</b>), zero plasma containing IS (<b>B</b> and <b>F</b>), blank plasma containing LLOQ (lower limit of quantitation) of epinastine and IS (<b>C</b> and <b>G</b>), the plasma sample at 2 h after oral administration of 20 mg epinastine hydrochloride tablet (<b>D</b> and <b>H</b>); A–D, UPLC-MS/MS; E–H, HPLC-UV.</p>
Full article ">Figure 4
<p>Mean plasma concentration-time profiles of epinastine after oral administration of 20 mg epinastine hydrochloride tablet based on UPLC-MS/MS (-○-) and HPLC-UV (-●-) methods. Vertical bars represent the standard deviation of the mean (n = 26).</p>
Full article ">Figure 5
<p>Comparative analysis of samples using HPLC-UV (<span class="html-italic">x</span>-axis) and UPLC-MS/MS (<span class="html-italic">y</span>-axis) (<b>A</b>), and correlation of the method differences between HPLC-UV (<span class="html-italic">x</span>-axis) and UPLC-MS/MS – HPLC-UV (<span class="html-italic">y</span>-axis) (<b>B</b>). The straight line represents the linear regression line, and the dashed line shows a 95% prediction interval line.</p>
Full article ">Figure 6
<p>Simulation (mean value) graphs of multiple doses based on single-dose (mean) data of epinastine hydrochloride obtained using HPLC-UV (straight line) and UPLC-MS/MS (dashed line); (<b>A</b>) multiple simulation graph pattern; (<b>B</b>) estimated PK (pharmacokinetic) graph from 0 to 24 h at steady-state.</p>
Full article ">Figure 7
<p>Chemical structures of epinastine hydrochloride and bambuterol hydrochloride (internal standard).</p>
Full article ">
Previous Issue
Back to TopTop