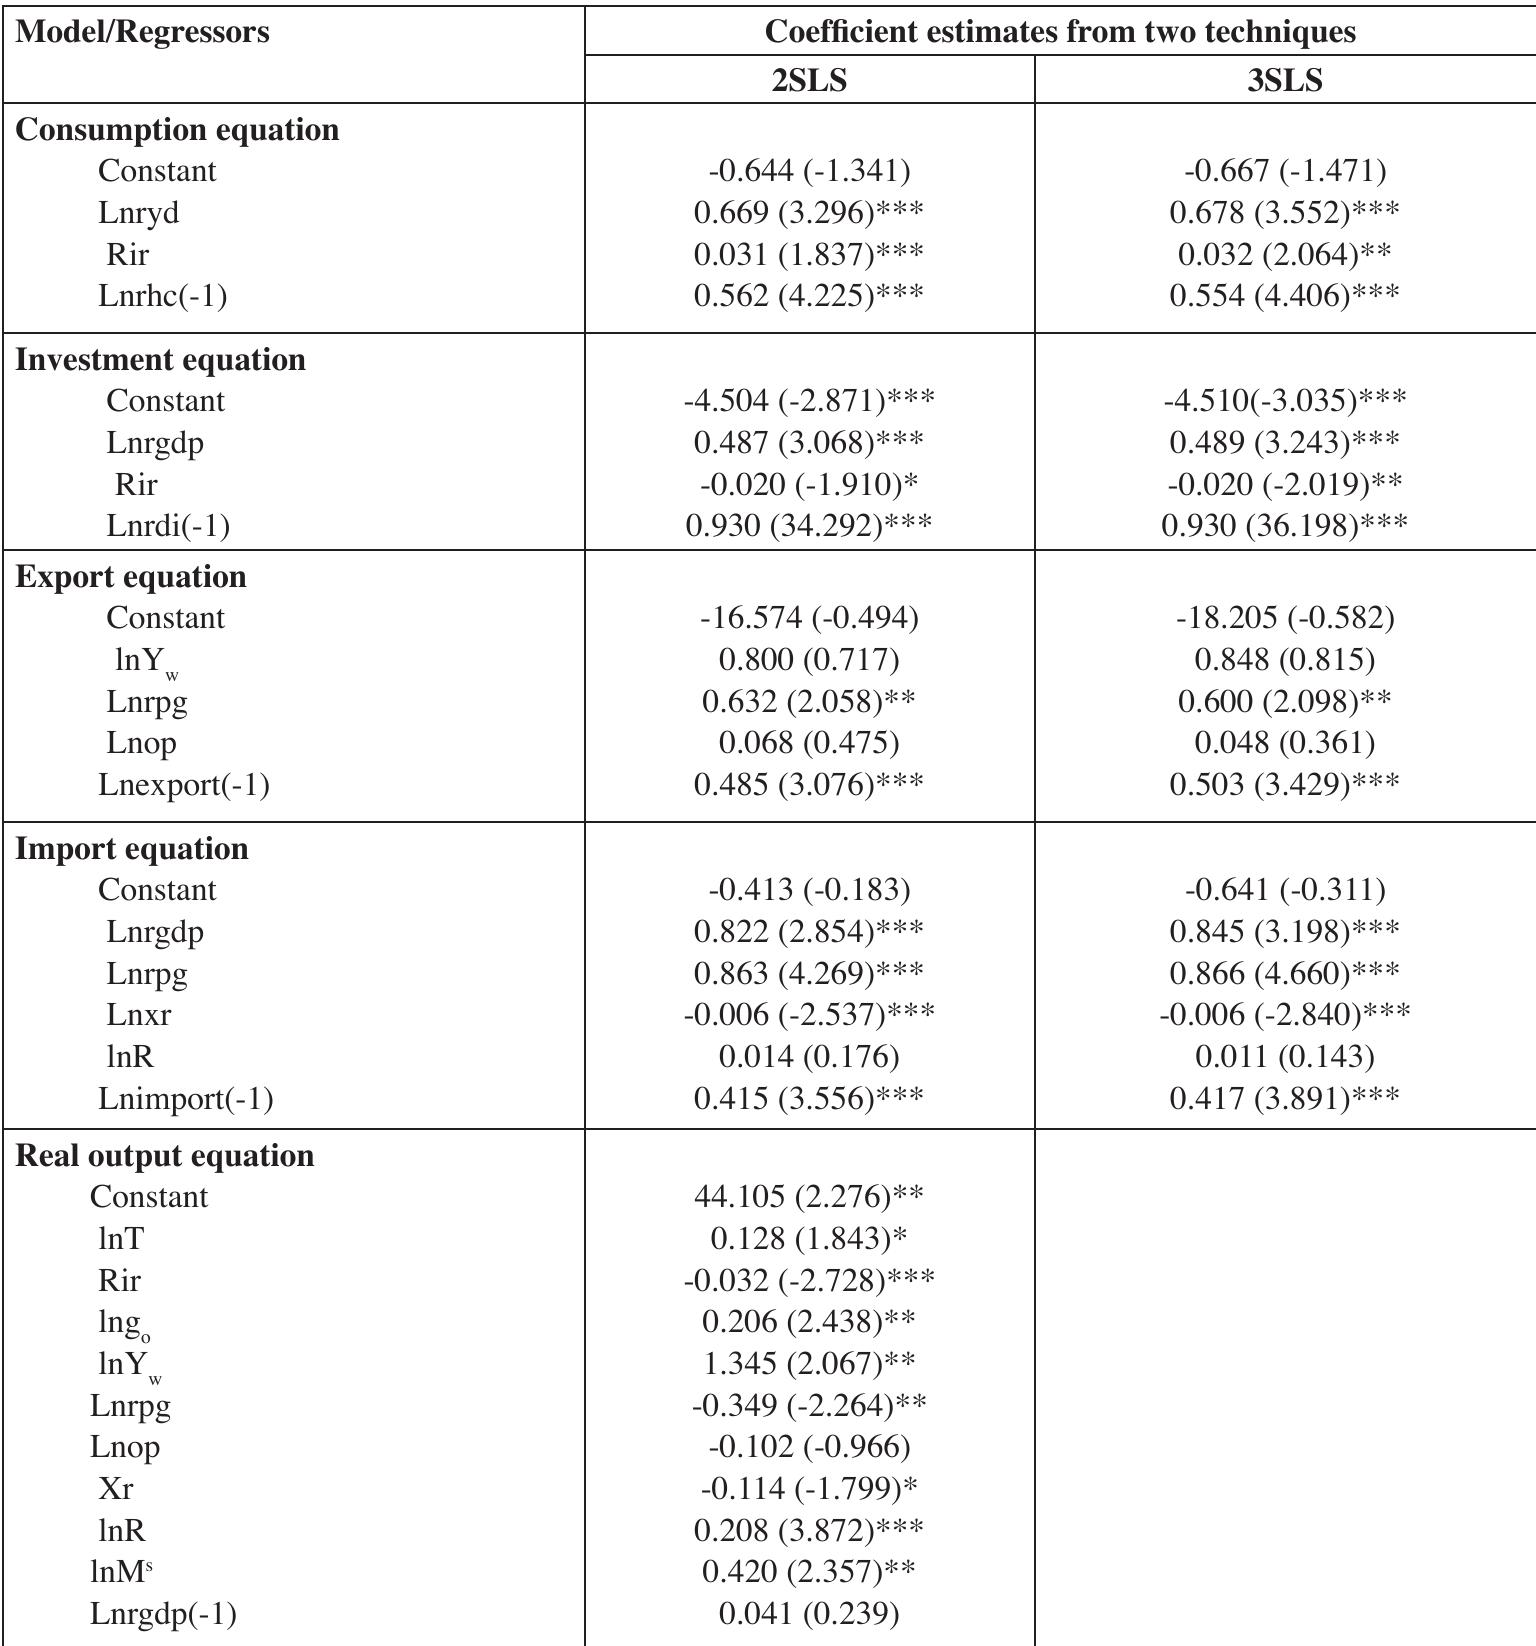
Table 2 ee and * denote significance at 1%, 5% and 10%, respectively. Table 2: 2SLS and 3SLS Regression Results
Related Figures (5)
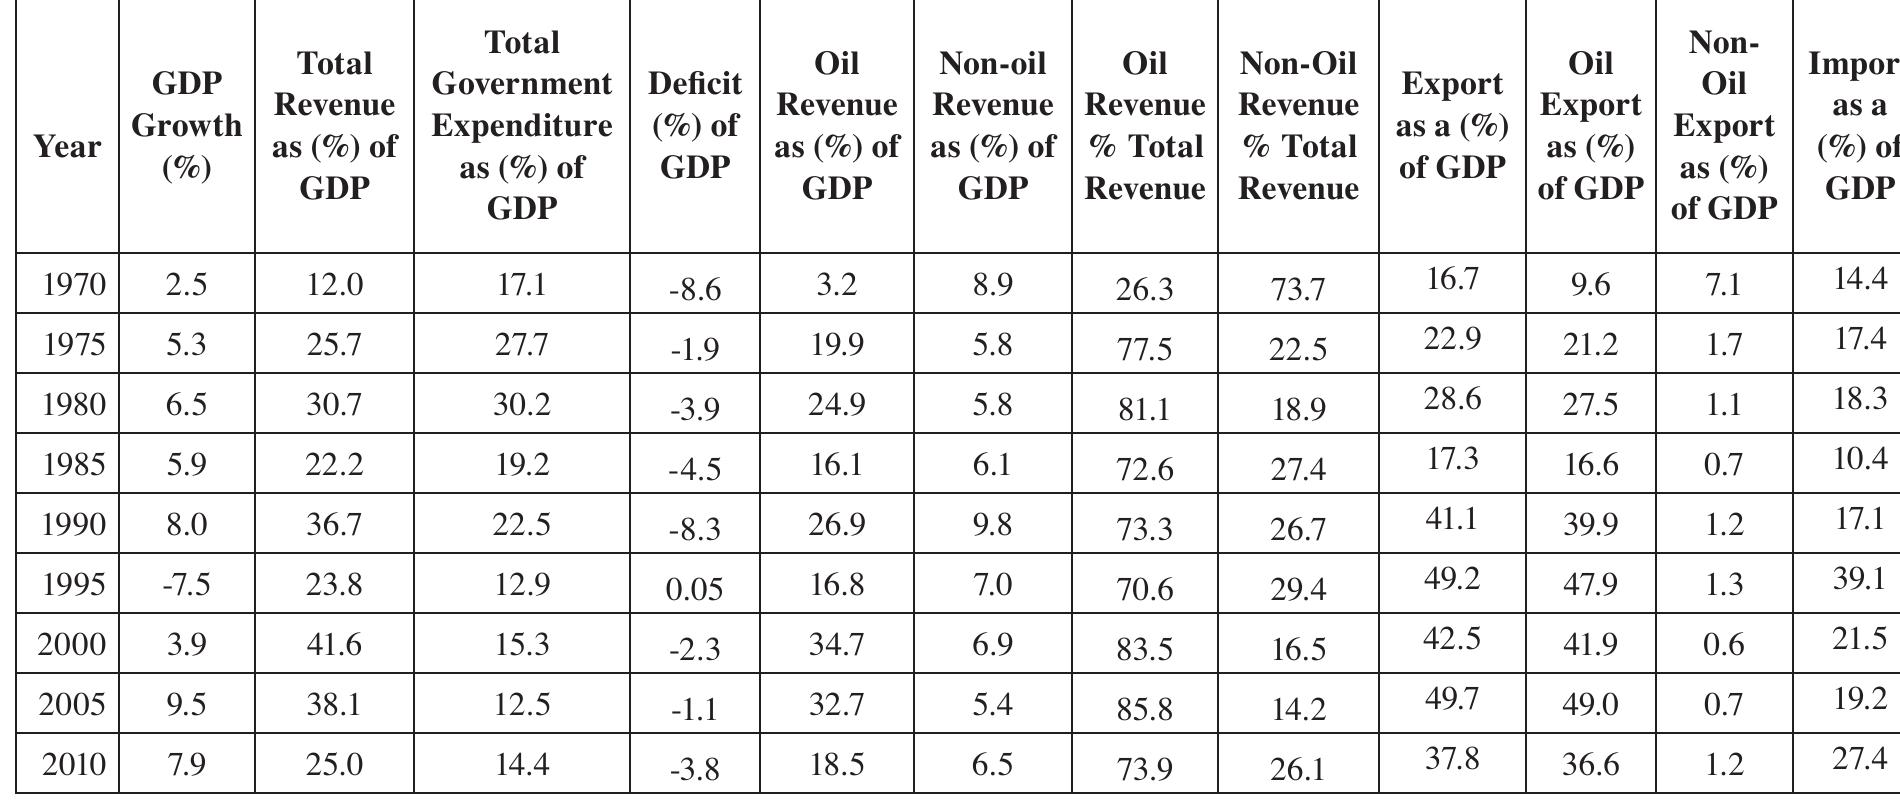
Source: CBN Statistical Bulletin and Annual Reports and Statements of Accounts, Various Issues
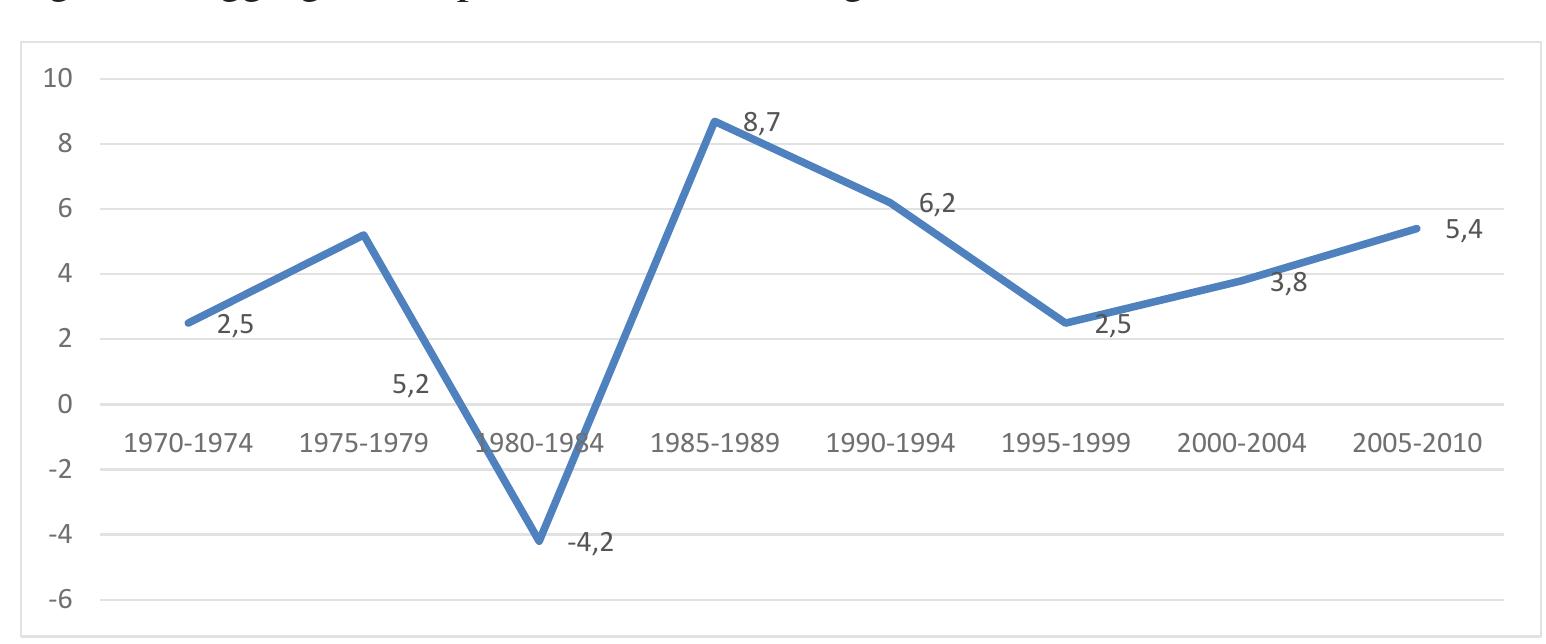
Source: Underlying data are from Central Bank of Nigeria’s Statistical Bulletin and Annual Report and Statement
of Accounts- various years
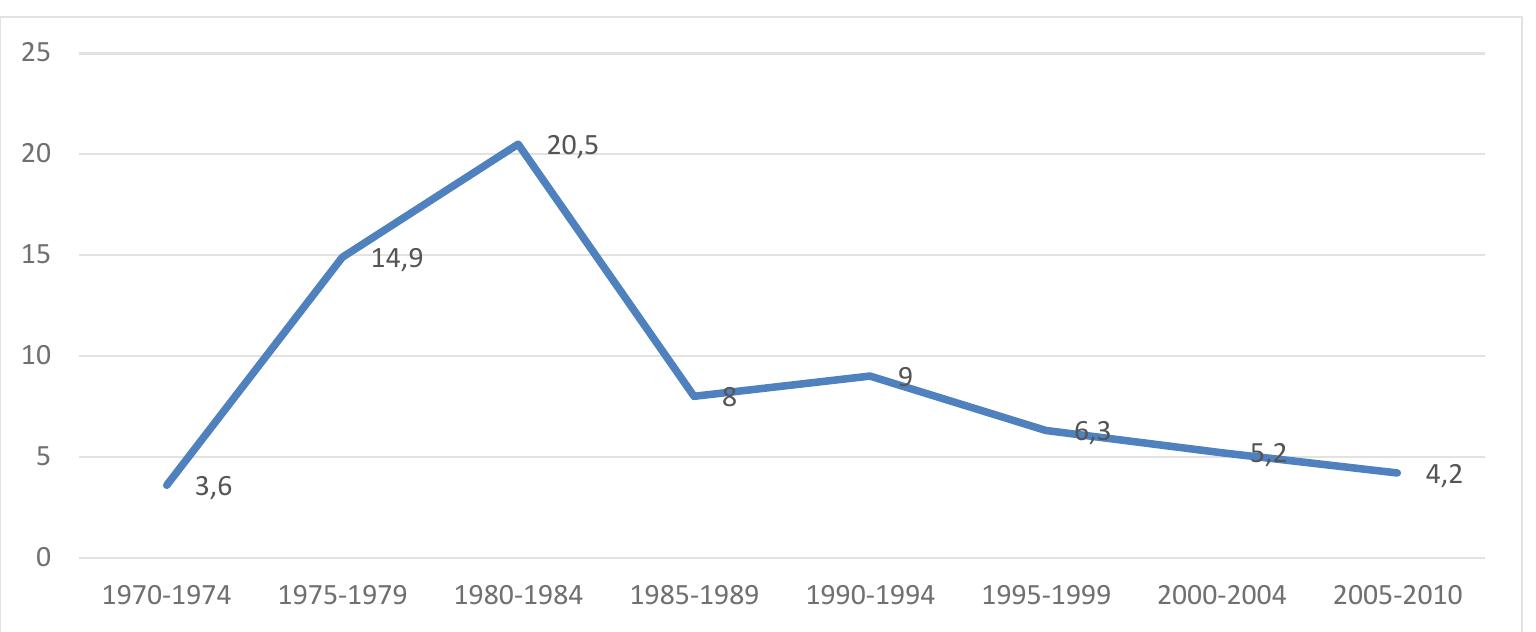
Figure 2: Public Investments contribution to Output in Nigeria (1970-2010)
Source: Underlying data are from Central Bank of Nigeria’s Statistical Bulletin and Annual Report and Statement
of Accounts- various years
Methodological Approach and Model Specification
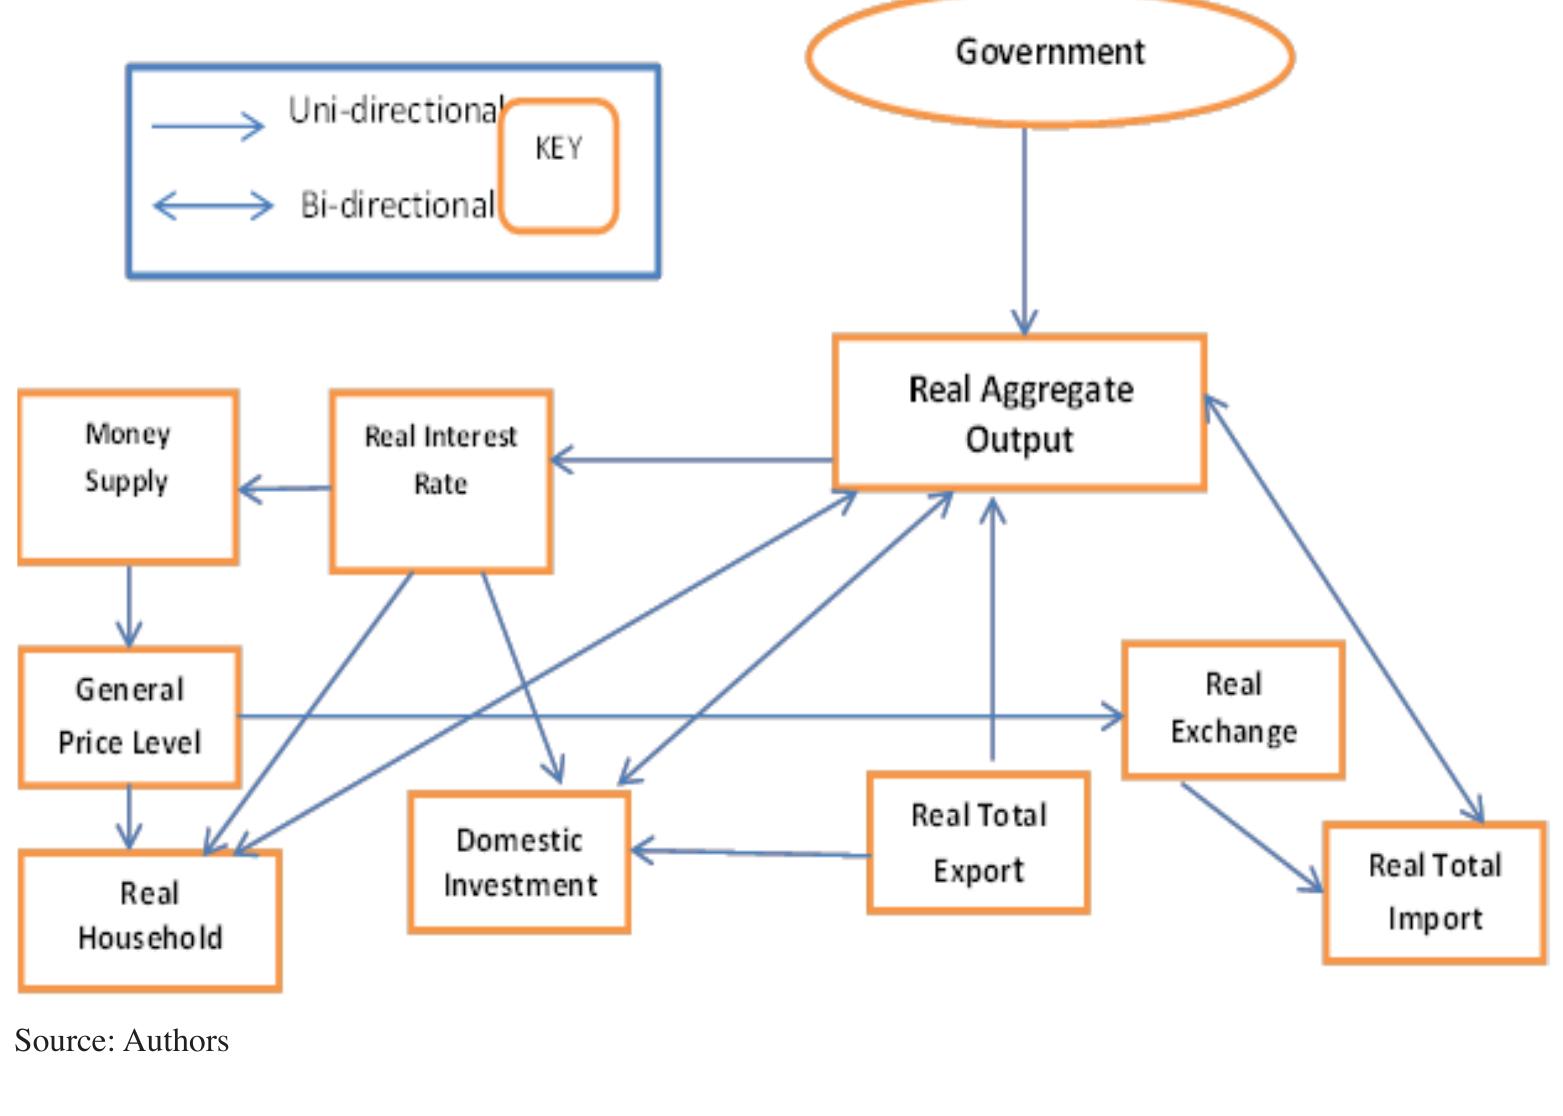
Figure 3: Schematic Representation of the Macroeconomic Model
Conclusion