Public Investment and Output Performance: Evidence from Nigeria
 Taofik M Ibrahim
visibility
…
description
24 pages
link
1 file
Sign up for access to the world's latest research
checkGet notified about relevant papers
checkSave papers to use in your research
checkJoin the discussion with peers
checkTrack your impact
Abstract
This study examined the direct/indirect long-run relationships and dynamic interactions between public investment (PI) and output performance in Nigeria using annual data spanning 1970-2010. A macro-econometric model derived from Keynes' income-expenditure framework was employed. The model was disaggregated into demand and supply sides to trace the direct and indirect effects of PI on aggregate output. The direct supply side effect was assessed using the magnitude of PI multiplier coeffi cient, while the indirect effect of PI on the demand side was evaluated with marginal propensity to consume, accelerator coeffi cient and import multiplier. The results showed relatively less strong direct effect of PI on aggregate output, while the indirect effects were stronger with the import multiplier being the most pronounced. This is attributed to declining capital expenditure, poor implementation and low quality of PI projects due to widespread corruption. By and large, we concluded that PI exerted considerable infl uence on aggregate output.
Figures (6)
Related papers
An Analysis of the Relationship between Public Spending Components and Private investments in Nigeria
This paper examined the relationship between components of public spending and private investments in Nigeria for the period 1981 to 2010. Utilizing an error correction modeling procedure, the study revealed that components of public spending have different impact on private investment both in the long run and the short run. Specifically, recurrent and government final consumption expenditure had positive (crowd-in) effect on private investment while capital expenditure had negative (crowd-out) effect on private investment. Thus, the study recommended that greater emphasis should be placed on capital expenditure.
An Analysis of the Macroeconomic Determinants of Public Capital Spending in Nigeria
Journal of economics and sustainable development, 2012
This paper examines the macroeconomic determinants of public capital spending in Nigeria. It reveals the daunting challenge of poverty (poor roads and portable water, poor health care delivery system, inadequate power supply, low quality of education, unhygienic environment and unreliable security system for life and property) that Nigeria exhibits simultaneously with the declining trend and unstable pattern of public capital spending. Although, the nominal values of public capital spending over the years reveal huge allocations; the real values mirror an overwhelming decline, as four-fifths of Nigeria’s spending is on consumption. Public capital spending plays an undeniable significant role in the growth and development of any nation since it spurs private investment and invariably the general productivity level. The need to reverse this persistent decline in public capital spending in Nigeria necessitates this study. This paper attempts to test for the macroeconomic determinants o...
The Impact of Public Capital Expenditure and Economic Growth in Nigeria
This paper examines the impact of public capital expenditure on economic growth in Nigeria in the context of macro-econometric framework at sectoral levels. The research adopts a three-stage least squares (3SLS) technique and macro-econometric model of simultaneous equations to capture the disaggregated impact of public capital expenditure on the different sectors of the economy. The study shows that public capital expenditure contributes positively to economic growth in Nigeria. The results also indicate that public capital expenditure directly promotes the output of oil and infrastructure but is directly deleterious to the output of manufacturing and agriculture. The results suggest a positive but insignificant relationship to the services sector. The results however confirm that public capital spending indirectly enhances economic growth by encouraging private sector investments due to the facilitating role of government in the provision of public goods. This study therefore recommends the privatisation of the State owned enterprises and use of the publicprivate– partnership (PPP) arrangements to engender efficiency and effectiveness in public service delivery.
An Analysis of the Effect of Government Expenditure on Gross Domestic Private Investment in Nigeria 1975-2009
European Scientific Journal, 2012
The paper analyses the effect of government expenditure on gross domestic private investment in Nigeria using time series annual data for 34 years. Multiple regression and cointegration methods were used to analyse the data. Result of the analysed data revealed that the actual impact of government expenditure on private investment varies depending on the type of expenditure under consideration. The negative relationship established that the federal government recurrent expenditure crowded out or substituted for private investment in the period under study. Furthermore, the study revealed a positive effect of inflation rate on private investment. The analysis suggests that government should give more priorities to expenditures that compliment private investment rather than spending on expenditures that substitute for private investment.
Crowding in or Crowding Out? Government Spending and Private Investment: The Case of Nigeria
European Scientific Journal, 2012
This paper uses the multiple regression analyses to investigate the extent to which government spending crowd in or crowd out private investment in Nigeria. The analysis is conducted using 34 years of annual data for Nigeria. The paper lays emphasis on disaggregating the capital and recurrent spending of the federal government and examining their separate effect on private investment. The analysis suggests that effective macroeconomic management be ensued in order to cushion the adverse effect of rising inflation on private investment.
Zagreb International Review of Economics & Business, Vol. 19, No. 1, pp. 1-24, 2016
© 2016 Faculty of Economics and Business, University of Zagreb and De Gruyter Open
All rights reserved. Printed in Croatia
ISSN 1331-5609; UDC: 33+65
DOI: 10.1515/zireb-2016-0001
Public Investment and Output Performance:
Evidence from Nigeria
Omo Aregbeyen *
Taofik Ibrahim Mohammed **
Abstract: This study examined the direct/indirect long-run relationships and dynamic interactions
between public investment (PI) and output performance in Nigeria using annual data
spanning 1970-2010. A macro-econometric model derived from Keynes’ income-expenditure framework was employed. The model was disaggregated into demand and supply
sides to trace the direct and indirect effects of PI on aggregate output. The direct supply
side effect was assessed using the magnitude of PI multiplier coefficient, while the indirect
effect of PI on the demand side was evaluated with marginal propensity to consume, accelerator coefficient and import multiplier. The results showed relatively less strong direct
effect of PI on aggregate output, while the indirect effects were stronger with the import
multiplier being the most pronounced. This is attributed to declining capital expenditure,
poor implementation and low quality of PI projects due to widespread corruption. By and
large, we concluded that PI exerted considerable influence on aggregate output.
Keywords: Public Investment; Output performance; income-expenditure framework; Macro-econometric simulation, Nigeria.
JEL Classification: H5, H50, H54
Introduction
The relationship between PI and economic growth has continued to generate debate in the academic and policy arena. The Keynesians contend that the provision
of public goods and services plays a central role towards solving collective action
problems and serve as a panacea for sustainable economic growth and development.1
The non-Keynesians emphasised the scope for rent-seeking in the determination of
*
Omo Aregbeyen is at Department of Economics, University of Ibadan, Ibadan, Nigeria.
Taofik Ibrahim Mohammed is at Nigerian Institute of Social and Economic Research (NISER),
Ibadan, Nigeria.
**
- 10.1515/zireb-2016-0001
1 from PubFactory at 08/26/2016 10:47:44PM
Downloaded
via free access
2
Omo Aregbeyen, Taofik Ibrahim Mohammed
PI, and the resulting low social returns on a number of investment projects carried out
by government of developing countries. The argument in support of the latter view
is that high PI may inhibit the overall performance of the economy. For instance, in
an attempt to finance PI, government may increase taxes and/or borrowing. Apparently, high income tax will be a disincentive to workers while borrowing enlarges or
creates fiscal deficits.2
Ascertaining the efficiency effects of PI is a key factor in the design of adjustment policies in developing countries. Governments in considering tinkering with
fiscal adjustments for economic growth have to face the question of how to cut public
investment vis-à-vis recurrent expenditures. Reducing recurrent expenditures often
lead to the retrenchment of public sector workers and cutting the operating expenditures of government. This can be a politically complex decision. In contrast, reducing
PI may result in few new projects as well as the abandonment of old projects. This
perhaps explains why it is not surprising that governments facing the two contending
adjustment programmes often decide to maintain recurrent expenditures while significantly curtailing public investment. When fiscal deficits are reduced by cutting
productive PIs, it could be illusory in that it would not take into account the reduction
in government net worth arising from the loss of revenue occasioned by reduced expected future national income.
In Nigeria, government expenditure has continued to rise in nominal and real
terms, partly due to the huge receipts from production and sales of crude oil, as well
as the increased demand for public goods. Meanwhile, the ratio of PI to government
expenditure has been fluctuating over the years. For instance, average annual growth
rate of PI was 3.6% between 1970 and 1974; it increased significantly to 20.5% between 1980 and 1984 and declined steadily to 9.0% and 4.2% from 1990 to 1994 and
from 2005 to 2010, respectively. Over the same periods, the average output growth
fluctuated considerably between 2.5% and 6.2%. Thus, there is a divergence between
growth in PI and output performance. Consequently, this study examined the effect
of PI on aggregate output in Nigeria between 1970 and 2010; and identified the channels through which PI affected aggregate output.
A macro-econometric model derived from Keynes’ income-expenditure framework and disaggregated into demand and supply sides to trace the direct and indirect
effects of PI on aggregate output was employed. The direct effect was assessed using
the magnitude of PI multiplier coefficient on aggregate output. The indirect effect of
PI on demand side was evaluated with marginal propensity to consume, accelerator
coefficient and import multiplier. The models were estimated via a superior and more
policy applicable instrumental variable techniques; two-stage-least square (2SLS)
and three-stage-least square (3SLS). Summarily, the results obtained indicated that
PI exerted considerable influence over aggregate output.
The rest of the paper has six main sections. Section II presents stylised facts on
the Nigerian economy while section III profiled output and public investment over the
- 10.1515/zireb-2016-0001
Downloaded from PubFactory at 08/26/2016 10:47:44PM
via free access
Public Investment and Output Performance: Evidence from Nigeria
3
study period. Review of the literature on the relationship between output and PI was
undertaken in section IV. The theoretical framework and methodological approach
to the study were outlined section V. Section VI discussed the empirical results and
findings while the concluding remarks are contained in section VII.
Overview of the Nigerian Economy
In the beginning and indeed, at independence in 1960, the agricultural sector dominated the economy, accounting for 70 per cent of the GDP, about two-thirds of labour
employment, provided substantial raw materials for industries and more than 90 per
cent of exports; and was therefore the mainstay of the Nigerian economy. But as petroleum became increasingly significant to the economy in the 1960s, culminating in
a boom in the 1970s, agriculture thereafter grew slowly and its relative contributions
to macroeconomic aggregates declined. Thus, the 1970s marked an important turning point in the socio-political and economic development of Nigeria. There occurred
a dramatic change in the main source of growth of the economy- a spontaneous
switch from predominantly agricultural economy to one driven largely by crude oil,
following a boom in 1973/74 caused by a favourable external shock in the oil market.
Accordingly, oil became very significant, contributing tremendously to GDP (over
45%), government finances (over 70%) and foreign exchange earnings (at least 80 %).
Presently, Nigeria is the second largest exporter of oil in Africa and the twelfth in the
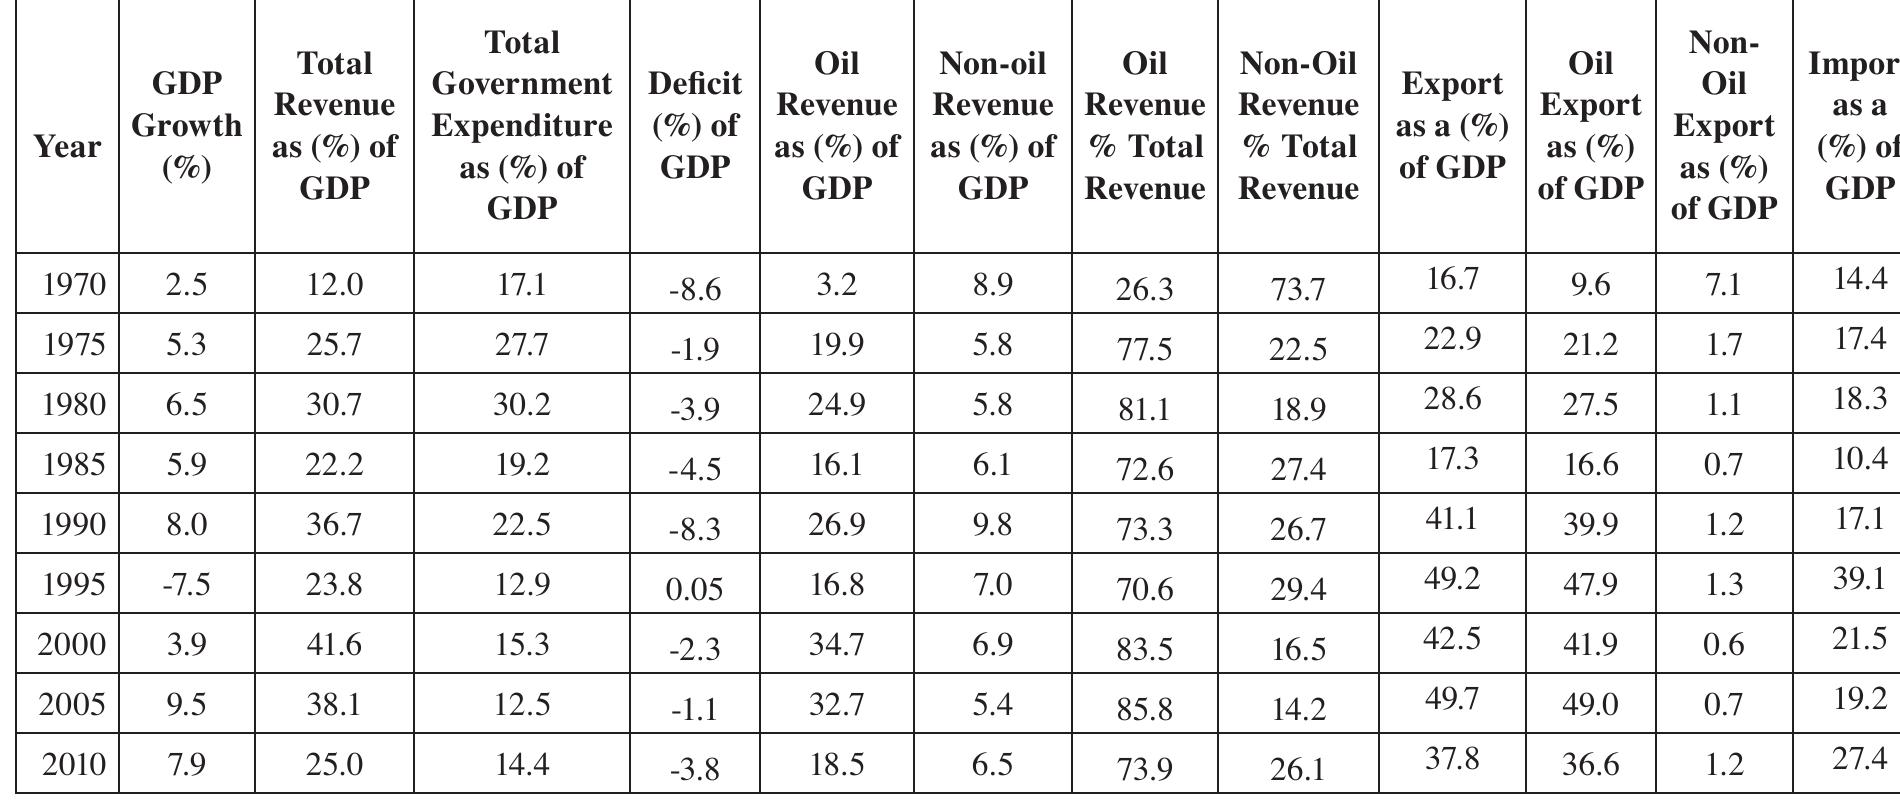
world. Table 1 presents selected relevant economic indicators from 1970-2010.
The oil boom, however, brought with it some fundamental changes and developments in the economy, some of which were the afflictions of the economy with
the “Dutch Disease”, the erosion of the competitiveness of the agricultural sector by
an overvalued exchange rate, inadequate pricing policies, rural-urban migration and
neglect arising from the oil boom syndrome. The new oil wealth radically affected
the scope and content of government investment, production and consumption patterns, the government’s approach to economic management and policies and programmes implementation. The structure of policy incentives and controls encouraged import-substitution production and consumption patterns with little incentives
for on-oil exports. More importantly, the public sector became the prime mover
of the economy through direct participation in basic production and investment of
growing oil revenues in social, physical and economic infrastructure in all sectors of
the economy. Consequently, government expenditure has continued to rise in nominal and real terms, partly due to the huge receipts from production and sales of crude
oil, as well as the increased demand for public goods. Nevertheless, the ratio of public
investment from government expenditure has fluctuated over the years. Aggregate
and sectoral outputs have also declined over time, except for crude petroleum sector;
the contributions of the other sectors to aggregate output have been generally low.
- 10.1515/zireb-2016-0001
Downloaded from PubFactory at 08/26/2016 10:47:44PM
via free access
4
Table 1: Selected Indicators of the Economy of Nigeria (1970-2010)
Total
GDP
Revenue
Growth
Year
as (%) of
(%)
GDP
Total
Government
Expenditure
as (%) of
GDP
Oil
Non-oil
Oil
Non-Oil
Deficit
Revenue Revenue Revenue Revenue
(%) of
as (%) of as (%) of % Total % Total
GDP
GDP
GDP
Revenue Revenue
1970
2.5
12.0
17.1
-8.6
3.2
8.9
26.3
73.7
1975
5.3
25.7
27.7
-1.9
19.9
5.8
77.5
22.5
22.9
1.7
17.4
40.3
0.63
27.5
1.1
18.3
46.9
0.54
16.6
0.7
10.4
27.7
1.0
58.2
9.0
21.2
1980
6.5
30.7
30.2
-3.9
24.9
5.8
81.1
18.9
28.6
1985
5.9
22.2
19.2
-4.5
16.1
6.1
72.6
27.4
17.3
26.7
41.1
39.9
1.2
17.1
47.9
1.3
39.1
88.3
84.58
41.9
0.6
21.5
64.0
109.55
68.9
130.4
65.2
148.67
1990
8.0
36.7
22.5
-8.3
26.9
9.8
1995
-7.5
23.8
12.9
0.05
16.8
7.0
70.6
29.4
49.2
2000
3.9
41.6
15.3
-2.3
34.7
6.9
83.5
16.5
42.5
49.0
0.7
19.2
36.6
1.2
27.4
73.3
2005
9.5
38.1
12.5
-1.1
32.7
5.4
85.8
14.2
49.7
2010
7.9
25.0
14.4
-3.8
18.5
6.5
73.9
26.1
37.8
Source: CBN Statistical Bulletin and Annual Reports and Statements of Accounts, Various Issues
Omo Aregbeyen, Taofik Ibrahim Mohammed
- 10.1515/zireb-2016-0001
Downloaded from PubFactory at 08/26/2016 10:47:44PM
via free access
Export
NonExchange
Oil
Import
+
Export
Oil
rate
Export
as a
Import
as a (%)
Export
(Naira/
as (%)
(%) of
as a
of GDP
as (%)
US
of GDP
GDP
(%) of
of GDP
Dollar)
GDP
16.7
14.4
31.1
9.6
7.1
0.71
Public Investment and Output Performance: Evidence from Nigeria
5
In addition, the combination of factors such as low private, particularly domestic investment due to dilapidated infrastructure (especially roads and power supply), large
current account imbalance caused by high import values and the inefficiencies in
the management of public expenditure (occasioned by widespread corruption), which
were ignored or camouflaged by substantial government transfers in the form of subsidies or subventions have not made Nigeria fared well in the last couple of years.
The Nigerian economy, therefore, has a large non-tradable sector (government
services) and an export-oriented primary sector – mainly crude oil and agriculture.
However, the revenues from the oil sector over time have not been used to properly
develop other sectors and diversify the economy, thus resulting in non-inclusive economic growth, going by the high unemployment level and poverty incidence in the
country. Thus, the Nigerian economy is susceptible to exogenous shocks such as fluctuations in oil price and international business cycles. The main trading partners are
United States of America (USA), Spain, Brazil, Ivory Coast, China, Netherlands and
United Kingdom. Nigeria’s economy is closely linked to that of the USA and increasingly China too in recent time. Both countries are main trading partners to Nigeria
with about 60 percent of exports to USA, while about 50 percent of its imports come
from the USA and China.
In summary, the key features of the Nigerian economy include dominance of
agriculture (with a dualistic structure), low industrial development, large size of the
informal sector, oil revenue dominate total revenue, oil export accounts for 80% of
total exports, highly-import dependent economy, multinational corporation in-charge
of mining, and huge size of the public sector and the associated poor financial management.
Output and Public Investment Profile in Nigeria (1970-2010)
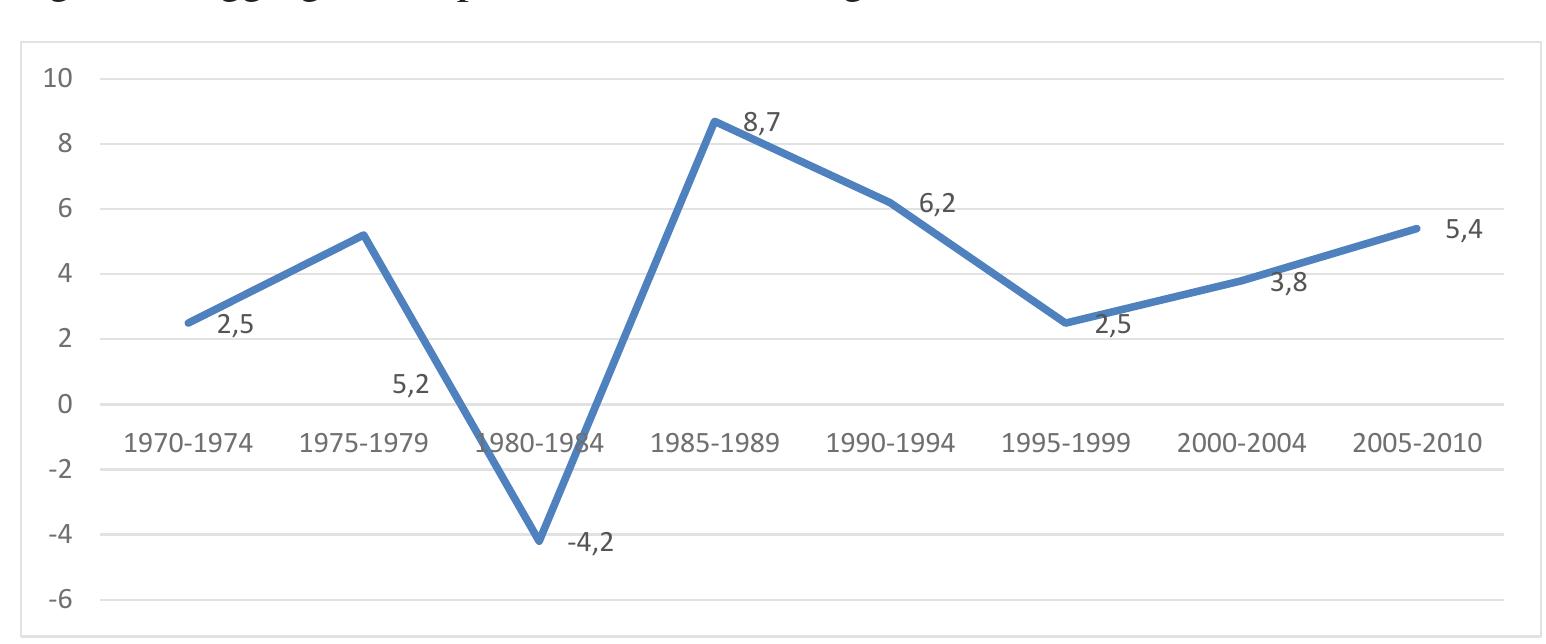
The output (measured by real GDP growth) history of Nigeria’s economy has been
unstable over the years. During the oil boom eras, 1970-1974 and 1975-1979; output
grew by 2.5% and 5.2 % annually respectively. However, in the early 1980s, it declined. Between 1980 and 1984, it fell to 4.2%. During the structural adjustment and
economic liberalisation era (1985 to 1989), output responded to economic adjustment
policies and grew positively and steadily and peaked at 8.7 %. It then decreased to
6.2% during 1990-1994 and sharply further to 2.5% between 1995 and 1999. Output
level improved marginally between 2000 and 2004 to 3.8 %, linked to the increase in
the volume of crude oil exported and the high prices. From 2005 to 2010, output level
which averaged 5.4 %, is lower than the targeted 10.0% anticipated in the national
development strategy document. Despite the negative effects of the global economic
crisis which started in 2007 and continued till 2010, output levels remain positive and
significant (see Figure 1).
- 10.1515/zireb-2016-0001
Downloaded from PubFactory at 08/26/2016 10:47:44PM
via free access
6
Omo Aregbeyen, Taofik Ibrahim Mohammed
Figure 1: Aggregate Output Growth (%) in Nigeria (1970-2010)
10
8,7
8
6,2
6
5,4
4
2
3,8
2,5
2,5
5,2
0
1970-1974
1975-1979
1980-1984
1985-1989
1990-1994
1995-1999
2000-2004
2005-2010
-2
-4
-4,2
-6
Source: Underlying data are from Central Bank of Nigeria’s Statistical Bulletin and Annual Report and Statement
of Accounts- various years
Just like the output trajectory and perhaps at the instances of it, the policy focus of
PI has been characterised by momentous shifts. During the colonial era, PI revolved
around the support of private sector leadership through the provision of financial assistance and infrastructure, such as electricity, railway and telecommunications. The
post-colonial policy on public enterprise (although a bit unstable) also rested largely
on the ideology that government investment in public enterprises should aim at promoting private investment. In the 1960 budget speech, the government stated that
direct investment in industrial development was the exclusive concern of the private
sector (Owosekun, 1991). Four years later, government modified its stance by maintaining that government policy would be aimed at stimulating the rigorous growth
of the private sector through the provision of adequate infrastructure and financial
assistance (First National Development Plan, 1964).
By 1970, when the poor performance of the private sector had become glaring and
foreign capital inflow was very disappointing, government announced the need for
more public sector initiative and participation in economic activities through the use
of public enterprises (Second National Development Plan, 1970-74). Accordingly, the
Nigerian economy witnessed heavy investment of public funds by states and federal
Governments in many industrial production enterprises3, infrastructure supply/development enterprises and financial enterprises. Indeed, by the early 1980s, the public
sector accounted for about 50 per cent of the GDP in Nigeria (Ojo, 1992). According
to Obadan (1992), the public sector accounted for 65 % of the total investment in the
economy over the four developmental plans periods in Nigeria. Also, 53 % of the
total investment in economic activities (housing, agriculture/natural resources, transport/communication and road/construction) over the same period was accounted for
by the public sector. This suggests that the public sector has been the major stimulus
- 10.1515/zireb-2016-0001
Downloaded from PubFactory at 08/26/2016 10:47:44PM
via free access
7
Public Investment and Output Performance: Evidence from Nigeria
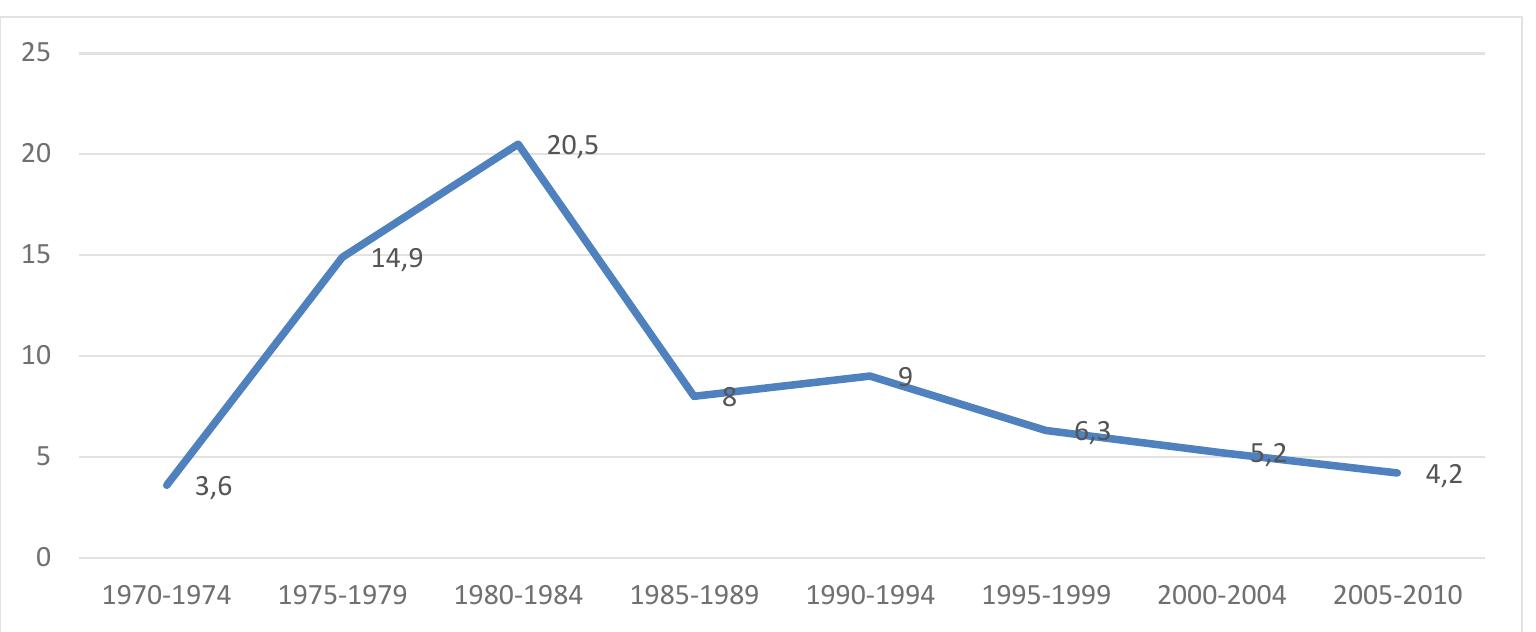
for economic growth since the mid-1970s. Figure 2 shows that PI contribution to
GDP rose from 3.6 % between 1970 and 1974 through 14.9% during 1975-1979 to
20.5% during 1980- 1984. It declined sharply thereafter and stood at 9.0 % by 19901994 and fell drastically further to 4.2% from 2005 to 2010.
Figure 2: Public Investments contribution to Output in Nigeria (1970-2010)
25
20,5
20
15
14,9
10
8
9
6,3
5
5,2
3,6
4,2
0
1970-1974
1975-1979
1980-1984
1985-1989
1990-1994
1995-1999
2000-2004
2005-2010
Source: Underlying data are from Central Bank of Nigeria’s Statistical Bulletin and Annual Report and Statement
of Accounts- various years
Review of Selected Previous Studies
Aschauer (1989) studied the effect of PI on private sector productivity from 19491985 in the United States and reported a strong and positive relationships. Munnell
(1990) used estimates of gross state product and of private inputs of capital to develop estimates of public capital stocks for 48 states over the period 1970–86. She
concluded that public capital has a positive impact on private output, investment, and
employment. However, Munnell’s estimates of the relative effects of PI were smaller
than those made by Aschauer. Studies like Mas et al (1996), Otto and Voss (1994),
and Wylie (1996) found the same relationship between PI and economic growth in 17
Spanish Region, Australia and Canada respectively
The study by Alexiou (2009) on the impact of PI on economic growth of South
Eastern European (SEE) countries (Albania, Austria, Bosnia, Herzegovina, Greece,
Macedonia, Montenegro, Croatia, Romania, Serbia, Hungary and Turkey) indicated
that four of the five variables used in the model namely; government spending on
capital formation, development assistance, private investment and trade-openness
had positive and significant effects on economic growth. In contrast, the impact of
population growth was statistically insignificant.
- 10.1515/zireb-2016-0001
Downloaded from PubFactory at 08/26/2016 10:47:44PM
via free access
8
Omo Aregbeyen, Taofik Ibrahim Mohammed
Ghani and Musleh-ud (2006) explored the role of PI in the process of economic
growth for Pakistan between 1975 and 2005. They reported that growth was largely
driven by private investment and the lack of strong inference on the effects of PI and
public consumption on economic growth.
Fedderke, et al. (2006) examined the relationship between investment in economic infrastructure and long-run economic growth for South Africa. The main findings
were that investment in infrastructure enhanced economic growth both directly and
indirectly (by raising the marginal productivity of capital). However, there was weak
evidence of feedback from output to infrastructure. They concluded that PI in infrastructure impact on growth was robust.
Nurudeen and Usman (2010) analysed government expenditure and economic
growth in Nigeria during 1970 to 2008. The error correction model (ECM) was estimated. The reported findings revealed that government total capital expenditure;
total recurrent expenditures and government expenditure on education had negative
effects on economic growth. Contrarily, rising government expenditure on transport
& communication and health positively impacted economic growth. They recommended that government should increase both capital expenditure and recurrent expenditure, including expenditures on education, as well as ensuring that funds meant
for the development of these sectors are properly managed. In similar studies, Akpan
(2005), Sola (2008) and Aladejare (2013) also found positive and significant relationship between government investment and economic growth.
Khan (2011) used the macro-econometric approach to evaluate the effects of economic growth on PI in Pakistan. The results revealed that expansion in output and
reserves has favourable impacts on PI. Based on these findings, he recommended that
long term private/public investment policies of government be strengthened to enhance PI towards increasing employment opportunities and reduce poverty. He also
recommended that the export sector be accorded more attention in term of quality,
prices and marketing strategies for growth enhancement.
Khan and Musleh ud Din (2011) investigated the effects of government expenditure on aggregate and sectoral output in Pakistan using the IS-LM-BP framework.
Specifically, they considered the agricultural, manufacturing and services sectors.
The models were estimated using the error correction mechanism (ECM) to determine the speed of adjustment of the aggregate and sectoral outputs to equilibrium.
The empirical results showed that capital expenditure on infrastructure positively
impacted on the agricultural, manufacturing and services sectors.
Akanbi and Du Toit, (2011) used the Neo-classical business cycle model to analyse the effects of government expenditure and oil price shock on the non-oil sector
in Nigeria. They compared results from the ordinary least squares (OLS) and instrumental variables (IV) estimation techniques. The results obtained generally showed
that government expenditure had no meaningful impact on non-oil sector while oil
price shock impacted positively on the sector.
- 10.1515/zireb-2016-0001
Downloaded from PubFactory at 08/26/2016 10:47:44PM
via free access
Public Investment and Output Performance: Evidence from Nigeria
9
The summary from the foregoing review of the literature is that the approach used
in developing models and estimation techniques adopted in examining the effect of
PI on output matter. In addition, exploring and understanding the specific channels
through which public investment affect output in a particular country is important.
Analytical Framework and Methodology
Analytical Framework
This study adopted the Keynes Income-Expenditure approach. This approach suggests that the economy’s equilibrium level of output or real GDP may not be consistent with the actual level of output. The basic tenet is that the real GDP equilibrium
level corresponds to current aggregate expenditure level and that the levels of output
and employment depend directly on the level of aggregate expenditures. Changes in
output reflect changes in aggregate spending. Aggregate Expenditure (AE) is defined
as the total spending on output during a given period.
In a closed economy, there are only three classes of agents; households, businesses, and the government. Aggregate expenditure on goods and services is the sum of
the component spending by these agents:
AE = C + I + G
(1)
Where
AE = Aggregate Expenditure
C = household consumption expenditure
I = Domestic Investment
G = Government expenditure
In an open economy, a country engages in foreign trade which is accounted for
as net receipt from abroad. This is denoted as the difference between exports and
imports (X –M). Thus, our aggregate expenditure identity becomes:
AE = C + I + G + (X − M)
Where
X
=
M
=
(X − M) =
(2)
Export
Import
Net Export (NX)
From the perspective of Keynes, GDP is reasonably thought of as being determined by aggregate demand (AD). Aggregate demand is the sum of the expenditures
- 10.1515/zireb-2016-0001
Downloaded from PubFactory at 08/26/2016 10:47:44PM
via free access
10
Omo Aregbeyen, Taofik Ibrahim Mohammed
of each economic agent on goods and services. Hence, the components of aggregate
demand are; household consumption expenditure (C), domestic investment (I), government purchases (G) and net export (X-M). This is expressed as:
AD = C + I + G + (X − M)
(3)
Aggregate supply is denoted as, which is just equal to the actual value of GDP that
the economy produced. Thus:
AS = GDP
(4)
At equilibrium, aggregate supply is set to be equal to aggregate demand:
AS = AD
(5)
Y = C + I + G + NX
(6)
This implies that:
The above identity suggests that GDP is determined by the sum of demand from
the four sectors of the economy. Thus, each of the components of output (Y) in equation (6) is specified in its structural form using an eclectic approach4 as follows.
Household Consumption
The standard life cycle household consumption model postulates that a representative
household devise a consumption plan that maximizes utility over its lifetime, subject
to an inter-temporal budget constraint. This is expressed below as:
+
+
C = f(yd, ir)
(10)
Where, yd is disposable income and ir is nominal interest rate.
Domestic Investment
The modelling of investment relies on the flexible accelerator approach in which
investment is determined by the rate of interest, the cost of capital and income. This
relationship is expressed below:
+
+
I = f(Y , ir)
- 10.1515/zireb-2016-0001
Downloaded from PubFactory at 08/26/2016 10:47:44PM
via free access
(11)
Public Investment and Output Performance: Evidence from Nigeria
11
Where I is domestic investment while other variables retain their earlier definitions
Government Expenditure
In practice, G component is fixed because government has commitment to a set of
public services (i.e. roads and bridges, national defence, air traffic control, and education) that cannot be altered. Thus, government is assumed to be exogenous in the
model. Introducing the government in this way allows us to model the basic effects
of PI on economic output.
Real Export of Goods and Services
The export function adopted was based on the simple Heckscher-Ohlin and Samuelson (HOS) factor endowment model. This is the combination of the simple Stolper-Samuelson theorem of relative price5 and Heckscher-Ohlin Quantity Version theorem6. Therefore, in the long run, the demand for real exports of goods and services
are mainly driven by the level of world income and relative prices of goods and services. Oil price is also included to account for the dominance of oil export in Nigeria
which reflects the comparative factor endowment advantage of the country. Exchange
rate fluctuations are also expected to have influence on real export in the long run
but this depends on the productive structure of the economy in question. Therefore,
fluctuations in oil price are expected to have a significant impact on the Nigerian
economy. This is expressed functionally below:
+
-
+
X = f(Yw, RPG, OP)
(12)
Where X is real exports of goods and services, Yw is real world income (in U.S$),
RPG is relative price of goods and services (the ratio of domestic prices to U.S prices)
and OP is World oil price.
Real Import of Goods and Services
The basic import function adopted is the combination of the traditional and Hemphill
(1974) import functions in which import of goods and services is determined by national income, relative prices of goods and services as well as international reserves.
The fluctuations in the exchange rate are also expected to have a significant impact
on the long run specification of real imports for Nigeria. This is because imported
goods constitute a large portion of the country’s consumption expenditure (CBN,
- 10.1515/zireb-2016-0001
Downloaded from PubFactory at 08/26/2016 10:47:44PM
via free access
12
Omo Aregbeyen, Taofik Ibrahim Mohammed
2010). Therefore, the expected determinants of real imports in Nigeria are; national
income, relative prices of goods and services, foreign reserves and exchange rate.
This is specified thus:
+
+
-
+
M = f(Y , RPG, ex, R )
(13)
Where; M is real imports of goods and services, ex and R are real effective exchange rate and international reserves respectively. Others are as define earlier.
The equilibrium output can be derived by substituting expressions (10), (11), (12),
(13) and exogenous government expenditure (go) into (6).
Thus:
Y = C(Y d, ir) + I(Y, ir) + go + NX(Yw, Y, rpg, op, ex, r)
(14)
Behaviourally, the components can further be decomposed into;
C = a 0 + a1Yd + a2ir
(15)
I = b 0 + b1Y + b2ir
(16)
G = g0
(17)
NX = e1Yw + e2Y + e3rpg + e4 op + e5xr + e6 r
(18)
Where a 0 and b 0 are autonomous consumption and investment respectively.
Putting equations (15), (16), (17) and (18) into (6) yields the equilibrium output
expressed below:
Y = a 0 + a1Yd + a2ir + b 0 + b1Y + b2ir + go + e1Yw + e2Y + e3rpg + e4 op + e5xr + e6r (19)
Therefore:
Y = g 0 + g1Y d + g2ir + g3Y + g4ir + g5go + g6Yw + g7Y + g8rpg + g9 op + g10xr + g11r (20)
Y d = (Y − T)
(21)
Substituting equation (21) into equation (20) and solving for Y gives us:
y = f 0 + f1T + f2ir + f3go + f4Yw + f5rpg + f6 op + f7xr + f8r + f9p + v
(22)
The above equilibrium or reduced form output is derived mainly from the real
sector of the economy. To make the model more realistic, the monetary sector of the
- 10.1515/zireb-2016-0001
Downloaded from PubFactory at 08/26/2016 10:47:44PM
via free access
Public Investment and Output Performance: Evidence from Nigeria
13
economy is incorporated into the model. At equilibrium, the money market suggests
that real money supply equals real money demand. This gives the equation:
M = f(ir, y, p)
(23)
Where M is nominal money balances and π is expected inflation7 which has major
impact on total money balance in the economy.
Behaviourally, the money market equation (23) is expressed as:
m = b 0 + b1i + b2y + b3p
(24)
Simplifying π from equation (24) yields;
p=
1
(m − b 0 −b1i − b2y)
b3
(25)
Substituting equation (25) into equation (22) and solving for y gives;
y=
f 0 + f1T + y2ir + f3go + f4Yw + f5rpg + f6 op + f7xr + f8r + J9m + v
1 − J2
(26)
Thus, the equilibrium output can be expressed as;
y = q 0 + q1T + q2ir + q3go + q4Yw + q5rpg + q6 op + q7xr + q8r + q9m + v
(27)
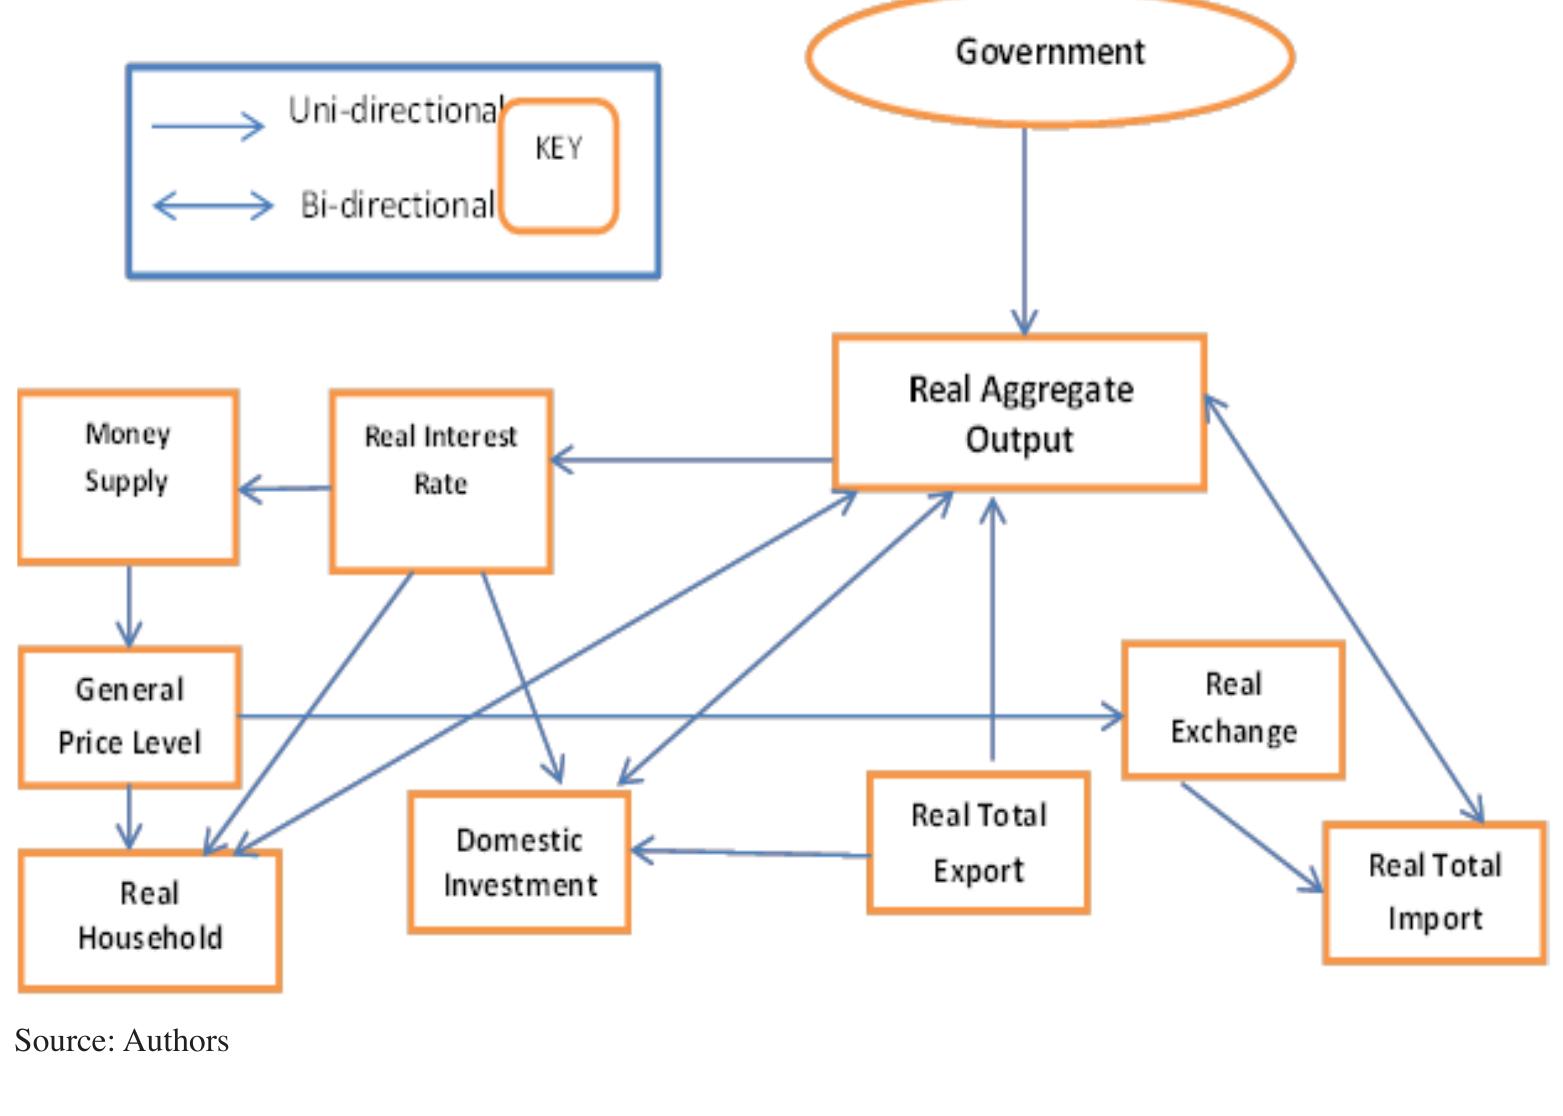
The Fundamental Reasoning of the Macroeconomic Model
The channels through which government capital expenditure (public investment) influence output, investment, export, consumption and import in the model is discussed in this
sub-section. We focus explicitly on the impact of PI on the determinants of the key endogenous variables in the model. For instance, increase in public investment leads to increase in aggregate output (Y) in equation (34). This increase in aggregate output leads to
increase in domestic investment as in equation (29) via the accelerator coefficients. Also
increase in oil export in equation (31) suggests an improvement in the trade balance (NX).
Furthermore, an increase in government spending (public investment) increases consumption in equation (28) through increase in aggregate output which causes
changes in marginal propensity to consume (MPC). Higher MPC implies more expansion of demand with likely significant effect on domestic investment thereby leading to increase in output. This channel is regarded as the indirect channel because
it is through the demand side of the economy. Another indirect channel is the effect
- 10.1515/zireb-2016-0001
Downloaded from PubFactory at 08/26/2016 10:47:44PM
via free access
14
Omo Aregbeyen, Taofik Ibrahim Mohammed
of public investment on real import in equation (32) through changes in aggregate
output via the import multiplier. Higher import multiplier implies more leakages of
resources from the economy and this worsen trade balance. Within this model, an
alternative route for explaining output effect of changes in PI is via the impact of general price level on aggregate output and aggregate demand. Disequilibrium between
aggregate demand and aggregate supply also affects the domestic price level. Therefore, market clearing may be achieved through fiscal policies adjustment (i.e. changes
in government spending). Figure 3 presents a schematic representation.
Figure 3: Schematic Representation of the Macroeconomic Model
g
p
Source: Authors
Methodological Approach and Model Specification
Based on the foregoing Keynes Income-Expenditure and Aggregate Supply-Demand
framework, a macro-econometric model was developed relating sectoral and aggregate outputs in the economy to PI. Basically, government expenditure is separated
into current and capital expenditure. Current expenditure mostly comprises of wages
and salaries which are related to private consumption, while capital expenditures
are mostly regarded as PI. These expenditures (current and capital) are related to
government total revenue which is the monetary value of the gross domestic prod-
- 10.1515/zireb-2016-0001
Downloaded from PubFactory at 08/26/2016 10:47:44PM
via free access
Public Investment and Output Performance: Evidence from Nigeria
15
uct. In a situation where government expenditure is higher than its revenue (budget
deficit), government finances its expenses through an increase in the money supply, a
decrease in foreign exchange reserves, an increase in the amount borrowed from the
private sector, or an increase in the amount transferred from extra-budgetary funds.
However, because of the scope and objectives of this study, the issue of financing was
neutralised. Therefore, the real sector of the economy only is considered.
The aggregate supply block is the real output produced in the economy by adding
up the outputs from all sectors of the economy (equation 34). The aggregate demand
block comprises of household consumption equation (28), domestic investment equation (29), real export equation (30) and real import equation (31). Each block captures
specific equations whose formulations are guided by economic theory and the specific objectives of the study. The lag values of the dependent variables is included in
the equations8 and for ease of appreciation all the estimable equations from the two
blocks are presented in log form below:
lnCt = a 0 + a1 ln ydt + a2irt + a3 ln Ct-1 + yt
a1, a2, a3 > 0
(28)
ln It = b 0 + b1 ln AGGTYt + b2irt + b3 ln It-1 + t
b1, b3 > 0 and b2 < 0
(29)
−
ln Gt = G
(30)
ln Xt = q0 + q1 ln Ywt + q2 ln RPGt + q3 ln OPt + q4 ln Xt-1 + ¬t
q1, q3, q4 > 0 and q2 < 0
(31)
ln Mt = d 0 + d1 ln Yt + d2 ln RPGt + d3xrt + d4 ln Rt + d5 ln Mt-1 + Êt
d1, d2, d4, d5 > 0 and d3 < 0
(32)
ln mt = i0 + i1 ln yt + i2irt + i3p t + i4 ln mt-1 + ¡t
i1, i4 > 0 and i2, i3 < / > 0
(33)
ln yt = q 0 + q1 ln Tt + q2irt + q3 ln go + q4 ln Ywt + q5 ln rpgt +
+ q6 ln opt + q7xrt + q8 ln Rt + q9 ln mt + v t
q2 < 0, q3, q4, q6, q8 > 0, q1, q5, q7, q9 < / > 0
(34)
Identities
AD = C + I + G + NX
(35)
GDP = C + I + G + NX
(36)
- 10.1515/zireb-2016-0001
Downloaded from PubFactory at 08/26/2016 10:47:44PM
via free access
16
Omo Aregbeyen, Taofik Ibrahim Mohammed
AS = AD
(37)
The model has five (5) behavioural equations, one (1) linking equation and three
(3) identities. There are 18 variables in the model, of which 13 are exogenous and the
remaining 5 are endogenous. The model was subjected to the order of condition of
identification9 and the results showed that the model was over identified.
List and Definitions of Variables and Parameters
Endogenous Variables
HC
I
X
M
Y
=
=
=
=
=
= million)
Household consumption expenditure (N
Domestic Investment (N
= million)
Real exports of goods and services value (N
= million)
Real import of goods and services value (N
= million)
Aggregate income (N
= million)
Exogenous Variable
PLR = prime lending rate
RPG = relative price of goods and services (the ratio of domestic prices to
U.S prices)
R
= International Reserves
yd
= Disposable Income (N
= million)
GCON = Government Consumption (N
= million)
ir
= Real interest rate
Yw
= real world (U.S) income
xr
= real effective exchange rate
OP
= Oil Price ($)
go
= million)
= government expenditure (public investment) (N
m8
= real money supply
T
= Government tax revenue (N
= million)
CIT
= Company Income Tax (N
= million)
Estimation Technique and Procedures
Simultaneous equation system was adopted for this study. This is because the AD
and AS blocks comprised of simultaneous equations of which some of the regressors
are correlated with the error terms of the equation they appeared as dependent variables. To solve this problem of potential endogeneity, the Two Stage Least Squares
plus lagged dependent variable (2SLSLDV) and Three Stage Least Squares (3SLS)
- 10.1515/zireb-2016-0001
Downloaded from PubFactory at 08/26/2016 10:47:44PM
via free access
Public Investment and Output Performance: Evidence from Nigeria
17
simultaneous estimation technique were adopted. The 2SLS which s an equation
i
by equation technique produces a consistent estimate if the predetermined variables
included in the equation to be estimated be in the set of instrumental variables. This
implies that the instrumental variables must be uncorrelated with the error disturbance and correlated with the endogenous variables in the model. However, the 2SLS
technique cannot account for the possibility of serial correlation in residuals across
equations in the system. Thus, the 3SLS was applied to correct for this problem. The
major drawback of the 3SLS is that it is possible for an error in the specification of a
particular equation to be transferred to other equations in the system since the equations in the system are estimated simultaneously. Diagnostic tests were conducted on
the results obtained from the 2SLS and 3SLS estimators to validate the robustness of
the estimates and their goodness of fit.
Data Sources
This study made use of macroeconomic time series for the period 1970-2010. The
data were obtained from IFS CD-ROM, Penn World Table and Central Bank of Nigeria Statistical Bulletin and Annual report and statement of Account (various issues).
The variables of interest include; total public investment, household consumption
expenditure, real export of goods and services, real import of goods and services and
gross domestic product.
Empirical Results
In line with the earlier enunciated estimation technique and procedure, results from
both the 2SLS and 3SLS are jointly presented. Where applicable, the 3SLS results
are considered superior and therefore our discussions of the results are focused on
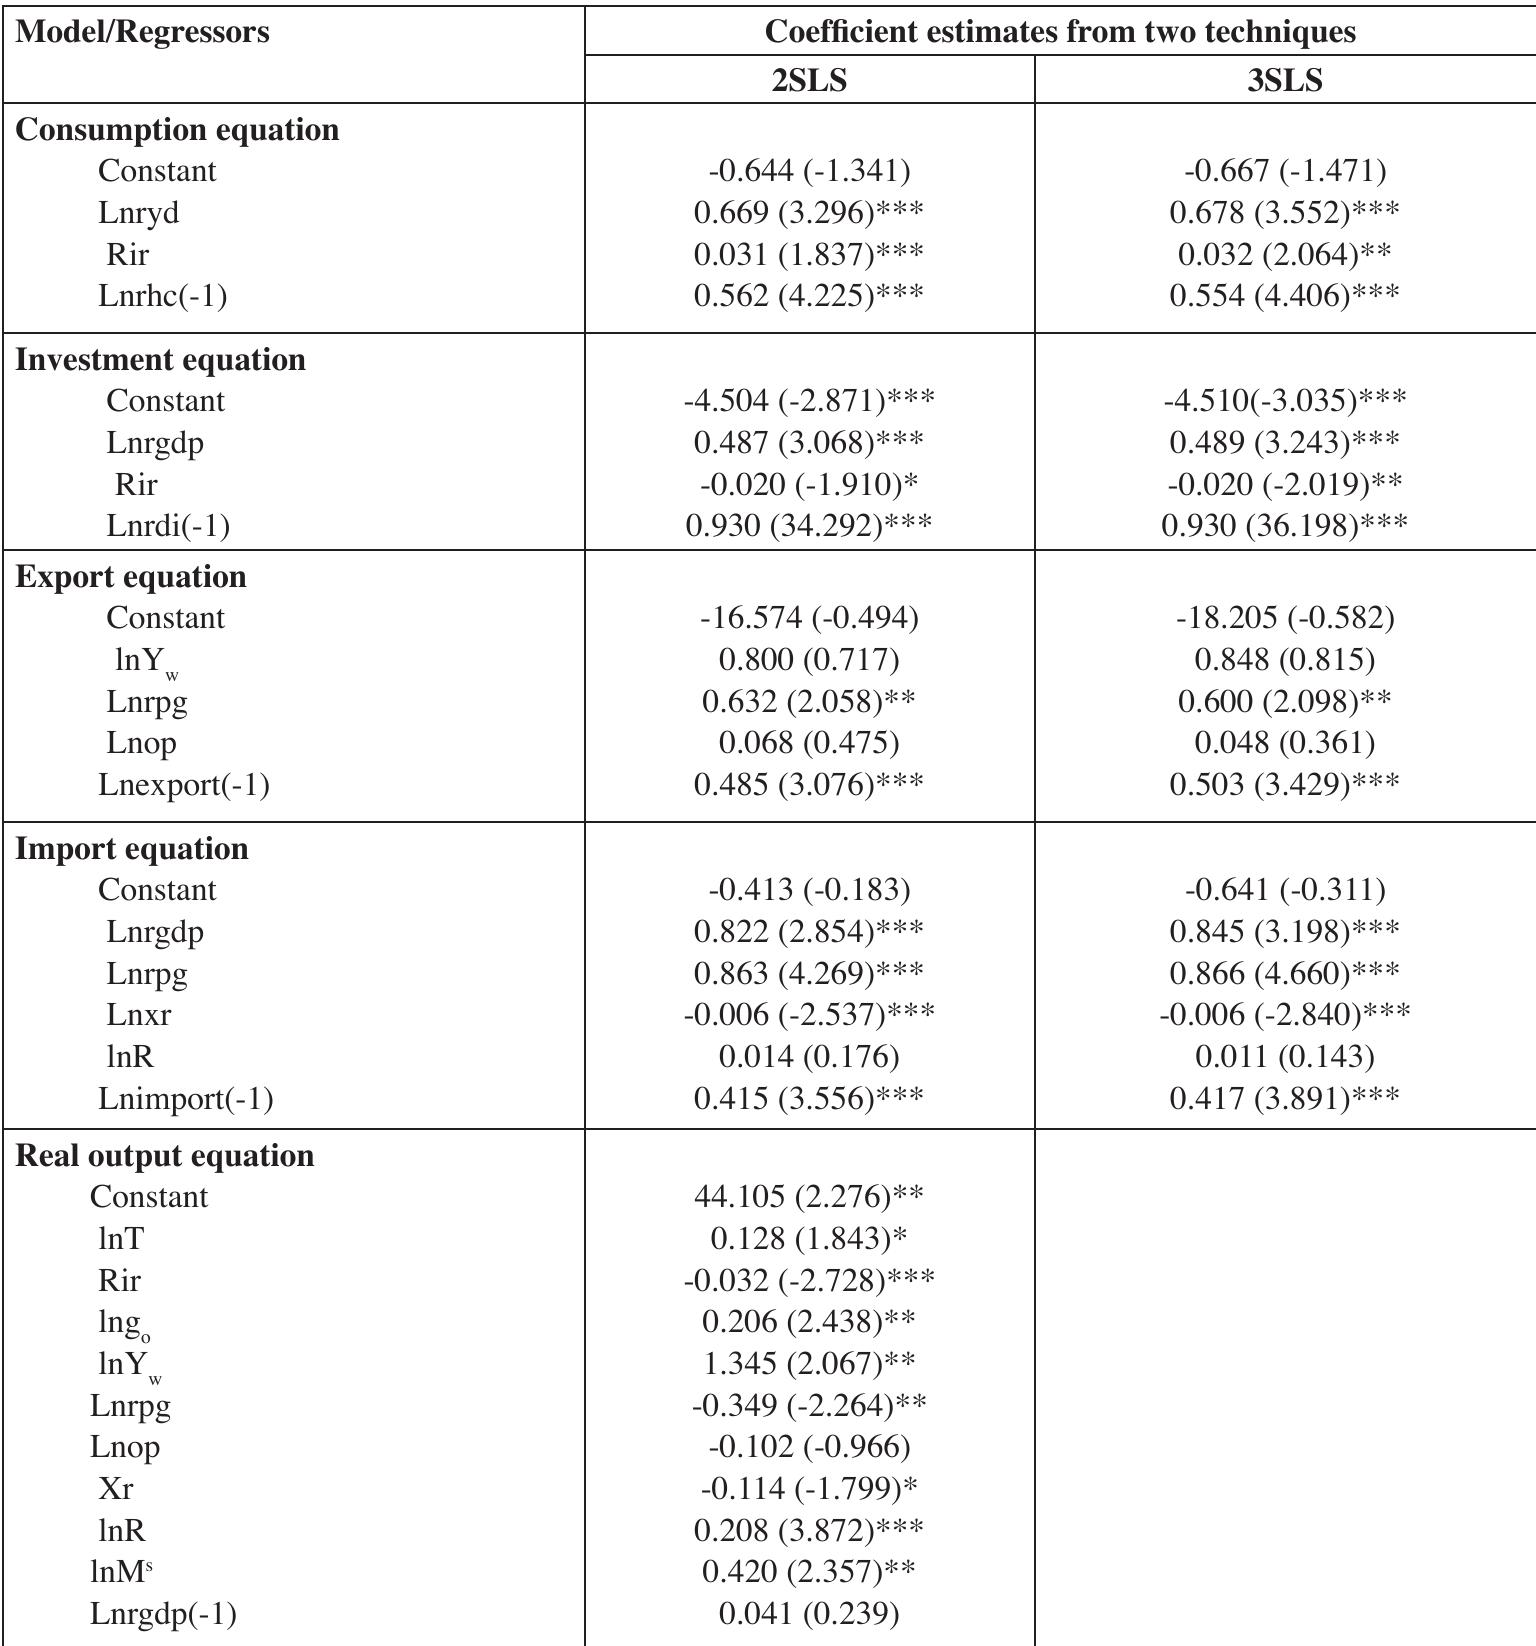
this. Table 2 showed the results obtained from the different models estimated. Starting with the household consumption model, the effects of current disposable income,
interest rate and previous year consumption were positive and significant. Specifically, with respect to the disposable income, the marginal propensity to consume is 0.68.
This implies that on the average 68k is spent on consumption out of every N1 income
earned. The three variables considered in the investment model as expected exerted
significant impacts. While the impacts of both real output and previous investment
were positive, that of interest rate was negative. The result in respect of real output
validated the accelerator principle, which posits a direct relationship between the rate
of output of an economy and the level of investment in capital goods. In this case,
the accelerator coefficient is 0.49, suggesting that the level of investment in capital
- 10.1515/zireb-2016-0001
Downloaded from PubFactory at 08/26/2016 10:47:44PM
via free access
18
Omo Aregbeyen, Taofik Ibrahim Mohammed
goods increased by 4.9% for every 10% increase in the level of output. The significant
negative relationship of interest rate to investment underscores the fact that the Nigerian economy is characterised by low income earnings which dampen savings in the
country and consequently the amount of funds available for investment is often low
and interest rate high. This high interest in turn discourages investment.
Table 2: 2SLS and 3SLS Regression Results
Model/Regressors
Consumption equation
Constant
Lnryd
Rir
Lnrhc(-1)
Coefficient estimates from two techniques
2SLS
3SLS
-0.644 (-1.341)
0.669 (3.296)***
0.031 (1.837)***
0.562 (4.225)***
-0.667 (-1.471)
0.678 (3.552)***
0.032 (2.064)**
0.554 (4.406)***
-4.504 (-2.871)***
0.487 (3.068)***
-0.020 (-1.910)*
0.930 (34.292)***
-4.510(-3.035)***
0.489 (3.243)***
-0.020 (-2.019)**
0.930 (36.198)***
Export equation
Constant
lnYw
Lnrpg
Lnop
Lnexport(-1)
-16.574 (-0.494)
0.800 (0.717)
0.632 (2.058)**
0.068 (0.475)
0.485 (3.076)***
-18.205 (-0.582)
0.848 (0.815)
0.600 (2.098)**
0.048 (0.361)
0.503 (3.429)***
Import equation
Constant
Lnrgdp
Lnrpg
Lnxr
lnR
Lnimport(-1)
-0.413 (-0.183)
0.822 (2.854)***
0.863 (4.269)***
-0.006 (-2.537)***
0.014 (0.176)
0.415 (3.556)***
-0.641 (-0.311)
0.845 (3.198)***
0.866 (4.660)***
-0.006 (-2.840)***
0.011 (0.143)
0.417 (3.891)***
Real output equation
Constant
lnT
Rir
lngo
lnYw
Lnrpg
Lnop
Xr
lnR
lnMs
Lnrgdp(-1)
44.105 (2.276)**
0.128 (1.843)*
-0.032 (-2.728)***
0.206 (2.438)**
1.345 (2.067)**
-0.349 (-2.264)**
-0.102 (-0.966)
-0.114 (-1.799)*
0.208 (3.872)***
0.420 (2.357)**
0.041 (0.239)
Investment equation
Constant
Lnrgdp
Rir
Lnrdi(-1)
***, ** and * denote significance at 1%, 5% and 10%, respectively.
Figures in parenthesis are t-statistics
- 10.1515/zireb-2016-0001
Downloaded from PubFactory at 08/26/2016 10:47:44PM
via free access
Public Investment and Output Performance: Evidence from Nigeria
19
Exports were significantly explained by the relative price of goods and services
and previous value of exports. The implication of this result is that depreciation of
the naira made exports relatively cheaper thereby impacting positively on real export
value in the country. The level of total output, the relative price of goods and services,
real exchange rate and previous imports were significant in explaining the imports
profile. However, real exchange rate had a negative impact.
Total output in the economy was significantly explained by public investment,
income (taxation), interest rate, world income, relative prices of goods and services,
real exchange rate, international reserves, money supply and the previous level of
output. The PI impact was positive and significant. Specifically, a 10% increase in PI
resulted to 2.1% increase in aggregate real output. This result suggests that PI reflected an expansionary fiscal policy and spurred output growth as suggested by theories.
The significant negative impact of real interest rate confirms the theoretical postulation of an inverse relationship between output growth and interest rate. Likewise,
the positive and significant impact of money supply supports the Keynesian Liquidity
preference theory that interest rate is purely a monetary phenomenon.
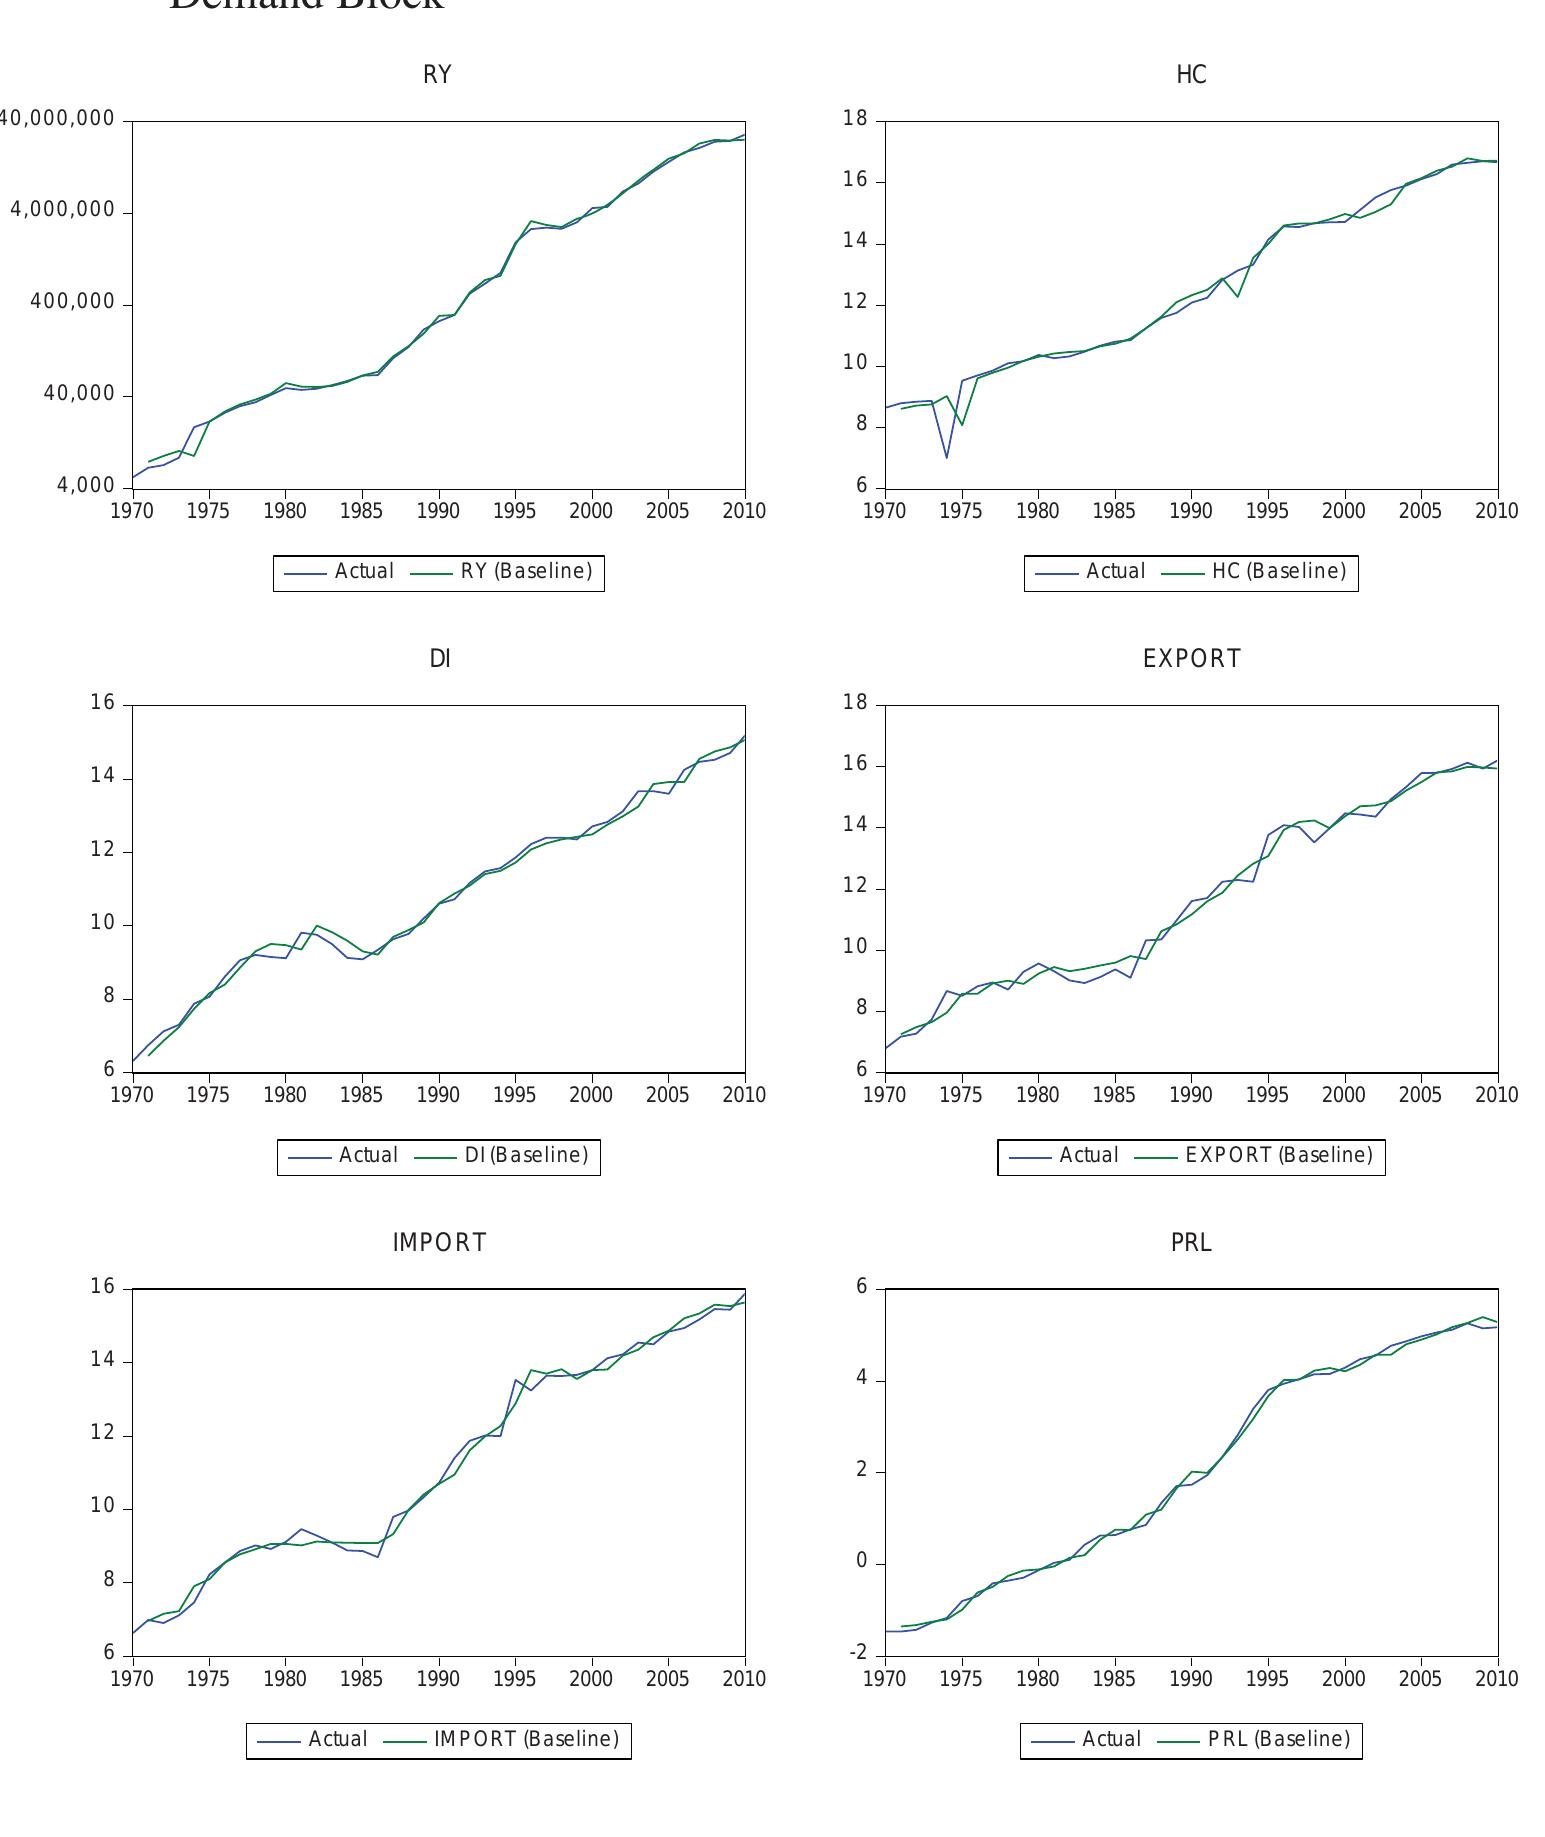
Validation of the Macroeconometric Model
Traditionally, the forecasting ability of a macro-econometric model is done using
historical simulation approach. The standard procedure was adopted in this study.
This entails visual inspection of the chart of both actual and simulated values of
the independent variables in the behavioural equations. The graphical representation
presented in figure 4 indicates that the actual and simulated series are close and the
turning points of the actual series were well tracked by the simulated values.
- 10.1515/zireb-2016-0001
Downloaded from PubFactory at 08/26/2016 10:47:44PM
via free access
20
Omo Aregbeyen, Taofik Ibrahim Mohammed
Figure 4: Actual and Simulated Values of Some Endogenous Variables in Aggregate
Demand Block
RY
HC
40,000,000
18
16
4,000,000
14
400,000
12
10
40,000
8
4,000
1970
1975
1980
1985
1990
Actual
1995
2000
2005
2010
6
1970
1975
1980
RY (Baseline)
1985
1990
Actual
DI
1995
2000
2005
2010
2005
2010
2005
2010
HC (Baseline)
EXPORT
16
18
16
14
14
12
12
10
10
8
6
1970
8
1975
1980
1985
1990
Actual
1995
2000
2005
2010
6
1970
1975
DI (Baseline)
1980
1985
Actual
IMPORT
1990
1995
2000
EXPORT (Baseline)
PRL
16
6
14
4
12
2
10
0
8
6
1970
1975
1980
1985
Actual
1990
1995
2000
IMPORT (Baseline)
2005
2010
-2
1970
1975
1980
1985
Actual
1990
1995
2000
PRL (Baseline)
Conclusion
This study in broader perspective examined the impact of PI on output performance
in Nigeria for the period 1970-2010. Specifically, the study analysed the impacts of
PI on aggregate output and identified the channels of the impacts. The study was pri-
- 10.1515/zireb-2016-0001
Downloaded from PubFactory at 08/26/2016 10:47:44PM
via free access
Public Investment and Output Performance: Evidence from Nigeria
21
marily motivated by the fact that previous studies focused on supply side effects of PI
on output; with less emphasis on demand side effect which, constitutes the indirect
impact of PI on output. The study was anchored on the Keynes Income-Expenditure theoretical framework while the methodological approach involved developing
a small macro-econometric system equation model. The 2SLS and 3SLS estimation
techniques were explored and compared.
The results revealed that total PI exert considerable influence on aggregate output.
This is consistent with supply-side driven and highly aggregated studies that dominated the empirical literature. The results also revealed the direct and indirect channels through which public investment affected aggregate output. The direct channel
is through the government capital expenditure multiplier (0.21) while the indirect
channels are through the import multiplier (0.85), accelerator coefficient (0.49) and
marginal propensity to consume (0.68). On the average, based on magnitude, the indirect channel appears to be larger than the direct channel with the import multiplier
being the most pronounced. The less significant impact of the direct channel (i.e. government capital multiplier) is attributable to the observed declining trend in capital
expenditure, poor implementation and low quality of public investment projects due
to widespread corruption in the public sector. The policy implications of these results
are therefore: (i) PI needs to be increased in key sectors (namely agriculture, manufacturing, services, wholesale and retailing and crude petroleum) that have greater
potentials to impact positively on aggregate output performance; and (ii) the need
for improvement in the implementation and quality of government capital spending.
REFERENCES
Akanbi, O. A. and. Du Toit, C. B. 2011. Macro-econometric Modelling for the Nigerian Economy: A
growth–poverty gap analysis. Economic Modelling, Vol. 28, pp. 335–350.
Akpan N.I. 2005. Government Expenditure and Economic Growth in Nigeria: A Disaggregated Approach. CBN Economic and Financial Review, Vol. 43, no.1, pp. 51-69.
Aladejare, S. A. 2013. Government spending and economic growth: Evidence from Nigeria MPRA
Paper, no.43916.
Alexiou, C. 2009. Government Spending and Economic Growth: Econometric Evidence from the
South Eastern Europe (SEE). Journal of Economic and Social Research, Vol.11, No.1, pp.
1-16.
Aschauer, D.A. 1989. Does public capital crowd out private capital? Journal of Monetary Economics,
Vol. 24, No.2, pp.171-188.
Central Bank of Nigeria (CBN). Annual Report and Statement of Account, December, 2010.
Fair, R. C. 1971. A comparison of alternative estimators of macroeconomic models. Econometric
Research programme, Research Memorandum, No: 121.
Fedderke, J.W., Perkins, P. and Luiz, J.M. 2006. Infrastructure investment in Long-run Economic
Growth: South Africa 1875-2001. World Development, Vol. 34, No.6, pp. 1037-1059.
Ghani, E. and Musleh-Ud Din, 2006. The Impact of Public Investment in Pakistan, The Pakistan
Development Review, Pakistan Institute of Development Economics, Vol. 45, No.1, pp.87-98.
- 10.1515/zireb-2016-0001
Downloaded from PubFactory at 08/26/2016 10:47:44PM
via free access
22
Omo Aregbeyen, Taofik Ibrahim Mohammed
Gujarati, D.N. 2004. Basic econometrics, Fourth Edition, New York: McGraw-Hill Inc.
Hemphill, W.L. 1974. The effects of foreign exchange receipts on imports of less developed countries.
IMF Staff Papers, No.21, pp. 637–677
Khan, A. 2011. Inter-linkages of Public Investment and Economic Growth in Pakistan: An Econometric Analysis. Academic Research International, Vol. 1, No.1, pp.15-19.
Khan, M. A. and Musleh ud Din 2011. A Dynamic Macroeconometric Model of Pakistan’s Economy.
PIDE Working Papers, No: 69.
Mas, M., Maudos J., Perez, F. and Uriel, E. 1996. Infrastructures and productivity in the Spanish Regions. Regional Studies, Vol.30, No.7, pp. 641-650.
Munnel, A.H. 1992. Policy watch: infrastructure investment and economic growth. The Journal of
Economic perspectives, Vol. 6, No.4, pp.189-198.
Nurudeen, A. and Usman, A. 2010. Government Expenditure and Economic Growth in Nigeria, 19702008: A Disaggregated Analysis. Business and Economics Journal, Vol. 2010: BEJ-4.
Obadan, M.I. 1992. Striking objectives balance between the public and private sectors in the management of the Nigerian economy. A paper presented at the Maryland Finance Company and
Consultancy Services, Lagos.
Ojo, M.O. 1992. Monetary Policy in Nigeria in the 1980s and prospects in the 1990s. CBN Economic
and Financial Review, Vol. 30, No. 1, pp.1-18.
Otto, G. and Voss, G. 1994. Public capital and private sector productivity. The Economic Record, Vol.
70, No. 209, pp. 121-132.
Owosekun, A.A. 1991. Macro-economic issues and case studies of public enterprises. In: Public Enterprise in Nigeria. Paper presented at Nigerian Economic Society Annual Conference Proceedings. pp. 1-15.
Sola, O. 2008. Public Investment and Economic Growth in Nigeria: An Autoregressive Model. Journal
of International Finance and Economics, Vol. 8, issue 2, pp.51-63.
Wylie, P. 1996. Infrastructure and Canadian economic growth: 1946–1991. The Canadian Journal of
Economics, Vol. 29, Special Issue, Part 1, pp. S350–S355.
NOTES
1
For example, public investment on infrastructure such as roads, communications and power reduces
production costs, increases private sector investment and profitability of firms, thus fostering economic growth. Similarly, public investment on health and education raises the productivity of labour and
increases the growth of national output.
2
High income tax reduces disposable income and aggregate consumption on the demand side whereas
on the supply side, higher profit tax tends to increase production costs and reduce investment expenditure as well as profitability of firms.
3
See, Owosekun 1991
4
The nature of the Nigerian economy could impose strict restriction making it impossible to rely on a
particular theory or single model. However, experience has shown that combination of different models in forecasts series could outperform those with single approach.
5
The theorem states that a small increase in the relative price of a good will increase, in terms of the
price of both goods, the price of the factor used intensively in producing the good whose relative price
has risen and will decrease, in terms of the price of both goods, the price of the other factor, provided
both goods are initially produced
- 10.1515/zireb-2016-0001
Downloaded from PubFactory at 08/26/2016 10:47:44PM
via free access
Public Investment and Output Performance: Evidence from Nigeria
23
6
The simple Heckscher-Ohlin Quantity Version theorem which state that suppose two countries with
identical homothetic demands, identical technologies of production and not separated by a FIR engage
in free trade, then each country will export the good that makes relatively intensive use of its relatively
abundant factor (in the quantity sense).
7
The expected rate of inflation does not follow the random walk hypothesis as economic agents seem
to repose confidence in the government policies and tend to anticipate the effect of these policies
8
The lag value of the regressand is included in all the models in order to correct for possibility of first
order serial correlation (Fair, 1971).
9
The order condition states that “the total number of variables in the model, M, minus the number of
variables appearing in a particular equation, M*, should be equal or greater than the number of endogenous variables in the model, N, minus one, that is, M-M* ≥ N-1 (Gujarati, 2004).
- 10.1515/zireb-2016-0001
Downloaded from PubFactory at 08/26/2016 10:47:44PM
via free access
- 10.1515/zireb-2016-0001
Downloaded from PubFactory at 08/26/2016 10:47:44PM
via free access