Emotion
2013, Vol. 13, No. 4, 724 –738
© 2013 American Psychological Association
1528-3542/13/$12.00 DOI: 10.1037/a0032335
This document is copyrighted by the American Psychological Association or one of its allied publishers.
This article is intended solely for the personal use of the individual user and is not to be disseminated broadly.
Validation of Data-Driven Computational Models of Social
Perception of Faces
Alexander Todorov and Ron Dotsch
Jenny M. Porter
Princeton University and Radboud University
Columbia University
Nikolaas N. Oosterhof
Virginia B. Falvello
University of Trento and Dartmouth College
Princeton University
People rapidly form impressions from facial appearance, and these impressions affect social decisions.
We argue that data-driven, computational models are the best available tools for identifying the source
of such impressions. Here we validate seven computational models of social judgments of faces:
attractiveness, competence, dominance, extroversion, likability, threat, and trustworthiness. The models
manipulate both face shape and reflectance (i.e., cues such as pigmentation and skin smoothness). We
show that human judgments track the models’ predictions (Experiment 1) and that the models differentiate between different judgments, though this differentiation is constrained by the similarity of the
models (Experiment 2). We also make the validated stimuli available for academic research: seven
databases containing 25 identities manipulated in the respective model to take on seven different
dimension values, ranging from ⫺3 SD to ⫹3 SD (175 stimuli in each database). Finally, we show how
the computational models can be used to control for shared variance of the models. For example, even
for highly correlated dimensions (e.g., dominance and threat), we can identify cues specific to each
dimension and, consequently, generate faces that vary only on these cues.
Keywords: social perception, face perception, affect, evaluation, computational models
Supplemental materials: http://dx.doi.org/10.1037/a0032335.supp
attribute and inferences of this attribute from facial appearance
shape decisions (Todorov, Said, & Verosky, 2011).
Although most of these judgments are formed from emotionally
neutral faces, they are grounded in affective cues (Todorov, Said,
Engell, & Oosterhof, 2008). For example, principal component
analysis of social judgments from faces has shown that the first
component, which accounts for about 60% of the variance of these
judgments, is best interpreted as valence evaluation (Oosterhof &
Todorov, 2008). Moreover, multiple studies have shown that one
source of these judgments is resemblance to emotional expressions
(Montepare & Dobish, 2003; Neth & Martinez, 2009; Oosterhof &
Todorov, 2009; Said, Sebe, & Todorov, 2009; Zebrowitz, Kikuchi,
& Fellous, 2010). For example, neutral faces with resemblance to
angry expressions are perceived as dominant, aggressive, and
threatening (Said et al., 2009). Many other affectively significant
cues have been identified as a source of face judgments. These
include facial maturity (Berry & Landry, 1997; Copley & Brownlow, 1995; Montepare & Zebrowitz, 1998; Rule & Ambady, 2008;
Sacco & Hugenberg, 2009), masculinity and femininity
(Boothroyd, Jones, Burt, & Perrett, 2007; Buckingham et al., 2006;
Oosterhof & Todorov, 2008), self-resemblance (DeBruine, 2002,
2005; DeBruine, Jones, Little, & Perret, 2008; Verosky & Todorov, 2010a), and resemblance to liked and disliked familiar others
(Kraus & Chen, 2010; Verosky & Todorov, 2010b).
Despite all of these findings, it has been difficult to characterize
the source of trait impressions in a principled way. For example,
People instantly form impressions from facial appearance (Bar,
Neta, & Linz, 2006; Rule, Ambady, & Adams, 2009; Todorov,
Pakrashi, & Oosterhof, 2009; Willis & Todorov, 2006), and these
impressions affect important decisions (Olivola & Todorov,
2010a, 2010b). For example, attractiveness predicts not only mating success but also income (Hamermesh & Biddle, 1994). Judgments of trustworthiness predict decisions in economic (Rezlescu,
Duchaine, Olivola, & Chater, 2012; van’t Wout & Sanfey, 2008)
and legal (Porter, ten Brinke, & Gustaw, 2010) contexts; judgments of competence predict electoral (Ballew & Todorov, 2007;
Todorov, Mandisodza, Goren, & Hall, 2005) and CEO (Graham,
Harvey, & Puri, 2010; Rule & Ambady, 2008) success; and judgments of dominance predict military rank attainment (Mueller &
Mazur, 1996). A specific decision context calls for a particular
This article was published Online First April 29, 2013.
Alexander Todorov and Ron Dotsch, Department of Psychology, Princeton University, and Department of Psychology, Radboud University, Nijmegen, The Netherlands; Jenny M. Porter, Department of Psychology,
Columbia University; Nikolaas N. Oosterhof, Center for Mind/Brain Sciences, University of Trento, Trento, Italy, and Department of Psychological and Brain Sciences, Dartmouth College; Virginia B. Falvello, Department of Psychology, Princeton University.
Correspondence concerning this article should be addressed to Alexander Todorov, Department of Psychology, Princeton University, Green Hall,
Princeton, NJ 08544. E-mail: atodorov@princeton.edu
724
�This document is copyrighted by the American Psychological Association or one of its allied publishers.
This article is intended solely for the personal use of the individual user and is not to be disseminated broadly.
COMPUTATIONAL MODELS OF SOCIAL PERCEPTION OF FACES
although for emotional expressions there are well-identified structural prototypes that, in addition to contextual cues, help guide our
attribution of emotion (Ekman, 1993; Russell, 1997; Russell,
Bachorowski, & Fernandez-Dols, 2003), there are no such welldefined prototypes for social traits. The standard approach is to
start with a prior hypothesis, then manipulate facial features, and
observe the effect of this manipulation on judgments. However, as
we have discussed elsewhere (Todorov, Dotsch, Wigboldus, &
Said, 2011), the space of possible hypotheses is infinitely large.
For example, 20 binary features result in over 1 million combinations, and it is far from clear how to define what counts as a
“feature.” This is further compounded by the fact that some features may not have labels, and both perceivers and experimenters
may be unaware of their use (Dotsch & Todorov, 2012).
725
We have advocated an alternative, data-driven approach to
estimate models of social judgments in an unbiased fashion
(Dotsch & Todorov, 2012; Oosterhof & Todorov, 2008; Todorov,
Dotsch, et al., 2011; Todorov & Oosterhof, 2011; see also Gosselin
& Schyns, 2001; Kontsevich & Tyler, 2004; Mangini & Biederman, 2004; Walker & Vetter, 2009). This approach seeks to
identify all of the information in the face that is used to make
specific social judgments with imposing as few constraints as
possible. In one version of this approach, faces are produced by a
statistical model of face representation (Blanz & Vetter, 1999,
2003). Each face is a point in a multidimensional face space, and
it is possible to generate an infinite number of faces in this space.
Of note, for any social judgment of randomly generated faces from
the statistical face space, it is possible to create a parametrically
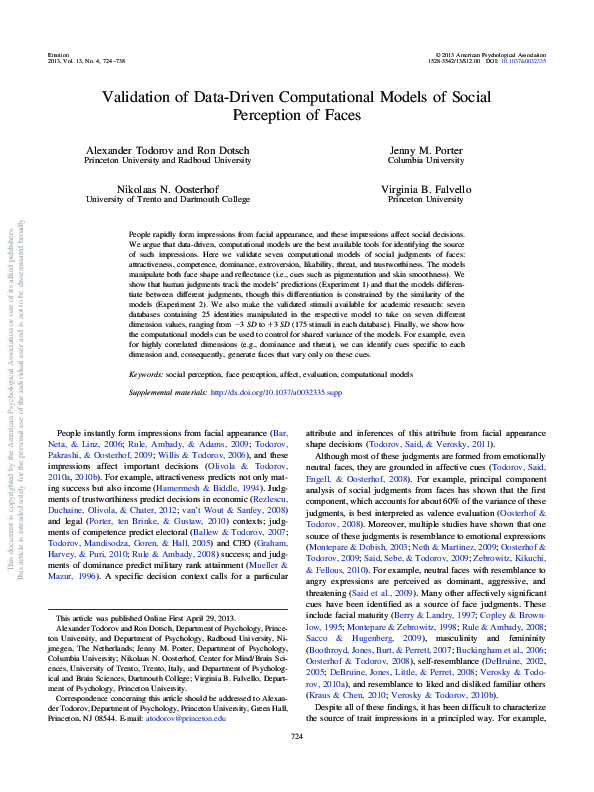
Figure 1. Twenty-five face identities used in the validation of the data-driven, computational models. These faces
were randomly generated by a statistical face model with the constraint to be maximally distinctive from each other.
For a color version of this figure, please see the supplemental materials link on the first page of this article.
�This document is copyrighted by the American Psychological Association or one of its allied publishers.
This article is intended solely for the personal use of the individual user and is not to be disseminated broadly.
726
TODOROV, DOTSCH, PORTER, OOSTERHOF, AND FALVELLO
controlled model of the judgment. This model is a new vector in
the face space that accounts for the maximum of variance of the
judgment. These models can then be applied to novel faces to
manipulate their social perception (see also Walker & Vetter,
2009).
In our initial work, we modeled face shape as a function of
judgments of trustworthiness, dominance, and threat. Further, we
showed that judgments of novel faces manipulated by the resulting
models of trustworthiness, dominance, and threat, respectively,
track the models’ predictions (Oosterhof & Todorov, 2008). In
subsequent work, we also modeled face reflectance, the surface
map of the face that contains cues, such as pigmentation and skin
smoothness, as a function of social judgments (Todorov & Oosterhof, 2011). However, these models have not been validated.
The main objective of this article is to validate seven new
models of social judgments: attractiveness, competence, dominance, extroversion, likability, threat, and trustworthiness. These
dimensions were selected because people spontaneously use them
to describe unfamiliar faces (Oosterhof & Todorov, 2008). The
computational models are described in detail in Todorov and
Oosterhof (2011). A secondary objective of this article is to make
the validated faces available for research on social perception.
Each of the seven databases contains 25 different identities (see
Figure 1) manipulated in the respective model to take on seven
different dimension values, at equal 1 SD intervals, in a range from
⫺3 SD to ⫹3 SD (175 stimuli in each database).
Experiment 1 presents validation data for all seven dimensions, showing that human judgments track the predictions of
the models. Social judgments from faces are highly intercorrelated with each other (Oosterhof & Todorov, 2008) and similar
(correlated) judgments result in similar models. This similarity
should constrain the ability of the models to differentiate between judgments. Experiment 2 shows that the divergent validity of the models predictably deteriorates as their similarity
increases. Finally, we discuss how to control for shared variance in correlated models. For example, even for highly correlated dimensions (e.g., dominance and threat), we can identify
cues specific to each dimension and, consequently, generate
faces that vary only on these cues.
Experiment 1
First, we generated a diverse set of novel faces that were not
used to create the seven models of attractiveness, competence,
Figure 2. A computational model of judgments of attractiveness. An example of a face manipulated in the
model (a). Increasing values indicate increased perceptions of attractiveness. Linear (lighter gray shade) and
quadratic (darker gray shade) fit of judgments of attractiveness as a function of the model values of the faces (b).
Error bars indicate standard error of the mean. Amount of explained variance in linear and quadratic models for
each of the identities used to validate the computational model (c). For a color version of this figure, please see
the supplemental materials link on the first page of this article.
�COMPUTATIONAL MODELS OF SOCIAL PERCEPTION OF FACES
dominance, extroversion, likability, threat, and trustworthiness.
Second, we applied these models (both shape and reflectance)
to the novel faces. For each face identity and each model, we
generated seven variations along the respective dimension: ⫺3,
⫺2, ⫺1, 0, 1, 2, and 3 SD levels. Third, we asked participants
to judge these manipulated faces on the dimensions of interest.
This document is copyrighted by the American Psychological Association or one of its allied publishers.
This article is intended solely for the personal use of the individual user and is not to be disseminated broadly.
Method
Participants. Thirty-five Princeton University students and
community members (27 women, Mage ⫽ 22.00 years) participated
for payment.
Materials. The stimuli consisted of computer-generated male
faces created with the FaceGen software development kit (Singular
Inversions, Toronto, Canada). In FaceGen, faces are represented as
points in 100-dimensional face space (50 shape and 50 reflectance
dimensions). Moving a point (i.e., a face) along a single dimension
changes the shape or reflectance map of a face in specific ways.
Meaningful social dimensions, such as trustworthiness or dominance, can be modeled as linear combinations of these basic
FaceGen dimensions based on trait judgments of random points in
the space (see Oosterhof & Todorov, 2008, for a detailed description of this procedure). We previously modeled social dimensions
727
on both shape and reflectance (Todorov & Oosterhof, 2011). Here,
we validate seven of these dimensions: attractiveness, competence,
dominance, extroversion, likability, threat, and trustworthiness. To
avoid circularity and assess generalizability, these traits are validated on a new set of male faces, which were not used to create the
models.
Because we wanted to validate the models using a diverse set of
faces, we created a sample of maximally distinctive identities. To
create the stimuli, we first generated a random sample of 1,000
faces. We then chose the 25 faces that differed maximally from
each other based on the average Euclidean distance to all other
faces. This resulted in a sample of maximally distinctive faces, but
also in faces that looked atypical. To reduce this atypicality, we
scaled the face coordinates with a factor of 0.5, essentially bringing them closer to the average face. This procedure preserves the
ratio of differences so that the faces still differ maximally from
each other, yet look more typical. Figure 1 shows all 25 identities.
We then applied the social dimensions (both shape and reflectance) to each identity by projecting the face point on the respective dimension. For example, for our manipulation of trustworthiness, we changed the face space coordinates of an identity such
that the resulting face scored precisely 0 on trustworthiness, cre-
Figure 3. A computational model of judgments of competence. An example of a face manipulated in the model
(a). Increasing values indicate increased perceptions of competence. Linear (lighter gray shade) and quadratic
(darker gray shade) fit of judgments of competence as a function of the model values of the faces (b). Error bars
indicate standard error of the mean. Amount of explained variance in linear and quadratic models for each of the
identities used to validate the computational model (c). For a color version of this figure, please see the
supplemental materials link on the first page of this article.
�This document is copyrighted by the American Psychological Association or one of its allied publishers.
This article is intended solely for the personal use of the individual user and is not to be disseminated broadly.
728
TODOROV, DOTSCH, PORTER, OOSTERHOF, AND FALVELLO
Figure 4. A computational model of judgments of dominance. An example of a face manipulated in the model
(a). Increasing values indicate increased perceptions of dominance. Linear (lighter gray shade) and quadratic
(darker gray shade) fit of judgments of dominance as a function of the model values of the faces (b). Error bars
indicate standard error of the mean. Amount of explained variance in linear and quadratic models for each of the
identities used to validate the computational model (c). For a color version of this figure, please see the
supplemental materials link on the first page of this article.
ating the neutral trustworthy face for a given identity. We then
generated six more faces by moving this identity’s neutral face
along the trustworthiness dimension to ⫺3, ⫺2, ⫺1, 1, 2, and 3 SD
levels of trustworthiness (the face dimensions are normally distributed). This resulted in a total of seven faces differing maximally in trustworthiness (relative to differences on other dimensions) based on a single identity. Each (a) panel in Figures 2–8
shows for each social dimension the seven levels of faces based on
Identity 1. We repeated this procedure for all 25 identities and for
all seven social dimensions, resulting in a total of 25 ⫻ 7 ⫻ 7 ⫽
1,225 faces.
Procedure. Because presenting all faces from all seven dimensions to participants would have resulted in a long and burdensome experiment, we divided the judgments into triplets. Specifically, we generated all 35 possible triplet combinations (e.g.,
attractiveness, extroversion, threat) of the seven dimensions. Each
of the 35 participants was assigned to one unique triplet combination. This procedure resulted in 15 participants providing judgments for each of the seven traits.
Participants completed their set of three judgment tasks organized in different blocks. The order of judgment tasks was
randomized for each participant. A judgment task for a given
trait dimension contained as stimuli, for each of the 25 identities, only the seven faces that varied on that specific dimension,
yielding a total of 175 faces per judgment task (525 ratings in
total per participant). Participants judged the faces on a 9-point
scale, ranging from 1 (not at all) to 9 (extremely), based on how
well that face represented the intended trait (i.e., “How [trait] is
this person?”).
Participants were (a) asked to rely on their “gut instinct” and not
to spend too much time on any one face, (b) told that there are no
right or wrong answers, and (c) not informed of the manipulation
of the faces. Faces were presented in random order within each
judgment block, and participants were given unlimited time to
respond to each face. Each trial was preceded by a 500-ms fixation
cross and followed by a 500-ms blank screen.
Results and Discussion
To assess interrater reliabilities, we computed Cronbach’s alpha
for each dimension (reported in Table 1). Across dimensions,
reliability was high: ␣min ⫽ .97, ␣median ⫽ .98, when calculated
using raw ratings; and ␣min ⫽ .86, ␣median ⫽ .91, when calculated
using ratings averaged across identities.
�This document is copyrighted by the American Psychological Association or one of its allied publishers.
This article is intended solely for the personal use of the individual user and is not to be disseminated broadly.
COMPUTATIONAL MODELS OF SOCIAL PERCEPTION OF FACES
729
Figure 5. A computational model of judgments of extroversion. An example of a face manipulated in the
model. Increasing values indicate increased perceptions of extroversion (a). Linear (lighter gray shade) and
quadratic (darker gray shade) fit of judgments of extroversion as a function of the model values of the faces (b).
Error bars indicate standard error of the mean. Amount of explained variance in linear and quadratic models for
each of the identities used to validate the computational model (c). For a color version of this figure, please see
the supplemental materials link on the first page of this article.
We then assessed to what extent participants’ trait judgments
tracked each social dimension. We fitted linear and quadratic
models to the aggregated trait judgments (averaged across identities and participants) for each social dimension separately, with the
level of social dimension as the predictor. Each (b) panel of
Figures 2–8 shows the resulting regression lines in lighter gray
shade (linear) and darker gray shade (quadratic). All models explained a significant amount of variance, Fs(1, 6) ⱖ 123.40, ps ⬍
.001, R2s ⬎ .96, indicating that judgments indeed varied as a
function of the level of the intended social dimension. Although all
dimensions, except for dominance and extroversion, showed significantly better fit for the quadratic model than the linear model,
Fs ⬎ 16.63, ps ⬍ .05, except for attractiveness where F(1, 5) ⫽
5.06, p ⫽ .09, the amount of additional variance explained was
practically negligible. These results suggest that, in the studied
range of ⫺3 to ⫹ 3 SD, the models could be treated as linear.
The intended trait variance might have been more visible for
some face identities than others. To quantify the extent to which
participants’ trait judgments for each identity tracked levels of the
intended social dimensions, we fitted linear and quadratic models
to the trait judgments (averaged across participants only) for each
identity and social dimension separately. The resulting R2s are
depicted by identity in each panel (c) of Figures 2–8. Although we
can observe some variability across identities (more pronounced
for the models of attractiveness [Figure 2c], competence [Figure
3c], and likability [Figure 6c]), the models fit remarkably well for
each identity, accounting for at least 75% of the variance of all
judgments.
Experiment 2
Experiment 1 showed that participants’ judgments tracked the
predictions of all seven different models. It is also important to
show that the models make specific predictions with respect to
each other. The objective of Experiment 2 was to provide evidence
for the divergent validity of the models. Manipulations along a
specific dimension (e.g., threat) should evoke larger changes in the
respective judgment (e.g., threat) than in other judgments (e.g.,
competence). At the same time, we expected that these differences
in judgments should be constrained by the similarity of the models,
reflecting the similarity of the judgments used to create the models.
As shown in Table 2, although the models were highly correlated with each other, there was considerable variation in these
correlations. For example, whereas the threat model correlated
�This document is copyrighted by the American Psychological Association or one of its allied publishers.
This article is intended solely for the personal use of the individual user and is not to be disseminated broadly.
730
TODOROV, DOTSCH, PORTER, OOSTERHOF, AND FALVELLO
Figure 6. A computational model of judgments of likability. An example of a face manipulated in the model
(a). Increasing values indicate increased perceptions of likability. Linear (lighter gray shade) and quadratic
(darker gray shade) fit of judgments of likability as a function of the model values of the faces (b). Error bars
indicate standard error of the mean. Amount of explained variance in linear and quadratic models for each of the
identities used to validate the computational model (c). For a color version of this figure, please see the
supplemental materials link on the first page of this article.
highly with the dominance model, it was practically uncorrelated
with the competence model. Hence, whereas threat judgments and
dominance judgments of faces manipulated on threat might not
differ much if at all, threat judgments and competence judgments
of the same faces should differ substantially.
Method
Participants. Seventeen Princeton University undergraduate
students (12 women, Mage ⫽ 19.71 years) participated for course
credit.
Materials. From the 25 face identities generated for Experiment
1, four identities were chosen at random. For each of these four
identities, the most extreme variations (⫺3 SD and ⫹ 3 SD) on all
seven trait dimensions, as generated in Experiment 1, were used as
stimuli, for a total of 4 ⫻ 2 ⫻ 7 (Identities ⫻ Values ⫻ Dimensions) ⫽
56 faces.
Procedure. Participants completed seven judgment tasks, one
for each investigated trait (i.e., attractive, competent, dominant,
extroverted, likable, threatening, and trustworthy). The judgment
tasks were organized into different blocks, and the order of the
blocks was randomized for each participant. A judgment task
contained as stimuli all 56 faces described above. As a result,
within each judgment task, participants judged not only faces
manipulated on the specific trait being judged, but also faces
manipulated on every other trait model. Participants judged the
faces on a 9-point scale, ranging from 1 (not at all) to 9 (extremely), based on how well that face represented the judged trait
(i.e., “How [trait] is this person?”).
As in Experiment 1, participants were told to go with their “gut
instinct” and not to spend too much time on any one face, that there
were no right or wrong answers, and they were not informed of the
manipulations. Faces were presented in random order within each
block, and participants were given unlimited time to respond to
each face. Each trial was preceded by a 500-ms fixation cross and
followed by a 500-ms blank screen.
The overall design was a 7 ⫻ 7 ⫻ 2 (Judgment [attractiveness,
competence, dominance, extroversion, likability, threat, trustworthiness] ⫻ Model [attractiveness, competence, dominance, extroversion,
likability, threat, trustworthiness] ⫻ Face Value on Model [⫺3 SD vs.
⫹3 SD]) repeated-measures analysis of variance (ANOVA).
Results and Discussion
Not surprisingly, the 3-way interaction of judgment, model, and
face value was highly significant, F(36, 576) ⫽ 39.36, p ⬍ .001.
�This document is copyrighted by the American Psychological Association or one of its allied publishers.
This article is intended solely for the personal use of the individual user and is not to be disseminated broadly.
COMPUTATIONAL MODELS OF SOCIAL PERCEPTION OF FACES
731
Figure 7. A computational model of judgments of threat. An example of a face manipulated in the model (a).
Increasing values indicate increased perceptions of threat. Linear (lighter gray shade) and quadratic (darker gray
shade) fit of judgments of threat as a function of the model values of the faces (b). Error bars indicate standard
error of the mean. Amount of explained variance in linear and quadratic models for each of the identities used
to validate the computational model (c). For a color version of this figure, please see the supplemental materials
link on the first page of this article.
Consequently, we analyzed the data at the level of the judgment.
For each of the seven judgments, we submitted the data to a 7 ⫻
2 (Model ⫻ Face Value on Model) repeated-measures ANOVA. A
significant interaction in this analysis indicates that the specific
judgment is affected differently by the manipulations of the faces
on the seven dimensions. In fact, for each of the seven judgments,
this interaction was highly significant, Fs(6, 96) ⬎ 17.80, ps ⬍
.001. In other words, the differences between judgments of the
faces with negative and positive values on the seven dimensions
differed significantly.
Moreover, we expected that this difference should be related to
the similarity of the models (see Table 2). That is, similar models
should result in similar differences in judgments. Following the
significant interaction of model and face, for each type of judgment, we first computed the difference between judgments of faces
with negative and positive values for the seven models. Second,
based on the similarity of the models, we computed a linear
contrast for this difference in judgments. We used the correlation
of the models as a measure of their similarity. In a multidimensional space, the correlation between two models indicates the
angle between the respective vectors in face space.
For example, for attractiveness judgments, the attractiveness
model was closer to the likability model than to the competence
and trustworthiness models, and furthest from the threat model.
The contrast values reflected this distance between the models. For
each of the judgments, the linear contrast was highly significant:
attractiveness, F(1, 16) ⫽ 66.62, p ⬍ .001 (see Figure 9a); competence, F(1, 16) ⫽ 75.19, p ⬍ .001 (see Figure 9b); dominance,
F(1, 16) ⫽ 47.07, p ⬍ .001 (see Figure 9c); extroversion,
F(1, 16) ⫽ 25.29, p ⬍ .001 (see Figure 9d); likability, F(1, 16) ⫽
79.78, p ⬍ .001 (see Figure 9e); threat, F(1, 16) ⫽ 155.23, p ⬍
.001 (see Figure 9f); and trustworthiness, F(1, 16) ⫽ 48.44, p ⬍
.001 (see Figure 9g). For each judgment, as the similarity between
the matching model and the remaining models increased, the
differences in judgments of faces with positive and negative values
on the respective dimensions increased too. For highly dissimilar
(negatively correlated) models (e.g., attractiveness and threat),
these differences reversed in sign.
We can illustrate this finding with the judgment that conformed
most closely to our predictions: threat (see Figure 9f). The difference between threat judgments of faces manipulated to be threatening and unthreatening, respectively, was the largest, followed
closely by the difference for faces manipulated to be dominant and
submissive, respectively. These two dimensions are highly similar
to each other (r ⫽ .93). Threat judgments did not vary for faces
manipulated to be competent and incompetent, respectively, a
�TODOROV, DOTSCH, PORTER, OOSTERHOF, AND FALVELLO
This document is copyrighted by the American Psychological Association or one of its allied publishers.
This article is intended solely for the personal use of the individual user and is not to be disseminated broadly.
732
Figure 8. A computational model of judgments of trustworthiness. An example of a face manipulated in the
model (a). Increasing values indicate increased perceptions of trustworthiness. Linear (lighter gray shade) and
quadratic (darker gray shade) fit of judgments of trustworthiness as a function of the model values of the faces
(b). Error bars indicate standard error of the mean. Amount of explained variance in linear and quadratic models
for each of the identities used to validate the computational model (c). For a color version of this figure, please
see the supplemental materials link on the first page of this article.
dimension almost orthogonal to threat (r ⫽ .07). Threat judgments
were lower for faces manipulated to be attractive, likable, and
extroverted than for faces manipulated to be unattractive, unlikable, and introverted, respectively. The difference in threat judgments for these three models was almost the same, reflecting their
relative equidistance from the threat model (r range: ⫺.38 to
⫺.42). Finally, this difference in threat judgments on the above
three manipulations was smaller than the difference in threat
judgments of faces manipulated to be untrustworthy and trustworthy, a model highly negatively correlated with the threat model
(r ⫽ ⫺.77). Although the data were noisier for the remaining
judgments, they all conformed to the predicted pattern (see
Figure 9).
To summarize the findings across all models and judgments, we
also examined how the pairwise similarity of the models predicted
differences in the respective judgments. For example, the threat
Table 1
Interrater Reliabilities of Judgments of Faces Manipulated on Seven Different Social Dimensions
(Based on Raw Ratings and on Ratings Averaged Across Identities)
Dimension
n
Cronbach’s ␣
(based on raw ratings)
Cronbach’s ␣
(based on ratings averaged across identities)
Attractive
Competent
Dominant
Extroverted
Likable
Threatening
Trustworthy
15
15
15
15
15
15
15
.99
.98
.99
.97
.98
.99
.98
.94
.93
.91
.86
.88
.95
.89
�COMPUTATIONAL MODELS OF SOCIAL PERCEPTION OF FACES
733
Table 2
Correlations Between Models of Judgments of Faces Manipulated on Seven Different Social
Dimensions
Dimension
This document is copyrighted by the American Psychological Association or one of its allied publishers.
This article is intended solely for the personal use of the individual user and is not to be disseminated broadly.
1.
2.
3.
4.
5.
6.
7.
Attractive
Competent
Dominant
Extroverted
Likable
Threatening
Trustworthy
1.
2.
3.
4.
5.
6.
.71
⫺.23
.32
.81
⫺.42
.53
.32
.48
.66
.07
.29
⫺.19
⫺.16
.93
⫺.57
.53
⫺.38
.67
⫺.42
.75
⫺.77
Note. The correlations are computed from the face space component values of the seven dimensions and
indicate the similarity (the angle between the respective vectors) of the models.
and dominance models are highly similar. Hence, the difference in
threat judgments of faces manipulated on threat and threat judgments of faces manipulated on dominance should be very similar,
and subtracting these differences from each other should be close
to zero. In contrast, the threat and trustworthiness models are
highly dissimilar and, hence, subtracting the differences in judgments should result in large values. There were 21 pairwise correlations for the seven models. However, there were 42 corresponding differences in judgments, because for each pair of
models there were two types of judgments (on the manipulated
faces for each model). For example, for the threat and dominance
dimensions, these are (a) the differences in threat judgments of
faces manipulated on threat and dominance, respectively, and (b)
the differences in dominance judgments of faces manipulated on
dominance and threat, respectively. For simplicity, and because
these differences were highly correlated (r ⫽ .88), we used their
average. This average difference indicates how well the two models are differentiated by the respective judgments. As shown in
Figure 9h, the similarity between the models is highly correlated
with the differences in judgments of manipulated faces (r ⫽ ⫺.96).
As similarity between the models increases, the judgments differentiate less between the models.
General Discussion
We validated seven computational models of social judgments
of faces. These models are based on judgments of randomly
generated faces from a statistical multidimensional face space
(Todorov & Oosterhof, 2011). The resulting models are new
dimensions in the face space that account for the maximum
amount of variance in their respective judgment. These models are
not biased by prior preconceptions of what “features” are important for specific judgments. Although the models are constrained
by the statistical model used to generate faces, in principle, they
can reveal all the cues that systematically vary with specific
judgments. In this way, the models can be used as a discovery tool,
particularly well suited for discovering the perceptual basis of
ill-defined social categories.
For example, modeling face reflectance reveals the extreme
importance of masculinity and femininity cues for social judgments. In our initial work on modeling face shape (Oosterhof &
Todorov, 2008), we emphasized the emotion signal in the model of
trustworthiness, a judgment that most closely resembles general
valence evaluation of faces. In fact, as faces were manipulated to
become more and more trustworthy, they were perceived as expressing happiness. In contrast, as faces were manipulated to
become more and more untrustworthy, they were perceived as
expressing anger. Although the trustworthiness dimension also
covaried with the masculinity and femininity of faces, with more
trustworthiness resulting in more feminine faces, this signal was
less obvious than the emotion signal. However, in the models
based on reflectance, the masculinity/femininity signal is unmistakable. Moreover, it is present in most models, and it is the most
obvious signal in the models of dominance and threat. The most
dominant and most threatening faces are extremely masculine in
appearance.
Not only can the models be used as a discovery tool, but they
can also be applied to novel faces, which can be parametrically
manipulated on the respective social dimensions. As shown here,
judgments of faces manipulated on the dimensions track the intended changes in the evaluation of the faces. However, as shown
in Experiment 2, the ability of the models to differentiate different
social judgments is constrained by the similarity of the judgments.
Not surprisingly, highly similar models are not capable of differentiating the respective judgments (e.g., dominance and threat). At
the same time, these models can be further manipulated to remove
shared variance with any other model, a topic that we revisit later
in the section on controlling shared variance between models.
Parametrically Controlled Face Databases
A major issue facing researchers interested in face evaluation is
the selection of stimuli. The standard approach is to find a large
number of face images (e.g., from Internet sources or various
databases of photographs) and have participants rate them on
social dimensions of interest. Then, the researcher selects those
images that fit their criteria, say, the top and bottom 25% of the
faces rated on trustworthiness. There are several problems with
this approach. First, often the number of stimuli is insufficient.
Imagine a study on first impressions that requires about 200 trials,
a reasonable number for many experiments. Because the study is
about first impressions, the researcher needs to present unique
stimuli on each trial. Unfortunately, existing databases of standardized faces rarely provide that many unique stimuli (e.g., Lundqvist,
Flykt, & Öhman, 1998). Second, the stimuli often differ on a
number of dimensions that are not well controlled. For example,
differences in age, sex, and expressions (even when these are
classified as emotionally neutral) can affect the results in unex-
�TODOROV, DOTSCH, PORTER, OOSTERHOF, AND FALVELLO
This document is copyrighted by the American Psychological Association or one of its allied publishers.
This article is intended solely for the personal use of the individual user and is not to be disseminated broadly.
734
Figure 9. Differences in judgments of faces with negative and positive values on model dimensions as a
function of the similarity of the models. For panels a⫺g, the x axis plots the correlations between the model that
matches the target judgment and the remaining models. Error bars indicate standard error of the mean. The line
indicates the best linear fit. Attractiveness judgments (a). Competence judgments (b). Dominance judgments (c).
Extroversion judgments (d). Likability judgments (e). Threat judgments (f). Trustworthiness judgments (g). A
scatterplot of the pairwise similarity of the models (plotted on the x axis) and the ability of the corresponding
judgments to differentiate the models (plotted on the y axis) (h).
�This document is copyrighted by the American Psychological Association or one of its allied publishers.
This article is intended solely for the personal use of the individual user and is not to be disseminated broadly.
COMPUTATIONAL MODELS OF SOCIAL PERCEPTION OF FACES
735
Figure 10. A model of trustworthiness judgments with different degrees of control for attractiveness. The
model is not corrected for attractiveness (a). More trustworthy faces are also perceived as more attractive. The
model is orthogonal to a model of attractiveness (b). The model subtracts the model of attractiveness (c). More
trustworthy faces are perceived as less attractive. For a color version of this figure, please see the supplemental
materials link on the first page of this article.
pected ways or, at the very least, contribute noise to the analysis.
Third, because stimuli are often selected in an ad hoc fashion, the
findings across studies may not be comparable. In most cases, this
is due to differences in the range of stimuli. To take an extreme
example, an early study on inferences of intelligence from facial
appearance included faces of individuals with Down syndrome
(Gaskill, Fenton, & Porter, 1927). Not surprisingly, this study
obtained very high correlations between judgments and measures
of intelligence. This is an issue that concerns not only behavioral
but also neuroimaging studies. For example, neuroimaging studies
of evaluations of face attractiveness and trustworthiness have often
observed different networks of brain regions evoked by these
evaluations (see Mende-Siedlecki, Said, & Todorov, 2012), although behavioral ratings of attractiveness and trustworthiness are
highly positively correlated. A recent meta-analysis found that
these differences in neural activation could be attributed to the use
of different stimuli in these studies, namely, extremely attractive
faces in attractiveness studies (Mende-Siedlecki et al., 2012).
Faces generated by computational models of social judgments
provide an alternative to the standard approach. A secondary
objective of this article was to describe the validated faces in
sufficient detail so that other research groups can use the faces. For
this purpose, we also provided data for each of the 25 face
identities, which were manipulated on the social dimensions described previously. As can be seen in Figures 2–8, although there
is some variation in the effects of the models on different identities, the models work very well for all tested identities. Researchers who do not need to use all stimuli can select those identities for
which the intended manipulations work best or simply randomly
select a subset of faces from the 25 original faces (see Figure 1).
The face databases described here can be used in a variety of
research settings. Researchers interested in the neural basis of face
evaluation can use these stimuli to study how neural responses
change as a function of the parametric manipulation of the stimuli
(e.g., Todorov, Said, Oosterhof, & Engell, 2011). Researchers
interested in how inferences from facial appearance affect social
decisions can use the stimuli to study how different impressions
affect decisions (e.g., (Rezlescu et al., 2012; Schliht, Shinsuke,
Camerer, Battaglia, & Nakayama, 2010). The stimuli can also be
used in real interaction situations in which participants can choose
specific face stimuli to represent them. For example, Tingley (in
press) asked participants to select a face avatar to represent them
in an economic trust game. The faces were generated using a face
shape model of trustworthiness (Oosterhof & Todorov, 2008).
Tingley found that participants were more likely to choose trustworthy faces and that these choices were consequential, namely,
�This document is copyrighted by the American Psychological Association or one of its allied publishers.
This article is intended solely for the personal use of the individual user and is not to be disseminated broadly.
736
TODOROV, DOTSCH, PORTER, OOSTERHOF, AND FALVELLO
Figure 11. Creating a model of threat judgments controlling for dominance. Model of threat judgments (a).
Model of dominance judgments (b). Model of threat judgments after subtracting model of dominance judgments
(c). For a color version of this figure, please see the supplemental materials link on the first page of this article.
participants represented by more trustworthy avatars earned more
in the economic exchange.
The described databases contain 25 identities by seven levels on
the seven social dimensions. We think that these stimuli will be
sufficient for most research purposes. However, it should be noted
that these numbers are arbitrary. In principle, the models can be
applied to an unlimited number of identities that can be manipulated to take on an infinite number of intermediate values on the
dimensions.
Controlling for Shared Variance Between Models
The models can also be extended to control for correlations
between different social dimensions, something that is very difficult to achieve without a computational model. As noted earlier,
social judgments from faces are highly correlated with each other.
To take a specific example, the correlation between trustworthiness and attractiveness judgments of 300 randomly generated faces
(faces and data are available at http://tlab.princeton.edu/databases/
randomfaces) is .61 (typically these correlations range from
.60⫺.80; Oosterhof & Todorov, 2008). Such high correlations
make it difficult to find faces that differ on one of the dimensions
but not on the other. For the set of these 300 faces, there are less
than 40 faces that differ sufficiently on trustworthiness (in the
highest and lowest quartiles of the trustworthiness distribution) but
are similar on attractiveness.
We illustrate with two examples how to control for such natural
confounds in judgments using the computational approach. First,
we do this for the models of trustworthiness and attractiveness,
because the most common criticism of effects of specific face
manipulations (such as trustworthiness and competence) on social
outcomes is that these effects may be attributed to wellcharacterized attractiveness halo effects (Eagly, Makhijani, Ashmore, & Longo, 1991). Second, we do this for the models of
dominance and threat, because they are extremely highly correlated.
In the current approach, we can precisely control for such
natural confounds in social dimensions without restricting the set
of potential face stimuli. The first possibility is to orthogonalize
the two dimensions, removing any shared variance (Oosterhof &
Todorov, 2008). In the case of trustworthiness and attractiveness
(see Figure 10), the resulting trustworthiness model should produce faces that do not differ on attractiveness (see Figure 10b).
However, because the correspondence of initial judgments used to
build the models and the resulting models is not perfect, some
positive correlations between attractiveness and trustworthiness
judgments of faces produced by this orthogonal model may still be
�This document is copyrighted by the American Psychological Association or one of its allied publishers.
This article is intended solely for the personal use of the individual user and is not to be disseminated broadly.
COMPUTATIONAL MODELS OF SOCIAL PERCEPTION OF FACES
present. The second possibility is to subtract the dimension one
wants to control for (e.g., attractiveness) from the dimension of
interest (e.g., trustworthiness). In the resulting model, more trustworthy faces are actually less attractive (see Figure 10c). Hence,
any effects of the manipulation of trustworthiness on the task of
interest cannot be attributed to an attractiveness confound.
The models of threat (see Figure 11a) and dominance (see
Figure 11b) are extremely highly correlated (r ⫽ .93). Yet, after
subtracting the dominance dimension from the threat dimension,
we can visualize the differences and obtain a meaningful model.
As shown in Figure 11c, these threatening (nondominant) faces
seem to express more negative emotions. This reveals the emotion
signal in perceptions of threat—another example of the use of the
computational models as a discovery tool.
Study Limitations
There are, of course, disadvantages to using computer-generated
rather than real faces. For example, all of the faces in the current
article were male faces. This choice was dictated by the fact that
there is a bias to classify bald, hairless faces as males (see Dotsch
& Todorov, 2012, for a reverse correlation approach using natural
faces with hair). However, it is not difficult to create separate
models for male and female faces. We are currently working on
such models (see also Said & Todorov, 2011). Another disadvantage is that the faces lack realism compared to photographs of
individuals, and they may not be the best stimuli for studies on
learning and memory for faces. However, this is largely a question
of technology development. Recent work has demonstrated the
feasibility of manipulating near-photographic realistic faces
(Walker & Vetter, 2009), and we suspect that, in the near future,
the realism of face avatars will benefit from such developments
(e.g., Jack, Garrod, Yu, Caldara, & Schyns, 2012).
In sum, although computer-generated faces have some disadvantages, for many research questions the increased experimental
control they provide may favor their use over photographic stimuli.
We hope that the databases described here will be of use to
researchers interested in the study of face evaluation and its effects
on social interactions and decisions.
References
Ballew, C. C., & Todorov, A. (2007). Predicting political elections from
rapid and unreflective face judgments. PNAS: Proceedings of the National Academy of Sciences of the United States of America, 104,
17948 –17953.
Bar, M., Neta, M., & Linz, H. (2006). Very first impressions. Emotion,
6(2), 269 –278.
Berry, D. S., & Landry, J. C. (1997). Facial maturity and daily social
interaction. Journal of Personality and Social Psychology, 72, 570 –580.
doi:10.1037/0022-3514.72.3.570
Blanz, V., & Vetter, T. (1999). A morphable model for the synthesis of 3D
faces. In W. Waggenspack (Ed.), Proceedings of the 26th Annual Conference on Computer Graphics and Interactive Techniques (pp. 187–
194). New York, NY: ACM Press.
Blanz, V., & Vetter, T. (2003). Face recognition based on fitting a 3D
morphable model. IEEE Transactions on Pattern Analysis and Machine
Intelligence, 25, 1063–1074.
Boothroyd, L. G., Jones, B. C., Burt, D. M., & Perrett, D. I. (2007). Partner
characteristics associated with masculinity, health, and maturity in male
faces. Personality and Individual Differences, 43(5), 1161–1173.
737
Buckingham, G., DeBruine, L. M., Little, A. C., Welling, L. L. M.,
Conway, C. A., Tiddeman, B. P., & Jones, B. C. (2006). Visual adaptation to masculine and feminine faces influences generalized preferences and perceptions of trustworthiness. Evolution & Human Behavior,
27, 381–389. doi:10.1016/j.evolhumbehav.2006.03.001
Copley, J. E., & Brownlow, S. (1995). The interactive effects of facial
maturity and name warmth on perceptions of job candidates. Basic and
Applied Social Psychology, 16(1–2), 251–265.
DeBruine, L. M. (2002). Facial resemblance enhances trust. Proceedings of
the Royal Society. B, Biological Sciences, 269, 1307–1312.
DeBruine, L. M. (2005). Trustworthy but not lust-worthy: Context specific
effects of facial resemblance. Proceedings of the Royal Society. B,
Biological Sciences, 272, 919 –922.
DeBruine, L. M., Jones, B. C., Little, A. C., & Perrett, D. I. (2008). Social
perception of facial resemblance in humans. Archives of Sexual Behavior, 37, 64 –77.
Dotsch, R., & Todorov, A. (2012). Reverse correlating social face perception. Social Psychological & Personality Science, 3, 562–571. doi:
10.1177/1948550611430272
Eagly, A. H., Makhijani, M. G., Ashmore, R. D., & Longo, L. C. (1991).
What is beautiful is good, but . . .: A meta-analytic review of research on
the physical attractiveness stereotype. Psychological Bulletin, 110, 109 –
128. doi:10.1037/0033-2909.110.1.109
Ekman, P. (1993). Facial expression and emotion. American Psychologist,
48, 384 –392.
Gaskill, P. C., Fenton, N., & Porter, J. P. (1927). Judging the intelligence
of boys from their photographs. Journal of Applied Psychology, 11,
394 – 403.
Gosselin, F., & Schyns, P. G. (2001). Bubbles: A technique to reveal the
use of information in recognition tasks. Vision Research, 41, 2261–2271.
Graham, J. R., Harvey, C. R., & Puri, M. (2010). A corporate beauty
contest (NBER Working Paper No. 15906). Cambridge, MA: National
Bureau of Economic Research.
Hamermesh, D. S., & Biddle, J. E. (1994). Beauty and the labor market.
The American Economic Review, 84, 1174 –1194.
Jack, R. E., Garrod, O. G. B., Yu, H., Caldara, R., & Schyns, P. G. (2012).
Facial expressions of emotions are not culturally universal. PNAS:
Proceedings of the National Academy of Sciences of the United States of
America, 109, 7241–7244.
Kontsevich, L. L., & Tyler, C. W. (2004). What makes Mona Lisa smile?
Vision Research, 44, 1493–1498.
Kraus, M. W., & Chen, S. (2010). Facial-feature resemblance elicits the
transference effect. Psychological Science, 21, 518 –522.
Lundqvist, D., Flykt, A., & Öhman, A. (1998). Karolinska Directed
Emotional Faces [database]. Retrieved from http://www.emotionlab.se/
resources/kdef
Mangini, M. C., & Biederman, I. (2004). Making the ineffable explicit:
Estimating the information employed for face classification. Cognitive
Sciences, 28, 209 –226.
Mende-Siedlecki, P., Said, C. P., & Todorov, A. (2012). The social
evaluation of faces: A meta-analysis of functional neuroimaging studies.
Social Cognitive and Affective Neuroscience. Advance online publication. doi:10.1093/scan/nsr090
Montepare, J. M., & Dobish, H. (2003). The contribution of emotion
perceptions and their overgeneralizations to trait impressions. Journal of
Nonverbal Behavior, 27, 237–254. doi:10.1007/BF02173411
Montepare, J. M., & Zebrowitz, L. A. (1998). Person perception comes of
age: The salience and significance of age in social judgments. Advances
in Experimental Social Psychology, 30, 93–161.
Mueller, U., & Mazur, A. (1996). Facial dominance of West Point cadets
as a predictor of later military rank. Social Forces, 74, 823– 850.
Neth, D., & Martinez, A. M. (2009). Emotion perception in emotionless
face images suggests a norm-based representation. Journal of Vision, 9,
5. doi:10.1167/9.1.5
�This document is copyrighted by the American Psychological Association or one of its allied publishers.
This article is intended solely for the personal use of the individual user and is not to be disseminated broadly.
738
TODOROV, DOTSCH, PORTER, OOSTERHOF, AND FALVELLO
Olivola, C. Y., & Todorov, A. (2010a). Fooled by first impressions?
Reexamining the diagnostic value of appearance-based inferences. Journal of Experimental Social Psychology, 46(2), 315–324.
Olivola, C. Y., & Todorov, A. (2010b). Elected in 100 milliseconds:
Appearance-based trait inferences and voting. Journal of Nonverbal
Behavior, 34(2), 83–110.
Oosterhof, N. N., & Todorov, A. (2008). The functional basis of face
evaluation. PNAS: Proceedings of the National Academy of Sciences of
the United States of America, 105, 11087–11092.
Oosterhof, N. N., & Todorov, A. (2009). Shared perceptual basis of
emotional expressions and trustworthiness impressions from faces. Emotion, 9, 128 –133.
Porter, S., ten Brinke, L., & Gustaw, C. (2010). Dangerous decisions: The
impact of first impressions of trustworthiness on the evaluation of legal
evidence and defendant culpability. Psychology, Crime & Law, 16(6),
477– 491.
Rezlescu, C., Duchaine, B., Olivola, C. Y., & Chater, N. (2012). Unfakeable facial configurations affect strategic choices in trust games with or
without information about past behavior. PLoS One, 7, e34293. doi:
10.1371/journal.pone.0034293
Rule, N. O., & Ambady, N. (2008). The face of success: Inferences from
chief executive officers’ appearance predict company profits. Psychological Science, 19(2), 109 –111.
Rule, N. O., Ambady, N., & Adams, R. B. (2009). Personality in perspective: Judgmental consistency across orientations of the face. Perception,
38(11), 1688 –1699.
Russell, J. A. (1997). Reading emotions from and into faces: Resurrecting
a dimensional contextual perspective. In A. J. Russell & J. M.
Fernandez-Dols (Eds.), The psychology of facial expressions (pp. 295–
320). New York, NY: Cambridge University Press.
Russell, J. A., Bachorowski, J., & Fernandez-Dols, J. (2003). Facial and
vocal expression of emotion. Annual Reviews of Psychology, 54, 329 –
349.
Sacco, D. F., & Hugenberg, K. (2009). The look of fear and anger: Facial
maturity modulates recognition of fearful and angry expressions. Emotion, 9(1), 39 – 49.
Said, C., Sebe, N., & Todorov, A. (2009). Structural resemblance to
emotional expressions predicts evaluation of emotionally neutral faces.
Emotion, 9, 260 –264.
Said, C. P., & Todorov, A. (2011). A statistical model of facial attractiveness. Psychological Science, 22, 1183–1190.
Schliht, E. J., Shinsuke, S., Camerer, C. F., Battaglia, P., & Nakayama, K.
(2010). Human wagering behavior depends on opponents’ faces. PLoS
One, 5, e11663. doi:10.1371/journal.pone.0011663
Tingley, D. (in press). Face off: Facial features and strategic choice.
Political Psychology. Retrieved from http://scholar.harvard.edu/files/
dtingley/files/avatartingley.pdf
Todorov, A., Dotsch, R., Wigboldus, D., & Said, C. P. (2011). Data-driven
methods for modeling social perception. Social & Personality Psychology Compass, 5, 775–791.
Todorov, A., Mandisodza, A. N., Goren, A., & Hall, C. C. (2005). Inferences of competence from faces predict election outcomes. Science, 308,
1623–1626.
Todorov, A., & Oosterhof, N. N. (2011). Modeling social perception of
faces. IEEE Signal Processing Magazine, 28, 117–122.
Todorov, A., Pakrashi, M., & Oosterhof, N. N. (2009). Evaluating faces on
trustworthiness after minimal time exposure. Social Cognition, 27, 813–
833.
Todorov, A., Said, C. P., Engell, A. D., & Oosterhof, N. N. (2008).
Understanding evaluation of faces on social dimensions. Trends in
Cognitive Sciences, 12, 455– 460.
Todorov, A., Said, C. P., Oosterhof, N. N., & Engell, A. D. (2011).
Task-invariant brain responses to the social value of faces. Journal of
Cognitive Neuroscience, 23, 2766 –2781.
Todorov, A., Said, C. P., & Verosky, S. C. (2011). Personality impressions
from facial appearance. In A. Calder, J. V. Haxby, M. Johnson, & G.
Rhodes (Eds.), Handbook of face perception (pp. 631– 652). New York,
NY: Oxford University Press.
van’t Wout, M., & Sanfey, A. G. (2008). Friend or foe: The effect of
implicit trustworthiness judgments in social decision making. Cognition,
108, 796 – 803. doi:10.1016/j.cognition.2008.07.002
Verosky, S. C., & Todorov, A. (2010a). Differential neural responses to
faces physically similar to the self as a function of their valence.
NeuroImage, 49, 1690 –1698. doi:10.1016/j.neuroimage.2009.10.017
Verosky, S. C., & Todorov, A. (2010b). Generalization of affective learning about faces to perceptually similar faces. Psychological Science, 21,
779 –785.
Walker, M., & Vetter, T. (2009). Portraits made to measure: Manipulating
social judgments about individuals with a statistical face model. Journal
of Vision, 9, 12. doi:10.1167/9.11.12
Willis, J., & Todorov, A. (2006). First impressions: Making up your mind
after a 100-ms exposure to a face. Psychological Science, 17(7), 592–
598.
Zebrowitz, L. A., Kikuchi, M., & Fellous, J. M. (2010). Facial resemblance
to emotions: Group differences, impression effects, and race stereotypes.
Journal of Personality and Social Psychology, 98, 175–189. doi:
10.1037/a0017990
Received April 26, 2012
Revision received January 14, 2013
Accepted February 4, 2013 䡲
�
 Jenny Porter