International Journal of GEOMATE, Oct., 2019 Vol.17, Issue 62, pp. 147 - 152
ISSN: 2186-2982 (P), 2186-2990 (O), Japan, DOI: https://doi.org/10.21660/2019.62.4694
Special Issue on Science, Engineering & Environment
THE STUDY OF SOIL WATER INFILTRATION UNDER
HORTICULTURAL AT THE UPSTREAM OF SUMANI
WATERSHED
* Aprisal 1, Bambang Istijono 2, Juniarti 3, and Mimin Harianti 4
1,3,4
2
Agriculture Faculty, Andalas University, Padang, Indonesia
, Engineering Faculty, Andalas University, Padang, Indonesia
* Corresponding Author, Received: 30 Oct. 2018, Revised: 10 Jan. 2019, Accepted: 20 March. 2019
ABSTRACT: Generally, the farming activities in the Sumani upstream watershed community are; cultivating
horticulture or vegetables such as cabbage, onions, potatoes, carrots, and flowers. The land cultivation for
these purposes is made possible due to the high fertility rate of the land in this region which is suitable for
horticultural crops. The soil in this area (including the order Andisol) develops from the weathering of the
residue from the eruption of Mount Talang. Most farmers do not implement soil and water conservation which
invariably leads to erosion and in the long run, the land will finally be degraded.. The purpose of this research
is to assess the capacity of water infiltration on some types of horticultural crops in the Sumani Upper watershed.
The survey method is used to determine the sampling points and the measurement of the rate of infiltration is
read using a ring infiltrometer. The soil samples were analyzed in the laboratory of the Department of Soil
Science under the Faculty of Agriculture, Andalas University. While the infiltration rate of the data was
processed using Horton’s equation. To determine the main factor affecting the infiltration rate, the principal
component analysis (PCA) was performed. The results showed that infiltration rate in three groups of farmers
ranged from moderate to fast. The main factors affecting it are; bulk density, texture and depth of the root zone.
The infiltration capacity, soil texture factor influence is more dominant and equals about to 61.7 percent.
Keywords: Horticulture, Infiltration capacity, Soil degradation
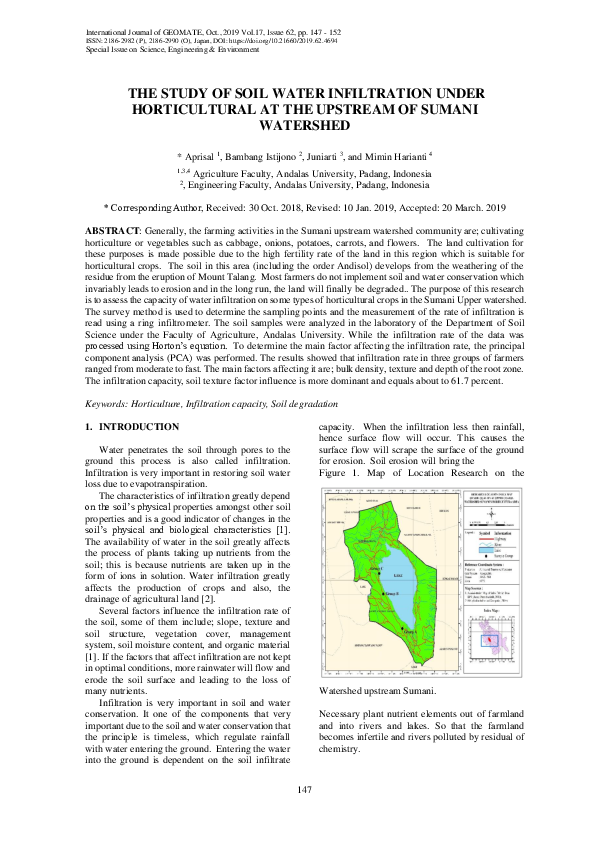
capacity. When the infiltration less then rainfall,
hence surface flow will occur. This causes the
surface flow will scrape the surface of the ground
for erosion. Soil erosion will bring the
Figure 1. Map of Location Research on the
1. INTRODUCTION
Water penetrates the soil through pores to the
ground this process is also called infiltration.
Infiltration is very important in restoring soil water
loss due to evapotranspiration.
The characteristics of infiltration greatly depend
on the soil’s physical properties amongst other soil
properties and is a good indicator of changes in the
soil’s physical and biological characteristics [1].
The availability of water in the soil greatly affects
the process of plants taking up nutrients from the
soil; this is because nutrients are taken up in the
form of ions in solution. Water infiltration greatly
affects the production of crops and also, the
drainage of agricultural land [2].
Several factors influence the infiltration rate of
the soil, some of them include; slope, texture and
soil structure, vegetation cover, management
system, soil moisture content, and organic material
[1]. If the factors that affect infiltration are not kept
in optimal conditions, more rainwater will flow and
erode the soil surface and leading to the loss of
many nutrients.
Infiltration is very important in soil and water
conservation. It one of the components that very
important due to the soil and water conservation that
the principle is timeless, which regulate rainfall
with water entering the ground. Entering the water
into the ground is dependent on the soil infiltrate
Watershed upstream Sumani.
Necessary plant nutrient elements out of farmland
and into rivers and lakes. So that the farmland
becomes infertile and rivers polluted by residual of
chemistry.
147
�International Journal of GEOMATE, Oct., 2019 Vol.17, Issue 62, pp. 147 - 152
Besides, the role of infiltration also into the
ground and replenish groundwater. Available water
capacity on groundwater is very important,
especially for the growth of horticultural. The
importance of water available in the rooting zone is
to dissolve the nutrient elements will be taken up by
the crops, which are cultivated by farmers.
Horticulture farming around the upstream of
Sumani watershed is mostly practiced by farmers
who do not apply soil and water conservation
procedures. Allegedly, the land erodes every
growing season. The soil is the main natural
resource of the people living in the [3] upstream of
Sumani watershed which is why they practice
intensive farming to meet their life necessities. This
dynamic and intensive farming causes rapid land
degradation. Hydraulic properties of soil surface
can be changed dramatically during the water above
the ground level. Hydraulic properties will be
changing are strongly influenced by soil
management. The farmland was cultivated
intensively for agriculture and horticulture. This
farmland is treated each season very intensively.
More of soil aggregates to be disintegration, into
fine particles and covered the soil pore.
The issue above causes damage to the soil’s
biophysical properties in horticulture, such as soil
pores and infiltration rate. If water absorption
interferes with I the root zone of plants, this affects
the development of the plant roots in this zone and
in turn will reduce the productivity of the soil.
The purpose of this research is to study the
infiltration capacity under horticulture farming in
the upstream area of the Sumani watershed.
2018. It was conducted at several sample points on
the horticultural lands in Watershed upstream of
Sumani, (Figure 1) Solok Regency, West Sumatera.
The soil Quality Indicator Analysis was carried out
in the Laboratory of the Department of Soil Science
under the Faculty of Agriculture, Andalas
University
2.2. Research Tools and Materials
The materials used were aqua, chemicals, as
well as materials for the analysis of the physical
properties of the laboratory. The tools used to
Figure 3. Picture of a farmer was harvesting red
onions in farmland.
Identify the soil quality for horticultural biomass
productivity in the field includes GPS, loops, maps,
sample rings, knives, plastics, label paper — the
double ring infiltrometer for infiltration capacity in
a field.
The tools used for Laboratory analysis includes
desiccators, ovens, Erlenmeyer, bottles, measuring
cylinders, analytical scales, estimator, trophy
glasses, wet screen, filter, mouthpiece, Kjeldhal
tube, burette, distillation flask, stative, and
measuring pipette
2.3. Research Methodology
The research was conducted in the field to collect
secondary and primary data. Secondary data was
taken from rainfall data, interview with farmers and
related institutions. (1) Primary data were land
samplers from several points of land units in the
three horticultural farmer's field. The data collected
were 1) soil parameters (texture, soil structure, soil
permeability, and soil effectiveness). The
infiltration capacity measured directly in the field
using double ring infiltrometer. and data are
analyzed by using Horton formula i.e; F = fc + (fofc) e-kt... The soil samples were taken by means of
purposive random sampling as an example of
Figure 2. Picture of activity sampling at location
research on the Watershed upstream Sumani.
2. MATERIALS AND METHODS
2.1 Time and Location
The has been done from February 2018 to June
148
�International Journal of GEOMATE, Oct., 2019 Vol.17, Issue 62, pp. 147 - 152
representative land from established land units
(Figure 2).
The soil samples taken were natural soil samples
for analysis of the soil’s physical properties. While
the altered soil samples were taken for analyzing the
chemical and biological properties of the soil. Soil
samples were taken from a 20 cm depth.
Procedure for measurement of infiltration in the
field are as follows: a. the land location will be
measured to clean. b. Immerse the double ring
infiltrometer (cylinder) into the soil as deep as ± 10
cm, and part is above the soil surface. Usually on
the soft soil can be done quickly. Whereas, in the
lands that are more dense with high clay content
then the ring infiltrometer is somewhat more
difficult and requires effort. (2) Secondary data was
required in this research and was collected in the
form of the area’s condition and an aspect of
horticultural cultivation of the area. The technique
of collecting secondary data by collecting data from
several related agencies and interviews with the
farmers as supporting data. Results of interviews
with farmers were being scored, and the results of
these scores were used as supporting information on
the horticultural productivity in the upstream of
Sumani watershed, Solok. (3) The data analysis
method which is determined based on the least
influential nature in determining the quality of the
soil or at least the Minimum data set (MDS) using
Minitab 17.0 software. Minimum Data Set obtained
from the calculation of Principal Component
Analysis (PCA).
micropores. The land of the horticultural field in the
study has infiltration capacity of 6cm/h to 12cm/h
with the medium to fast range. Farmer groups A and
B lands have a moderate level of infiltration
capacity. The infiltration capacity of farmer group
C land is on the quick range. The variations in
infiltration capacity of the three horticultural
farming groups (Figures 4, 5 and 6) are due to the
differences in soil properties and planted crops as
well as land management practices conducted by
farmers.
Table 1.
(PCA)
Principal component analysis results
Eigenvalue
Proportion
Cumulative
2.9122
0.364
0.364
2.0070
0.251
0.615
1.4565
0.182
0.797
1.0767
0.135
0.932
Variable
PCA1
PCA2
PCA3
PCA4
Infiltration
capacity
Bulk density
Total of
pore space
Organic
matter
Soil Depth
Sand
Dust
Clay
0.404
0.285
0.314
-0.295
0.522
-0.522
-0.214
0.214 -
0.018
0.018
-0.295
0.295
0.033
-0.456
0.496
-0.191
0.053
-0.023
0.396
-0.360
0.460
0.527
-0.107
-0.343
0.516
0.527
0.287
0.169
-0.152
0.023
0.605
-0.559
Capacity of Infiltration
(cm/hour)
200
3. RESULT AND DISCUSSION
3.1. Principal Component Analysis of Soil
Physical Characteristics
The main component in determining the main
properties of the soil determines the infiltration
capacity of the soil. Based on the PCA, the
eigenvalue is greater than one, i.e. There are four
main components, i.e. PCA1, PCA2, PCA3 and
PCA4 (table 1). The selected variables from PCA 1
to PCA4 are taken as factors to determine the rate
of infiltration capacity in horticultural farming
150
y = 307.27e-0.687x
R² = 0.6784
100
50
0
0
2
4
6
8
Time (hours)
Figure 4. Infiltration capacity at farmland A
The main components selected are the four
variables which are highly influential in infiltration
capacity, i.e. bulk density, sand-fraction texture, the
effective depth of soil, and dust fraction.
Based on regression analysis seen in the
equation of the line on the farmers group A is
exponential with value R2 = 0.678 While in group
B the equation of the line of exponential infiltration
capacity with value R2 = 0.935 In farmer group C,
the equation of the line of exponential infiltration
capacity with value R2 = 0.162. Based on the simple
regression equation it can be seen that land on a
farmer's Group B has a higher R2 value. This
means that the capacity of infiltration on land the
farmer's groups are strongly influenced by soil
3.2. Infiltration Capacity
The high rate of infiltration capacity in the
horticultural farming area in upstream of Sumani
watershed is strongly influenced by the soil ’s
physical nature, and the dominant soil is micropore.
Lands dominated by macropores will have a higher
infiltration rate compared to the land dominated by
149
�International Journal of GEOMATE, Oct., 2019 Vol.17, Issue 62, pp. 147 - 152
The infiltration capacity of the soil is influenced
by its physical properties and its degree of ability,
water content, and permeability of the subsurface
layers.
Capacity of Infiltration (cm/jam)
Capacity of Infintration (cm/hour)
properties such as texture, depth, and bulk density
is effective.
140
120
100
343.82e-1.04x
y=
R² = 0.9643
80
60
40
20
35
30
25
20
15
10
0
0
2
4
y = 26.185e-0.206x
R² = 0.1616
5
0
0
6
2
Time (hour)
3.3. Effect of Texture on Infiltration Capacity
Soil texture at the research location of farmer
group A was clay, farmer group B was dust, and
group C with the texture of fine clay. According to
[6] the soils with coarse fraction, the level of the
aeration is good, and water conductivity is fast, but
the holding power of the water is low. Because the
soil is dominated by macropores, Figure 7 shows the
effect of soil texture of the study sites on infiltration
capacity.
14.00
12.00
10.00
y = 0.113x + 1.7263
R² = 0.6176
6.00
4.00
70
2.00
Cumulative Infiltrationi (cm/Jam)
Capacity of infiltrasi (cm/jam)
6
Figure 5. Infiltration capacity at farmland B
Figure 6. Infiltration capacity at farmland C
8.00
4
Time (hour)
0.00
0.0
20.0
40.0
60.0
80.0
sand (%)
Figure 7. Sand percentage correlation with
infiltration capacity
The infiltration capacity is a dynamic trait that
can change significantly during certain precipitation
events, in response to seasonal changes in
groundwater, temperature, and plant type, as a
result of annual farming activities. Increasing
infiltration capacity decreases the flow of water in
the soil surface. Conversely, a smaller infiltration
capacity is due to a large number of clogged soil
pores, the surface water flow increases [4].
Furthermore, [5] regarding hydrology, infiltration is
important as it marks a shift from the surface of the
earth that moves rapidly into the water in the slowmoving ground.
60
50
40
30
20
10
0
1
2
3
4
Measurement time
A
B
C
Figure 8. The cumulative infiltration rate at three land
farmer groups (A, B, and C)
Based on simple regression analysis, the
relationship between infiltration capacity and the
texture was quite close with R2 value as 0.617 This
meant that infiltration capacity of 61.7 percent was
influenced by the soil texture of the research
150
�International Journal of GEOMATE, Oct., 2019 Vol.17, Issue 62, pp. 147 - 152
hydraulic conductivity improve with time in a
horticultural culture.
According to [11], solid soil naturally or else due to
reducing the rate of infiltration. Increased high
density the soil then the cumulative infiltration a
low land, and instead, relative soil loose then the
cumulative infiltration was higher. According to [9]
append real ameliorate can increase the capacity
and cumulative infiltration.
This is due to
ameliorate materials such as biochar can make land
more nests so that the movement of water into the
soil faster.
locations in farmer groups A, B, and C, the
influence from other factors amounted to 38.3
percent. This proved that soil texture greatly
influenced the infiltration rate of the soil. For the
infiltration capacity of the farming land, routine
management is required to increase the soil
absorption matrix by adding organic fertilizer or
crop residue to the soil to retain the groundwater
ensure it doesn’t penetrate to the lower layers of the
root zone. The addition of organic material from
remaining plants acts as a cemented agent for soil
grains, nutrient sources, increasing CEC and energy
for soil microbes [7].
4. CONCLUSION
3.4. Cumulative Infiltration
Based on the research of the infiltration
capacity in the upstream watershed of Sumani, it
can be concluded that; the research area of soil
infiltration capacity is influenced by soil physics
properties, i.e. bulk density, texture, and depth of
root zone. The rate of infiltration in the three farmer
groups of the study sites was from the moderate to
the rapid range. From the equation of infiltration
capacity, soil texture factor influence is more
dominant and equals about to 61.7 percent among
the three group farmers A, B, and C, only farmers
group B which returns the rest of the plant to the
land. Therefore it's land to a high cumulative
infiltration.
Cumulative infiltration is incoming water into
the soil in a specific time and duration in a certain
amount of volume, depending on the total soil pore
space to store and hold it.
Cumulative infiltration in the three locations of
the farmland group is shown in Figure 8.
Cumulative infiltration varied considerably
between the three types of land farming groups
based on measurement time. Higher cumulative
infiltration is found in group B, followed by group
C then next, group A. This was caused by soil type
and crop management which troubled each of
farming group. Group B farmers usually return the
rest of the plant to the land to increases the ability
of soil to absorb water. It caused the rest of the plant
will produce organic acid as a cemented agent. And
the improved the soil physical properties.
5. ACKNOWLEDGMENTS
The author is grateful to the chairman of
Universitas Andalas for the opportunity and
assistance given to us to do the research with the
contract; No.12/UN.-16.17/PP.PGB/LPPM/2018.
Hopefully, this would be useful to improve the
performance of the research team as a lecturer of
Universitas Andalas.
Good management of soil can improve soil
quality such as cumulative infiltration. According to
the study [8], it also showed that improving soil
quality may increase cumulative infiltration up to
five times. However, continuous land acquisition
without proper management can reduce cumulative
infiltration. According to the results of the study, [9]
the improvement in infiltration capacity and
cumulative infiltration is by addition of materials
that can increase total pore space of soil such as
ameliorant material from rice husk biochar. This is
because biochar is active charcoal capable of
increasing the soil cavity and biochar is not easily
decomposed by soil microbes. Additional Soil
organic matter is an important soil quality indicator
because it has a strong relationship to critical soil
functions like an infiltration, productivity,
erodibility, and the capacity of the soil to act as an
environ-mental buffer by absorbing or transforming
potential. According to [10] Increased organic
matter to loamy sand increased aggregate stability
and water infiltration. Soil structure improves when
cultivated land is put into the grass. Soil aggregate
distribution, stability, air permeability, and
6. REFERENCES
[1] Radke J.K. and Berry E.C. 1993. Infiltration as
a tool for detecting soil changes due to
cropping, tillage, and grazing livestock.
American Journal of Alternative Agriculture
8: 164–174.
[2] Mukhtar S., Baker J.L., Horton R. and Erbach
D.C. 1985. Soil water infiltration as affected
by the use of the paraplow. Transaction of
ASAE 28: 1811–1816.
[3] Istijono.B. 2006. Watershed Conservation and
Farmers Income: Studies on Watershed
Management Integration (Case Study: Sumani
Watershed of Solok Regency / Solok City,
West Sumatera). PPs.Unand Dissertation.
[4] Kartasapoetra, AG. 1989. Introduction to Soil
Science, Land Formation, and Agricultural
Land. Jakarta: Rineka Cipta.
151
�International Journal of GEOMATE, Oct., 2019 Vol.17, Issue 62, pp. 147 - 152
“Development of Agricultural Science and
Technology with Local Farmers for
Optimizing Suboptimal Land”
[10] Bruce R.R., Langdale G.W., West L.T. and
Miller W.P. 1992. Soil surface modification
by biomass inputs affecting rainfall infiltration.
Soil Sci Soc Am J 56: 1614–1620.
[11] Aiassa M.G, Arrúa P., and Eberhardt. M.
(2015) prediction of infiltration on small scale
field tests performance in compacted loessic soil.
J. of GEOMATE, Vol. 9, No. 1 (Sl. No. 17)
Sept 2015, pp. 1360-1364
[5] Lee, R. 1990. Forest Hydrology. Yogyakarta:
UGM Press
[6] Hardjowigeno S. 2003. Soil Science.
Akademikan Pressindo. Jakarta
[7] Gardiner, DT dan Miller RW. 2004. The soil in
Our Environment 10th Edition. Prentice Hall.
New Jersey
[8] Bharati1. L., K. H. Lee, T.M. Isenhart, and R.C.
Schultz. 2002. Soil-water infiltration under
crops, pasture, and established riparian buffer
in the Midwestern USA. Agroforestry Systems
56: 249–257, 2002. 249. Kluwer Academic
Publishers. Printed in the Netherlands
[9] Aprisal, Adrinal dan Wulan Herman. 2018. The
Influence of Rice Husk Biochar Against
InfiltrationCapacity on Ultisol. Proceedings of
National Seminar of Suboptimal Land 2017,
Palembang
19-20th
October
2017
Copyright © Int. J. of GEOMATE. All rights reserved,
including the making of copies unless permission is
obtained from the copyright proprietors.
152
�
 Bambang Istijono