LATEST TRENDS on SYSTEMS (Volume I)
An Adaptive Multi Sensor Data Fusion with Hybrid Nonlinear ARX and
Wiener-Hammerstein Models for Skeletal Muscle Force Estimation
PARMOD KUMAR, CHANDRASEKHAR POTLURI, ANISH SEBASTIAN, STEVE CHIU, ALEX
URFER, D. SUBBARAM NAIDU, and MARCO P. SCHOEN
Measurement and Control Engineering Research Center, College of Engineering
Idaho State University
th
921 South 8 Avenue, Stop 8060, Pocatello, Idaho
USA
schomarc@isu.edu http://isu.edu/~schomarc
Abstract: - Skeletal muscle force can be estimated using surface electromyographic (sEMG) signals. Usually, the
sEMG location for the sensors is near the respective muscle motor unit points. Skeletal muscles generate a temporal
and spatial distributed EMG signal, which causes cross talk between different sEMG signal sensors. In this paper, an
array of three sEMG sensors is used to capture the information of muscle dynamics in terms of sEMG signals and
generated muscle force. The recorded sEMG signals are filtered utilizing optimized nonlinear Half-Gaussian Bayesian
filter, and a Chebyshev type-II filter prepares the muscle force signal. The filter optimization is accomplished using
Genetic Algorithm (GA). Multi nonlinear Auto Regressive eXogenous (ARX) and Wiener-Hammerstein models with
different nonlinearity estimators/classes are obtained using system identification (SI) for three sets of sensor data. The
outputs of these models are fused with a probabilistic Kullback Information Criterion (KIC) for model selection and an
adaptive probability of KIC. First, the outputs are fused for the same sensor and for different models and then the final
outputs from each sensor. The final fusion based output of three sensors provides good skeletal muscle force estimates.
Key-Words: - sEMG, ARX, Weiner-Hammerstein, KIC, SI, GA
EMG signals are a result of the varying motor unit
recruitments, crosstalk, and biochemical interaction
within the muscular fibres. This makes EMG signals
random, complex and dynamic in nature and the control
of the prosthesis difficult. Moreover, it changes
continuously due to the onset and progression of muscle
fatigue which results because of continuous high
frequency stimulation or because of titanic stimulation
[7]. Synchronization of active motor units along the
muscle fibres, and a decrease in conduction velocity are
reflected in the EMG signal as an increase of amplitude
in time domain and a decrease of medium frequency in
frequency domain [8]. All these factors make the
relationship between EMG and force nonlinear. Correct
interpretation of EMG signal is vital to achieve precise
motion and force control of prosthesis.
The present work presents a novel approach to
estimate skeletal muscle force using an adaptive multisensor data fusion algorithm with hybrid nonlinear ARX
and Wiener-Hammerstein models. Here, an array of
three sEMG sensors is used to capture the information of
muscle dynamics in terms of sEMG signals. The
recorded sEMG signals are filtered utilizing optimized
nonlinear Half-Gaussian Bayesian filter parameters, and
the skeletal muscle force signal is filtered by using a
Chebyshev type-II filter. A simple Genetic Algorithm
1 Introduction
Aftereffects of the loss of upper limbs are a reduction
of functionality and psychological disturbance for the
person. According to [1] there are 1.7 million peoples
with amputation in the United States and this number is
on rise after the Afghanistan and Iraq war in 2003 [2].
Conversely, a prosthetic limb can considerably increase
the functionality of an amputee and benefit the person in
everyday life.
In the past, there have been various research works
towards prosthetic hand design, having similar
functionality and appearance as human hand [3-4]. Most
of these research works are based on electromyography
(EMG). The EMG signal is activated and controlled by
the central nervous system, which depends on the flow
of specific ions such as sodium (𝑁𝑎 + ), potassium (𝐾 + )
and calcium (𝐶𝑎++ ).
An EMG signal recorded on the surface of the limb is
expressed as an electric voltage ranging between -5 and
+5 mV. This method is known as surface
electromyography (sEMG). sEMG is utilized as an input
to the controller to realize the movements of the
prosthesis and force control [5-6]. Past research results
show that EMG signal amplitude generally increases
with skeletal muscle force. However, this relationship is
not always rigid; various factors affect this relationship.
ISSN: 1792-4235
186
ISBN: 978-960-474-199-1
�LATEST TRENDS on SYSTEMS (Volume I)
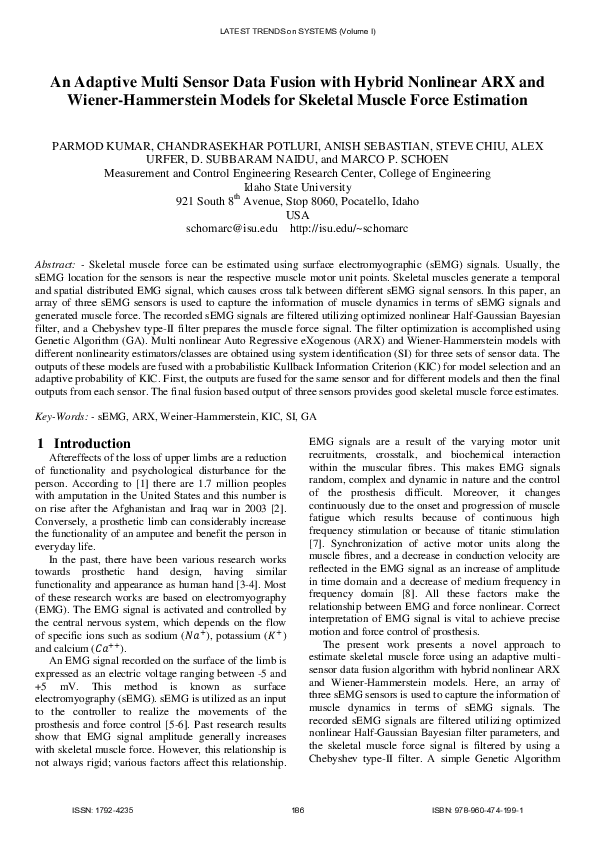
using KIC and adaptive probability of KIC is covered. Finally,
the results, discussion and future work are provided followed
by a conclusion to summarize the importance of this work.
code is used to optimize the Bayesian filter parameters.
Using an input/output approach, the EMG signal
measured at the skin surface is considered as input to the
skeletal muscle, whereas the resulting hand/finger force
constitutes the output. Multi nonlinear ARX and
Wiener-Hammerstein models with different nonlinearity
estimators/classes are obtained using SI for three sets of
sensor data obtained from the vicinity of a single motor
unit. Different nonlinearity estimators/classes are used
for nonlinear modeling as they capture the dynamics of
the system differently. The outputs of estimated
nonlinear models are fused with a probabilistic Kullback
Information Criterion (KIC) for model selection and an
adaptive probability of KIC. First, the outputs are fused
for the same sensor and for different models and then the
final outputs from each sensor. The final fused output of
three sensors provides good skeletal muscle force
estimates.
Force
Signal
Chebyshev type-II
filter
sEMG
Sensor1
H.G. Bayesian Filter with
Optimized 𝛼1 𝑎𝑛𝑑 𝛽1
using Genetic Algorithm
sEMG
Sensor-M
sEMG
Sensor2
2
Experimental Set-Up and PreProcessing
The experimental set-up is shown in Fig. 2. Both
sEMG and muscle force signals were acquired
simultaneously using LabVIEW™ at a sampling rate of
2000 Hz. The sEMG data capturing was aided by a
DELSYS® Bagnoli-16 EMG system with DE-2.1
differential EMG sensors. The corresponding force data
was captured using Interlink Electronics FSR 0.5”
circular force sensor. One sEMG sensor was placed on
the motor point of the ring finger and two adjacent to
the motor point of a healthy subject. Prior to placing the
sEMG sensors, the skin surface of the subject was
prepared according to International Society of
Electrophysiology and Kinesiology (ISEK) protocols.
H.G. Bayesian Filter with
Optimized 𝛼𝑀 𝑎𝑛𝑑 𝛽𝑀
using Genetic Algorithm
H.G. Bayesian Filter with
Optimized 𝛼2 𝑎𝑛𝑑 𝛽2
using Genetic Algorithm
Fig. 2: Experimental Set-Up.
NL-ARX and
NL-HW Models
and Data Fusion
with Adaptive
Probability
NL-ARX and
NL-HW Models
and Data Fusion
with Adaptive
Probability
NL-ARX and
NL-HW Models
and Data Fusion
with Adaptive
Probability
𝑌�1
𝑌�𝑚
𝑌�2
𝑃𝑎𝑖
According to previous research, the Bayesian based
filtering method yields the most suitable sEMG signals
[9]. The nonlinear filter significantly reduces noise and
extracts a signal that best describes EMG signals and
may permit effective use in prosthetic control. An
instantaneous conditional probability density 𝑃(𝐸𝑀𝐺|𝑥)
provides the resulting EMG for the latent driving signal
𝑥 [9]. The model for the conditional probability of the
rectified EMG signal 𝑒𝑚𝑔 = |𝐸𝑀𝐺| is used in this
current estimation algorithm. EMG signals are usually
described as amplitude-modulated zero mean Gaussian
noise sequence [10]. For the rectified EMG signal, the
“Half-Gaussian measurement model” in [9] is given by
Equation (1).
Data Fusion
𝑌�
Fig. 1: The Flow Chart for Skeletal Muscle Force Estimation.
𝑒𝑚𝑔2
Fig. 1 shows the flow chart for skeletal muscle force
estimation. This paper is structured as follows. First, the
experimental set-up, pre-processing and filter parameter
optimization for sEMG signals are discussed. Second,
nonlinear ARX and Wiener-Hammerstein modeling are
covered. Third, the fusion of various nonlinear model outputs
ISSN: 1792-4235
𝑃(𝑒𝑚𝑔|𝑥) = 2 ∗ 𝑒𝑥𝑝(− 2∗𝑥 2 )/(2 ∗ 𝜋 ∗ 𝑥 2 )1/2 .
(1)
The EMG signal is modeled for the conditional
probability of the rectified EMG signal as a filtered
random process with random rate. The likelihood
function for the rate evolves in time according to a
187
ISBN: 978-960-474-199-1
�LATEST TRENDS on SYSTEMS (Volume I)
where 𝜅 is the unit nonlinear command, 𝑑 is the number
of nonlinearity units, and 𝛼𝑘 , 𝛽𝑘 and 𝛾𝑘 are the
parameters of the nonlinearity estimators/classes [11].
Fokker–Planck partial differential equation [9]. The
discrete time Fokker–Planck Equation is given by
equation (2).
𝑝(𝑥, 𝑡−) ≈ 𝛼 ∗ 𝑝(𝑥 − 𝜀, 𝑡 − 1) + (1 − 2 ∗ 𝛼) ∗ 𝑝(𝑥, 𝑡 −
1) + 𝛼 ∗ 𝑝(𝑥 + 𝜀, 𝑡 − 1) + 𝛽 + (1 − 𝛽) ∗ 𝑝(𝑥, 𝑡 − 1).
(2)
Here, 𝛼 and 𝛽 are two free parameters, 𝛼 is the expected
rate of gradual drift in the signal, and 𝛽 is the expected
rate of sudden shifts in the signal. The unknown driving
signal 𝑥 is discretized into bins of width 𝜀. These two
free parameters of the non-linear Half-Gaussian filter
model are optimized for the acquired EMG data using
elitism based GA.
A Chebyshev type II low pass filter with a 550 Hz
pass frequency is used to filter the force signal. Fig. 3
depicts the raw and Chebyshev type-II low pass filtered
force signals.
Input 𝑢(𝑡)
Output 𝑦(𝑡)
Regressors
𝑢1(𝑡 − 1), 𝑢2(𝑡 − 3), 𝑦1(𝑡 − 1)
Nonlinear
Function
Linear
Function
Predicted Output
𝑦�(𝑡) = 𝐹(𝑥(𝑡))
Fig. 4: Nonlinear ARX Model Structure.
(a) Raw Skeletal Muscle Force Signal
Amplitude
1
0.8
The Wiener-Hammerstein model uses one or two
static nonlinear blocks in series with a linear block.
Structural representation of a nonlinear WienerHammerstein is shown in Fig. 5 [11].
0.6
0.4
0.2
2
4
6
8
10
12
4
Time (60.35 secs)
(b) Chebyshev Type - II Filtered Force Signal
x 10
Amplitude
1
0.8
0.6
Input 𝑢(𝑡)
0.4
0.2
2
4
6
Time (60.35 secs)
8
10
12
4
x 10
Input
Nonlinearity
Output
Nonlinearity
Fig. 3: (a) Raw and (b) Chebyshev Type-II Filtered
Skeletal Muscle Force Signals.
Output 𝑦(𝑡)
3
Nonlinear ARX and WienerHammerstein Modeling
Fig. 5: Nonlinear Wiener-Hammerstein Model Structure.
In this paper, we are using nonlinear ARX and
Wiener-Hammerstein models with different nonlinearity
estimators/classes to model three sEMG sensors data as
input and skeletal muscle force data as output. The
nonlinear ARX model uses a parallel combination of
nonlinear and linear blocks [11].
Fig. 4 shows the nonlinear ARX model structure. The
nonlinear ARX model uses regressors as variables for
nonlinear and linear functions. Regressors are functions
of measured input-output data [11]. The predicted output
𝑦�(𝑡) of a nonlinear model at time 𝑡 is given by the
general Equation (3):
𝑦�(𝑡) = 𝐹(𝑥(𝑡))
(3)
where 𝑥(𝑡) represents the regressors, 𝐹 is a nonlinear
regressor command, which is estimated by nonlinearity
estimators/classes [11]. As shown in Fig. 4, the
command 𝐹 can include both linear and nonlinear
functions of 𝑥(𝑡). Equation (4) gives the description of
𝐹.
𝐹(𝑥) = ∑𝑑𝑘=1 𝛼𝑘 𝜅(𝛽𝑘 (𝑥 − 𝛾𝑘 ))
(4)
ISSN: 1792-4235
Linear
Block
The general Equations (5), (6), and (7) can describe
the Wiener-Hammerstein structure [11].
𝑤(𝑡) = 𝑓(𝑢(𝑡))
(5)
𝑥(𝑡) =
𝐵𝑗,𝑖 (𝑞)
𝐹𝑗,𝑖 (𝑞)
𝑤(𝑡)
(6)
𝑦(𝑡) = ℎ(𝑥(𝑡)).
(7)
where 𝑢(𝑡) and 𝑦(𝑡) are input and output of the system,
respectively, 𝑓 and ℎ are nonlinear functions, which
corresponds to input and output nonlinearity,
respectively, 𝑤(𝑡) and 𝑥(𝑡) are internal variables, where
𝑤(𝑡) has the same dimensions as 𝑢(𝑡) and 𝑥(𝑡) has the
same dimensions as 𝑦(𝑡), and 𝐵(𝑞) and 𝐹(𝑞)
corresponds to the linear dynamic block, these are
polynomials in the backward shift operator.
The nonlinearity classes used in this work are
Wavenet,
Treepartition,
Sigmoidnet,
Pwlinear,
Saturation, and Deadzone. For motor point and ring1
sensors, three nonlinear ARX and four nonlinear
Wiener-Hammerstein models with different nonlinearity
188
ISBN: 978-960-474-199-1
�LATEST TRENDS on SYSTEMS (Volume I)
shows the flow chart for fusion of outputs and adaptive
probability of KIC.
estimators/classes are obtained. For ring2 sensor, three
nonlinear ARX and five nonlinear Wiener-Hammerstein
models with different nonlinearity estimators/classes are
obtained.
Y
4
Data Fusion and Adaptive KIC
Probability
R1
Data fusion of multiple outputs of nonlinear ARX
and Wiener-Hammerstein models is done by assigning a
particular probability to each individual model [12].
First, the fusion algorithm is applied to the outputs of
different nonlinear ARX and Wiener-Hammerstein
models for each sensor obtained using different
nonlinearity estimators. Second, the fusion algorithm is
again applied to the final fusion based outputs of each
sensor; this gives good force estimate. SI model fit
value gives the probability for each model, which is
𝑃𝑎𝑖
𝑃𝑎𝑖
|𝑌−𝑌�|
Mn
𝑛−𝑝𝑖
𝑇
𝑢𝑝+1
⋮
𝑇
𝑢𝑛−1
𝑇
𝑌𝑝−1
𝑌𝑝𝑇
⋮
𝑇
𝑌𝑛−2
Error
5 Results, Discussion and Future Work
This section deals with the results, discussion and
future work. The following plots show the nonlinear
(ARX and Wiener-Hammerstein) model and adaptive
fusion algorithm based estimated force output for each
sensor first and then finally combined adaptive fusion
based output for all three sensors. Fig. 7 shows the
overlapping plot of the original and adaptive fusion
based force output for the motor point sensor. The
output is the result of the adaptive fusion algorithm on
three nonlinear ARX and four nonlinear WienerHammerstein models for the motor point sensor signal.
⎤
… 𝑢2𝑇 ⎥
⎥.
⋮ ⎥
⋱
𝑇
… 𝑢𝑛−𝑝 ⎦
Original Force and NL-ARX - NL-HW-2-3-4-5 Models Fused Output - Sensor Motor Point
1
0.9
3) Calculate the model criteria coefficient using
Equation (8).
∑𝑘
𝑗=1 𝑒
−𝑙𝑗
0.8
0.7
Amplitude
𝑒 −𝑙𝑖
,
where 𝑙 is model selection criterion, i.e. 𝐾𝐼𝐶(𝑝𝑖 ).
5) Compute
the
fused
model
output
𝑘
�
�
𝑌𝑓 = ∑𝑖=1 𝑝(𝑀𝑖 |𝑍)𝑌𝑖 .
6) Compute the overall model from 𝑌�𝑓 and force data.
Here all the computation from step 2) to 6) is adaptive
i.e. the residual square norm, 𝐾𝐼𝐶(𝑝𝑖 ), model
probability 𝑝(𝑀𝑖 |𝑍), and fused model output 𝑌�𝑓 are
being updated with time or for each data point. Fig. 6
ISSN: 1792-4235
𝑌�
Fig. 6: Data Fusion and Adaptive KIC Probability.
… 𝑢1𝑇
4) Compute the model probability 𝑝(𝑀𝑖 |𝑍) =
𝑌�𝑛
𝑃𝑎𝑖
where 𝑔(𝑛) = 𝑛 ∗ log(𝑛/2).
The following fusion algorithm as given by [12] is
applied for data fusion of the outputs of different
nonlinear ARX and Wiener-Hammerstein models:
1) Identify models 𝑀1 , 𝑀2 , … , 𝑀𝑘 using sEMG data
(𝑢) as input and force data (𝑌) as output, for 𝑘 number
of sensors collecting data simultaneously.
2) Compute the residual square norm
� 𝑖 �2 = �𝑌 − 𝑌��,
𝑅𝑖 = �𝑌 − Φ𝑖 Θ
where
𝑇
𝑇
−1
�
Θ𝑖 = {Φ𝑖 Φ𝑖 } Φ𝑖 𝑌, and
𝑢𝑝𝑇
⋮
Rn
criterion used in this paper is KIC. The sum of two
directed divergences, which is the measure of the
models dissimilarity, is known as Kullback’s symmetric
or J-divergence [13], as given by Equation (8).
(𝑝 +1)𝑛
𝑛−𝑝
𝑛
𝐾𝐼𝐶(𝑝𝑖 ) = log 𝑅𝑖 + 𝑖 −2 − 𝑛𝜓 � 2 𝑖� + 𝑔(𝑛), (8)
𝑌𝑇
⎡ 𝑝
⎢ 𝑇
Φ = ⎢𝑌𝑝+1
⎢ 𝑇⋮
⎣𝑌𝑛−1
𝑌�2
M2
R2
given by �1 − |𝑌−𝑌�|� ∗ 100. The model selection
2
𝑌�1
M1
0.6
0.5
0.4
0.3
0.2
0.1
1
2
3
4
5
6
7
8
Time
4
x 10
Fig. 7: Original and Fusion Based Output for Motor
Point Sensor.
Fig. 8 shows the overlapping plot of the original and
adaptive fusion based force output for ring1 sensor. The
189
ISBN: 978-960-474-199-1
�LATEST TRENDS on SYSTEMS (Volume I)
motor point, ring1 and ring2 sensors. The output is the
result of adaptive fusion algorithm on the final outputs
of three sensors i.e. motor point, ring1 and ring2 as
shown in Fig. 7 to 9. Fig. 10 shows the best skeletal
muscle force estimate, which is the result of the multi
nonlinear ARX and Wiener-Hammerstein models and an
adaptive hybrid data fusion on these nonlinear models.
Fig. 11 shows the error plot of the original and bestestimated model output for the motor point sensor.
output is the result of adaptive fusion algorithm of three
nonlinear ARX and four nonlinear Wiener-Hammerstein
models for ring1 sensor signal.
Original Force and NL-ARX - NL-HW - Models Fused Force Output - Ring1 Sensor
1
0.9
0.8
Amplitude
0.7
0.6
0.5
Error Plot - Original and Best Model Simulated Output for Motor Point Sensor
0.4
0.2
data 1
linear
0.3
0.15
0.2
0.1
0.1
2
3
4
5
6
7
8
Amplitude
1
4
Time
x 10
Fig. 8: Original and Fusion Based Output for Ring1
Sensor.
0.05
0
-0.05
-0.1
Fig. 9 shows the overlapping plot of the original and
adaptive fusion based force output for ring2 sensor. The
output is the result of adaptive fusion algorithm on three
nonlinear ARX and five nonlinear Wiener-Hammerstein
models for ring2 sensor signal.
-0.15
-0.2
1
3
4
5
6
7
8
4
Time
x 10
Fig. 11: Error Plot – Original and Best-Estimated Model
Output for Motor Point Sensor.
Fig. 12 shows the error plot of original and final
multi nonlinear modeled and adaptive hybrid data fusion
based force estimate (results from three sensors,
nonlinear modeling and adaptive data fusion algorithm).
If we compare Fig. 11 and 12, it is very clear and
conspicuous that the error has decreased remarkably and
is very close to zero.
Original Force and NL-ARX - NL-HW Models Fused Output - Ring2 Sensor
1
0.9
0.8
0.7
Amplitude
2
0.6
0.5
0.4
0.3
Final Error Plot - Original and Fused Output - MotorPoint, Ring1 and Ring2 Sensors
0.2
0.2
data 1
linear
0.1
1
2
3
4
5
6
0.15
7
4
Time
x 10
0.1
Amplitude
Fig. 9: Original and Fusion Based Output for Ring2
Sensor.
Original Force and NL-ARX - NL-HW Models Output - MotorPoint - Ring1 - Ring2 Sensors
1
0.05
0
-0.05
-0.1
0.9
-0.15
0.8
-0.2
Amplitude
0.7
1
2
3
4
5
6
7
Time
4
x 10
0.6
Fig. 12: Final Error Plot – Original and Fusion Based
Output for Motor Point, Ring1 and Ring2 Sensors.
0.5
0.4
0.3
Future work will focus on the improvement of the
data collection techniques and experimental set-up. By
using the combination of linear and nonlinear modeling,
and adaptive hybrid data fusion, the skeletal muscle
force estimate can be improved further. Furthermore, the
authors believe that by using different model selection
criteria such as Akaike Information Criterion (AIC),
Kullback Information Criterion (KIC) and the Bayesian
0.2
0.1
1
2
3
4
Time
5
6
7
4
x 10
Fig. 10: Final Plot - Original and Fusion Based Output
for All Three Sensors.
Fig. 10 shows the overlapping plot of the original and
final combined adaptive fusion based force output for
ISSN: 1792-4235
190
ISBN: 978-960-474-199-1
�LATEST TRENDS on SYSTEMS (Volume I)
Information Criterion (BIC) together to obtain final
skeletal muscle force estimate will give improved
results.
Engineering Congress Anaheim, California,
November 13-19, 2004.
[8] C.J. De Luca, Myoelectrical manifestations of
localized muscular fatigue in humans, Crit. Rev.
Biomed. Eng., 11 (4), 1984, pp. 251-279.
[9] Terence D. Sanger, Bayesian Filtering of
Myoelectric Signals, J Neurophysiol, 97, 2007, pp.
1839–1845.
[10] M. B. I. Reaz, M. S. Hussain and F. Mohd-Yasin,
Techniques of EMG signal analysis: detection,
processing, classification and applications, Biol.
Proced. Online, 2006, 8(1), pp. 11-35.
[11] Lennart Ljung, System Identification ToolboxTM 7
User’s Guide, The MathWorks, Inc., 2010.
[12] Huimin Chen and Shuqing Huang, A Comparative
study on Model Selection and Multiple Model
Fusion, 7th International Conference on Information
Fusion, 2005, pp. 820-826.
[13] Abd-Krim Seghouane, Maiza Bekara, and Gilles
Fleury, A Small Sample Model Selection Criterion
Based on Kullback’s symmetric Divergence, IEEE
Transaction, 2003, pp. 145-148.
6 Conclusion
sEMG and force data acquired using three EMG and
one common FSR force sensor is modeled using
nonlinear
SI.
Using
different
nonlinearity
estimators/classes, multi nonlinear ARX and WienerHammerstein models are obtained for each sensor. First,
the outputs of different models for each sensor are fused
with a data fusion algorithm and an adaptive KIC
probability. Finally, the fused outputs from each sensor
are again fused with same algorithm and adaptive KIC
probability. The final estimated force using this
technique gives the best estimate.
Acknowledgement
This work was supported by a grant from the
Telemedicine Advanced Technology Research Center
(TATRC) of the US Department of Defense. The
financial support is greatly appreciated.
References:
[1] Kathryn Ziegler-Graham, PhD, et al., Estimating the
Prevalence of Limb Loss in the United States - 2005
to 2050, Archives of Physical Medicine and
Rehabilitation, 89 (2008): 422-429.
[2] O'Connor, P., Iraq war vet decides to have second
leg amputated, Columbia Missourian, 2009.
[3] N. Dechev, W. L. Cleghorn, and S. Naumann,
Multiple finger, passive adaptive grasp prosthetic
hand, Mechanism and Machine Theory 36(2001), pp.
1157-1173.
[4] Haruhisa Kawasaki, Tsuneo Komatsu, and Kazunao
Uchiyama, Dexterous Anthropomorphic Robot Hand
With Distributed Tactile Sensor: Gifu Hand II,
IEEE/ASME
TRANSACTIONS
ON
MECHATRONICS, VOL. 7, NO. 3, SEPTEMBER
2002, pp. 296-303.
[5] M. Zecca, S. Micera, M. C. Carrozza, and P. Dario,
Control of Multifunctional Prosthetic Hands by
Processing the Electromyographic Signal, Critical
Reviews™ in Biomedical Engineering, 30(4–6),
2002, pp. 459–485.
[6] Claudio Castellini and Patrick van der Smagt,
Surface EMG in advanced hand prosthetics,
Biological Cybernetics, (2009) 100, pp. 35–47.
[7] Jeffrey T. Bingham and Marco P. Schoen,
Characterization of Myoelectric Signals using
System Identification Techniques, Proceedings of
IMECE 2004: 2004 ASME International Mechanical
ISSN: 1792-4235
191
ISBN: 978-960-474-199-1
�
 Marco Schoen