Environmental Modelling & Software 23 (2008) 1438–1447
Contents lists available at ScienceDirect
Environmental Modelling & Software
journal homepage: www.elsevier.com/locate/envsoft
Evaluating remotely sensed rainfall estimates using nonlinear mixed models
and geographically weighted regression
Y. Kamarianakis a, b, *, H. Feidas c, G. Kokolatos d, N. Chrysoulakis b, V. Karatzias b
a
University of Crete, Department of Applied Mathematics, Heraklion, Greece
Institute of Applied and Computational Mathematics, Foundation for Research and Technology – Hellas, Vassilika Vouton, 711 10 Heraklion, Crete, Greece
c
Aristotle University of Thessaloniki, Department of Geology, Division of Meteorology–Climatology, Thessaloniki, Greece
d
University of the Aegean, Department of Geography, Mytilene, Greece
b
a r t i c l e i n f o
a b s t r a c t
Article history:
Received 16 October 2007
Received in revised form 7 April 2008
Accepted 10 April 2008
Available online 13 June 2008
This article evaluates an infrared-based satellite algorithm for rainfall estimation, the Convective Stratiform technique, over Mediterranean. Unlike a large number of works that evaluate remotely sensed
estimates concentrating on global measures of accuracy, this work examines the relationship between
ground truth and satellit0e derived data in a local scale. Hence, we examine the fit of ground truth and
remotely sensed data on a widely adopted probability distribution for rainfall totals – the mixed lognormal distribution – per measurement location. Moreover, we test for spatial nonstationarity in the
relationship between in situ observed and satellite-estimated rainfall totals. The former investigation
takes place via using recent algorithms that estimate nonlinear mixed models whereas the latter uses
geographically weighted regression.
Ó 2008 Elsevier Ltd. All rights reserved.
Keywords:
Rainfall estimation
Remotely sensed estimations
Zero inflated lognormal distribution
Nonlinear mixed models
Geographically weighted regression
1. Introduction
Remotely sensed information from satellites, having a high
spatial coverage and high temporal sampling, can play a key role in
monitoring precipitation in flood-prone regions, sea precipitation,
and other extreme weather events. Such information is of particular importance in areas with sparse rain gauge and precipitation
radar networks from which reliable real time assessments of
precipitation can be obtained. An area where the latter argument
applies is the Mediterranean basin; its climate is known for its
variety and variability, due to the surrounding orography, to the
relative high temperature of the sea and to the different origin and
physical characteristics of the air masses. There is a paucity of dense
rain gauge networks or precipitation radar networks due to the
presence of the Mediterranean Sea and to the complex topography.
In addition, rain gauge observations are not generally available in
real time in many regions, and missing reports and grossly erroneous reports occur in cases of extremely heavy rainfall and in
regions of steep terrain.
* Corresponding author. Regional Analysis Division, Institute of Applied and
Computational Mathematics, Foundation for Research and Technology – Hellas,
Vassilika Vouton, P.O. Box 1527, GR-711 10, Heraklion Crete, Greece. Tel.: þ30 2810
391771; fax: þ30 2810 391761.
E-mail address: kamarian@iacm.forth.gr (Y. Kamarianakis).
1364-8152/$ – see front matter Ó 2008 Elsevier Ltd. All rights reserved.
doi:10.1016/j.envsoft.2008.04.007
A number of techniques have been developed to indirectly
estimate rainfall using visible (VIS) and infrared (IR) satellite data.
Most of these methods are based on the notion that deep convective clouds might produce more rain and on operational findings,
which show that regions of rainfall tend to be correlated with
bright (VIS), cold (IR) clouds. When IR satellite data of high spatial
and temporal resolution became available, precipitation was
correlated to the cloud-top temperature (CTT) and the relationships
used in the satellite techniques were redefined as a function of CTT.
Numerous new precipitation estimation algorithms have been
developed that use IR data as the only data input; i.e. the Arkin
technique (Arkin, 1979), the Area Time Integral (ATI) technique
(Doneauld et al., 1984; Lopez et al., 1989), the GOES Precipitation
Index (GPI) (Arkin and Meisner, 1987), the Griffith–Woodley
Technique (GWT) (Griffith et al., 1976, 1978, 1981), the Negri–Adler–
Woodley Technique (NAWT) (Negri et al., 1984), the Convective
Stratiform Technique (CST) (Adler and Negri, 1988) and the
technique for Precipitation Estimation from Remotely Sensed Information using Artificial Neural Networks (PERSIANN) (Hsu et al.,
1997; Hong et al., 2004).
One disadvantage of VIS/IR techniques for estimating precipitation rates is that they are necessarily inferential (precipitation
is inferred from cloud observations). The accuracy of such
techniques is not adequately specified and the techniques are not
readily transferable from location to location. In contrast,
�Y. Kamarianakis et al. / Environmental Modelling & Software 23 (2008) 1438–1447
microwave (MW) remote sensing techniques can give direct information on precipitation. Passive MW radiometry from satellite
platforms has also the potential to estimate rainfall rates, because
the microwave radiation contains direct signals of the cloud and
precipitation microphysics. But, the lack of sufficient spatial and
temporal coverage of the current polar-orbiting sensors for midlatitudes as well as the lack of active MW satellite sensors for this
area constitutes a major disadvantage for studies of convective rain
events. In addition, satellite-measured microwave radiances are
also influenced by soil and vegetation effects over land surfaces
(including mixed pixel effects in coastal areas).
Despite the disadvantages of the rainfall estimates inferred by IR
satellite data, interest in making such estimates has not faded. The
reason for this is the short duration and high temporal variability of
precipitation events and, therefore, the need for high temporal
resolution in the observations. Thus, despite the availability of more
accurate techniques using microwave (MW) satellite data, the
geosynchronous observations (currently limited to IR wavelengths)
become extremely important. However, the more physically based
MW remote sensing techniques provide enough accurate precipitation estimates to be used as training data in a calibration
process of an infrared satellite technique.
Most of infrared techniques provide precipitation estimates that
are technique-dependent and change as a function of the particular
region. Because of varying rain characteristics according to different
climate regimes, any developed infrared method must be evaluated
against appropriate in situ measurements taken over the region of
interest before any application is made. Attempts to this direction
have been made for Sardinia by Marrocu et al. (1993), for the
Korean peninsula by Oh et al. (2002) and for Eastern Africa by Menz
(1997).
The abovementioned articles, similar to the vast majority of
works that evaluate remotely sensed estimates,1 calculate global
measures of accuracy – like root mean square error – which are not
informative in a local scale. That is, such measures cannot uncover
the presence of spatial nonstationarity in the relationship of remotely sensed and ground truth data. However, a satellite technique might perform systematically better or worse in some
geographic regions. Knowledge of such spatial nonstationarities is
important for the optimal development of calibration algorithms.
This article aims to present statistical modelling tools for the
evaluation of satellite (or radar) rainfall estimates, which are
informative in a local scale. For that purpose, we evaluate a satellite
infrared technique for rainfall estimation, the Convective Stratiform
Technique (CST), over Mediterranean. The study uses data on 12-h
rainfall totals collected daily during the winter of 2004. Ground
truth data are obtained from a set of 350 rain gauges and the
corresponding remotely sensed estimates are derived from infrared
Meteosat-7 satellite data. The dataset and the satellite algorithm
are presented in detail in Sections 2 and 3, respectively.
A widely adopted probability distribution for rainfall totals, the
mixed (or zero inflated) lognormal distribution is fitted to both in
situ rainfall measurements and CST estimates. The spatial variability of the parameters that characterize inflation, location and
scale for this distribution and the spatial trends in observed and
estimated mean rainfall totals are of particular interest. Section 4
explores these issues using recent advances from nonlinear mixed
models.
To test for spatial homogeneity in the relationship between
ground truth and satellite-estimated data, we perform geographically weighted regression (GWR). The magnitude of the local
1
We cite, for instance, Feidas (2006), Feidas et al. (in press), Haiyan et al. (2006),
Pinkerton (2000), Pinkerton and Aiken (1999), von Clarmann (2006) and Yoo
(2002).
1439
intercepts and slopes derived from GWR, indicates the presence of
geographic regions where the algorithm performs better or worse.
The statistical significance of such differences in magnitude is examined via a Monte Carlo test in Section 5. As discussed in Section
6, the GWR models developed here can be also used for calibration
of the CST estimates if the relationship between in situ measurements and satellite estimates is constant over time.
2. Remotely sensed and rain gauge data
The dataset used in this study, comprises infrared data from
Meteosat-7 satellite and rain gauge observations collected during
a three-month period (October 1, 2004 to December 31, 2004). It is
part of the datasets examined in Feidas et al. (in press) conducted
a preliminary investigation and showed, using exploratory statistical methods and global measures of accuracy, that CST estimates
performed worst during the winter in the study region.
Meteosat-7 satellite images were available at half-hourly
intervals during the period of interest for the Mediterranean basin.
The infrared (IR) images cover the spectral area that ranges from
10.5 to 12.5 mm and the spatial resolution at the satellite subpoint is
5 � 5 km2 reaching 5.6 � 7 km2 at the eastern Mediterranean basin.
Images have been pre-processed in EUMESAT (European Organisation for the Exploitation of Meteorogical Satellites): radiances
were obtained from EUMESAT’s calibration data and converted to
brightness temperatures through a lookup table; next, the exact
brightness temperatures that correspond to the observed radiances
were obtained via linear interpolation.
Six-hourly precipitation totals recorded by a network of 350
weather stations (rain gauges) were employed as ground truth
data. The rain gauge data were provided by the European Centre
for Medium Weather Forecast (ECMWF). Fig. 1 depicts the
geographical distribution of the weather stations. Preliminary tests
indicated the presence of a few outlying observations that were
removed from the dataset.
To compare rainfall estimations from the satellite IR technique
with rain gauge measurements, satellite derived rainfall maps were
reprojected to the latitude–longitude coordinate system (WGS84)
of the weather station coordinates (Fig. 2). The method follows the
standard presented by EUMESAT (The Meteosat Archive – User
Handbook EUM TD 06 – Issue 2.5). Rain depth was calculated by the
precipitation algorithm for each pixel i of the image, and the
corresponding values were added for 12, 24 and 48 successive
satellite images corresponding to 6 h, 12 h and 24 h accumulated
precipitation, according to:
Si ¼
12
X
Dij
(1)
j¼1
where Si is the rain depth accumulated over each period (6 h, 12 h
and 24 h) and assigned to each pixel i, and Dij is the estimated rain
depth in the pixel i of the image j. Finally, 6 h, 12 h and 24 h accumulated precipitation (Gi) for each of the pluviometric stations
processed, were compared to the rainfall ðSi Þ retrieved from satellite data for the corresponding pixel location. For each station, the
total precipitation Si was calculated as the average value of 3 � 3
pixels, centred over each pixel corresponding to the station. That
was done to reduce the effect of the error arisen by the uncertainty
of �1 pixel in the co-location of the pluviometric stations on the
Meteosat images.
The full dataset of this study comprises cumulative 6-h rainfall
estimates measured at midnight, 06.00, 12.00 and 18.00 C.E.T., 12-h
cumulative rainfall estimates measured at 06.00 and 18.00 C.E.T.,
24-h cumulative rainfall estimates measured at 18.00 C.E.T and the
corresponding ground truth data from the rain gauges. For the
purpose of this article we display results from the analysis of
�1440
Y. Kamarianakis et al. / Environmental Modelling & Software 23 (2008) 1438–1447
Fig. 1. Geographical distribution of the rain gauges in the study area.
the cumulative 12-h rainfall totals measured at 18.00 C.E.T. from 1,
October to 31, December 2004. The results of Sections 4 and 5 are
very similar for the six remaining pairs of variables. The average
percentage of missing values per measurement location is 11.3% for
the rain gauge data and 14.9% for the remotely sensed rainfall
estimates. The histograms depicted at Fig. 3 indicate that during the
study period, remotely sensed 12-h rainfall estimates measured at
18.00 C.E.T. are larger on average than the observations from the
rain gauges. On the other hand, the values of standard deviation,
skewness and kurtosis indicate that CST estimates do not capture
some extreme rainfall events.
3. The calibrated CST algorithm
In its original form, the CST method was developed for the study
of convective precipitation systems in the tropical Atlantic and
mid- and low-latitude continental areas (Adler and Negri, 1988).
The technique locates, in an array of IR data, all local minima in the
brightness temperature field. In the original study, digital radar and
visible channel imagery was used to remove thin, non-raining cirrus from convective clouds and remaining brightness temperature
minima were assumed to be centers of convective rain. A stratiform
rain assignment, based on the mode temperature (the temperature
that occurs most frequently) of each cloud system, completes the
rain estimation.
Since IR techniques, such as CST, can only indirectly estimate
precipitation, the estimated values are technique-dependent.
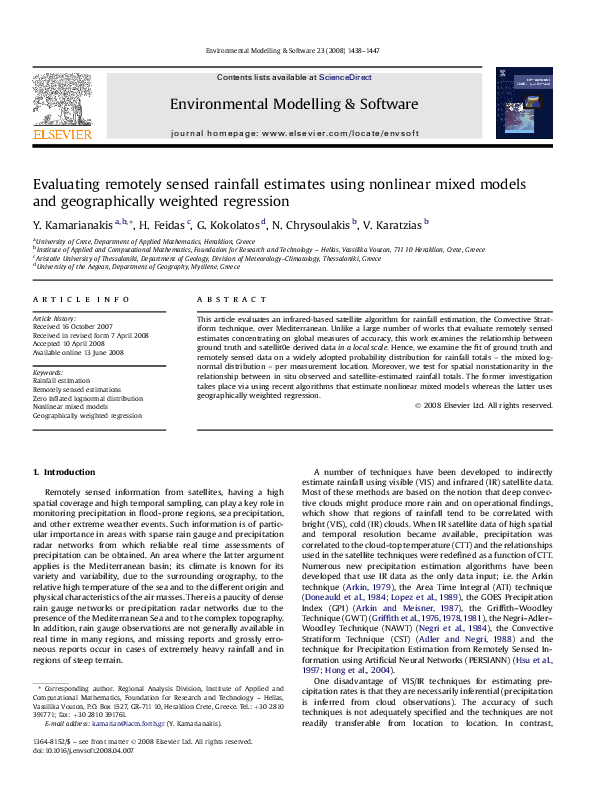
Fig. 2. Satellite derived rainfall estimations over the study area for 16 October 2004.
Bright tones indicate high rainfall amounts. The positions of the rain gauge stations
(red triangles) as well as the coastlines and country borders are overlaid. (For interpretation of the references to colour in this figure legend, the reader is referred to
the web version of this article.)
Moreover, since retrieval techniques change as a function of the
particular region, calibration of the CST parameters to the geoclimatic conditions of the study area is required before any application is made. In the present study, we used the version of the CST
that has been recalibrated over the Mediterranean basin by Feidas
et al. (2006) using coincident rainfall estimates from the TRMM PR
for the wet period of a year (October 2003–March 2004). The goal
of the recalibration was to determine parameters so that the CST
will be able to reproduce the total rain volume and the PR-observed
division between convective and stratiform rain for the Mediterranean region using infrared data from Meteosat-7 satellite. The
CST was adjusted on a statistical basis, over the 6-month calibration
period, without explicit constraints on instantaneous rain
estimates. In summary, the recalibrated technique, dubbed as CST/
Met7, finds local IR minima, decides if they are convective features
using a probability function, then assigns a rain area and rain rate
based on the PR calibration parameters. A stratiform rain area is
then defined, and a lower rain rate is assigned to those cloud pixels
colder than the stratiform IR threshold and not previously assigned
convective rain. As noted in the previous section, Feidas et al. (in
press) evaluated the CST/Met7 technique using global measures of
accuracy and observed that it achieves its worst performance
during the winter.
4. A zero inflated lognormal model with random effects
In Section 3, we displayed histograms of in situ rainfall
measurements and CST/Met7 estimates. If our study was examining a small number of measurement sites, we could compare the
corresponding histograms per location. However, given the large
number of rain gauges examined in this study (350), a different
approach is needed. In this section, we fit the most widely adopted
probability model for rainfall, to both gauge and remotely sensed
data per location, and examine the variability of the parameters
p; m; s (see below) that characterize it. Density plots approximate
histograms and here, instead of examining histograms, we examine
densities.
At this point we should emphasize that gauge data represent
rainfall totals aggregated over time at a single spatial location,
whereas the remotely sensed data are spatial averages over grid
squares of size 3 � 3 pixels or 225 km2. In situ and remotely sensed
data are of different spatial support and hence some of their features are not directly comparable. For the change of support
problem and statistical methods that account for it, the reader is
referred to Atkinson and Tate (2000), Gelfand et al. (2001), Gotway
�Y. Kamarianakis et al. / Environmental Modelling & Software 23 (2008) 1438–1447
1441
Fig. 3. Histograms of rain gauge estimated (top) and CST/Met7 retrieved (down) cumulative 12-h rainfall at 18.00 C.E.T. for the period of October 2004–December 2004.
and Young (2002), Kyriakidis (2004) and Kyriakidis and Yoo (2005).
Spatial averages have a lower probability of zero rain, and a lower
variance when it is raining, than rainfall at a point (see for instance,
Zhang et al., 1990). On the other hand, mean in situ versus remotely
sensed rainfall levels should be close if CST data are unbiased.
During the past 20 years a large number of studies aimed to
determine both the spatial and temporal distribution of rainfall.
Using data from the Global Atmospheric Research Program (GARP),
Kedem and Chiu (1987) have shown that rainfall fits closely a lognormal distribution both spatially and temporally. Comparisons
between the lognormal and gamma distributions performed by
Kedem et al. (1990) have shown the lognormal distribution to fit
the data better. However, the lognormal probability distribution is
only valid for nonzero rainfall values. Further studies applied to
rainfall data of different spatial supports, proposed a mixed model
consisting of a lognormal distribution combined with a spike at
zero (zero inflated lognormal distribution), see for instance Pavlopoulos and Kedem (1992), Berg and Chase (1992), Shimizu (1993),
Kedem et al. (1994, 1997), Shoji and Kitaura (2006) and De Michele
et al. (2008). In compliance with the abovementioned works, the
analysis displayed below assumes that cumulative rainfall amounts
per measurement location and the corresponding remotely sensed
estimates follow the zero inflated lognormal distribution. Distributional heterogeneity amongst measurement locations is
�1442
Y. Kamarianakis et al. / Environmental Modelling & Software 23 (2008) 1438–1447
Table 1
Maximum likelihood estimates for the location m, shape s, and inflation p parameters of the zero inflated lognormal distribution for the rain gauge data (R.G.) and the
remotely sensed estimates (R.S.)
R.G.
R.S.
m
s
p
�0.401 (�22.95)
�0.193 (�14.13)
1.578 (123.92)
1.6924 (150.49)
0.7473 (299.77)
0.611 (214.03)
Table 3
Maximum likelihood estimates for model 3 for the rain gauge data (R.G.) and the
remotely sensed estimates (R.S.)
R.G.
R.S.
m
bs
ss
p
�0.416 (�25)
�0.193 (�14.13)
1.553 (84.16)
1.6924 (150.48)
0.060 (7.35)
1.037E�7 (0.01)
0.7473 (299.77)
0.611 (214.03)
Note: t-statistics in parentheses.
Note: t-statistics in parentheses.
accommodated via allowing the parameters that characterize the
zero inflated lognormal distribution to vary locally.
Let X denote the cumulative 12 h rainfall observed daily at each
measurement location. X takes the value 0 (no rain) with positive
probability p (0 < p < 1); otherwise, conditional on positive rainfall,
X is lognormally distributed with distribution function Lðxjm; sÞ
where m and s denote the location and shape parameter,
respectively. The distribution function of X is therefore given by
PðX � xÞ ¼ GðxÞ ¼ pHðxÞ þ ð1 � pÞLðxjm; sÞ;
x�0
(2)
where H(x) stands for the step function, H(x) ¼ 0 for x < 0 and
H(x) ¼ 1 for x � 0. From Eq. (2) the mean rainfall amount for
a specific location s is given by
EðXÞ ¼ ð1 � pÞEðXjX > 0Þ
or
2
EðXÞ ¼ ð1 � pÞemþð1=2Þs
(3)
and the variance at a specific location is given by
�
2
2
varðXÞ ¼ ð1 � pÞe2mþs es � ð1 � pÞ
(4)
At the first stage of the analysis, we assume no spatial variation in
the parameters p; m; s that characterize the mixed distribution
function in Eq. (2). That is we assume a zero inflated lognormal
distribution with fixed parameters across measurement locations
(model 1). Maximum likelihood estimates for the inflation, location
and shape parameters for the rain gauge data and the remotely
sensed estimates are depicted in Table 1. One observes that the
estimate of m that is based on the remotely sensed data, deviates
significantly from the corresponding estimate that is based on the
ground truth data. The estimate of p from the remotely sensed data
is smaller than the one that corresponds to ground truth,
as expected beforehand given the difference in spatial supports.
The t-statistics indicate that all estimates are statistically significant
at the 0.01 level.
Based on the estimates in Table 1 and Eq. (3), one obtains that
the estimate for the mean of the zero inflated lognormal distribution that characterizes rain gauge data is equal to 0.589 whereas for
the remotely sensed data the corresponding estimate equals 1.342.
By applying the delta method (Cox, 1998) the 95% confidence
intervals for these estimates are (0.557, 0.622) and (1.278, 1.407),
respectively. The distance between the two confidence intervals
indicates that CST/Met7 estimates are biased and a calibration
procedure should be applied to the remotely sensed estimates, as
for example in Brown et al. (2001) and Clarke et al. (2006). From Eq.
(4), the estimate of the variance of the mixed distribution in Eq. (2)
is equal to 16.316 for the rain gauge data and 79.454 for the
Table 2
Maximum likelihood estimates for model 2 for the rain gauge data (R.G.) and the
remotely sensed estimates (R.S.)
R.G.
R.S.
bm
sm
s
p
�0.401 (�22.95)
�0.193 (�14.13)
1.175E�7 (0.01)
1.102E�7 (0.02)
1.580 (123.92)
1.6925 (150.48)
0.7473 (299.77)
0.611 (214.05)
Note: t-statistics in parentheses.
remotely sensed data; the 95% confidence intervals are (13.467,
19.165) and (66.683, 92.224), respectively.
The mean of the conditional distribution function for ground
truth data, given that it is raining, equals 2.326 and its variance
equals 59.837. For the remotely sensed data the corresponding
mean equals 3.134 and the variance is equal to 197.101. The fact that
the variance of CST/Met7 data is larger than the corresponding in
situ, given positive rainfall amounts, contradicts what one would
expect given the different spatial supports and further indicates
that CST/Met7 estimates are biased and should be recalibrated
before they are applied for predictive purposes during the winter.
To explore spatial heterogeneity, we allow m to vary between
measurement locations according to a Gaussian distribution
Nðbm ; s2m Þ (model 2). The conditional distribution given the random
effects, is still the zero inflated lognormal. This is essentially
a nonlinear mixed model in which both fixed ðs; pÞ, and random ðmÞ
parameters enter nonlinearly. We fit this model by numerically
maximizing an approximation to the marginal likelihood – that is
the likelihood integrated over the random effects. The integral
approximation is performed via the adaptive quadrature method as
documented in Pinheiro and Bates (1995). This approximation uses
the empirical Bayes estimates of the random effects (analogous to
empirical BLUPs in linear mixed models) as the central point for the
quadrature and updates them for every iteration. The resulting
marginal likelihood can be maximized using a variety of alternative
optimization techniques; here we adopted the dual quasi-Newton
algorithm. The estimation procedure was implemented in SAS, via
a modification of the code provided in Littell et al. (2006, Chapter
15) for a zero inflated Poisson distribution.
Table 2 presents the fixed and random parameter estimates for
model 2. We observe that the estimate for the mean of the Gaussian
distribution equals the corresponding (fixed) estimate at Table 1.
The approximate t-statistics for the variance of the random parameter m and the Akaike information criterion (AIC) in Table 6,
indicate that m does not vary significantly across measurement
locations, for both the rain gauge data and the remotely sensed
estimates.
Table 3 presents the maximum likelihood estimates of the
nonlinear mixed model in which s is distributed according to
a Gaussian distribution Nðbs ; s2s Þ across measurement locations and
ðm; pÞ are considered fixed (model 3). In this case both the
approximate t-statistics for the variance of s and the AIC indicate
significant variability of s over measurement locations for the rain
gauge data. However, this is not true for the remotely sensed data.
Thus, for the CST/Met7 estimates, we observe that the mean and
variance of positive rainfall totals do not vary significantly across
measurement locations. To put it otherwise, given that rainfall
occurred, the distributions of rainfall totals do not vary significantly
across measurement sites. This contrasts what one observes for the
Table 4
Maximum likelihood estimates for model 4 for the rain gauge data (R.G.) and the
remotely sensed estimates (R.S.)
R.G.
R.S.
m
s
bp
sp
�0.401 (�22.95)
�0.193 (�14.13)
1.578 (123.92)
1.6924 (150.49)
0.7423 (141)
0.611 (150.8)
0.008 (7.07)
0.003 (6.81)
Note: t-statistics in parentheses.
�1443
Y. Kamarianakis et al. / Environmental Modelling & Software 23 (2008) 1438–1447
Table 5
Maximum likelihood estimates for model 5 for the rain gauge data
R.G.
m
s
ss
bp
sp
r
�0.416
(�25.02)
1.539
(81.83)
0.065
(7.14)
0.7424
(141.28)
0.008
(7.13)
�0.3923
(�4.46)
Note: t-statistics in parentheses.
2
mi ¼ ð1 � pi Þemi þð1=2Þsi
(5)
denote the expected rainfall amount at measurement location i.
One may combine the estimates pi ; m; si obtained from model 5 for
the rain gauge data, with Eq. (3), to obtain the rain gauge estimate
for expected rainfall, mi , at location i. Similarly, (3) can be combined
~i ; m
~ obtained from model 4 for the remotely
~; s
with the estimates p
~ i , the CST/Met7 estimate for expected
sensed data, to produce m
rainfall at measurement location i. A simple way to exploit the
explanatory power of geographical coordinates is to formulate
a regression model that includes them as explanatory variables.
Thus, we formulate two linear regression models which aim to
capture linear spatial trends:
ˇ ˇ
ˇ
ˇ
Table 6
The Akaike information criterion for models 1–5 for the rain gauge and the remotely
sensed data
Model
Model
Model
Model
Model
1
2
3
4
5
AIC R.G.
AIC R.S.
72,769
72,771
72,646
72,408
72,272
108,730
108,732
108,732
108,623
Fig. 4. Scatterplot of the empirical Bayes estimates for the random effects that correspond to p (x-axis) and s (y-axis).
ˇ
rain gauge measurements, where given positive rainfall levels, the
mean and the variance differ significantly across measurement
locations.
Table 4 presents the maximum likelihood estimates of the
nonlinear mixed model in which the probability of no rain, p is
distributed across measurement locations according to a Gaussian
distribution Nðbp ; s2p Þ and ðm; sÞ are considered fixed (model 4). In
this case both the approximate t-statistics for the variance of p and
the AIC indicate significant variability of p over measurement
locations for both the rain gauge data and the remotely sensed
estimates. The magnitude of the variability is much smaller in the
remotely sensed measurements as expected from the difference in
spatial supports.
Tables 1–4 and Table 6 indicate that model 4 is adequate for the
remotely sensed data. To capture the significant variability of both s
and p for rain gauge data, we fit a model in which only m is considered
fixed across measurement locations and s, p are distributed
according to a two-dimensional Gaussian distribution with correlation r (model 5, Table 5). The values of the AIC depicted in Table 6,
reveal that this model improves significantly over the previous
models 3 and 4. s and p appear to be negatively correlated which
agrees with intuition: locations with higher probability of no rainfall
tend to have lower mean rainfall levels which vary less (Fig. 4).
At the final stage of this analysis, we examine how in situ and
CST/Met7 estimated rainfall totals vary per measurement location
as a function of geographical coordinates. For that purpose, we use
the expansion method (Casetti, 1972, 1997; Jones and Casetti, 1992),
which allows the parameter estimates to vary locally by making the
parameters functions of other attributes. Since in our study the
parameters are functions of location, a spatial expansion model
results, in which trends in parameter estimates over space can be
measured (Fotheringham and Pitts, 1995).
Let pi ; mi ; si denote the true parameters of the mixed distribution
function (2) per measurement location i. Let also
mi ¼ a0 þ a1 � lon þ a2 � lat þ 31i
(6)
~ i ¼ b0 þ b1 � lon þ b2 � lat þ 32i
m
(7)
where lon and lat stand, respectively, for longitude and latitude in
degrees, divided by 1000 so that the estimates of the parameters
a0 ; a1 ; a2 ; b0 ; b1 ; b2 are in an easily interpretable scale and
31i wNð0; s21 Þ, 32i wNð0; s22 Þ are random errors that are normally
distributed.
Table 7 presents least squares estimates and model fit statistics
for (6) and (7). The goodness of fit statistic (R2) indicates that 52.5%
of the variability of remotely sensed estimates of mean rainfall
levels, is explained by the simple linear model (7). On the other
hand, only 10.7% of the variability of rain gauge-derived mean
rainfall estimates is explained by model (6). The above suggest that
CST/Met7 estimates display less spatial variation than rain gauge
data as expected due to the difference in spatial supports.
The remotely sensed estimates should capture the spatial trends
followed by the ground truth data. Since the p-value for the t-statistic of a2 is greater than 0.05, one may observe that, in contrast
with CST/Met7 estimates, rain gauge data do not display any
significant linear dependency to the north–south direction. On the
other hand, the magnitude of b2 suggests that satellite-estimated
mean rainfall levels increase fast as the latitude increases. Both
estimates for rainfall means decrease as the longitude increases and
this is in accordance with intuition. Finally, apart from the difference in slopes, one may observe a significant difference with regard
to the intercepts: the intercept term b0 is not significant at the 0.01
level of significance for the satellite-estimated means whereas a0 is
significant for the model of the rain gauge data with a p-value
which is less than 0.0001.
Table 7
Least squares estimates for models (6) and (7) for the rain gauge data (R.G.) and the
remotely sensed estimates (R.S.)
a0
a1
a2
R2
R.G.
0.836
(43.88)
�13.127
(�63.51)
�0.430
(�1.02)
0.107
b0
b1
b2
R2
R.S.
�0.023
(�2.34)
�8.352
(�79.09)
35.551
(164.51)
0.5246
Note: t-statistics in parentheses.
�1444
Y. Kamarianakis et al. / Environmental Modelling & Software 23 (2008) 1438–1447
Table 8
Global regression estimates
Table 10
ANOVA table for GWR fit
Parameter
Estimate
Std Error
t-value
Source
SS
DF
MS
F
Intercept
Slope
0.517
0.329
0.035
0.018
14.906
17.817
OLS residuals
GWR improvement
GWR residuals
10,595.1
1045.7
9549.4
2
88.16
4526.84
11.861
2.110
5.623
Note: residual sum of squares, 10,595; s, 1.515; AIC, 16,943.58; R2, 0.064.
5. Testing spatial nonstationarity via geographically
weighted regression
Ideally, remotely sensed estimates would have been unbiased.
To put it otherwise, the relationship between rain gauge measurements and satellite rainfall estimates at each measurement
location would have been expressed by regression lines with
intercepts that are close to 0, slopes that are close to 1 and small
variances for the error terms. Feidas et al. (in press) performed
a regression (on the pooled data) between CST/Met7 estimates and
rain gauge observations using the dataset of this study. Their
findings suggest that the above statement is far from being true as
the estimated intercept was positive and statistically significant
and the estimated slope was significantly less than 1.
Ideally, the spatial variation of the coefficients of the regression
lines per measurement site should have been negligible: there
would have been no regions (comprised by neighboring measurement locations) where the CST/Met7 algorithm performs exceptionally better or worse than others. In this section, we examine
this hypothesis by fitting a regression model and testing the null
hypothesis that the linear relationship it implies, is fixed over
space. In other words we test for the presence of spatial nonstationarity in the relationship between ground truth data and
remotely sensed estimates; this examination is expected to reveal
geographic regions where the remotely sensed data perform better.
The statistical tool used for that purpose is Geographically
Weighted Regression (GWR).
The GWR model is generally formulated as
yi ¼ aðui ; vi Þ þ
X
xij bj ðui ; vi Þ þ 3i
(8)
j
where ðui ; vi Þ is the location in geographical space of the ith observation and subscript j refers to different explanatory variables;
for instance for a model that includes an intercept and one
explanatory variable as is the case below, j ¼ 1. The setting is similar
to the ordinary regression model (e.g. 3i is normally distributed
with zero mean), the single difference being that the GWR model
allows for different regression coefficients aðui ; vi Þ; bj ðui ; vi Þ per
measurement location. In fact, aðui ; vi Þ; bj ðui ; vi Þ are considered as
realizations of the continuous functions aðu; vÞ; bj ðu; vÞ at point i.
The method proposed to calibrate Eq. (8) is basically a moving
kernel window approach (Fotheringham et al., 2002); to estimate
að:; :Þ; bj ð:; :Þ at the location of the ith observation, one carries out
a weighted regression where each observation is given a weight
wki , if the observations are indexed by the variable k. wki should be
a monotone decreasing function of the distance between observations i and k so that observations farther from the point at which
the model is calibrated weight less than observations closer to that
point. Thus, implicitly one assumes that observed data near to
location i have more of an influence in the estimation of the
að:; :Þ; bj ð:; :Þ than do data located farther from i. For an extensive
Table 9
GWR parameter five-number summary
Parameter
Minimum
Lwr quartile
Median
Upr quartile
Maximum
Intercept
Slope
�0.556
�0.1
0.143
0.271
0.452
0.379
0.789
0.467
1.322
0.784
Note: residual sum of squares, 9549; s, 1.452; AIC, 16,643.84; R2, 0.157.
presentation of the GWR model the reader is referred to Fotheringham et al. (2002).
In this study, GWR was applied to approximately 12% of the
initial dataset that corresponds to nonzero rainfall observations
estimated by nonzero remotely sensed measurements. Similar to
Brown et al. (2001), in modelling these data, we make the fundamental assumption that the relationship between gauge and
remotely sensed measurements can be described by a power law:
bðui ;vi Þ
Gi;t ¼ aðui ; vi ÞRi;t
ei;t
(9)
where Gi,t is the gauge measurement at measurement location
ðui ; vi Þ and time t, Ri,t is the corresponding CST/Met7 estimate, ei,t is
a multiplicative error term and aðui ; vi Þ; bðui ; vi Þ are location specific coefficients that need to be estimated. It is straightforward to
observe that after taking logarithms in Eq. (9) one obtains a linear
relationship2 and the setting is the same as in Eq. (8).
Moreover the probabilistic setting complies with the one
adopted in the previous section, with a special treatment of zero
values since taking logarithms in Eq. (9) precludes the inclusion of
zero values for either the CST/Met7 or the gauge measurements.
A preliminary data investigation revealed that remotely sensed
estimates give a very reliable indication that rain is not currently
falling, i.e. Ri,t ¼ 0 implies that Gi,t ¼ 0 with high probability (approximately 0.8). It is intuitively clear from the untransformed
power law model (9) that these zero values convey no information
about the coefficients aðui ; vi Þ; bðui ; vi Þ and can therefore be
treated as missing for inference about aðui ; vi Þ and bðui ; vi Þ. Our
setting is different to the one presented in Brown et al. (2001) in
two aspects: first, aðui ; vi Þ and bðui ; vi Þ are not functions of time in
our case; second, neighboring relationships between measurement
locations are taken into account in a way that does not depend on
a definition of a specific space–time covariance structure.
The GWR model was calibrated via using an adaptive bi-square
kernel. In particular, the weight of the jth data point at regression
point i is given by:
�
�2
wij ¼ 1 � dij b
wij ¼ 0
when dij � b
when dij > b
dij represents the distance between the jth and the ith data points
and b is the bandwidth. One may think of the bandwidth as
a smoothing parameter, with larger bandwidths causing greater
smoothing. The effects of alternative choices for the functional form
of the kernel diminish with sample size, see Fotheringham et al.
(2002). Two techniques were applied for optimal bandwidth selection: AIC minimisation and cross-validation. Estimation results
were practically identical for the two cases.
Table 8 depicts the fit of a simple regression model with constant coefficients across measurement locations. The coefficient of
determination (R2) indicates that the model fits very poorly; given
the amount of data, the model is statistically significant but it
2
Preliminary tests applied to data obtained at different locations, indicated that
the null hypothesis of a linear relationship between the logarithms of ground truth
data and CST/Met7 estimates could not be rejected.
�Y. Kamarianakis et al. / Environmental Modelling & Software 23 (2008) 1438–1447
1445
Fig. 5. Voronoi map of the local intercepts of the GWR model.
Fig. 6. Voronoi map of the local slopes of the GWR model.
explains less than 10% of the variability of rain gauge measurements. In Table 9, we present summary statistics for the GWR estimates; from this table one may get a ‘feel’ for the degree of spatial
nonstationarity in the relationship, by comparing the range of local
parameter estimates with a confidence interval around the global
estimate of the equivalent parameter. The reduction in the AIC from
the global model suggests that the local model is better even
accounting for differences in degrees of freedom. Table 10 presents
the ANOVA table that tests the null hypothesis that the GWR model
represents no improvement over a global model. As expected from
the reduction in the AIC, the F test rejects the null hypothesis and
suggests that the GWR model is a significant improvement on the
global model.
The significance of the spatial variability of the local parameter
estimates was examined more formally via a Monte Carlo test3 (see
Brunsdon et al., 1998, 1999a,b). The test indicated significant spatial
variation for both the intercept and the slope as both p-values were
less than 0.0001. This result suggests the presence of spatial
nonstationarity in the relationship between satellite estimates and
ground truth data. Apparently, the algorithm performs better in
3
All estimations and tests were performed with the GWR 3 software.
some geographical regions and given the statistical significance of
the test, it is unlikely that these differences emerged in the study
region by chance.
Figs. 5 and 6 depict Voronoi maps4 of the local estimates for the
intercepts and slopes, respectively. One may observe large values
for the intercepts and close to zero values for the slopes indicating
a bad performance of the satellite technique, mostly in southern
regions of the study area. On the other hand it appears that satellite
estimates perform satisfactory in some regions (sets of neighboring
locations) located in northern regions of the study area. The Monte
Carlo test for spatial nonstationarity indicated that these spatial
clusters displaying good performance were unlikely to emerge by
chance. Finally, Fig. 7 indicates that in most of the southern and
eastern part of the study area, the CST/Met7 estimates failed to
capture the variability of ground truth data. This may happen due
to a variety of reasons that need to be examined before a recalibrating procedure model is applied.
4
The Voronoi diagram of a collection of geometric objects is a partition of space
into cells, each of which consists of the points closer to one particular object than to
any others.
�1446
Y. Kamarianakis et al. / Environmental Modelling & Software 23 (2008) 1438–1447
Fig. 7. Voronoi map of the approximate t-statistics for the local slopes of the GWR model.
6. Concluding remarks
The wide range of applications of remote sensing techniques
resulted in a large number of studies that aimed at their validation
against in situ data. The vast majority of such works presented
simple exploratory graphs, correlation coefficients and global
measures of accuracy like mean square error and mean absolute
error. Such tools are not informative in a local scale though; that is
they cannot reveal geographic regions where a satellite algorithm
performs significantly better or worse.
This work validated an infrared-based satellite algorithm for
rainfall estimation, the Convective Stratiform Technique, focusing
on the spatial variability of the parameters of the probability
distribution that characterizes satellite estimates and ground truth
data. For that purpose, nonlinear mixed models have been developed, based on a widely adopted probability model for rainfall
totals: the mixed (or zero inflated) lognormal distribution. Such
models – which, to our knowledge, appear for the first time in the
literature – can be used as exploratory tools for validating satellite
or radar based techniques when the number of in situ locations is
large and thus it is practically impossible to conduct exploratory
statistical analysis and validation per measurement location.
A previous article (Feidas et al., in press) used global measures of
accuracy, which suggested that during the study period examined
here, the CST did not display a satisfactory predictive performance
in the study region. The analysis presented in Section 4 extended
previous work and indicated that, in contrast to ground truth data,
the distributions of positive rainfall amounts for remotely sensed
estimates do not vary significantly in space. This is in contrast with
intuition and combined with the bias that satellite estimates display and the different spatial trends for ground truth and satellite
estimates, suggest that the technique needs to be recalibrated
before it is applied for predictive purposes.
But how should this calibration procedure be performed?
Should it focus in specific regions or should a single model be
applied to the whole study region? The above research questions
suggest that a test of the null hypothesis of spatial stationarity in
the relationship between ground truth data and remotely sensed
estimates should be applied. For that purpose, we performed a test
on the local intercepts and slopes of a geographically weighted
regression model. Results indicated the existence of three regions
in the northern part of the study region that the satellite algorithm
performed significantly better than the rest of the study region.
The GWR model presented here, can be used for calibration if
the relationship between rain gauge data and satellite estimates is
constant over time. Otherwise, similar to Brown et al. (2001),
instead of as, bs in Eq. (9) one should estimate temporally varying
coefficients ast, bst per measurement location. Such a space–time
model has an advantage compared to the one presented in Brown
et al. (2001) as it does not involve any assumptions with regard to
the functional form of the space-time covariance function of the
data. Unfortunately, given the relatively small temporal dimension
of our dataset, we were unable to test if the local intercepts and
slopes in (9) are functions of time. This, and the development of
the associated space–time models will hopefully be presented in
a future publication.
Acknowledgements
This work was conducted in the frame of the SATERM (A Satellite Technique for Estimating Rainfall over the Mediterranean
basin) project funded by the ‘‘Competitiveness’’, Action 4.3.6.1d
‘‘Cooperation with R&T institutions in non-European countries’’ of
the General Secretary of Research and Technology, Ministry of
Development of Greece.
References
Adler, R.F., Negri, A.J., 1988. A satellite infrared technique to estimate tropical
convective and stratiform rainfall. Journal of Applied Meteorology 27, 30–51.
Arkin, P.A., 1979. The relationship between fractional coverage of high clouds and
rainfall accumulation during GATE over B-scale array. Monthly Weather Review
107, 1382–1387.
Arkin, P.A., Meisner, B.N., 1987. The relationship between large-scale convective
rainfall and cold cloud over the Western Hemisphere during 1982–1984.
Monthly Weather Review 115, 51–74.
Atkinson, P.M., Tate, N.J., 2000. Spatial scale problems and geostatistical solutions:
a review. Professional Geographer 52, 607–623.
Berg, W., Chase, R., 1992. Determination of mean rainfall from the special sensor
Microwave/Imager (SSM/I) using a mixed lognormal distribution. Journal of
Atmospheric and Oceanic Technology 9, 129–141.
Brown, P.E., Diggle, P.J., Lord, M.E., Young, P.C., 2001. Space–time calibration of radar
rainfall data. Journal of the Royal Statistical Society Series C: Applied Statistics
50, 221–241.
Brunsdon, C., Fotheringham, A.S., Charlton, M., 1998. Geographically weighted
regression-modelling spatial nonstationarity. The Statistician 47, 431–443.
Brunsdon, C., Fotheringham, A.S., Charlton, M., 1999a. Some notes on parametric
significance tests for geographically weighted regression. Journal of Regional
Science 39, 497–524.
Brunsdon, C., Aitkin, M., Fotheringham, A.S., Charlton, M., 1999b. A comparison of
random coefficient modelling and geographically weighted regression for
spatially nonstationary regression problems. Geographical and Environmental
Modelling 3, 47–62.
Casetti, E., 1972. Generating models by the expansion method: applications to
geographic research. Geographical Analysis 4, 81–91.
Casetti, E., 1997. The expansion method, mathematical modeling, and spatial
econometrics. International Regional Science Review 20, 9–32.
Clarke, E.D., Speirs, D.C., Heath, M.R., Wood, S.N., Gurney, W.S.C., Holmes, S.J., 2006.
Calibrating remotely sensed chlorophyll-a data by using penaized regression
�Y. Kamarianakis et al. / Environmental Modelling & Software 23 (2008) 1438–1447
splines. Journal of the Royal Statistical Society Series C: Applied Statistics 55,
331–353.
Cox, C., 1998. Delta Method. In: Armitage, P., Colton, T. (Eds.), Encyclopedia of
Biostatistics. John Wiley, New York, pp. 1125–1127.
De Michele, C., Vezzoli, R., Pavlopoulos, H., Scholes, R.J., 2008. A minimal model of
soil water–vegetation interactions forced by stochastic rainfall in water-limited
ecosystems. Ecological Modelling 212, 397–407.
Doneauld, A.A., Ionesku-Niscov, S., Priegnitz, D.L., Smith, P.L., 1984. The area time
integral as an indicator for convective rain volume. Journal of Climate and
Applied Meteorology 23, 555–561.
Feidas, H., 2006. Validating three infrared-based rainfall retrieval algorithms for
intense convective activity over Greece. International Journal of Remote Sensing
27, 2787–2812.
Feidas, H., Kokolatos, G., Negri, A., Manyin, M., Chrysoulakis, N., 2006. A TRMMcalibrated infrared technique for rainfall estimation: application on rain events
over eastern Mediterranean. Advances in Geosciences 7, 181–188.
Feidas, H., Kokolatos, G., Negri, A., Manyin, M., Chrysoulakis, N., Kamarianakis, Y., A
validation of an infrared-based satellite algorithm to estimate accumulated
rainfall over the Mediterranean basin. Theoretical and Applied Climatology,
in press, doi: 10.1007/s00704-007-0360-y.
Fotheringham, A.S., Brunsdon, C., Charlton, M., 2002. Geographically Weighted
Regression: The Analysis of Spatially Varying Relationships. Wiley.
Fotheringham, A.S., Pitts, T.C., 1995. Directional variation in distance-decay.
Environment and Planning A 27, 715–729.
Gelfand, A.E., Zhu, L., Carlin, B.P., 2001. On the change of support problem for spatiotemporal data. Biostatistics 2, 31–45.
Gotway, C.A., Young, L.J., 2002. Combining incompatible spatial data. Journal of the
American Statistical Association 97, 632–648.
Griffith, C.G., Woodley, W.L., Browner, S., Teijeiro, J., Maier, M., Martin, D.W., Stout, J., Sikdar,
D.N.,1976. Rainfall estimation from geosynchronous satellite imagery during daylight
hours. NOAA Technical Report ERC 356-WMPO 7, Washington, D.C., USA.
Griffith, C.G., Grube, P.G., Martin, D.W., Stout, J., Sikdar, D.N., 1978. Rainfall estimation from geosynchronous satellite imagery, visible and infrared studies.
Monthly Weather Review 106, 1153–1171.
Griffith, C.G., Augustine, J.A., Woodley, W.L., 1981. Satellite rain estimation in the U.S.
High Plains. Journal of Applied Meteorology 20, 53–66.
Haiyan, J., Black, P.J., Ziptser, E.J., Marks, F.D., Uhlhorn, E.W., 2006. Validation of rain
rate estimation in hurricanes from the stepped frequency microwave radiometer: algorithm correction and error analysis. Journal of the Atmospheric
Sciences 63, 252–267.
Hong, Y., Hsu, K., Sorooshian, S., Gao, X., 2004. Precipitation estimation from
remotely sensed imagery using an artificial neural network cloud classification
system. Journal of Applied Meteorology 43, 1834–1852.
Hsu, K., Gao, X., Sorooshian, S., Gupta, H.V., 1997. Precipitation estimation from
remotely sensed imagery using an artificial neural network. Journal of Applied
Meteorology 36, 1176–1190.
Jones III, J.P., Casetti, E., 1992. Applications of the expansion method. Routledge, London.
Kedem, B., Chiu, L.S., 1987. On the lognormality of rain rate. Proceedings of the
National Academy of Sciences USA 84, 901–905.
1447
Kedem, B., Chiu, L.S., North, G.R., 1990. Estimation of mean rain rate: application to
satellite observations. Journal of Geophysical Research 95, 1965–1972.
Kedem, B., Pavlopoulos, H., Guan, X., Short, D., 1994. A probability distribution
model for rain rate. Journal of Applied Meteorology 33, 1486–1493.
Kedem, B., Pfeiffer, R., Short, D.A., 1997. Variability of space–time mean rain rate.
Journal of Applied Meteorology 36, 443–451.
Kyriakidis, P.C., 2004. A geostatistical framework for area-to-point spatial
interpolation. Geographical Analysis 36, 259–289.
Kyriakidis, P.C., Yoo, E., 2005. Geostatistical prediction and simulation of point
values from areal data. Geographical Analysis 37, 124–151.
Littell, R.C., Milliken, G.A., Stroup, W.W., Wolfinger, R.D., Schabenberger, O., 2006.
SAS for Mixed Models, second ed. SAS Institute Inc.
Lopez, R.E., Atlas, D., Rosenfeld, D., Thomas, J.L., Blanchard, D.O., Holle, R.L., 1989.
Estimation of rainfall using the radar echo area time integral. Journal of Applied
Meteorology 28, 1162–1175.
Marrocu, M., Pompei, A., Dalu, G., Liberti, G.L., Negri, A., 1993. Precipitation estimation over Sardinia from satellite infrared data. International Journal of
Remote Sensing 14, 115–134.
Menz, G., 1997. Regionalization of precipitation models in east Africa using
Meteosat data. International Journal Climatology 17, 1011–1027.
Negri, A.J., Adler, R.F., Wetzel, P.J., 1984. Satellite rain estimation: an analysis of the
Griffith–Woodley technique. Journal of Climate and Applied Meteorology 23,
102–116.
Oh, H.J., Sohn, B.J., Smith, E.A., Turk, F.J., Ae-suk, S., Chung, H.S., 2002. Validating
infrared-based rainfall retrieval algorithms with 1-minute spatially dense
raingauge measurements over Korean peninsula. Meteorology and Atmospheric
Physics 81, 273–287.
Pavlopoulos, H., Kedem, B., 1992. Stochastic modelling of rain rate processes:
a diffusion model. Stochastic Models 8, 397–420.
Pinheiro, J.C., Bates, D.M., 1995. Approximations to the log-likelihood function in
the nonlinear mixed-effects model. Journal of Computational and Graphical
Statistics 4, 12–35.
Pinkerton, M.H., 2000. Validating remotely sensed ocean colour data using
a moored databuoy. University of Southampton, Faculty of Science, School of
Ocean and Earth Science, Ph.D. Thesis, 187 pp.
Pinkerton, M.H., Aiken, J., 1999. Calibration and validation of remotely sensed
observations of ocean color from a Moored data buoy. Journal of Atmospheric
and Oceanic Technology 16, 915–923.
Shimizu, K., 1993. A bivariate lognormal distribution with an analysis of rainfall
data. Journal of Applied Meteorology 32, 161–171.
Shoji, T., Kitaura, H., 2006. Statistical and geostatistical analysis of rainfall in central
Japan. Computer and Geosciences 32, 1007–1024.
von Clarmann, T., 2006. Validation of remotely sensed profiles of atmospheric state
variables: strategies and terminology. Atmospheric Chemistry and Physics 6,
4311–4320.
Yoo, C., 2002. A ground validation problem of remotely sensed soil moisture data.
Stochastic Environmental Research and Risk Assessment 16, 175–187.
Zhang, R., Warrick, A.W., Myers, D.E., 1990. Variance as a function of sample support
size. Mathematical Geology 22, 107–122.
�
 Haralambos Feidas